Article

Bluegill Population Demographics as Related to Abiotic and Biotic Factors in Florida Lakes

1
U.S. Geological Survey, Florida Cooperative Fish and Wildlife Research Unit, Department of Wildlife Ecology and Conservation, School of Forest, Fisheries, and Geomatics Sciences, University of Florida, 2295 Mowry Road, Gainesville, FL 32611, USA
2
Florida LAKEWATCH Program, School of Forest, Fisheries, and Geomatics Sciences, University of Florida, 7922 NW 71 St., Gainesville, FL 32653, USA
*
Author to whom correspondence should be addressed.
Fishes 2023, 8(2), 100; https://doi.org/10.3390/fishes8020100
Submission received: 29 December 2022 / Revised: 2 February 2023 / Accepted: 3 February 2023 / Published: 7 February 2023
(This article belongs to the Section Biology and Ecology)

Abstract

:
Research on Bluegills, Lepomis macrochirus R., is abundant but typically focuses on water bodies with similar environmental conditions. We assessed Bluegill density, relative abundance (catch per unit effort [CPUE] by electrofishing), growth, and size structure in 60 lakes with wide-ranging surface areas (2–12,412 ha), trophic states (oligotrophic–hypereutrophic), and macrophyte abundances (0.3–100 percent of lake volume inhabited [PVI]) across Florida, USA. Bluegill density and CPUE increased with lake productivity and decreased with macrophyte abundance. Bluegill growth increased with lake productivity and CPUE of stock-length Florida Bass, Micropterus floridanus L., a Bluegill predator. Bluegill size structure increased with lake productivity and decreased with Bluegill density. Results indicate that Bluegill fisheries with abundant individuals of quality size (≥150 mm) require productive (>25 μg/L chlorophyll-a concentration) lakes with moderate to high macrophyte coverage (PVI 50–100), abundant stock-length Florida Bass (>40 fish/h of electrofishing), and Bluegill densities <300 fish/ha. This study provides an approach to predict Bluegill population demographics based on abiotic and biotic factors, establish fisheries management expectations, and develop regional and lake-specific management tools.

1. Introduction

Sunfishes Lepomis spp., crappies Pomoxis spp., rock basses Ambloplites spp., and Yellow Perch Perca flavescens M. support some of the most popular, socioeconomically valuable, and nutritionally and culturally important fisheries in the USA [1,2]. Known collectively as panfish, these fishes are particularly abundant, speciose, and fast-growing in the southeastern USA due to a warm climate and long growing seasons [3,4,5]. These environmental conditions, along with a large human population, promote considerable panfish angling effort in lakes, rivers, and impoundments of the southeastern USA [6,7,8,9].
Much of the panfish literature focuses on Bluegill Lepomis macrochirus R., a species that is native to the St. Lawrence/Great Lakes region, drainages along the Mississippi and Rio Grande rivers and the southern Atlantic Coast, and portions of Canada and northern Mexico, and introduced in parts of South America, Europe, Africa, and Asia [10]. Bluegills are popular sport fish in the USA [11,12] due to their abundance, appealing taste and nutritional contributions, relative ease of capture, and value in introducing anglers to recreational fishing [13]. Historically, Bluegill management in the USA was characterized by liberal or nonexistent harvest regulations, reflecting the belief that angling rarely induces overexploitation of Bluegills [14]. Evidence to the contrary has grown in recent decades [15,16,17], making it important to understand the abiotic and biotic factors that influence Bluegill density, relative abundance, growth, and size structure—both within water bodies and across watersheds and regions—to develop informed approaches for preventing overharvest and managing this prized species.
Bluegill population demographics (e.g., density, relative abundance, growth, size structure) are related to numerous abiotic and biotic factors across the range of this species, including lake depth, alkalinity, water clarity, water temperature, watershed area, macrophyte coverage, food availability, intraspecific and interspecific competition, and predation [18,19,20,21,22,23,24]. For instance, Bluegill density increased with chlorophyll-a concentration in lakes and impoundments of Illinois, Iowa, and Missouri, USA [25,26,27]. Bluegill growth and size structure were inversely related to density and relative abundance due to intraspecific competition in lakes in Indiana and Michigan, USA [28,29]. However, some water bodies can sustain populations of abundant, fast-growing Bluegills, particularly when food resources are plentiful and fishing mortality is limited [30,31]. A common theme from Bluegill literature is the prevalence of variability in the abiotic and biotic factors that influence Bluegill population demographics, both within and among water bodies [32,33,34].
Despite decades of Bluegill research within individual water bodies and across watersheds and regions in the USA, few studies have evaluated the identity, relative importance, and potential interactions of abiotic and biotic factors regulating Bluegill populations across lakes with wide-ranging morphometry, trophic state, and aquatic macrophyte abundance. We are unaware of any such studies in either the southeastern USA, as a region, or in Florida, a state with 7700 lakes, 12,000 miles of rivers, four million anglers, and a multibillion-dollar angling industry [9,35,36]. Due to the popularity of Bluegill angling in Florida [6,7], the absence of information in the literature on how Bluegill density, relative abundance, growth, and size structure vary among morphometrically and ecologically diverse lakes across the state represents a major knowledge gap and an impediment to regionally informed management strategies. Filling this knowledge gap would provide information to establish Bluegill management expectations, develop Bluegill management tools at regional and lake-specific scales, and predict how Bluegill populations may respond to climate change, land-use alteration, eutrophication, watershed alterations, habitat restoration projects, and other environmental changes. Moreover, investigating drivers of Bluegill population dynamics in diverse lakes using an adaptable, computationally powerful method such as generalized additive modeling would promote development of a broad approach for predicting population demographics of target species based on abiotic and biotic factors, a methodology that could be applied to study, manage, and conserve other aquatic and terrestrial organisms.
Bluegill population demographics are influenced by various factors (e.g., feeding, predation pressure, competition, reproductive behavior) that are important to consider in a large-scale study of Bluegill populations across Florida. Bluegills in Florida feed on macroinvertebrates such as chironomids, caddisflies, mayflies, odonates, hemipterans, snails, amphipods, and freshwater shrimp [37]. Florida Bass Micropterus floridanus L. is the top carnivore and Bluegill predator in Florida’s freshwater systems [3,38], which have relatively simple fish and predator-fish communities compared to the northern USA, where Walleye Sander vitreus M., Muskellunge Esox masquinongy M., and Northern Pike E. lucius L. are additional Bluegill predators [12,31]. Other predator fish in Florida such as Warmouth L. gulosus C. and Bowfin Amia calva L. consume Bluegills but are usually secondary Bluegill predators compared to Florida Bass [5,38]. Competition between Bluegill and other species in Florida is generally less studied than in the northern USA, where Bluegills compete with species such as Pumpkinseeds Lepomis gibbosus L. and Green Sunfish L. cyanellus R. for food resources [39]. However, sunfish communities are species-rich in Florida, comprising Warmouth, Redear Sunfish Lepomis microlophus G., Spotted Sunfish L. punctatus V., Redbreast Sunfish L. auritus L., and other species that may compete with Bluegills for food or space in certain situations. Florida has a sub-tropical climate and mild winters, with Bluegill initiating reproduction as early as February in south Florida and several weeks to months later in central and north Florida, when water temperatures approach 21 °C (70 °F) [40]. Bluegill spawning is prolonged and can occur during most months of the year in Florida, involving community nesting with conspecifics and congeners such as Redear Sunfish [40].
The purpose of this study was to evaluate how Bluegill density, relative abundance, growth, and size structure are related to abiotic and biotic factors in lakes with wide-ranging surface areas, trophic states, and macrophyte abundances to inform Bluegill management in Florida, and potentially across the species’ native and introduced range. Our first objective was to assess how Bluegill density and relative abundance are influenced by lake surface area, trophic indicators (e.g., zooplankton density, chlorophyll-a concentration), macrophyte abundance, and relative abundance and size structure of a Bluegill predator, Florida Bass. Our second objective was to investigate how these abiotic and biotic variables, along with Bluegill density, affect Bluegill growth and size structure in Florida lakes. Bluegill population demographics and associated management approaches are expected to vary greatly across Florida due to the diversity in lake size (<1 ha to >180,000 ha), trophic state (oligotrophic to hypereutrophic), and macrophyte coverage (0–100%) [36].

2. Materials and Methods

2.1. Study Area

Effects of abiotic and biotic factors on Bluegill density, relative abundance, growth, and size structure were evaluated in 60 lakes in central and northern Florida, USA (Figure 1) [38]. Lakes were selected to represent the wide range of lentic habitats available in Florida relative to surface area, trophic state (oligotrophic, mesotrophic, eutrophic, hypereutrophic), and macrophyte abundance (0.3–100 percent of lake volume inhabited [PVI]) [41]. Within these categories, lakes were randomly selected and sampled once in summer or fall (May–November) to measure trophic indicators, macrophyte coverage, and Bluegill population demographics [38]. Data were obtained from the second author and his previous research in [38,41]. Population distribution and community composition of fishes and aquatic plants, along with abiotic and biotic conditions, have remained consistent in the 60 study lakes over time (see [36,38] and statistical analysis below).

2.2. Data Collection

Zooplankton density was measured to represent trophic conditions in the 60 lakes. Wisconsin nets (12-cm mouth diameter, 80-μm mesh) were used to collect zooplankton using vertical tows through the water column (surface to 0.5 m above bottom) at six stations per lake. In a laboratory, zooplankton samples were transferred to 50-mL volumetric flasks, and 5-mL subsamples were examined using a 40×-magnification dissecting microscope. Zooplankton were counted (sum of cladocerans, copepods, nauplii, and rotifers), and counts were expanded to the entire volume of the sample to calculate density (organisms/L). Mean total zooplankton density (ALLZOOP) was calculated for each lake by averaging sample-specific densities.
Chlorophyll-a concentration was also measured to represent trophic conditions in the 60 lakes. Water samples were collected at six stations (three limnetic, three littoral) in each lake. Twelve samples were collected in each lake—six samples (one per station) on one sampling date, and three samples (one per limnetic station) on each of two other sampling dates in later months. Water samples were filtered and analyzed with a fluorometer to calculate chlorophyll-a concentration (CHLA, μg/L), following protocols from previous research [42,43]. Because CHLA may not accurately represent trophic state in macrophyte-rich lakes [44], adjusted chlorophyll-a concentration (ACHLA, μg/L) was calculated for each lake. In particular, concentrations of nitrogen and phosphorus in macrophytes were measured and incorporated into regression models to project chlorophyll-a concentrations if these nutrients were present in the water column [41]. Mean CHLA and ACHLA were calculated for each lake by averaging sample-specific CHLA and ACHLA values.
Macrophyte abundance (PVI) was measured in each lake using a Raytheon DE-719 recording fathometer and a transect-sampling approach developed in previous research [45]. The number of transects per lake was proportional to lake surface area, ranging from 3 to 24 (average 12). Because PVI has been used in previous studies of Florida lakes [41,46] and represents a useful, management-relevant index of plant coverage relative to total lake volume, it was deemed an appropriate measure of macrophyte abundance for this study.
Bluegills were collected using two methods: block-net rotenone sampling and electrofishing. Block nets (3-mm bar mesh) were deployed to confine Bluegills to a 0.08-ha area [47]; rotenone treatment (2 mg/L, 5% active ingredient, Noxfish) was then used to collect Bluegills over three days. In all but two lakes, six block nets were deployed, with three nets each in limnetic and littoral habitats. The remaining lakes were the smallest (2 ha) and largest (12,412 ha) systems, so two and twelve block nets were deployed, respectively, using equal numbers of nets in limnetic and littoral habitats. Lake-wide Bluegill densities (fish/ha) were calculated by weighting limnetic and littoral densities by the whole-lake area of each habitat type.
Standardized boat electrofishing was used to collect Bluegills and Florida Bass in the 60 study lakes; lakes in the Florida Panhandle also contained intergrades between Florida Bass and Largemouth Bass Micropterus salmoides. Fish were collected using a Coffelt VVP-15 electrofisher powered with a 5.5-kilowatt generator, with the boat serving as the cathode and five stainless steel cables serving as the anode. In all lakes, pulsed-DC daytime electrofishing was performed in evenly spaced near-shore areas using one experienced netter. In most lakes, electrofishing was performed using six 10-min transects; the smallest lakes (<5 ha) received two transects, whereas the largest lakes (>2000 ha) received twelve transects. Mean catch per unit effort (CPUE, fish/h) was calculated for each lake by averaging transect-specific CPUE values. All fish (collected using rotenone or electrofishing) were measured (total length [TL], mm), counted, and weighed (g). Fish were captured in accordance with all applicable University of Florida animal care and use protocols.
Bluegill age and growth were evaluated by extracting sagittal otoliths from all Bluegills >120 mm TL that were collected on the first day of rotenone sampling. Otoliths were cleared in 100% glycerin for one week. Then, a 10×-magnification dissecting microscope with reflected light was used to measure the radius and annuli from the core to the anterior tip [48]. Mean back-calculated length at age 3 (MLA-3)—a growth index for harvestable-sized Bluegill (age 3) in the study lakes [38]—was determined by developing regressions of Bluegill TL against otolith radius using the direct-proportion method.

2.3. Statistical Analysis

Generalized additive modeling was used to assess how Bluegill population demographics are affected by lake surface area, trophic indicators (ALLZOOP, CHLA, ACHLA), macrophyte abundance (PVI), and Florida Bass relative abundance and size structure in Florida lakes. Generalized additive models (GAMs) were used because they simultaneously evaluate linear and nonlinear relationships between independent and dependent variables, which can better represent ecological relationships than models assuming linearity [49,50]. In this study, GAMs were developed to evaluate Bluegill density and relative abundance (CPUE) as linear and nonlinear functions of predictor variables, including environmental variables (surface area, ALLZOOP, CHLA, ACHLA, PVI), Florida Bass proportional size distribution (PSD), PSD of preferred-length Florida Bass (PSD-P), and CPUE of stock-length Florida Bass. Similarly, GAMs were developed to assess how Bluegill growth (MLA-3) and size structure (PSD, PSD-P) were affected by the aforementioned variables and Bluegill density. Models including nonlinear effects produced smoothing (s) terms with estimated degrees of freedom (edf) values, which represent the degree of nonlinearity in relationships between predictor and response variables (edf = 1 is linear, edf > 1 is increasingly nonlinear). Pairwise correlations between all predictors were calculated and used to assess the potential for multicollinearity, defined as r ≥ 0.60. If two predictors exhibited multicollinearity, they were not included together in the same model; the predictor most strongly correlated with the response variable was included. Stock, quality, and preferred lengths for Bluegill (80 mm, 150 mm, 200 mm) and Largemouth Bass (200 mm, 300 mm, 380 mm) [51] were used to calculate PSD and PSD-P.
Lake surface area, trophic indicators, and Bluegill density and CPUE were transformed (log10(X + 1)) for analysis because they spanned orders of magnitude, and variances were proportional to means [46,52]. Similarly, arcsine square-root transformation was used to normalize residuals for percentage data (PVI, PSD, PSD-P) [53]. For each response variable (Bluegill density, CPUE, MLA-3, PSD, PSD-P), different formulations of predictor variables were compared using information-theoretic model selection [54]. The bias-corrected Akaike’s information criterion (AICc) was used to identify the most parsimonious model for each response variable, and models were validated by comparing observed and model-predicted responses across lakes using leave-one-out cross-validation. This approach was used because leave-one-out cross-validation maximizes the number of training samples in each iteration, leading to more reliable, accurate representations of the data that minimize bias compared to less computationally powerful alternatives (e.g., k-fold cross-validation) [55]. Models were assessed using normalized root mean squared error (NRMSE, RMSE/mean); values between 0 and 1 indicate great to good performance, whereas values >1 indicate poor performance [56].
Temporal trends in environmental variables were evaluated to assess model applicability to Florida lakes now and in the future. Due to prohibitive logistics and financial costs of annually sampling 60 lakes, comprehensive data were unavailable for all years. However, measurements of historical [38] and current [57,58] total phosphorus (TP, μg/L), total nitrogen (TN, μg/L), and Secchi depth (m) were available for 77% of the study lakes (N = 46). Historical was defined as the year the lake was sampled for a historical study between 1986 and 1990, and current was defined as 2021, when lakes were sampled again for the current study. Two-sample t-tests were used to compare historical and current mean TP, TN, and Secchi depth. In addition, historical and current values of minimum and maximum TP, TN, and Secchi depth were compared to evaluate temporal trends in the range of environmental conditions across the study lakes. Temporally consistent conditions would indicate that models are applicable in historical and current time periods. All analyses were conducted in R version 3.6.1 [59], using the mgcv, AICcmodavg, and stats packages and a statistical significance level of α ≤ 0.05.

3. Results

3.1. Abiotic and Biotic Factors

Lakes in this study varied substantially in surface area, trophic conditions, and macrophyte abundance (Table 1). Lakes ranged from small to large (2–12,412 ha), oligotrophic to hypereutrophic (1–350 μg/L adjusted chlorophyll-a concentration) [60], and essentially non-vegetated to highly vegetated (0.3–100 PVI). Zooplankton density, Bluegill population demographics (i.e., density, relative abundance, growth, size structure), and Florida Bass population demographics (i.e., relative abundance, size structure) also varied among lakes, with coefficients of variation ranging from 0.14 to 2.20 (Table 1). The study lakes did not exhibit temporal changes in TP (t-test, p = 0.80), TN (p = 0.79), or Secchi depth (p = 0.45). Parameter ranges were highly similar and overlapping for TP (historical: 2–371 μg/L; current: 4–344 μg/L), TN (historical: 82–3789 μg/L; current: 70–3410 μg/L), and Secchi depth (historical: 0.3–5.5 m; current: 0.2–5.8 m). Likewise, population distribution and community composition of fishes and aquatic plants have remained similar over time in the study lakes [38,57,58]. Correlations between abiotic and biotic factors used to model Bluegill population demographics were low (i.e., no evidence of multicollinearity) in all cases except CHLA–ACHLA (r = 0.72; Table 2); these two variables were not included together in models of Bluegill population demographics.

3.2. Density

Bluegill density was best explained by adjusted chlorophyll-a concentration, zooplankton density, and macrophyte abundance. The most parsimonious model for Bluegill density was
log 10 density = 2.72 + 0.33 ( log 10 ACHLA ) + s ( log 10 ALLZOOP ) + s ( arcsinePVI )
where edf values for log10ALLZOOP (2.19) and arcsinePVI (1.23) indicated nonlinear relationships between these variables and log10density. Bluegill density increased as lakes became more productive (p = 0.005; Figure 2A) and peaked at an intermediate zooplankton density of approximately 50 organisms/L (p = 0.030; Figure 2B). Bluegill density declined with increasing macrophyte abundance (p = 0.050; Figure 2C). The model had an NRMSE of 0.17 (i.e., good performance) [56] and was highest-ranked by model selection (AICc = 108.74).

3.3. Relative Abundance

Bluegill CPUE was best explained by chlorophyll-a concentration and macrophyte abundance. The most parsimonious model for Bluegill CPUE was
log 10 CPUE = 1.90 + s ( log 10 CHLA ) + s ( arcsinePVI )
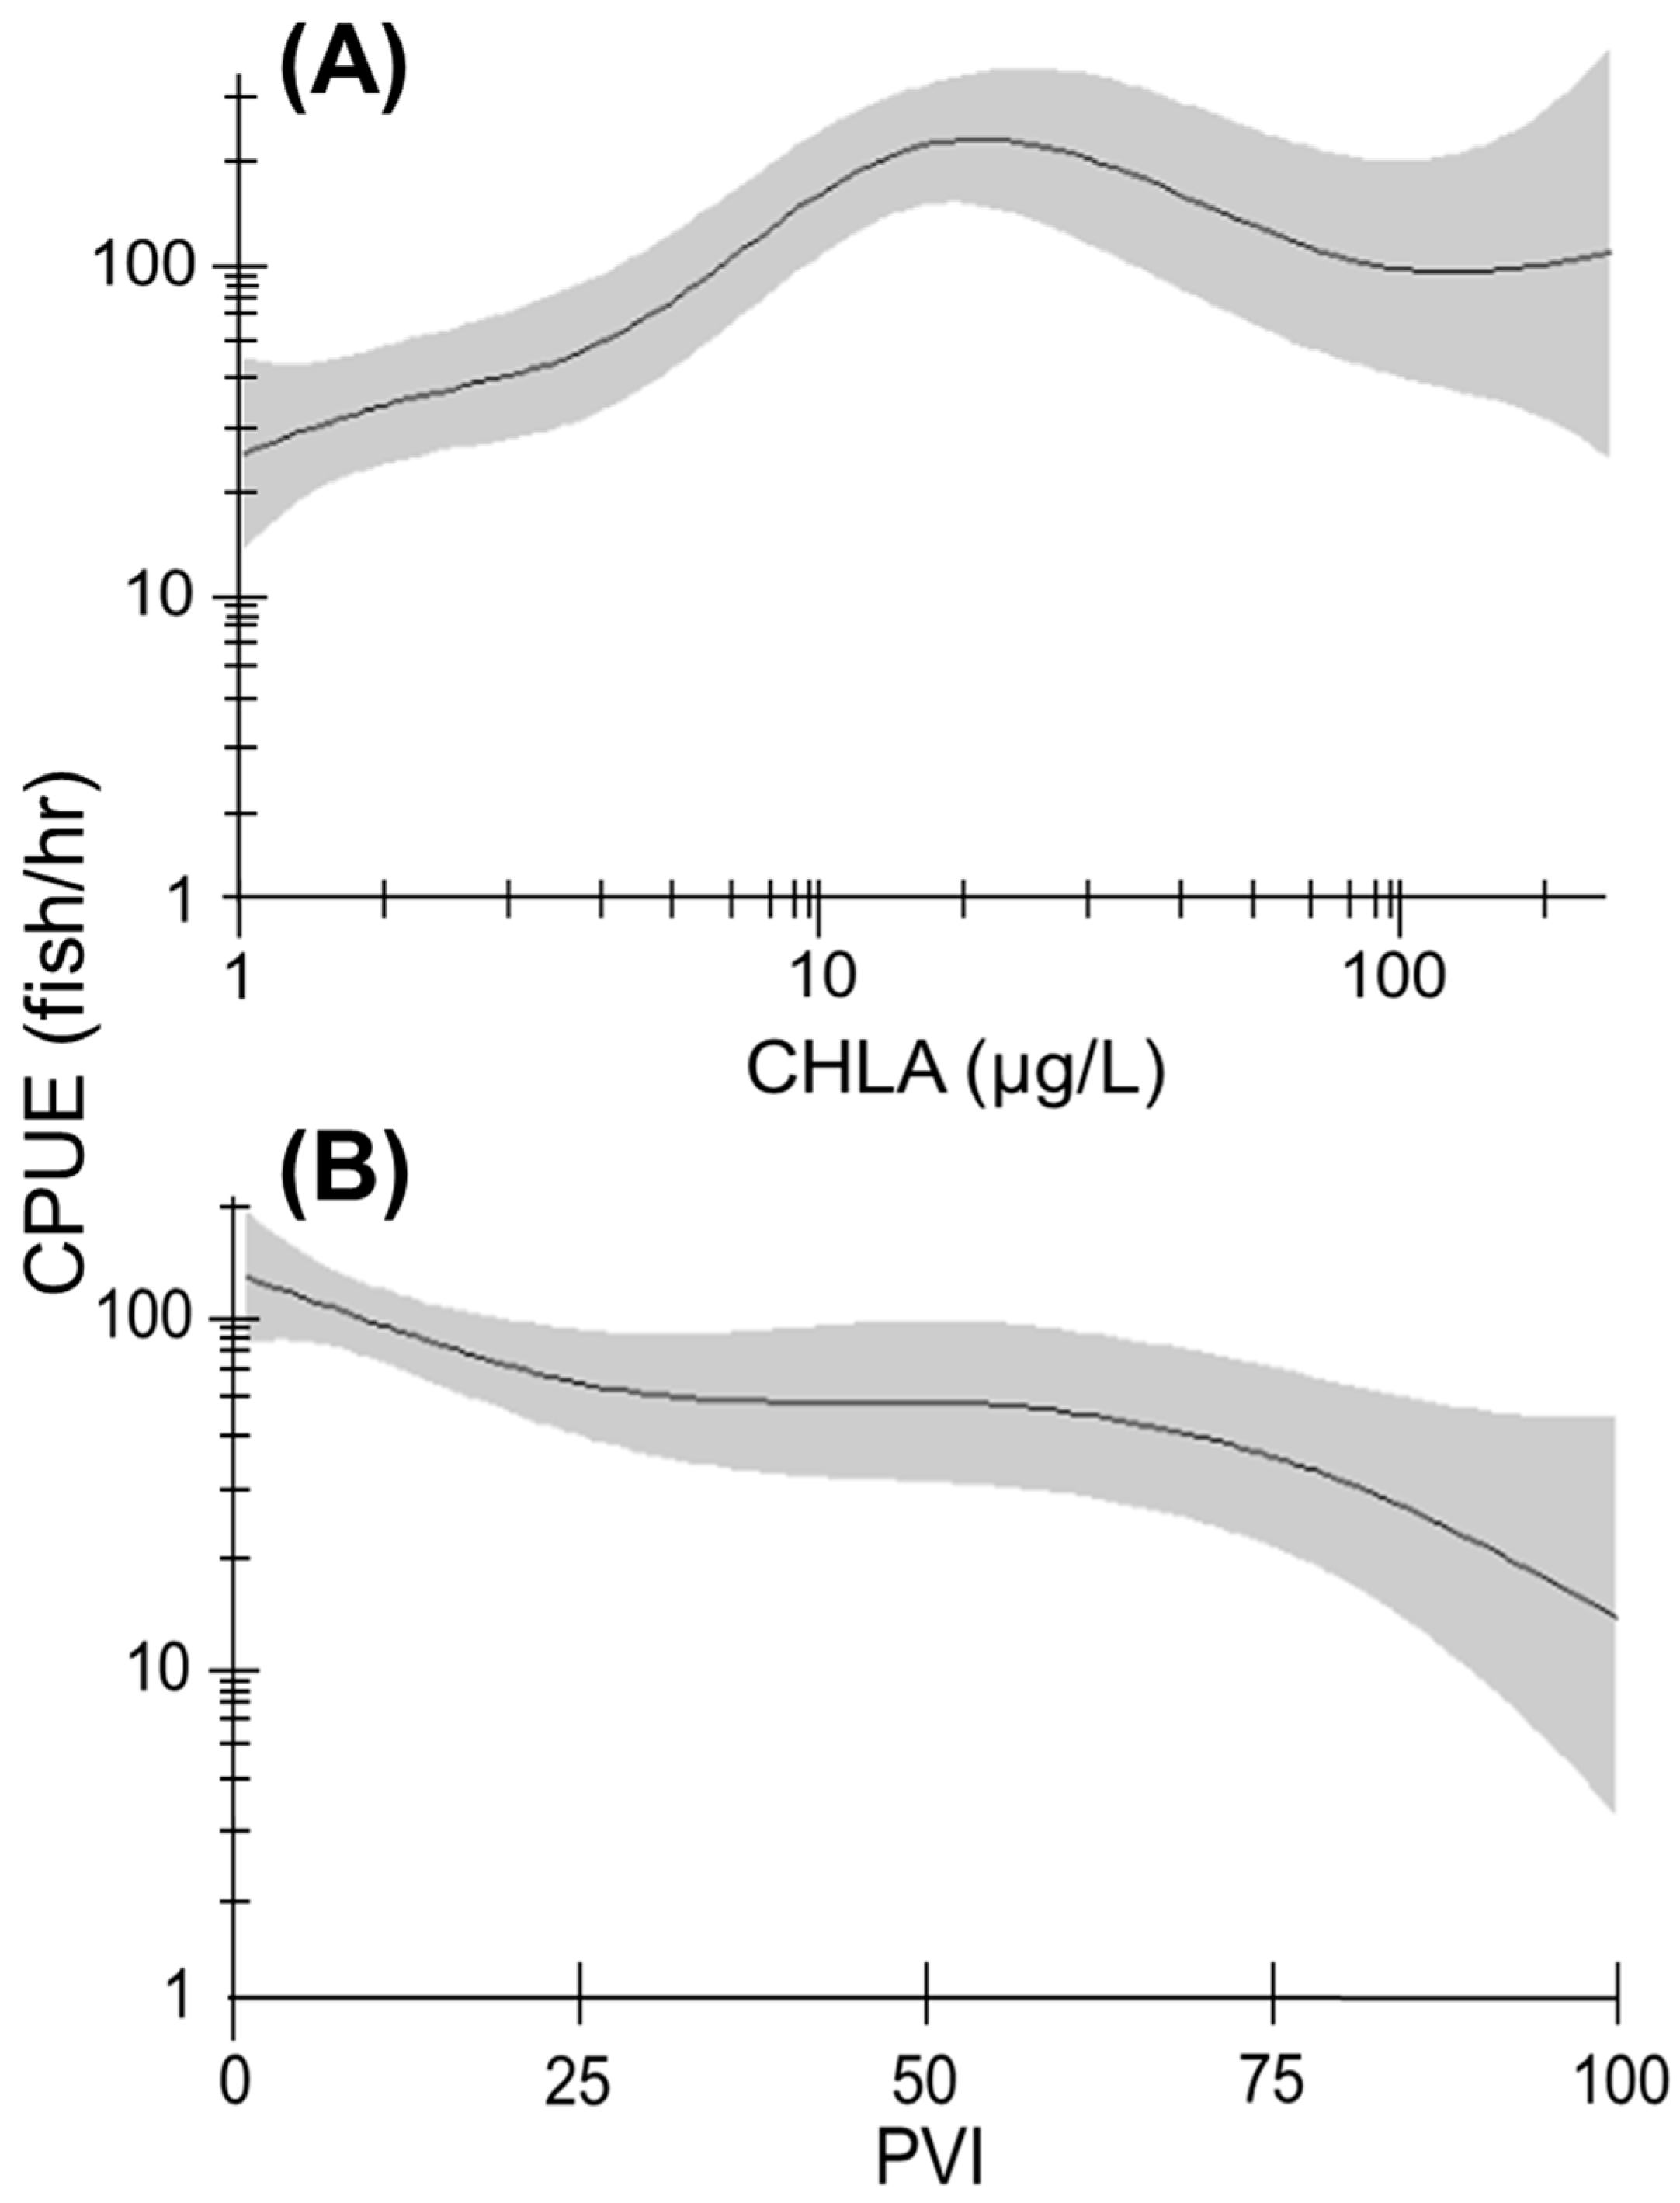
where edf values for log10CHLA (4.25) and arcsinePVI (2.74) indicated nonlinear relationships between these variables and log10CPUE. Relative abundance generally increased with chlorophyll-a concentration (p < 0.001; Figure 3A) but declined with increasing macrophyte abundance (p = 0.001; Figure 3B). The model had an NRMSE of 0.20 and was highest-ranked by model selection (AICc = 96.49), indicating a high-performing, parsimonious model.

3.4. Growth

Bluegill MLA-3 was best explained by chlorophyll-a concentration, zooplankton density, and CPUE of stock-length Florida Bass. The most parsimonious model for MLA-3 was
MLA - 3 = 92.74 + s ( log 10 CHLA ) + 22.56 ( log 10 ALLZOOP ) + 19.99 ( log 10 BASS _ CPUE )
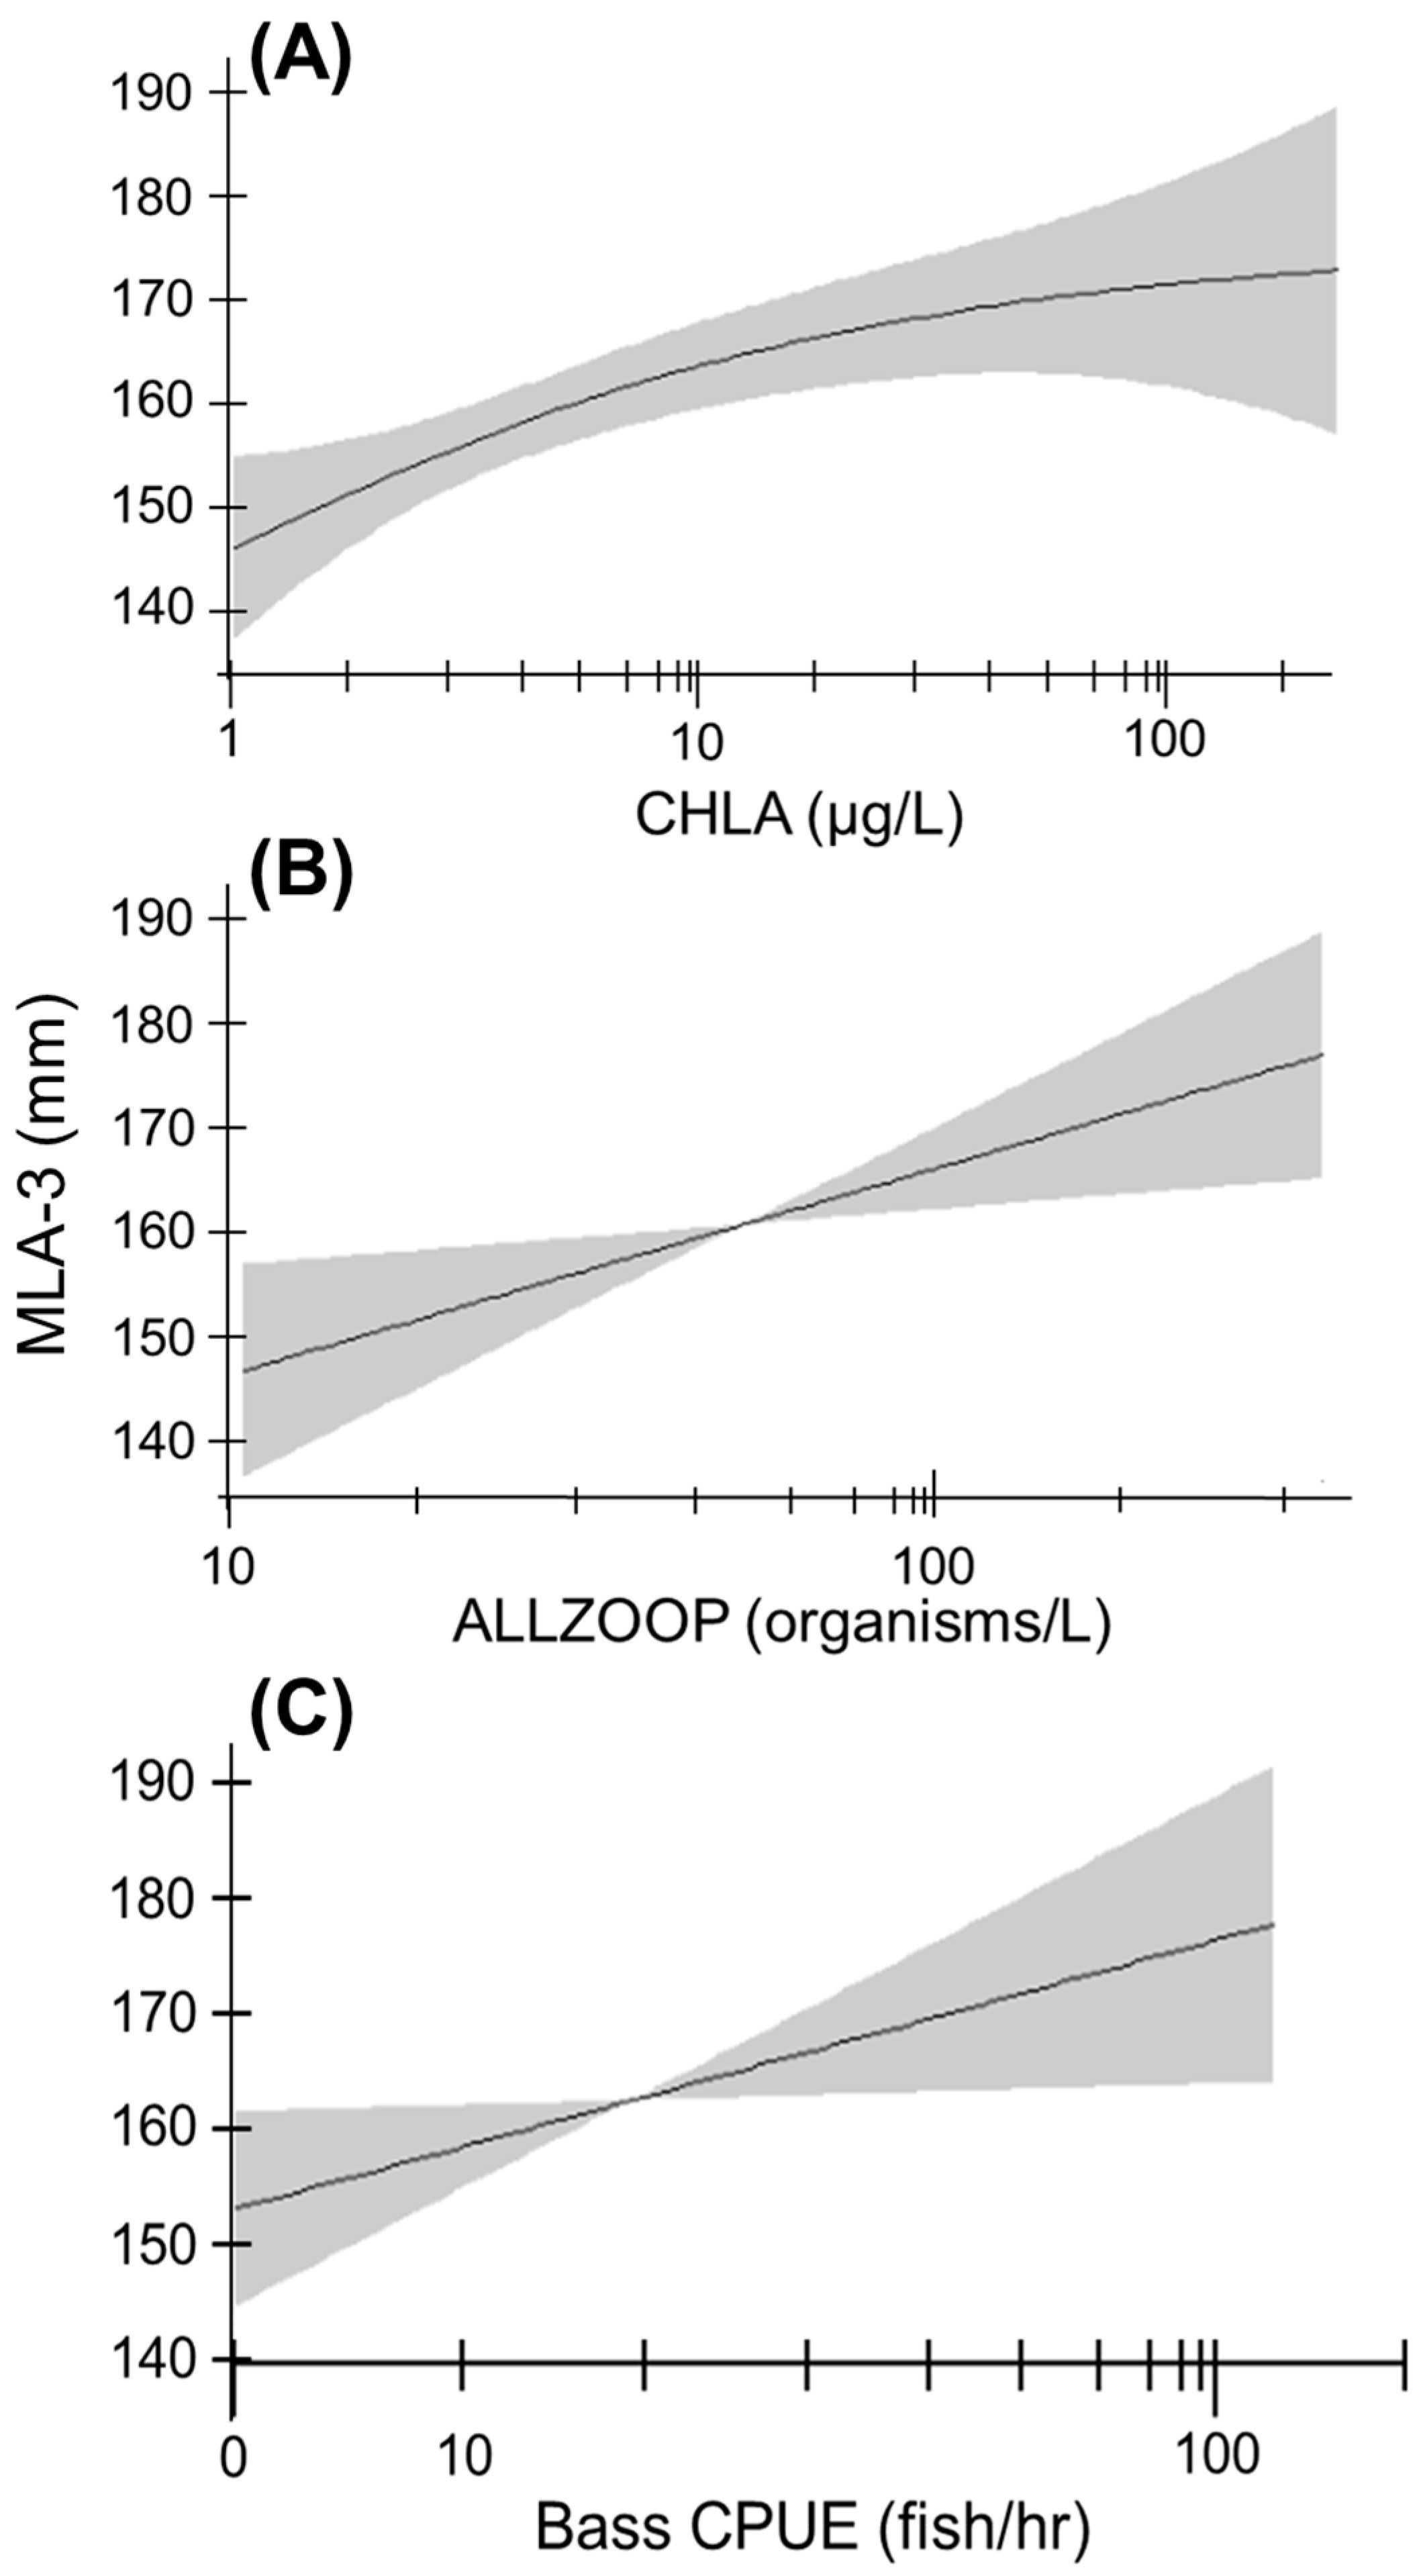
Chlorophyll-a concentration was positively and nonlinearly related to Bluegill MLA-3 (edf = 1.66, p = 0.007; Figure 4A). Bluegill MLA-3 increased linearly with zooplankton density (p = 0.009; Figure 4B) and Florida Bass CPUE (p = 0.031; Figure 4C). Model performance metrics (NRMSE = 0.10, AICc = 441.08) indicated a high-performing, parsimonious model [56].

3.5. Size Structure

Bluegill size structure was best explained by chlorophyll-a concentration and Bluegill density. The most parsimonious models for Bluegill PSD and PSD-P were
ArcsinePSD = 0.73 + s ( log 10 CHLA ) + s ( log 10 density )
ArcsinePSD - P = 0.42 + s ( log 10 CHLA ) + s ( log 10 density )
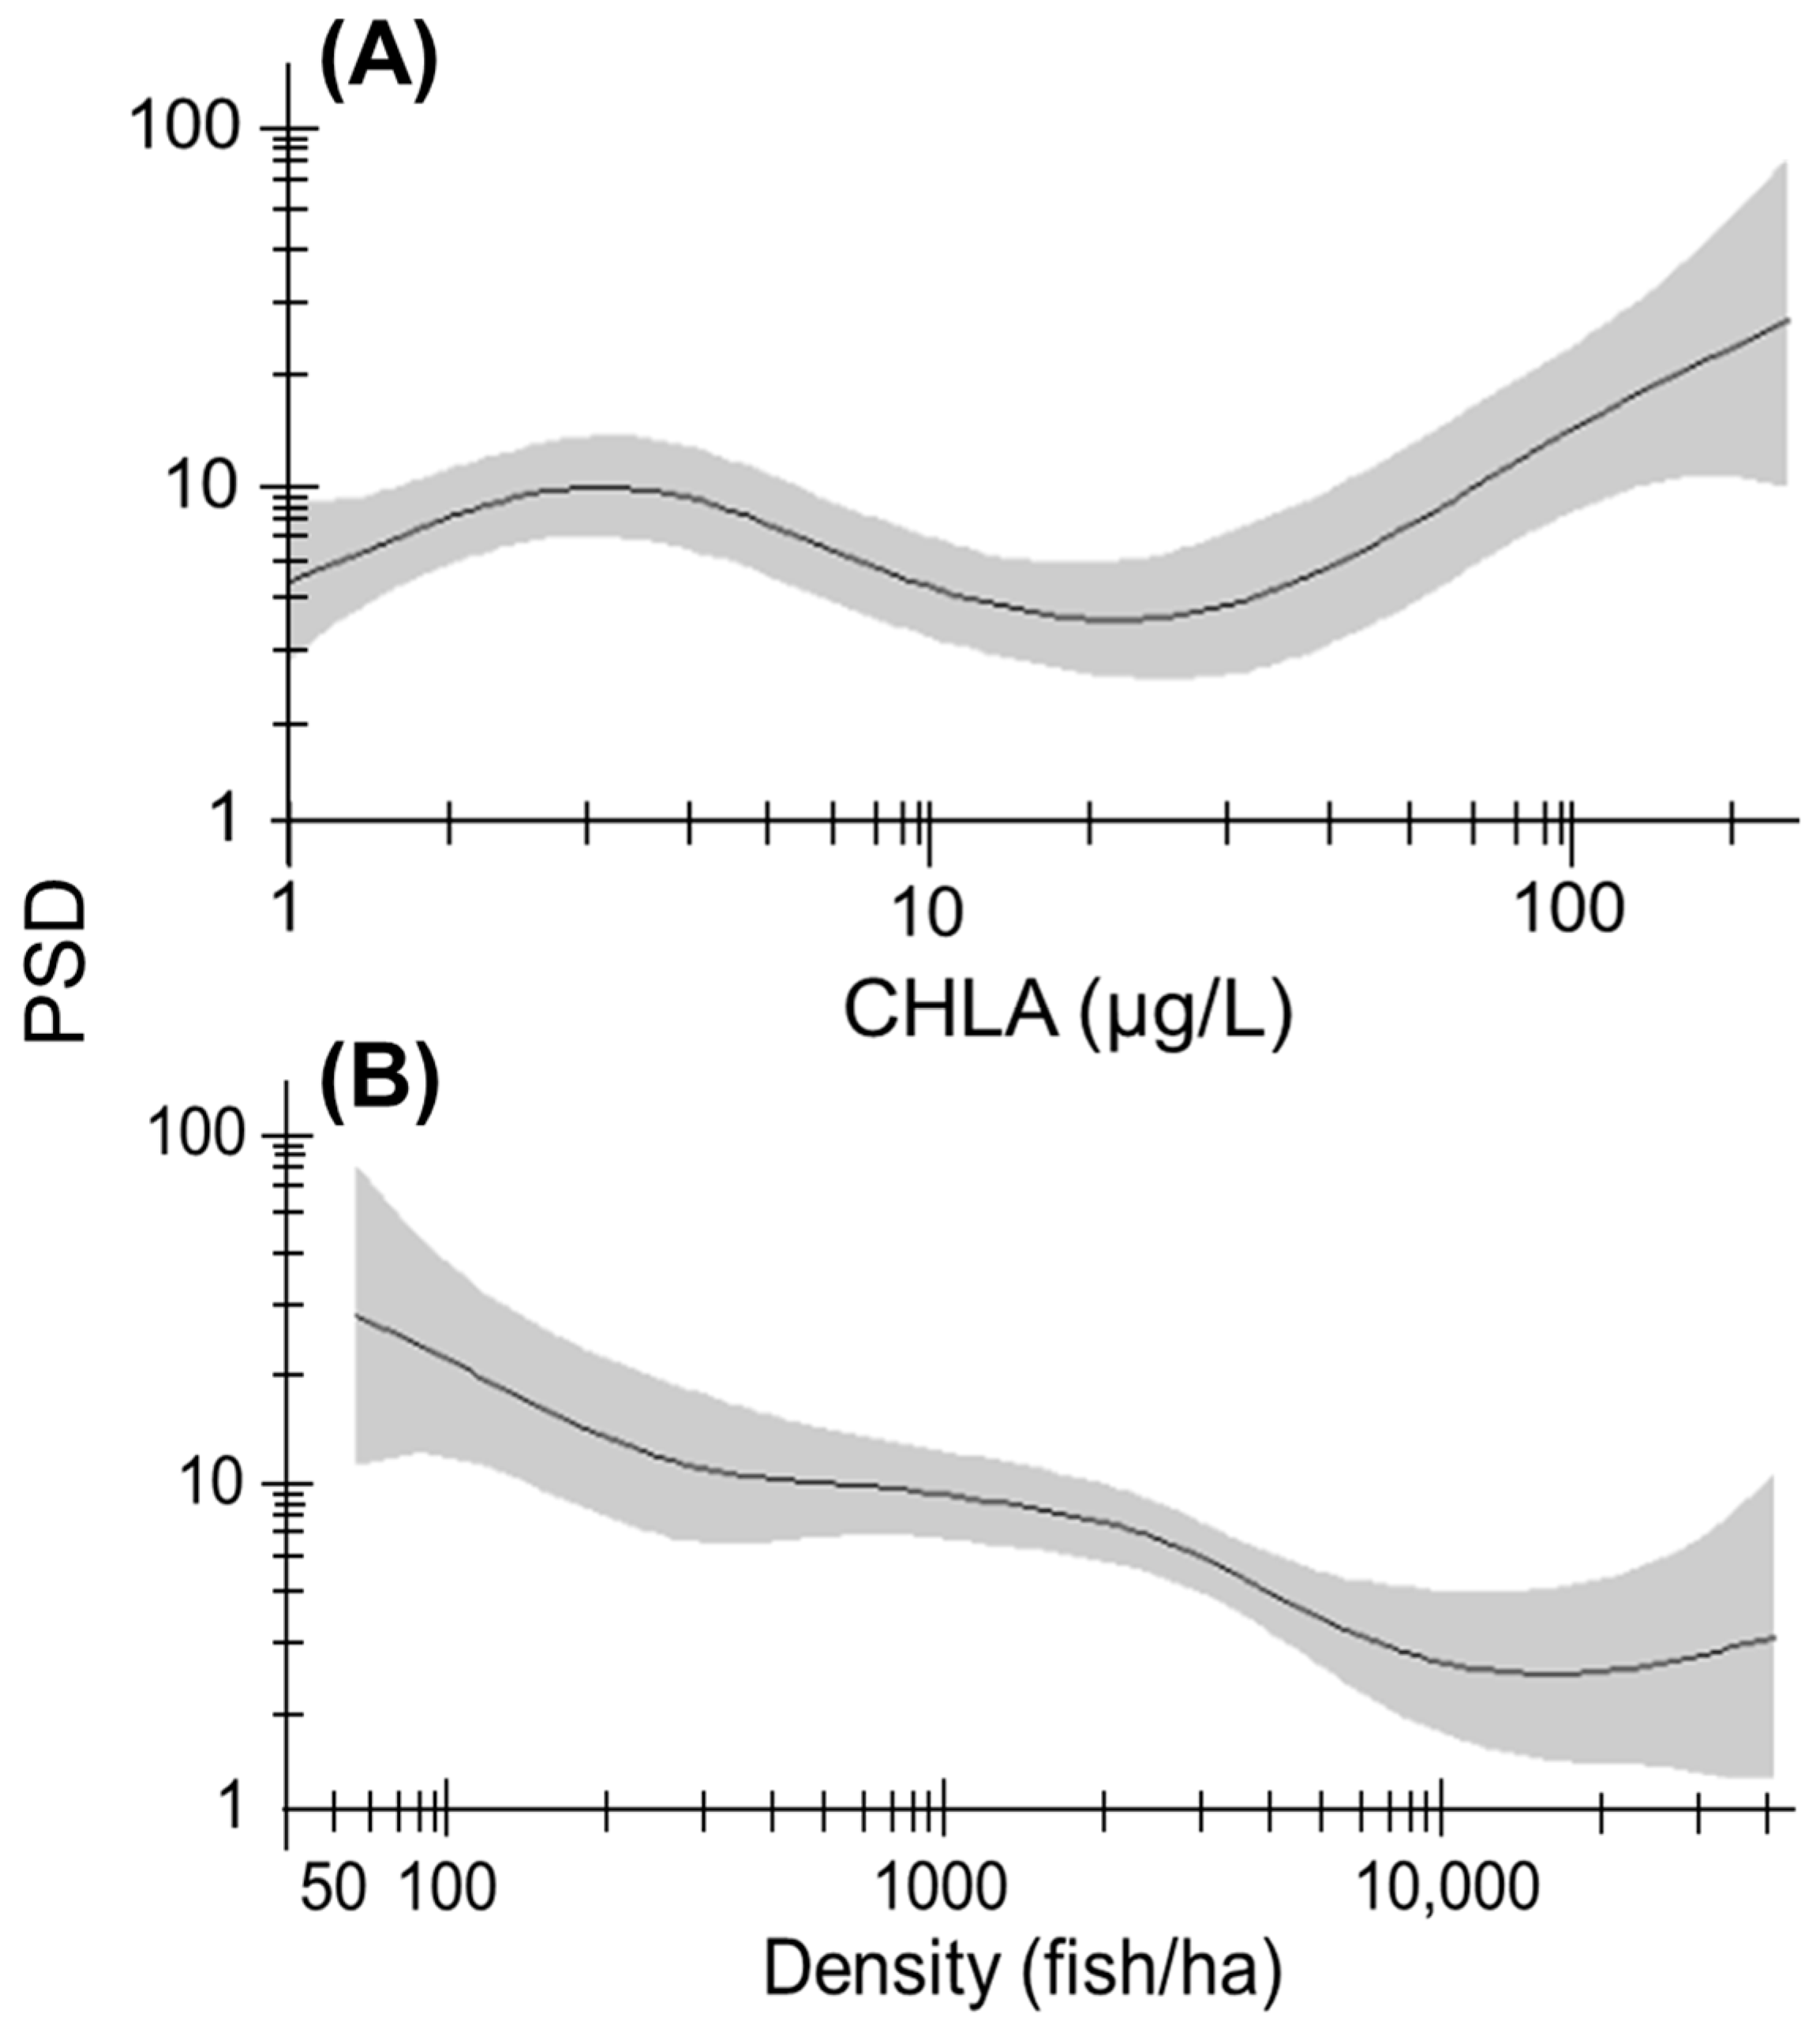
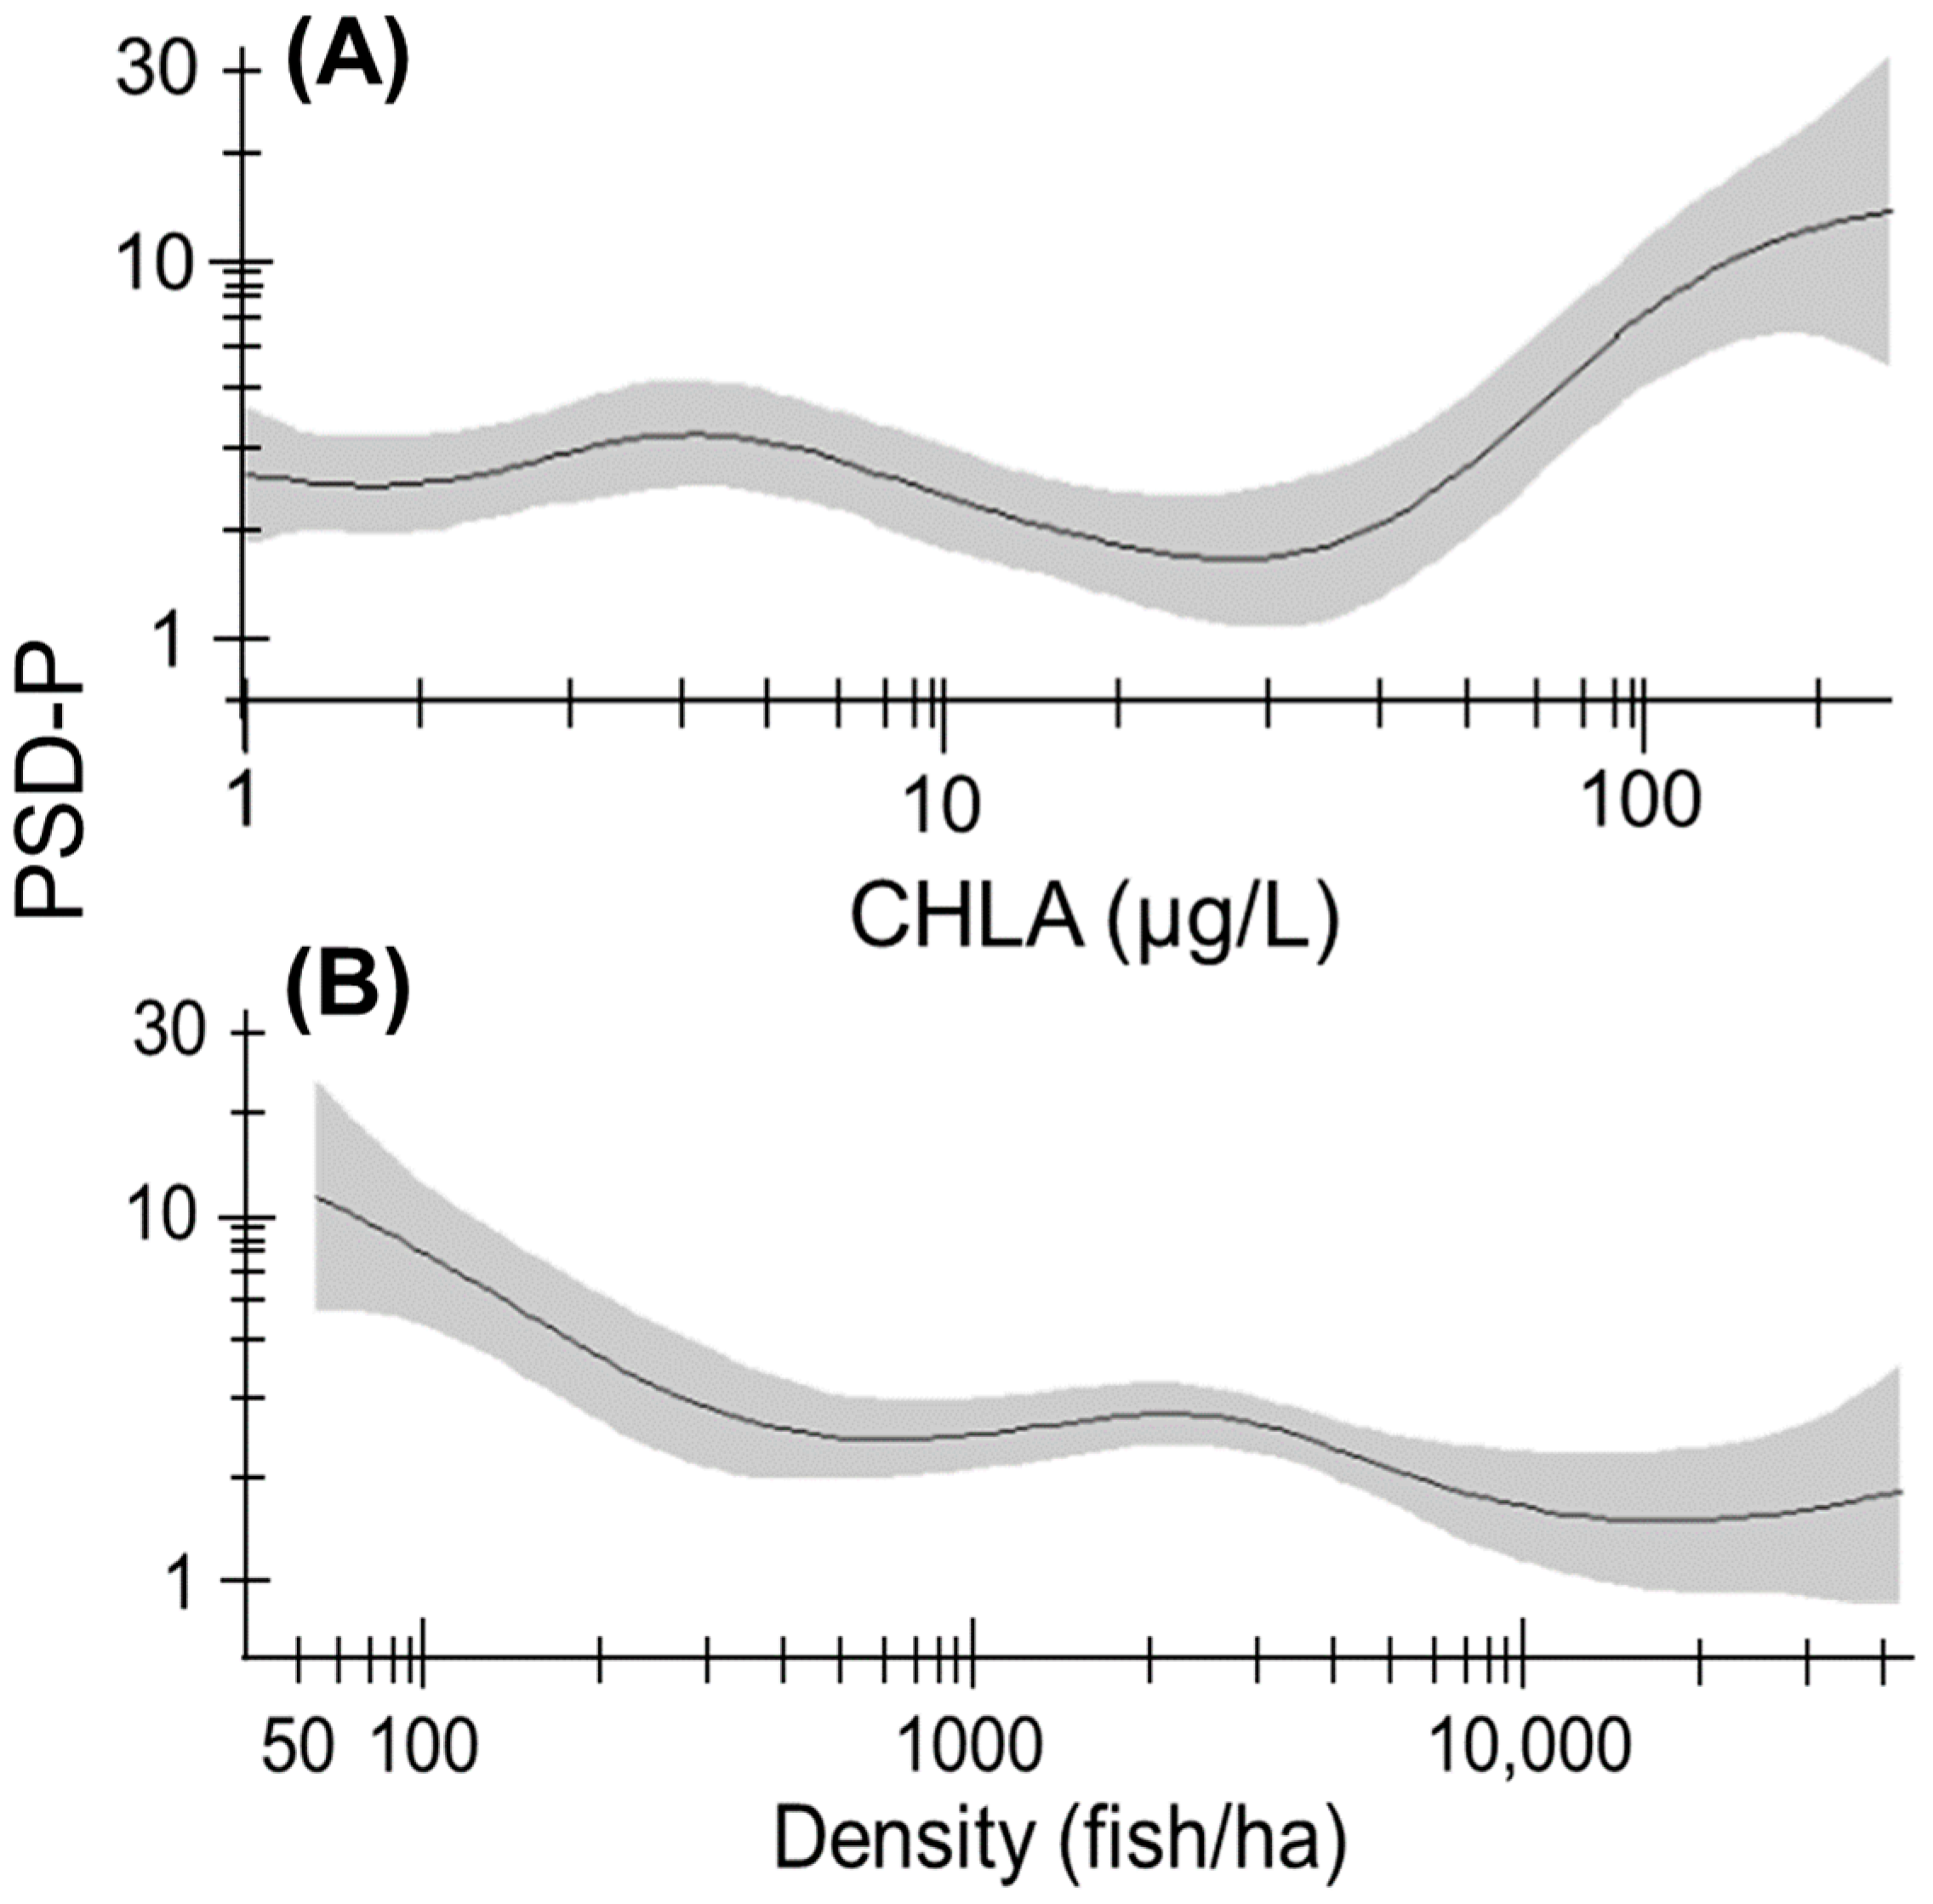
The relationship between Bluegill PSD and productivity was nonlinear and sinusoidal at chlorophyll-a concentrations <50 μg/L, with PSD increasing quickly at higher productivity levels (edf = 3.93, p = 0.006; Figure 5A). By comparison, the relationship between PSD and Bluegill density was negative and nonlinear (edf = 4.38, p < 0.001; Figure 5B). Relationships between PSD-P and chlorophyll-a concentration (edf = 5.44, p < 0.001; Figure 6A) and PSD-P and Bluegill density (edf = 4.54, p < 0.001; Figure 6B) were similar to those for PSD. Model performance metrics for PSD (NRMSE = 0.35, AICc = 33.12) and PSD-P (NRMSE = 0.44, AICc = 3.88) indicated high-performing, parsimonious models.

4. Discussion and Conclusions

Bluegill density increased with adjusted chlorophyll-a concentration, reflecting a well-established trophic connection between lake productivity and fish carrying capacity, density, and biomass [41,61,62]. Our results support previous research demonstrating a positive relationship between Bluegill density and lake productivity in Illinois, USA [26,27]. Similarly, [25] observed a positive relationship between chlorophyll-a concentration, fish density (including Bluegills), and fish yield in lakes in Missouri and Iowa, USA. Our results indicate that fisheries managers can estimate Bluegill density based on the productivity of Florida lakes, offering a straightforward method for using common limnological data to predict Bluegill abundance and identify lakes where management actions may be necessary to improve Bluegill growth, size structure, and other parameters of management interest.
In addition to lake productivity, Bluegill density was positively related to zooplankton density, likely reflecting the fact that productive lakes with abundant zooplankton have suitable food resources to support dense Bluegill populations [24,63,64]. However, at zooplankton densities in excess of ~70 zooplankters/L, the relationship between Bluegill density and zooplankton density switched from positive to negative. Zooplankton tend to reach high densities in systems with limited zooplanktivory [65], as would be expected in lakes with low-density Bluegill populations. Moreover, as zooplankton density increases beyond 70 zooplankters/L in Florida lakes, Bluegill density may be increasingly affected by other factors. For instance, in our study lakes, Bluegill density was negatively related to macrophyte abundance, which itself was positively related to zooplankton density [38]. Hence, macrophyte abundance may have influenced the observed negative relationship between Bluegill density and zooplankton density, particularly in highly vegetated, zooplankton-rich lakes.
The negative relationship between Bluegill density and macrophyte abundance differs from previous studies. For instance, macrophytes are known to reduce predation on Bluegills and thereby increase Bluegill density and decrease growth [66,67,68]. However, Bluegill density may decline with increasing macrophyte abundance if vegetation does not reduce consumption of Bluegills by predators that use macrophytes (e.g., Florida Bass). For instance, macrophyte architecture (e.g., growth form, stem density) may have been insufficiently complex to limit Florida Bass predation on Bluegills in our study lakes [69,70,71]. Other fish, such as Warmouth and Bowfin, are abundant in vegetated portions of our study lakes and are known to consume Bluegills [5,72,73,74], a relationship that warrants further investigation and perhaps contributed to the negative association between Bluegill density and macrophyte abundance. An important takeaway for fisheries managers is that they can forecast Bluegill density based on lake productivity, zooplankton density, and macrophyte abundance using the modeling approach developed herein. Moreover, our results indicate that aquatic vegetation management can be used to modify Bluegill density and size structure in pursuit of fisheries management goals.
Bluegill CPUE was positively related to chlorophyll-a concentration and negatively related to macrophyte abundance in Florida lakes. A positive relationship between lake productivity and fish abundance was observed in previous Bluegill research [25,34,75,76] and studies on other species in our study lakes (e.g., Black Crappie Pomoxis nigromaculatus L., Gizzard Shad Dorosoma cepedianum L.) [46,52]. More productive water bodies tend to produce more food resources for Bluegills (e.g., zooplankton, macroinvertebrates) [77] and can thereby support larger Bluegill populations [24,75]. Similar to Bluegill density, the observed negative relationship between Bluegill CPUE and PVI may reflect a linkage between predator populations and macrophyte abundance. Whereas predation on Bluegills is impeded by submergent vegetation in some systems [66,67,68], our results indicate that macrophyte abundance, growth form, or stem density was insufficient to reduce predation on Bluegills in our study lakes, leading to a negative relationship between PVI and Bluegill abundance [6]. In addition to Florida Bass, predation on Bluegills by Warmouth, Bowfin, or other fish that use vegetated habitats in our study lakes may have contributed to this relationship [5,72,73,74]. Although macrophytes can reduce electrofishing catchability [78], another potential explanation for our results, Florida-specific catchability research indicates that electrofishing is a viable method for indexing Bluegill abundance in Florida lakes [79]. Moreover, we standardized electrofishing across lakes (e.g., consistent equipment, sampling procedure, habitat types, experienced personnel; see Methods) to the extent possible. Our results indicate that fisheries managers can predict Bluegill CPUE based on productivity and macrophyte abundance in Florida lakes, allowing them to identify systems where Bluegill populations are likely to support viable fisheries and use vegetation management approaches to increase or decrease Bluegill abundance, depending on management objectives.
Bluegill MLA-3 increased with chlorophyll-a concentration, reflecting a positive relationship between lake productivity, food resource abundance, and Bluegill growth [18,21,33,77,80]. Indeed, in our study lakes and others across the USA, Bluegills tended to grow fastest in systems with abundant zooplankton [81,82,83]. We documented a positive relationship between Bluegill growth and Florida Bass CPUE, suggesting that bass predation is an important driver of Bluegill demographics in Florida lakes, much like in small impoundments across the South and Midwest (USA) [31,62,84,85,86]. Providing insights on factors that influence Bluegill growth across diverse lakes, our results indicate that managers can expect to find fast-growing Bluegill populations in productive, zooplankton-rich systems with abundant stock-length Florida Bass. Because Bluegill growth is positively related to Florida Bass abundance, developing fisheries with large Bluegills and plentiful Florida Bass appears to be a viable management option in Florida lakes.
Interestingly, Bluegill growth was not influenced by macrophyte abundance in Florida lakes. Previous studies have documented negative associations between Bluegill growth and macrophyte abundance [20,68,82], although this relationship is not universal. For instance, fast-growing Bluegills have been observed in highly vegetated lakes with low fishing mortality, abundant food resources, and low Bluegill density resulting from low recruitment or high predation pressure [30,31]. One or more of these conditions characterize most of the Florida lakes studied herein, likely explaining why Bluegill growth was unrelated to macrophyte coverage at a 60-lake scale. However, this large-scale pattern may or may not hold within individual lakes, warranting further investigation of lake-specific relationships between Bluegill growth and macrophyte abundance. Our results indicate that Bluegill growth was not density-dependent across the 60 Florida lakes studied herein, which differs from some studies [85,87,88] but is consistent with others [24,31,34,89]. An important implication for Bluegill management is that highly vegetated lakes, commonly associated with slow Bluegill growth, can produce large Bluegills in abundance if certain conditions are present (e.g., limited harvest, high abundance of small- to intermediate-sized predators). Managing lakes for these conditions could produce fisheries that meet angler desires for large, fast-growing Bluegills and abundant Florida Bass of catchable size.
Indices of Bluegill size structure (PSD, PSD-P) were positively related to chlorophyll-a concentration and negatively related to Bluegill density in Florida lakes. Size structure—much like density, relative abundance, and growth—increased with lake productivity, reflecting the trophic linkage between primary production, food resource abundance, and fish growth [42,77]. Our results are consistent with previous studies wherein Bluegill size structure increased with lake/impoundment productivity in Wisconsin, Minnesota, Iowa, and Indiana, USA [18,21,90,91]. However, Bluegill PSD was unrelated to abiotic variables, including chlorophyll-a concentration, in another study of Iowa lakes and impoundments [34]. The reported range of chlorophyll-a concentrations in [34] was 6–94 μg/L; a wider productivity range in Florida lakes (1–350 μg/L) may explain why chlorophyll-a concentration had a more pronounced effect on Bluegill size structure in the present study. We observed a negative, nonlinear relationship between Bluegill density and size structure (PSD and PSD-P) [79,92,93]. In contrast, water temperature, water clarity, and prey availability were more important than Bluegill density in explaining variation in Bluegill size structure across 23 impoundments in Illinois, USA [33]. Decades of research indicate that Bluegill population demographics are complex and context-specific, responding to numerous abiotic and biotic factors that vary among water bodies, watersheds, and regions [21,28,31,34]. Our study contributes new information to the literature on Florida fisheries, showing that Bluegill size structure increases with lake productivity and decreases with Bluegill density, allowing managers to forecast size structure based on lake-specific characteristics and modify Bluegill density directly or indirectly (e.g., predator management) to achieve size structure goals.
It was important to evaluate temporal trends in environmental conditions in our study lakes to determine if models are appropriate for understanding and managing Bluegill populations now and in the future. We found no significant differences in total phosphorus, total nitrogen, and Secchi depth in our study lakes over time. Long-term chlorophyll-a concentration data were not available for analysis, but chlorophyll-a concentration is highly correlated with temporally stable total phosphorus and total nitrogen in our study lakes [36,38,57,58,94,95], suggesting that chlorophyll-a concentrations have been relatively consistent over time. Similarly, the distribution and abundance of hydrilla Hydrilla verticillata, a primary aquatic plant in our study lakes, have remained temporally consistent. As an epicenter for species invasion, Florida first experienced hydrilla invasion in the early 1950s; hydrilla was thus established in many of our study lakes well before our research and remains established in many lakes today. In addition, the range of PVI, total phosphorus, total nitrogen, and Secchi depth measurements, along with fish population distribution and community composition, have remained consistent over time in our study lakes [36,38,57,58]. Moreover, the ways in which abiotic and biotic factors affect Bluegill population demographics—autecological relationships driven by factors operating on an evolutionary time scale—are unlikely to undergo fundamental changes in the time span of our study; even small-to-moderate changes in these relationships, undetected herein, would not invalidate the ecological importance and management utility of our results. Therefore, we believe that our models are representative of Bluegill populations in Florida lakes and useful for managing this species, while also contributing to a literature that lacks information on how abiotic and biotic factors affect Bluegill populations in Florida. Even so, continued data collection efforts that are standardized, spatially extensive, and otherwise comparable to the present study would deepen understanding of how abiotic and biotic factors influence Bluegill populations in Florida lakes across space and time.
Bluegills are a primary component of panfish fisheries enjoyed by 8.4 million anglers in the USA [2]. As a result, Bluegills receive considerable management attention [8,11,96,97]. Despite many decades of Bluegill research [28,31,98,99] and widespread variability in how Bluegill populations are structured by abiotic and biotic factors [21,34,100], important knowledge gaps remain. There is a paucity of information on drivers of Bluegill density, abundance, growth, and size structure across lakes with wide-ranging morphometry, trophic state, and macrophyte abundance, especially in the southeastern USA. This knowledge gap is evident in Florida, a state known for abundant Bluegills and popular, multimillion-dollar Bluegill fisheries [7,101]. Our results fill this knowledge gap and inform Bluegill management in Florida while providing a modeling approach that would be useful for managing Bluegill populations in other regions with wide-ranging lake surface areas, trophic states, and macrophyte abundances. Our results indicate that productive (>25 μg/L CHLA) lakes with moderate-to-high macrophyte abundance (PVI 50–100), abundant stock-length Florida Bass (>40 fish/h electrofishing), and Bluegill densities < 300 fish/ha are most likely to support Bluegill fisheries with abundant individuals of quality size. If abundance of quality-sized Bluegills is below target levels, managers could consider modifying Bluegill or predator density or aquatic vegetation coverage to attain preferred Bluegill abundance, growth, and size structure.
Fisheries managers can use our modeling approach to forecast Bluegill density, relative abundance, growth, and size structure and determine lake-specific likelihoods for establishing Bluegill fisheries with abundant individuals of quality size. In turn, managers can use our results to establish expectations for Bluegill population demographics and develop associated management strategies across large regions and diverse lake types. Our study will also be helpful for devising Bluegill management tools for individual lakes in tandem with system-specific data that were beyond the scope of this investigation (e.g., fishing and natural mortality, recruitment). Bluegills are found in parts of Canada (e.g., Quebec) and northern Mexico and have been introduced to South America, Europe, Africa, and Asia [10], so our study may have applications for understanding and managing Bluegill populations beyond the USA. Our results add new information to the Bluegill literature and are informative for fisheries management, demonstrating the utility of assessing fish population demographics in lakes spanning wide-ranging abiotic and biotic conditions. However, there is ample room for continued research of this nature. For instance, additional drivers of Bluegill population demographics (e.g., fishing and natural mortality) [102] could be directly assessed in Florida (as in [7]) at a large spatial scale, encompassing morphometrically and ecologically diverse lakes. Such analyses are important because overexploitation of large Bluegills can decrease population size structure [14], an outcome with potentially serious implications for angling quality. Our modeling approach can also be applied to other fish species and expanded to encompass interspecific interactions and fish community dynamics over longer time scales. A 60-lake analysis in north and central Florida was informative for the purposes of our study, but additional research would be helpful for identifying and comparing within-lake, statewide, and regional drivers of Bluegill populations, particularly in the southeastern USA. Such information would enrich the ever-growing literature on Bluegill ecology and management.

Author Contributions

Conceptualization, A.K.C. and M.V.H.; Methodology, A.K.C. and M.V.H.; Software, A.K.C. and M.V.H.; Validation, A.K.C. and M.V.H.; Formal Analysis, A.K.C.; Investigation, A.K.C. and M.V.H.; Resources, A.K.C. and M.V.H.; Data Curation, M.V.H.; Writing—Original Draft Preparation, A.K.C. and M.V.H.; Writing—Review and Editing, A.K.C. and M.V.H.; Visualization, A.K.C.; Supervision, A.K.C. and M.V.H.; Project Administration, A.K.C. and M.V.H.; Funding Acquisition, A.K.C. and M.V.H. All authors have read and agreed to the published version of the manuscript.

Funding

This research was funded by the Florida LAKEWATCH Program (School of Forest, Fisheries, and Geomatics Sciences, University of Florida) and the Bureau of Aquatic Plant Management, Florida Fish and Wildlife Conservation Commission.

Institutional Review Board Statement

Fish were collected by Florida LAKEWATCH personnel in accordance with all applicable animal care and use protocols using routine, standardized sampling techniques approved by our state fisheries management agency, the Florida Fish and Wildlife Conservation Commission (FWC). The FWC grants permits to collect fish in accordance with the 3Rs (replacement, reduction, refinement). Our current permit approval code is FNC-23-001. We followed animal care and use protocols approved by FWC and Florida LAKEWATCH; our data are from the Florida LAKEWATCH program, and IRB review pertains to human-subjects research at our institution, so IRB evaluation is not applicable.

Data Availability Statement

Data supporting the findings of this study are openly available in the Florida LAKEWATCH system at https://lakewatch.ifas.ufl.edu/datareports/ and https://wateratlas.usf.edu/AtlasOfLakes/Florida/, accessed on 2 February 2023. Please contact Mark Hoyer ([email protected]) for data-related questions.

Acknowledgments

We thank N. Trippel for valuable feedback and discussion about the fisheries sampling program on which this paper is based. We are grateful to Florida LAKEWATCH volunteers for their commitment to collecting important ecological data about Florida lakes. We thank the Florida Fish and Wildlife Conservation Commission and Florida Water Management Districts for field and laboratory assistance. The Florida Cooperative Fish and Wildlife Research Unit is jointly sponsored by the University of Florida, Florida Fish and Wildlife Conservation Commission, U.S. Geological Survey, U.S. Fish and Wildlife Service, and Wildlife Management Institute. Any use of trade, firm, or product names is for descriptive purposes only and does not imply endorsement by the U.S. Government.

Conflicts of Interest

The authors declare no conflict of interest.

References

  1. Lyons, J.; Rypel, A.L.; Hansen, J.F.; Rowe, D.C. Fillet weight and fillet yield: New metrics for the management of panfish and other consumption-oriented recreational fisheries. N. Am. J. Fish. Manag. 2017, 37, 550–557. [Google Scholar] [CrossRef]
  2. USDOI (United States Department of the Interior). National Survey of Fishing, Hunting, & Wildlife-Associated Recreation (FHWAR): 2016; United States Department of the Interior, United States Fish and Wildlife Service, United States Department of Commerce, United States Census Bureau: Washington, DC, USA, 2018. [Google Scholar]
  3. Caldwell, D.K.; Odum, H.T.; Hellier, T.R., Jr.; Berry, F.H. Populations of Spotted Sunfish and Florida Largemouth Bass in a constant-temperature spring. Trans. Am. Fish. Soc. 1957, 85, 120–134. [Google Scholar] [CrossRef]
  4. Sammons, S.M.; Maceina, M.J. Evaluating the potential effectiveness of harvest restrictions on riverine sunfish populations in Georgia, USA. Fish. Manag. Ecol. 2008, 15, 167–178. [Google Scholar] [CrossRef]
  5. Willis, D.J.; Watson, D.; Hoyer, M.; Canfield, D.E., Jr. Factors related to Warmouth Lepomis gulosus biomass and density in Florida lakes. Fla. Sci. 2009, 72, 218–226. [Google Scholar]
  6. Colle, D.E.; Shireman, J.; Haller, W.; Joyce, J.; Canfield, D.E. Influence of hydrilla on harvestable sport-fish populations, angler use, and angler expenditures at Orange Lake, Florida. N. Am. J. Fish. Manag. 1987, 7, 410–417. [Google Scholar] [CrossRef]
  7. Crawford, S.; Allen, M.S. Fishing and natural mortality of Bluegills and Redear Sunfish at Lake Panasoffkee, Florida: Implications for size limits. N. Am. J. Fish. Manag. 2006, 26, 42–51. [Google Scholar] [CrossRef]
  8. Sammons, S.M.; Partridge, D.; Maceina, M.J. Differences in population metrics between Bluegill and Redear Sunfish: Implications for the effectiveness of harvest restrictions. N. Am. J. Fish. Manag. 2006, 26, 777–787. [Google Scholar] [CrossRef]
  9. Hanson, C.W.; Sauls, B. Status of recreational saltwater fishing in Florida: Characterization of license sales, participation, and fishing effort. In American Fisheries Society Symposium; American Fisheries Society: Bethesda, MD, USA, 2011; Volume 75, pp. 355–365. [Google Scholar]
  10. Froese, R.; Pauly, D. FishBase: Bluegill, Lepomis macrochirus Rafinesque, 1819. 2022. Available online: https://www.fishbase.se/Summary/SpeciesSummary.php?ID=3375&AT=bluegill (accessed on 2 February 2023).
  11. Edison, T.W.; Wahl, D.; Diana, M.; Philipp, D.; Austen, D.J. Angler opinion of potential Bluegill regulations on Illinois lakes: Effects of angler demographics and Bluegill population size structure. N. Am. J. Fish. Manag. 2006, 26, 800–811. [Google Scholar] [CrossRef]
  12. Tingley, R.W., III; Hansen, J.; Isermann, D.; Fulton, D.; Musch, A.; Paukert, C.P. Characterizing angler preferences for Largemouth Bass, Bluegill, and Walleye fisheries in Wisconsin. N. Am. J. Fish. Manag. 2019, 39, 676–692. [Google Scholar] [CrossRef]
  13. Winkelman, D.L.; Sager, C. Managing hybrid Bluegill fisheries: Estimating and predicting the effects of young anglers. In American Fisheries Society Symposium 44:207–214; American Fisheries Society: Bethesda, MD, USA, 2004. [Google Scholar]
  14. Coble, D.W. Effects of angling on Bluegill populations: Management implications. N. Am. J. Fish. Manag. 1988, 8, 277–283. [Google Scholar] [CrossRef]
  15. Reed, J.R.; Parsons, B.G. Angler opinions of Bluegill management and related hypothetical effects on Bluegill fisheries in four Minnesota lakes. N. Am. J. Fish. Manag. 1999, 19, 515–519. [Google Scholar] [CrossRef]
  16. Jacobson, P.C. Experimental analysis of a reduced daily Bluegill limit in Minnesota. N. Am. J. Fish. Manag. 2005, 25, 203–210. [Google Scholar] [CrossRef]
  17. Rypel, A.L.; Lyons, J.; Griffin, J.; Simonson, T.D. Seventy-year retrospective on size-structure changes in the recreational fisheries of Wisconsin. Fisheries 2016, 41, 230–243. [Google Scholar] [CrossRef]
  18. Snow, H.E.; Staggs, M.D. Factors Related to Fish Growth in Northwestern Wisconsin Lakes; Wisconsin Department of Natural Resources, Bureau of Fish Management Report 162; The Wisconsin Department of Natural Resources: Madison, WI, USA, 1994. [Google Scholar]
  19. Jackson, D.C.; Brown-Peterson, N.J. Habitat, accessibility, and watershed variables as they relate to Largemouth Bass and Bluegill in Mississippi’s National Forest impoundments. J. Southeast. Assoc. Fish Wildl. Agencies 1995, 49, 26–36. [Google Scholar]
  20. Trebitz, A.S.; Carpenter, S.; Cunningham, P.; Johnson, B.; Lillie, R.; Marshall, D.; Martin, T.; Narf, R.; Pellett, T.; Stewart, S.; et al. A model of Bluegill-Largemouth Bass interactions in relation to aquatic vegetation and its management. Ecol. Model. 1997, 94, 139–156. [Google Scholar] [CrossRef]
  21. Tomcko, C.M.; Pierce, R.B. The relationship of Bluegill growth, lake morphometry, and water quality in Minnesota. Trans. Am. Fish. Soc. 2001, 130, 317–321. [Google Scholar] [CrossRef]
  22. Aday, D.D.; Shoup, D.; Veviackas, J.; Kline, J.; Wahl, D.H. Prey community responses to Bluegill and Gizzard Shad foraging: Implications for growth of juvenile Largemouth Bass. Trans. Am. Fish. Soc. 2005, 134, 1091–1102. [Google Scholar] [CrossRef]
  23. Michaletz, P.H.; Obrecht, D.; Jones, J.R. Influence of environmental variables and species interactions on sport fish communities in small Missouri impoundments. N. Am. J. Fish. Manag. 2012, 32, 1146–1159. [Google Scholar] [CrossRef]
  24. Michaletz, P.H. Interrelationships among Bluegill demographics, predator and competitor abundances and impoundment characteristics. J. Freshw. Ecol. 2020, 35, 491–506. [Google Scholar] [CrossRef]
  25. Jones, J.R.; Hoyer, M.V. Sportfish harvest predicted by summer chlorophyll-α concentration in Midwestern lakes and reservoirs. Trans. Am. Fish. Soc. 1982, 111, 176–179. [Google Scholar] [CrossRef]
  26. Diana, M.J.; Stein, J.; Oplinger, R.; Aday, D.; Hoxmeier, J.; Claussen, J.; Philipp, D.; Wahl, D.H. Quality Management of Bluegill: Factors Affecting Population Size Structure; Final Report to the Division of Fisheries, Illinois Department of Natural Resources, Federal Aid Project F-128-R; Illinois Natural History Survey, Center for Aquatic Ecology: Springfield, IL, USA, 2007. [Google Scholar]
  27. Knuth, D.S. Effects of Abiotic and Biotic Factors on Bluegill Reproduction and Growth in Seven Unexploited Surface Coal Mine Lakes. Master’s Thesis, Southern Illinois University, Carbondale, IL, USA, 2007. [Google Scholar]
  28. Gerking, S.D. Production and food utilization in a population of Bluegill sunfish. Ecol. Monogr. 1962, 32, 31–78. [Google Scholar] [CrossRef]
  29. Mittelbach, G.G. Competition among refuging sunfishes and effects of fish density on littoral zone invertebrates. Ecology 1988, 69, 614–623. [Google Scholar] [CrossRef]
  30. Schneider, J.C. Dynamics of quality Bluegill populations in two Michigan lakes with dense vegetation. N. Am. J. Fish. Manag. 1999, 19, 97–109. [Google Scholar] [CrossRef]
  31. Paukert, C.P.; Willis, D.; Klammer, J.A. Effects of predation and environment on quality of Yellow Perch and Bluegill populations in Nebraska Sandhill lakes. N. Am. J. Fish. Manag. 2002, 22, 86–95. [Google Scholar] [CrossRef]
  32. Cross, T.K.; McInerny, M.C. Spatial habitat dynamics affecting Bluegill abundance in Minnesota bass–panfish lakes. N. Am. J. Fish. Manag. 2005, 25, 1051–1066. [Google Scholar] [CrossRef]
  33. Hoxmeier, R.J.H.; Aday, D.; Wahl, D.H. Examining interpopulation variation in Bluegill growth rates and size structure: Effects of harvest, maturation, and environmental variables. Trans. Am. Fish. Soc. 2009, 138, 423–432. [Google Scholar] [CrossRef]
  34. Bevil, M.C.; Weber, M.J. Relative effects of density dependence versus environmental factors on Bluegill populations. N. Am. J. Fish. 2018, 38, 140–151. [Google Scholar] [CrossRef]
  35. FWC (Florida Fish and Wildlife Conservation Commission). The Economic Impacts of Saltwater Fishing in Florida; FWC: Tallahassee, FL, USA, 2022; Available online: https://myfwc.com/conservation/value/saltwater-fishing/#:~:text=4%20million%20Florida%20anglers%3A%20FWC,from%20the%202011%20National%20Survey (accessed on 2 February 2023).
  36. FWC (Florida Fish and Wildlife Conservation Commission). Manager Report (2020–2021), Fish and Wildlife Research Institute; FWC Freshwater Fisheries Research: Tallahassee, FL, USA, 2022. [Google Scholar]
  37. Schramm, H.L.; Jirka, K.J. Epiphytic macroinvertebrates as a food resource for Bluegills in Florida lakes. Trans. Am. Fish. Soc. 1989, 118, 416–426. [Google Scholar] [CrossRef]
  38. Canfield, D.E., Jr.; Hoyer, M.V. Aquatic Macrophytes and Their Relation to the Limnology of Florida Lakes; Bureau of Aquatic Plant Management, Florida Department of Natural Resources, Final Report: Tallahassee, FL, USA, 1992; Available online: https://lakewatch.ifas.ufl.edu/research/past-project-reports/ (accessed on 2 February 2023).
  39. Werner, E.E.; Hall, D.J. Niche shifts in sunfishes: Experimental evidence and significance. Science 1976, 191, 404–406. [Google Scholar] [CrossRef]
  40. Clugston, J.P. Centrarchid spawning in the Florida Everglades. Q. J. Fla. Acad. Sci. 1966, 29, 137–143. [Google Scholar]
  41. Hoyer, M.V.; Canfield, D.E., Jr. Largemouth Bass abundance and aquatic vegetation in Florida lakes: An empirical analysis. J. Aquat. Plant Manag. 1996, 34, 23–32. [Google Scholar]
  42. Parson, T.R.; Strickland, J.D. Discussion of spectrophotometric determination of marine-plant pigments, with revised equations of ascertaining chlorophylls and carotenoids. J. Mar. Res. 1963, 21, 155–163. [Google Scholar]
  43. Yentsch, C.S.; Menzel, D.W. A method for the determination of phytoplankton chlorophyll and phaeophytin by fluorescence. Deep. Sea Res. 1963, 10, 221–231. [Google Scholar] [CrossRef]
  44. Canfield, D.E., Jr.; Langeland, K.; Maceina, M.; Haller, W.; Shireman, J.; Jones, J.R. Trophic state classification of lakes with aquatic macrophytes. Can. J. Fish. Aquat. Sci. 1983, 40, 1713–1718. [Google Scholar] [CrossRef]
  45. Maceina, M.J.; Shireman, J.V. The use of a recording fathometer for the determination of distribution and biomass of hydrilla. J. Aquat. Plant Manag. 1980, 18, 34–39. [Google Scholar]
  46. Allen, M.S.; Hoyer, M.; Canfield, D.E., Jr. Factors related to Black Crappie occurrence, density, and growth in Florida lakes. N. Am. J. Fish. Manag. 1998, 18, 864–871. [Google Scholar] [CrossRef]
  47. Shireman, J.V.; Colle, D.; Durant, D.F. Efficiency of rotenone sampling with large and small block nets in vegetated and unvegetated habitats. Trans. Am. Fish. Soc. 1981, 110, 77–80. [Google Scholar] [CrossRef]
  48. Schramm, H.L., Jr.; Doerzbacher, J.F. Use of otoliths to age Black Crappie from Florida. J. Southeast. Assoc. Fish Wildl. Agencies 1982, 36, 95–105. [Google Scholar]
  49. Venables, W.N.; Dichmont, C.M. GLMs, GAMs and GLMMs: An overview of theory for applications in fisheries research. Fish. Res. 2004, 70, 319–337. [Google Scholar] [CrossRef]
  50. Agha, M.; Losee, J.; Litz, M.; Smith, C.; Schaffler, J.; Patton, W.; Dufault, A.; Madel, G.M. Temporal patterns and ecosystem correlates of Chum Salmon Oncorhynchus keta migration phenology in the Pacific Northwest. Can. J. Fish. Aquat. Sci. 2021, 78, 1565–1575. [Google Scholar] [CrossRef]
  51. Gabelhouse, D.W., Jr. A length-categorization system to assess fish stocks. N. Am. J. Fish. Manag. 1984, 4, 273–285. [Google Scholar] [CrossRef]
  52. Allen, M.S.; Hoyer, M.; Canfield, D.E., Jr. Factors related to Gizzard Shad and Threadfin Shad occurrence and abundance in Florida lakes. J. Fish Biol. 2000, 57, 291–302. [Google Scholar]
  53. Zar, J.H. Biostatistical Analysis, 2nd ed.; Prentice-Hall: Englewood Cliffs, NJ, USA, 1984. [Google Scholar]
  54. Burnham, K.P.; Anderson, D.R. Model Selection and Multimodel Inference; Springer Science: New York, NY, USA, 2002. [Google Scholar]
  55. Wood, S.N. Generalized Additive Models: An Introduction with R, 2nd ed.; Chapman and Hall/CRC: Boca Raton, FL, USA, 2017. [Google Scholar]
  56. Hyndman, R.J.; Athanasopoulos, G. Forecasting: Principles and Practice, 2nd ed.; OTexts: Melbourne, Australia, 2018. [Google Scholar]
  57. Florida Atlas of Lakes. Florida Atlas of Lakes; University of South Florida Water Institute: Tampa, FL, USA, 2022; Available online: https://wateratlas.usf.edu/atlasoflakes/florida/ (accessed on 2 February 2023).
  58. Florida LAKEWATCH. Florida LAKEWATCH Reports; University of Florida: Gainesville, FL, USA, 2022; Available online: https://lakewatch.ifas.ufl.edu/datareports/?view=meta (accessed on 2 February 2023).
  59. R Development Core Team. R: A Language And Environment for Statistical Computing; R Foundation for Statistical Computing: Vienna, Austria, 2019. [Google Scholar]
  60. Forsberg, C.; Ryding, S. Eutrophication parameters and trophic state indices in 30 Swedish waste-receiving lakes. Arch. Hydrobiol. 1980, 89, 189–207. [Google Scholar]
  61. Oglesby, R.T. Relationships of fish yield to lake phytoplankton standing crop, production, and morphoedaphic factors. J. Fish. Res. Board Can. 1977, 34, 2271–2279. [Google Scholar] [CrossRef]
  62. Schramm, H.L.; Willis, D. Assessment and harvest of Largemouth Bass–Bluegill ponds. In Small Impoundment Management in North America; Neal, J.W., Willis, D.W., Eds.; American Fisheries Society: Bethesda, MD, USA, 2012; pp. 181–213. [Google Scholar]
  63. Mittelbach, G.G. Foraging efficiency and body size: A study of optimal diet and habitat use by Bluegills. Ecology 1981, 62, 1370–1386. [Google Scholar] [CrossRef]
  64. Werner, E.E.; Hall, D.J. Ontogenetic habitat shifts in Bluegill: The foraging rate–predation risk trade-off. Ecology 1988, 69, 1352–1366. [Google Scholar] [CrossRef]
  65. Mittelbach, G.G.; Osenberg, C.W. Stage-structured interactions in Bluegill: Consequences of adult resource variation. Ecology 1993, 74, 2381–2394. [Google Scholar] [CrossRef]
  66. Crowder, L.B.; Cooper, W.E. Structural complexity and fish-prey interactions in ponds: A point of view. In Response of Fish to Habitat Structure in Standing Water; Johnson, D.L., Stein, R.A., Eds.; American Fisheries Society, North Central Division, Special Publication 6: Bethesda, MD, USA, 1979; pp. 2–10. [Google Scholar]
  67. Savino, J.F.; Stein, R.A. Predator-prey interactions between Largemouth Bass and Bluegills as influenced by simulated submersed vegetation. Trans. Am. Fish. Soc. 1982, 111, 255–266. [Google Scholar] [CrossRef]
  68. Pothoven, S.A.; Vondracek, B.; Pereira, D.L. Effects of vegetation removal on Bluegill and Largemouth Bass in two Minnesota lakes. N. Am. J. Fish. Manag. 1999, 19, 748–757. [Google Scholar] [CrossRef]
  69. Gotceitas, V.; Colgan, P. Selection between densities of artificial vegetation by young Bluegills avoiding predation. Trans. Am. Fish. Soc. 1987, 116, 40–49. [Google Scholar] [CrossRef]
  70. Lillie, R.A.; Budd, J. Habitat architecture of Myriophyllum spicatum L. as an index to habitat quality for fish and macroinvertebrates. J. Freshw. Ecol. 1992, 7, 113–125. [Google Scholar] [CrossRef]
  71. Collingsworth, P.D.; Kohler, C.C. Abundance and habitat use of juvenile sunfish among different macrophyte stands. Lake Reserv. Manag. 2010, 26, 35–42. [Google Scholar] [CrossRef]
  72. Scarnecchia, D.L. A reappraisal of gars and bowfins in fishery management. Fisheries 1992, 17, 6–12. [Google Scholar] [CrossRef]
  73. Bransky, J.W.; Dorn, N.J. Prey use of wetland benthivorous sunfishes: Ontogenetic, interspecific and seasonal variation. Environ. Biol. Fishes 2013, 96, 1329–1340. [Google Scholar] [CrossRef]
  74. Porter, N.J.; Bonvechio, T.; McCormick, J.; Quist, M.C. Population dynamics of Bowfin in a South Georgia reservoir: Latitudinal comparisons of population structure, growth, and mortality. J. Southeast. Assoc. Fish Wildl. Agencies 2014, 2014, 103–109. [Google Scholar]
  75. Hinch, S.G.; Collins, N.C. Relationships of littoral fish abundance to water chemistry and macrophyte variables in central Ontario lakes. Can. J. Fish. Aquat. Sci. 1993, 50, 1870–1878. [Google Scholar] [CrossRef]
  76. Haley, N.V., III; Wright, R.; DeVries, D.; Allen, M. Privately owned small impoundments in central Alabama: A survey and evaluation of management techniques for Largemouth Bass and Bluegill. N. Am. J. Fish. Manag. 2012, 32, 1180–1190. [Google Scholar] [CrossRef]
  77. Michaletz, P.H.; Doisy, K.; Rabeni, C.F. Influences of productivity, vegetation, and fish on macroinvertebrate abundance and size in Midwestern USA impoundments. Hydrobiologia 2005, 543, 147–157. [Google Scholar] [CrossRef]
  78. Bayley, P.B.; Austen, D.J. Capture efficiency of a boat electrofisher. Trans. Am. Fish. Soc. 2002, 131, 435–451. [Google Scholar] [CrossRef]
  79. Hangsleben, M.A.; Allen, M.; Gwinn, D.C. Evaluation of electrofishing catch per unit effort for indexing fish abundance in Florida lakes. Trans. Am. Fish. Soc. 2013, 142, 247–256. [Google Scholar] [CrossRef]
  80. Tomcko, C.M.; Pierce, R.B. Bluegill recruitment, growth, population size structure, and associated factors in Minnesota Lakes. N. Am. J. Fish. Manag. 2005, 25, 171–179. [Google Scholar] [CrossRef]
  81. Lemly, A.D.; Dimmick, J.F. Growth of young-of-the-year and yearling centrarchids in relation to zooplankton in the littoral zone of lakes. Copeia 1982, 1982, 305–321. [Google Scholar] [CrossRef]
  82. Theiling, C.H. The Relationships between Several Limnological Factors and Bluegill Growth in Michigan Lakes; Michigan Department of Natural Resources, Fisheries Research Report 1970; The Michigan Department of Natural Resources: Ann Arbor, MI, USA, 1990. [Google Scholar]
  83. Fletcher, C.M.; Collins, S.; Nannini, M.; Wahl, D.H. Competition during early ontogeny: Effects of native and invasive planktivores on the growth, survival, and habitat use of Bluegill. Freshw. Biol. 2019, 64, 697–707. [Google Scholar] [CrossRef]
  84. Anderson, R.O. Management of small warm water impoundments. Fisheries 1976, 5–7, 26–28. [Google Scholar]
  85. Guy, C.S.; Willis, D.W. Structural relationships of Largemouth Bass and Bluegill populations in South Dakota ponds. N. Am. J. Fish. Manag. 1990, 10, 338–343. [Google Scholar] [CrossRef]
  86. Otis, K.J.; Piette, R.; Keppler, J.; Rasmussen, P.W. A Largemouth Bass closed fishery to control an overabundant Bluegill population in a Wisconsin lake. J. Freshw. Ecol. 1998, 13, 391–403. [Google Scholar] [CrossRef]
  87. Novinger, G.D.; Legler, R.E. Bluegill population structure and dynamics. In New Approaches to the Management of Small Impoundments; Novinger, G.D., Dillard, J.G., Eds.; American Fisheries Society, North Central Division, Special Publication 5: Bethesda, MD, USA, 1978; pp. 37–49. [Google Scholar]
  88. Wiener, J.G.; Hanneman, W.R. Growth and condition of Bluegills in Wisconsin lakes: Effects of population density and lake pH. Trans. Am. Fish. Soc. 1982, 111, 761–767. [Google Scholar] [CrossRef]
  89. Tomcko, C.M. Bluegill Growth Rates in Minnesota; Minnesota Department of Natural Resources, Section of Fisheries Investigational Report Number 458; The Minnesota Department of Natural Resources: St. Paul, MI, USA, 1997. [Google Scholar]
  90. Schultz, R.D.; Jackson, Z.; Quist, M.C. Relating impoundment morphometry and water quality to Black Crappie, Bluegill, and Largemouth Bass populations in Iowa. In American Fisheries Society Symposium 62:479–491; American Fisheries Society: Bethesda, MD, USA, 2008. [Google Scholar]
  91. Nease, P.A. Nearshore Habitat and Land-Use Effects on Trophic Interactions and Growth of Largemouth Bass and Bluegill in Indiana’s Glacial Lakes. Master’s Thesis, Southern Illinois University, Carbondale, IL, USA, 2019. [Google Scholar]
  92. Peterson, N.R.; VanDeHey, J.; Willis, D.W. Size and age at maturity of Bluegill Lepomis macrochirus in southeastern South Dakota impoundments. J. Freshw. Ecol. 2010, 25, 303–312. [Google Scholar] [CrossRef]
  93. Sass, G.G.; Carpenter, S.; Gaeta, J.; Kitchell, J.; Ahrenstorff, T.D. Whole-lake addition of coarse woody habitat: Response of fish populations. Aquat. Sci. 2012, 74, 255–266. [Google Scholar] [CrossRef]
  94. Huber, W.C.; Brezonik, P.; Heaney, J.; Dickinson, R.; Preston, S.; Dwornik, D.; DeMaio, M.A. A classification of Florida lakes. Final report prepared for the Florida Department of Environmental Regulation. In Report ENV-05-82-1; Department of Environmental Engineering Sciences: Gainesville, FL, USA, 1982. [Google Scholar]
  95. Canfield, D.E., Jr. Prediction of chlorophyll a concentrations in Florida lakes: The importance of phosphorus and nitrogen. Water Resour. Bull. 1983, 19, 255–262. [Google Scholar] [CrossRef]
  96. Modde, T.; Scalet, C.G. Latitudinal growth effects on predator-prey interactions between Largemouth Bass and Bluegills in ponds. N. Am. J. Fish. Manag. 1985, 5, 227–232. [Google Scholar] [CrossRef]
  97. Drake, M.T.; Claussen, J.; Philipp, D.; Pereira, D.L. A comparison of Bluegill reproductive strategies and growth among lakes with different fishing intensities. N. Am. J. Fish. Manag. 1997, 17, 496–507. [Google Scholar] [CrossRef]
  98. Hankinson, T.L. Ecological notes on the fishes of Walnut Lake, Michigan. Trans. Am. Fish. Soc. 1911, 40, 195–206. [Google Scholar] [CrossRef]
  99. Ricker, W.E. Natural mortality among Indiana Bluegill sunfish. Ecology 1945, 26, 111–121. [Google Scholar] [CrossRef]
  100. Sammons, S.M.; Maceina, M.J. Variation in growth and survival of Bluegills and Redbreast Sunfish in Georgia rivers. N. Am. J. Fish. Manag. 2009, 29, 101–108. [Google Scholar] [CrossRef]
  101. Dequine, J.F. Management of Florida’s fresh-water fisheries. Trans. Am. Fish. Soc. 1950, 78, 38–41. [Google Scholar] [CrossRef]
  102. Belk, M.C.; Hales, L.S., Jr. Predation-induced differences in growth and reproduction of Bluegills (Lepomis macrochirus). Copeia 1993, 1993, 1034–1044. [Google Scholar] [CrossRef]
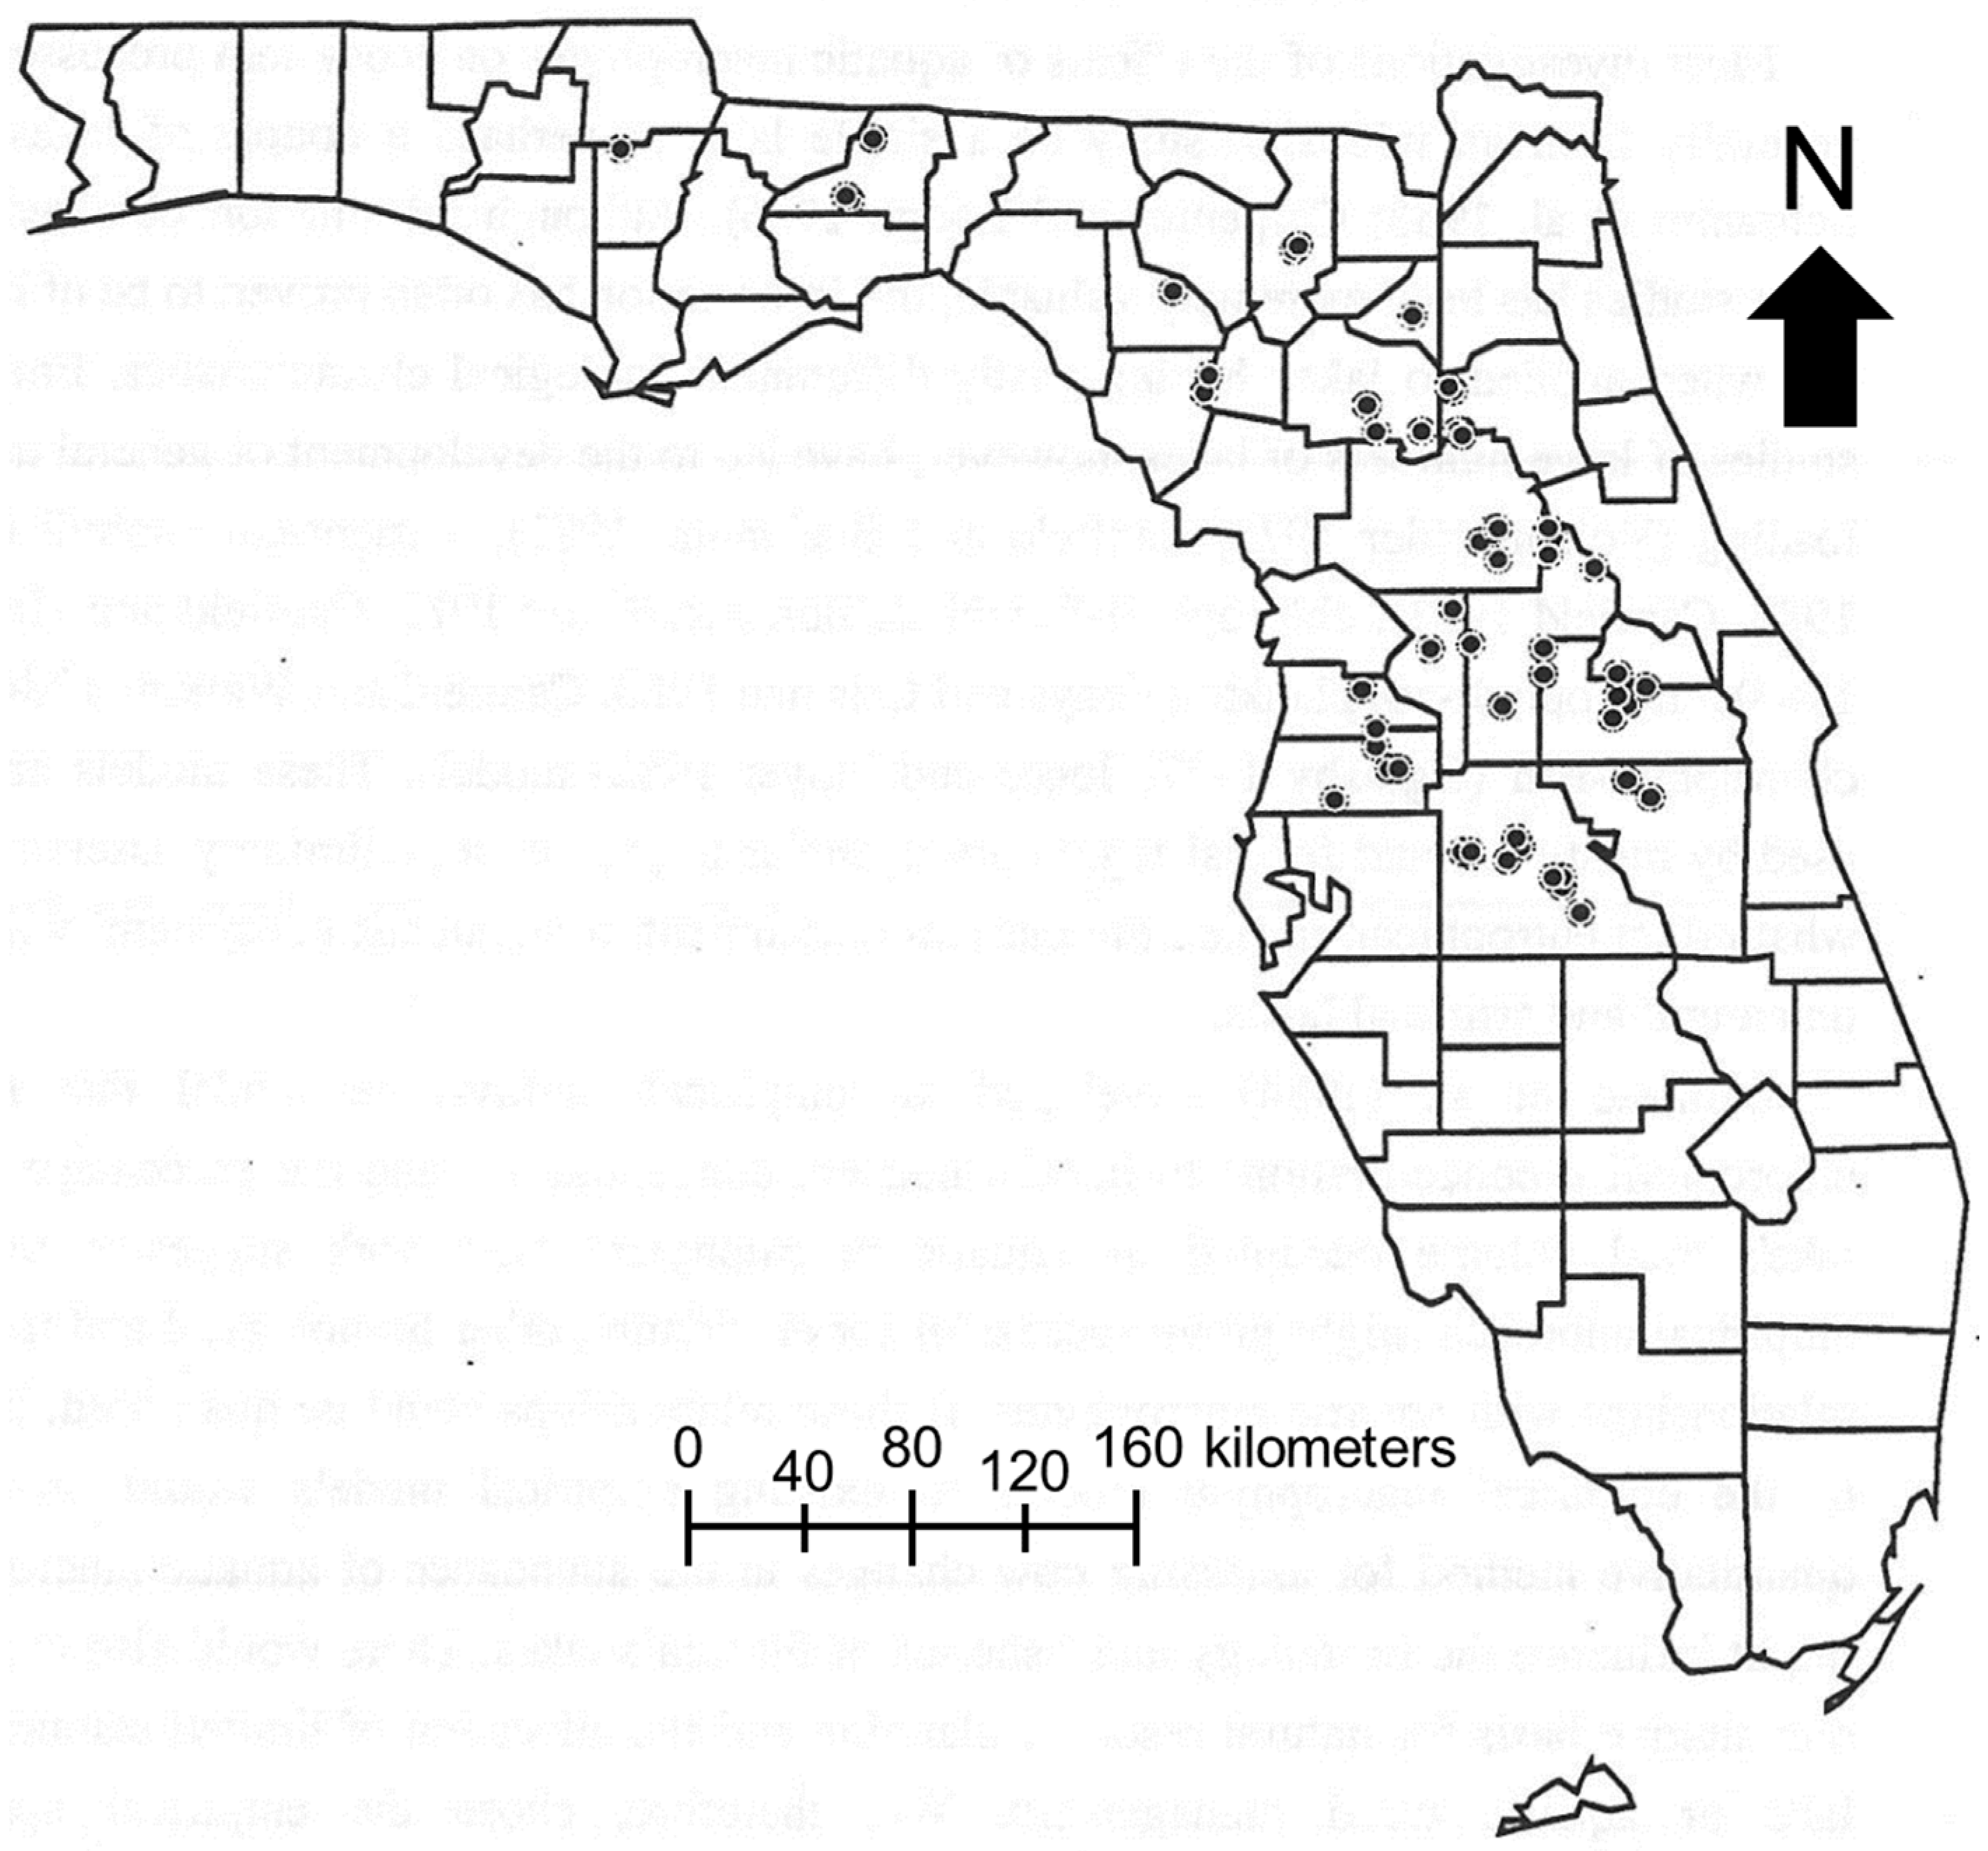
Figure 1. Map of Florida lakes sampled in this study (black circles). Figure modified from [38].
Fishes 08 00100 g001
Figure 2. Generalized additive model relating Bluegill density (fish/ha) to (A) adjusted chlorophyll-a concentration (ACHLA, μg/L, p = 0.005), (B) total zooplankton density (ALLZOOP, organisms/L, p = 0.030), and (C) percent of lake volume inhabited with macrophytes (PVI, p = 0.050) in Florida lakes. Shaded areas are 95% confidence intervals.
Fishes 08 00100 g002
Figure 3. Generalized additive model relating Bluegill catch per unit effort (CPUE, fish/h by electrofishing) to (A) chlorophyll-a concentration (CHLA, μg/L, p < 0.001) and (B) percent of lake volume inhabited with macrophytes (PVI, p = 0.001) in Florida lakes. Shaded areas are 95% confidence intervals.
Fishes 08 00100 g003
Figure 4. Generalized additive model relating Bluegill mean back-calculated length at age 3 (MLA-3, mm) to (A) chlorophyll-a concentration (CHLA, μg/L, p = 0.007), (B) total zooplankton density (ALLZOOP, organisms/L, p = 0.009), and (C) stock-length Florida Bass catch per unit effort (Bass CPUE, fish/h, p = 0.031) in Florida lakes. Shaded areas are 95% confidence intervals.
Fishes 08 00100 g004
Figure 5. Generalized additive model relating Bluegill proportional size distribution (PSD) to (A) chlorophyll-a concentration (CHLA, μg/L, p = 0.006) and (B) Bluegill density (fish/ha, p < 0.001) in Florida lakes. Shaded areas are 95% confidence intervals.
Fishes 08 00100 g005
Figure 6. Generalized additive model relating proportional size distribution of preferred-length Bluegills (PSD-P) to (A) chlorophyll-a concentration (CHLA, μg/L, p < 0.001) and (B) Bluegill density (fish/ha, p < 0.001) in Florida lakes. Shaded areas are 95% confidence intervals.
Fishes 08 00100 g006
Table 1. Characteristics of Florida lakes in this study summarized by mean, median, number of lakes (N), standard error of the mean (SE), range, and coefficient of variation (CV). Adjusted chlorophyll-a concentration is the projected chlorophyll-a concentration value if nitrogen and phosphorus in aquatic macrophytes were added to the water column. Bluegill density was measured using rotenone applied to 0.08 ha block nets. Abbreviations include percent of total lake volume inhabited by macrophytes (PVI), electrofishing catch per unit effort (CPUE), proportional size distribution (PSD), PSD of preferred-length fish (PSD-P), and stock length (SL). Sample sizes are reduced for Bluegill lengths at age because, in some lakes, fish were not collected on the first day of rotenone sampling, when otoliths were removed to evaluate growth.
FactorMean MedianNSERange CV
Surface area (ha)406.055.060226.02–12,4124.31
Chlorophyll-a (μg/L)28.19.5606.01–2411.66
Adjusted chlorophyll-a (μg/L)50.021.0608.91–3501.37
Zooplankton density (organisms/L)66.856.3607.211–3140.82
PVI23.68.5604.10.3–1001.36
Bluegill density (fish/ha)3618.31773.160845.154–40,2151.78
Bluegill CPUE (fish/h)191.378.96054.30–30622.20
Bluegill length at age 1 (mm)64.261.0552.438–1100.28
Bluegill length at age 2 (mm)120.9118.0552.886–1750.17
Bluegill length at age 3 (mm)159.3156.5543.1111–2120.14
Bluegill PSD 39.031.3604.10–1000.53
Bluegill PSD-P18.08.7603.00–930.38
Florida Bass CPUE (SL fish/h)21.516.1602.80–1260.97
Florida Bass PSD42.044.0603.60–1000.67
Florida Bass PSD-P17.011.0602.30–611.01
Table 2. Pairwise correlations (Pearson product-moment correlation coefficients) among abiotic and biotic factors used to model Bluegill population demographics. Abbreviations include surface area (SA), chlorophyll-a concentration (CHLA), adjusted chlorophyll-a concentration (ACHLA), zooplankton density (ALLZOOP), percent of total lake volume inhabited by macrophytes (PVI), Bass (Florida Bass), electrofishing catch per unit effort (CPUE), proportional size distribution (PSD), and PSD of preferred-length fish (PSD-P). Bass CPUE denotes CPUE of stock-length Florida Bass.
VariableSACHLAACHLA ALLZOOPPVI Bluegill DensityBass CPUEBass PSD
SA --------
CHLA0.45-------
ACHLA 0.340.72------
ALLZOOP0.330.310.36-----
PVI 0.02−0.340.250.25----
Bluegill density0.010.250.270.21−0.05---
Bass CPUE0.230.300.08<0.01−0.230.28--
Bass PSD 0.070.220.290.13−0.040.01−0.29-
Bass PSD-P0.090.28−0.05−0.15−0.550.130.120.24
Disclaimer/Publisher’s Note: The statements, opinions and data contained in all publications are solely those of the individual author(s) and contributor(s) and not of MDPI and/or the editor(s). MDPI and/or the editor(s) disclaim responsibility for any injury to people or property resulting from any ideas, methods, instructions or products referred to in the content.