Article

Genetic Diversity of Jinshaia sinensis (Cypriniformes, Balitoridae) Distributed Upstream of the Yangtze River

Laboratory of Water Ecological Health and Environmental Safety, School of Life Sciences, Chongqing Normal University, Chongqing 401331, China
*
Author to whom correspondence should be addressed.
Fishes 2023, 8(2), 75; https://doi.org/10.3390/fishes8020075
Submission received: 7 December 2022 / Revised: 24 January 2023 / Accepted: 27 January 2023 / Published: 28 January 2023

Abstract

:
The upper reaches of the Yangtze River (upper YR) are a biological zone with extremely rich fish diversity, especially endemic fish. However, long-term human interference, such as environmental pollution and cascade hydropower construction, has significantly changed the habitat of many fish and is threatening the number and genetic diversity of fish populations. Jinshaia sinensis is a typical small and endemic but rare fish that is found in the upper YR, and its genetic diversity and structure still need further study. To understand the current levels of genetic diversity in J. sinensis, we analyzed the genetic diversity, population history, genetic structure, etc., of three J. sinensis populations based on two mitochondrial genes (the cytochrome-c oxidase subunit I, COI, and cytochrome-b gene, Cytb) and two nuclear genes (recombination-activating protein 1, RAG1, and rhodopsin, RH). The genetic diversity analysis indicated that J. sinensis had high genetic diversity, with high haplotype diversity (h) and nucleotide diversity (Pi). Population pairwise FST analysis revealed a significant genetic divergence between the Lijiang and Luzhou populations for all genes and between the Panzhihua and Luzhou populations, except for the COI gene; however, analyses of molecular variance (AMOVA) showed no significant geographic genetic structure among populations, and gene flow analysis also indicated a certain degree of gene exchange among populations. Haplotype network structure analyses revealed low levels of shared haplotypes among populations. Neutrality test and mismatch distribution results indicated that only the Lijiang population had experienced obvious population expansion. Overall, these results indicate that J. sinensis is still a single evolutionarily significant unit, but when considering the threat of habitat disturbance to the population, it is still necessary to carry out long-term genetic monitoring on J. sinensis and on other endemic fishes with similar ecological habits in order to maintain the genetic diversity of fishes in the upper YR.

1. Introduction

The Yangtze River (YR), the longest river in China, is divided into upstream, midstream, and downstream regions in Yichang of Hubei Province and Hukou of Jiangxi Province. The upstream basin accounts for 58.9% of the total acreage of the Yangtze River basin [1]. Compared with the middle and lower reaches, the terrain of the upper reaches is more complex, mainly mountainous and plateauing, with a large altitudinal gradient, rapid water flow, and winding rivers [2]. The unique and complicated hydrology of the river results in the rich fish diversity found in the upper YR, which includes more than 200 species belonging to 112 genera, 22 families, and 9 orders, and at least 100 endemic species [3,4].
As an endemic fish in the upper YR and one of the protected species in the “National Nature Reserve for Rare and Endemic Fishes in the Upper Yangtze River”, Jinshaia sinensis is a benthic, omnivorous, rapids-loving, drifting egg-laying fish [5,6,7] mainly distributed in the rapids velocity river section in the Chongqing, Sichuan and Yunan region, and its life type is the most important and representative ecological group in the upper YR. For fish laying drifting eggs, a higher velocity of water flow is necessary for spawning [8]. Moreover, the drifting eggs and larvae need to drift along with the current for development. When the flow velocity is less than 0.25 m/s, the eggs will sink to the bottom, their development will be inhibited, and larvae without strong swimming ability will not be able to cross the barrier [9]. Unfortunately, the suitable habitat for J. sinensis and most other endemic fish species is being continuously reduced due to long-term human interference through environmental pollution, cascade hydropower, and shipping [10]. An extremely obvious feature is that the upper YR has been developed with abundant hydropower resources due to its unique high mountain canyon terrain. The development of river terraces slows down turbulent water flow, intensifies the pooling of pollutants, destroys the living environment of fish living in the rapids, fragments the original habitat, and leads to a reduction or disappearance of spawning areas [11,12]. Moreover, step dams cut off the migratory routes and limit the genetic exchange between fish upstream and downstream of the dam, resulting in decreased genetic diversity, especially in the upstream fish [13,14]. The genetic structure of the population may also be affected, ultimately altering the evolutionary potential of the species and increasing the risk of local extinction [11,15].
High genetic variation is an important characteristic for the long-term survival of natural populations, and assists their adaptation to changing environmental conditions [16,17]. Molecular markers provide important information on fish genetic population structures and gene flow between populations, and provide early warning of genetic bottlenecks. Mitochondrial and nuclear genes are commonly used to study genetic variation within and between populations of fish species [18,19,20]. At present, research on the protection of J. sinensis mainly involves the investigation of spawning grounds, changes in community structure pattern, and growth and development [6,21,22], while studies on its genetic diversity are still relatively scarce, involving only certain gene fragments, such as microsatellite and D-loop fragments [23,24], making the conservation perspective less comprehensive. Therefore, more studies on population genetics are necessary to enhance the conservation of the genetic diversity of J. sinensis. In addition, it is also useful to draw on understanding of the adaptive evolution of other endemic fish species of the same ecotype in the upper YR.
In this study, we obtained J. sinensis populations from three river segments in the upper YR, and extracted two mitochondrial genes (the cytochrome-c oxidase subunit I, COI, and cytochrome-b gene, Cytb) and two nuclear genes (recombination-activating protein 1, RAG1, and rhodopsin, RH) which have been commonly used in genetic diversity studies of fish [25,26]. At the same time, we also collected the genetic resource data available in the public database. Finally, we combined these data to reveal the genetic diversity, genetic differentiation degree, population history, and genetic structure of the population via an analysis of DNA polymorphism, neutrality, a median-joining network of haplotypes, population genetic differences, and gene flow, aiming to provide an expanded scientific basis and genetic information for the protection of J. sinensis and the other endemic fish in the upper YR.

2. Materials and Methods

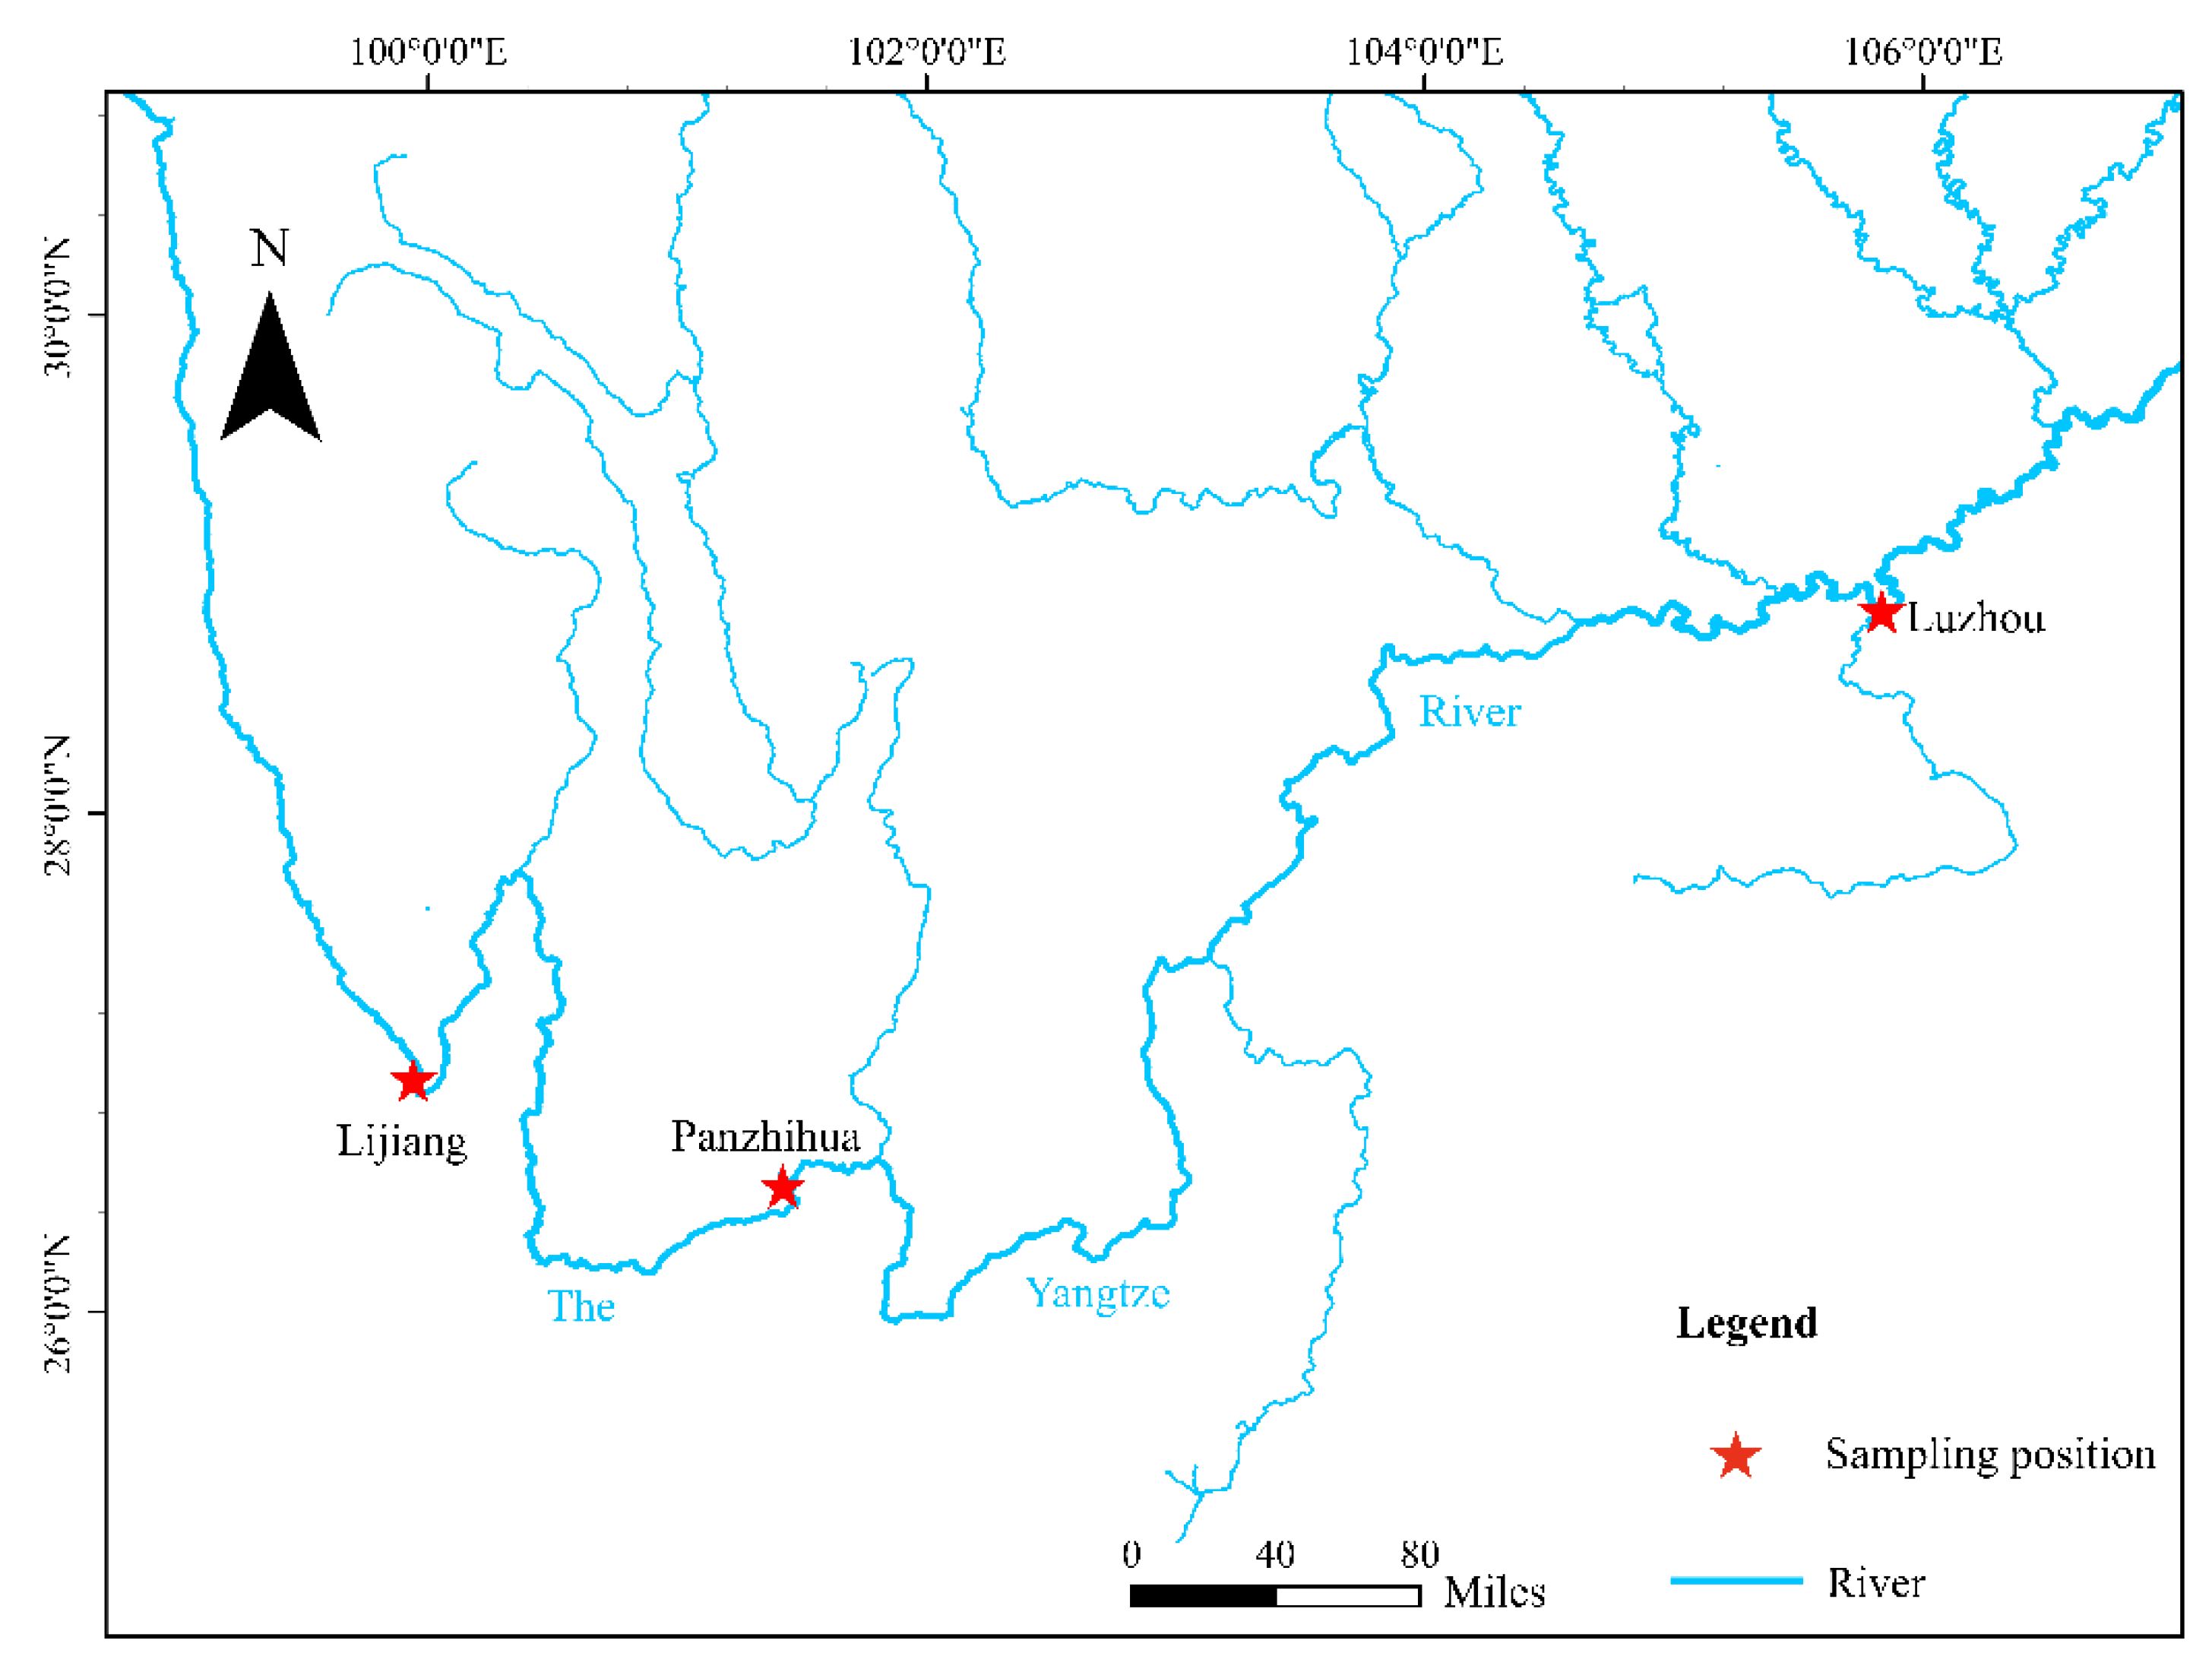
2.1. Sampling and DNA Extraction

Three sampling sites were set up in the upper YR area, Lijiang, Panzhihua, and Luzhou, with six hydropower dam barriers between Lijiang and Panzhihua and five hydropower dam barriers between Panzhihua and Luzhou. A total of 51 specimens of J. sinensis were collected from 3 sites of Lijiang (22 specimens), Panzhihua (8 specimens), and Luzhou (21 specimens) from April 2018 to August 2020 by purchasing the fish at the fishing port docks (Figure 1 and Table 1). All the specimens were preserved in 100% ethanol in the Laboratory of Water Ecological Health and Environmental Safety, Chongqing Normal University. The small number of sampling sites and samples in this study was mainly due to the significant decrease in fishing intensity as a result of the 10 year fishing ban in the Yangtze River. The total genomic DNA was extracted from a small piece of abdominal muscle tissue using the TaKaRa MiniBEST Universal Genomic DNA Extraction Kit Version 5.0 (TaKaRa Biotech, Beijing, China), and the experiments were carried out according to the manufacturer’s instructions. The extracted DNA was stored at −20 °C. All animal experiments were performed according to the Guidelines for the Care and Use of Laboratory Animals (8th edition, National Academies Press, Washington, DC, USA).

2.2. PCR Amplification and Sequencing

The primers used to amplify the mitochondrial genes (COI and Cytb) and nuclear genes (RAG1 and RH) are listed in Table S1 [27,28,29]. The 30 µL reaction mixture contained 7.8 µL of sterilized ultrapure water, 1.2 µL of each primer (8 mmol/L), 4.8 µL of DNA template (<0.01 g/L), and 15 µL of 2 × Es Taq MasterMix (Es Taq DNA polymerase, MgCl2, and 2.9 mmol/L each dNTPs). The PCR reaction conditions were as follows: initial denaturation at 94 °C for 2 min followed by 32 cycles of denaturation at 94 °C for 30 s, annealing at 48–56 °C for 30 s, and extension at 72 °C for 60 s, followed by a final elongation step at 72 °C for 2 min. The PCR products were resolved on a 1% agarose gel and then sent to commercial sequencing companies for purification and sequencing. The sequencing primers were consistent with the PCR primers.

2.3. Sequences Information

Four gene fragments were partially successfully amplified from the 51 J. sinensis specimens and deposited in the database after alignment. Meanwhile, some available gene sequences were obtained from the NCBI database download. The final sequence data used for population analysis were as follows: 57 sequences with 603 bp for the COI gene (Lijiang, 22 sequences; Panzhihua, 14 sequences; and Luzhou, 21 sequences); 55 sequences with 1056 bp for the Cytb gene (Lijiang, 22 sequences; Panzhihua, 12 sequences; and Luzhou, 21 sequences); 48 single-copy sequences with 1,273 bp for the RAG1 gene (Lijiang, 21 sequences; Panzhihua, 6 sequences; and Luzhou, 21 sequences); and 48 single-copy sequences with 810 bp for the RH gene (Lijiang, 22 sequences; Panzhihua, 5 sequences; and Luzhou, 21 sequences) (Table 1).

2.4. Data Analysis

The obtained sequences in both directions were checked by the sequence peak figure and then assembled based on the contigs using the program SeqMan Pro from the software DNAStar Lasergene (DNASTAR Inc., Madison, WI). The assembled sequences were aligned and trimmed using MEGA 7.0 [30]. All the aligned sequences were submitted to GenBank (https://www.ncbi.nlm.nih.gov/genbank/, accessed on 6 January 2021) under the accession numbers listed in Table S2. Furthermore, other available sequences in this study were obtained from the National Center of Biotechnology Information (NCBI) database (Table S2).
The nuclear gene (RAG1 and RH) sequences were first genotyped in DnaSP version 5.10 [31], and then each specimen generated two allele gene sequences for all subsequent analyses. This genetic diversity is generally reflected by nucleotide diversity (Pi) and haplotype diversity (h), which were also analyzed by DnaSP version 5.10 [31]. The average genetic distances within and between populations were analyzed using MAGE 7.0 based on the Kimura two-parameter model [30,32]. The pairwise genetic divergences between the populations were estimated by F-statistics (FST) with 10,000 permutations and computed by Arlequin 3.5 [33]. The FST value is an important index reflecting the degree of genetic differentiation among populations, and FST < 0.05 represents a low level of inter-population genetic divergence; 0.05 < FST < 0.15 implies a moderate level of genetic divergence; 0.15 < FST < 0.25 represents a relatively high level of genetic divergence; and FST > 0.25 represents a very high level of divergence between populations [34,35].
The analysis of the median-joining network (MJN) of the haplotype was performed to depict the relationships among all the haplotypes using PopART 1.7 [36]. The haplotype frequencies in populations were computed by Arlequin 3.5 [33]. The arp files and haplotype data needed for Arlequin 3.5 were generated by DnaSP 5.10. Analysis of the molecular variance analysis (AMOVA) [37] was used to analyze the hierarchal population structure in Arlequin. The population history demography (e.g., bottlenecks or expansions) for all J. sinensis populations were examined using the neutral test and mismatch distribution. The Tajima’s D statistical index was used to reflect the neutrality test, which, along with the mismatch distribution, was analyzed using DnaSP 5.10 [38,39]. In addition, gene flow (Nm) was evaluated based on GammaSt [40] values using DnaSP 5.10.

3. Results

3.1. Genetic Diversity

In each population, except for the RH gene in Lijiang and Luzhou populations, the number of haplotypes of each gene was mostly close to the number of individuals, indicating that the situation of multiple individuals sharing a haplotype in a single population was rare (Table 1). The level of genetic diversity represents the species’ adaptability to environmental changes and evolutionary potential, and the haplotype diversity (h) and nucleotide diversity (Pi) are two important indicators that reflect the level of genetic diversity of the population [41]. When the haplotype diversity of the population was higher than 0.5 or the nucleotide diversity was higher than 0.005, the species was considered to have high genetic diversity [42,43]. Therefore, all populations showed high haplotype diversity for all genes (from 0.660±0.058 to 1.000 ± 0.014), except for the RH gene in the Lijiang population (0.254 ± 0.085) (Table 1). Compared to the other three genes, the RH gene exhibited a lower level of haplotype diversity in all populations (Table 1). It is noteworthy that the haplotype diversity of RH in the Panzhihua population was also high (0.800 ± 0.089), probably due to the small sample size of this population (only five individuals) compared to other populations. Similar to haplotype diversity characteristics, the nucleotide diversity was also high in almost all populations for COI, Cytb, and RAG1 genes (from 0.0060 ± 0.0014 to 0.0203 ± 0.0084), except that the RAG1 gene in the Panzhihua population was less than 0.005 (0.0019 ± 0.0003), which may be due to the small sample size of this population (only six individuals) (Table 1). Compared to the other three genes, the RH gene exhibited a lower level of nucleotide diversity (less than 0.005) in all populations. In general, all populations showed high genetic diversity, and the Lijiang population had the highest genetic diversity.

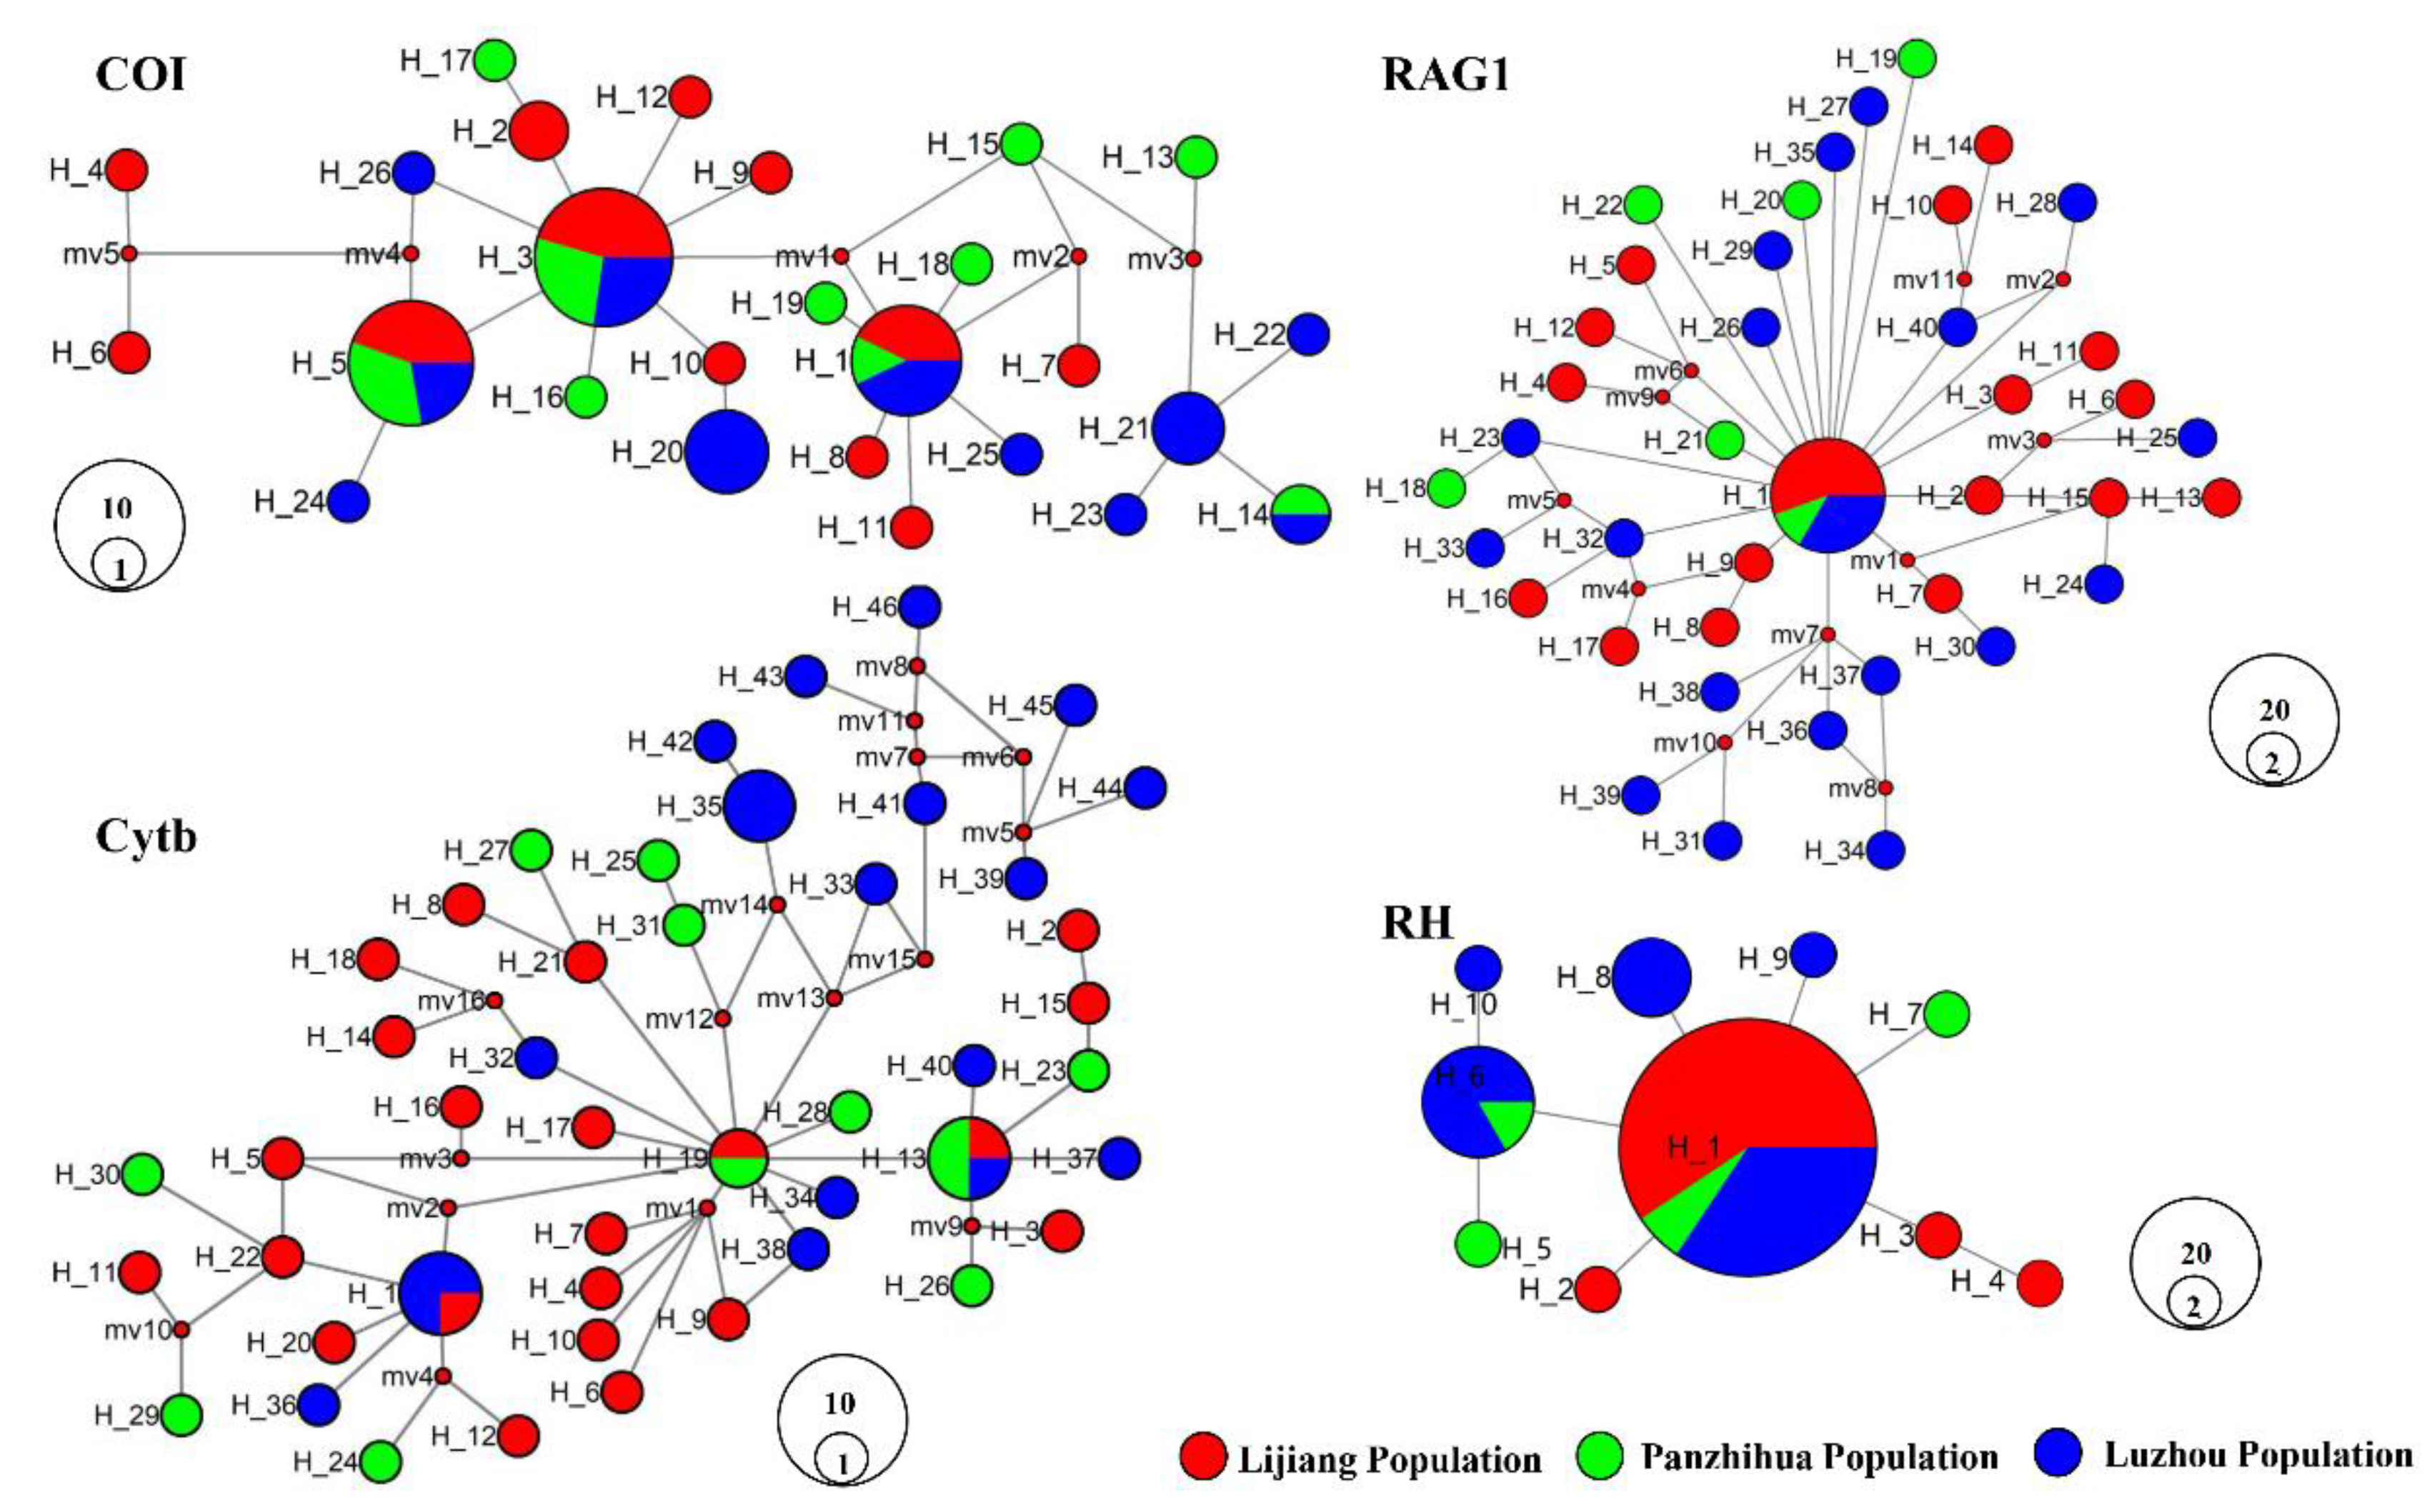
3.2. Haplotype Networks

The haplotype median-joining networks of the four genes from J. sinensis are presented in Figure 2. In each haplotype network, some haplotypes were shared among or between populations, but none had a clear genealogical structure. The COI gene has three shared haplotypes involving all three populations, and the Cytb gene also has three shared haplotypes, with only one involving all three populations. The RAG1 gene has only one shared haplotype involving all three populations, and the RH gene has two shared haplotypes, in which only one, as a dominant shared haplotype, involves all three populations. In addition, several single haplotypes were connected by multiple nodes in all genes except for the RH gene. Compared to networks of RAG1 and RH, COI and Cytb genes had more complex topological structures. The results of the four tested genes indicated that the genetic variability of the mitochondrial genes was higher than that of the nuclear genes.

3.3. Population Structure

The mean genetic distances within and between the J. sinensis populations and the pairwise populations’ FST fixation index are presented in Table 2. The mean genetic distances within the populations were higher in the Lijiang population than in other populations, especially for COI (0.0196 ± 0.0025) and Cytb (0.0217 ± 0.0021). The mean genetic distances between the Luzhou and Lijiang populations were greater than that between other populations for all genes except for the RH gene. In general, the mean genetic distance of the mitochondrial genes was greater than that of the nuclear genes.
The pairwise FST values between the Lijiang and Luzhou populations were relatively high and statistically significant for all genes, with consistent pairwise FST scores indicating significant moderate genetic differentiation between these two populations. In addition, significant genetic differences existed between Luzhou and Panzhihua populations for all genes except for the COI gene, and between Panzhihua and Lijiang populations based on the RH gene exclusively, suggesting that moderate genetic differentiation also may exist among these populations.
All populations were divided into one group for population structure analysis. The nonhierarchical AMOVA analysis based on all genes revealed that most of the molecular variance of J. sinensis occurred within populations (87.01–93.36%), whereas variance among populations (6.64–12.99%) was relatively small (FST = 0.057–0.097, p < 0.01), indicating a low level of geographical structure (Table 3). The values of Nm based on GammaSt (from 5.024 to 15.582) indicated a certain level of gene flow among the three J. sinensis populations (Table S3). The gene flow level between the Lijiang and Panzhihua populations was the highest for all genes, while that between the Lijiang and Luzhou populations was the weakest, which was also consistent with their statistically significant population pairwise FST value.

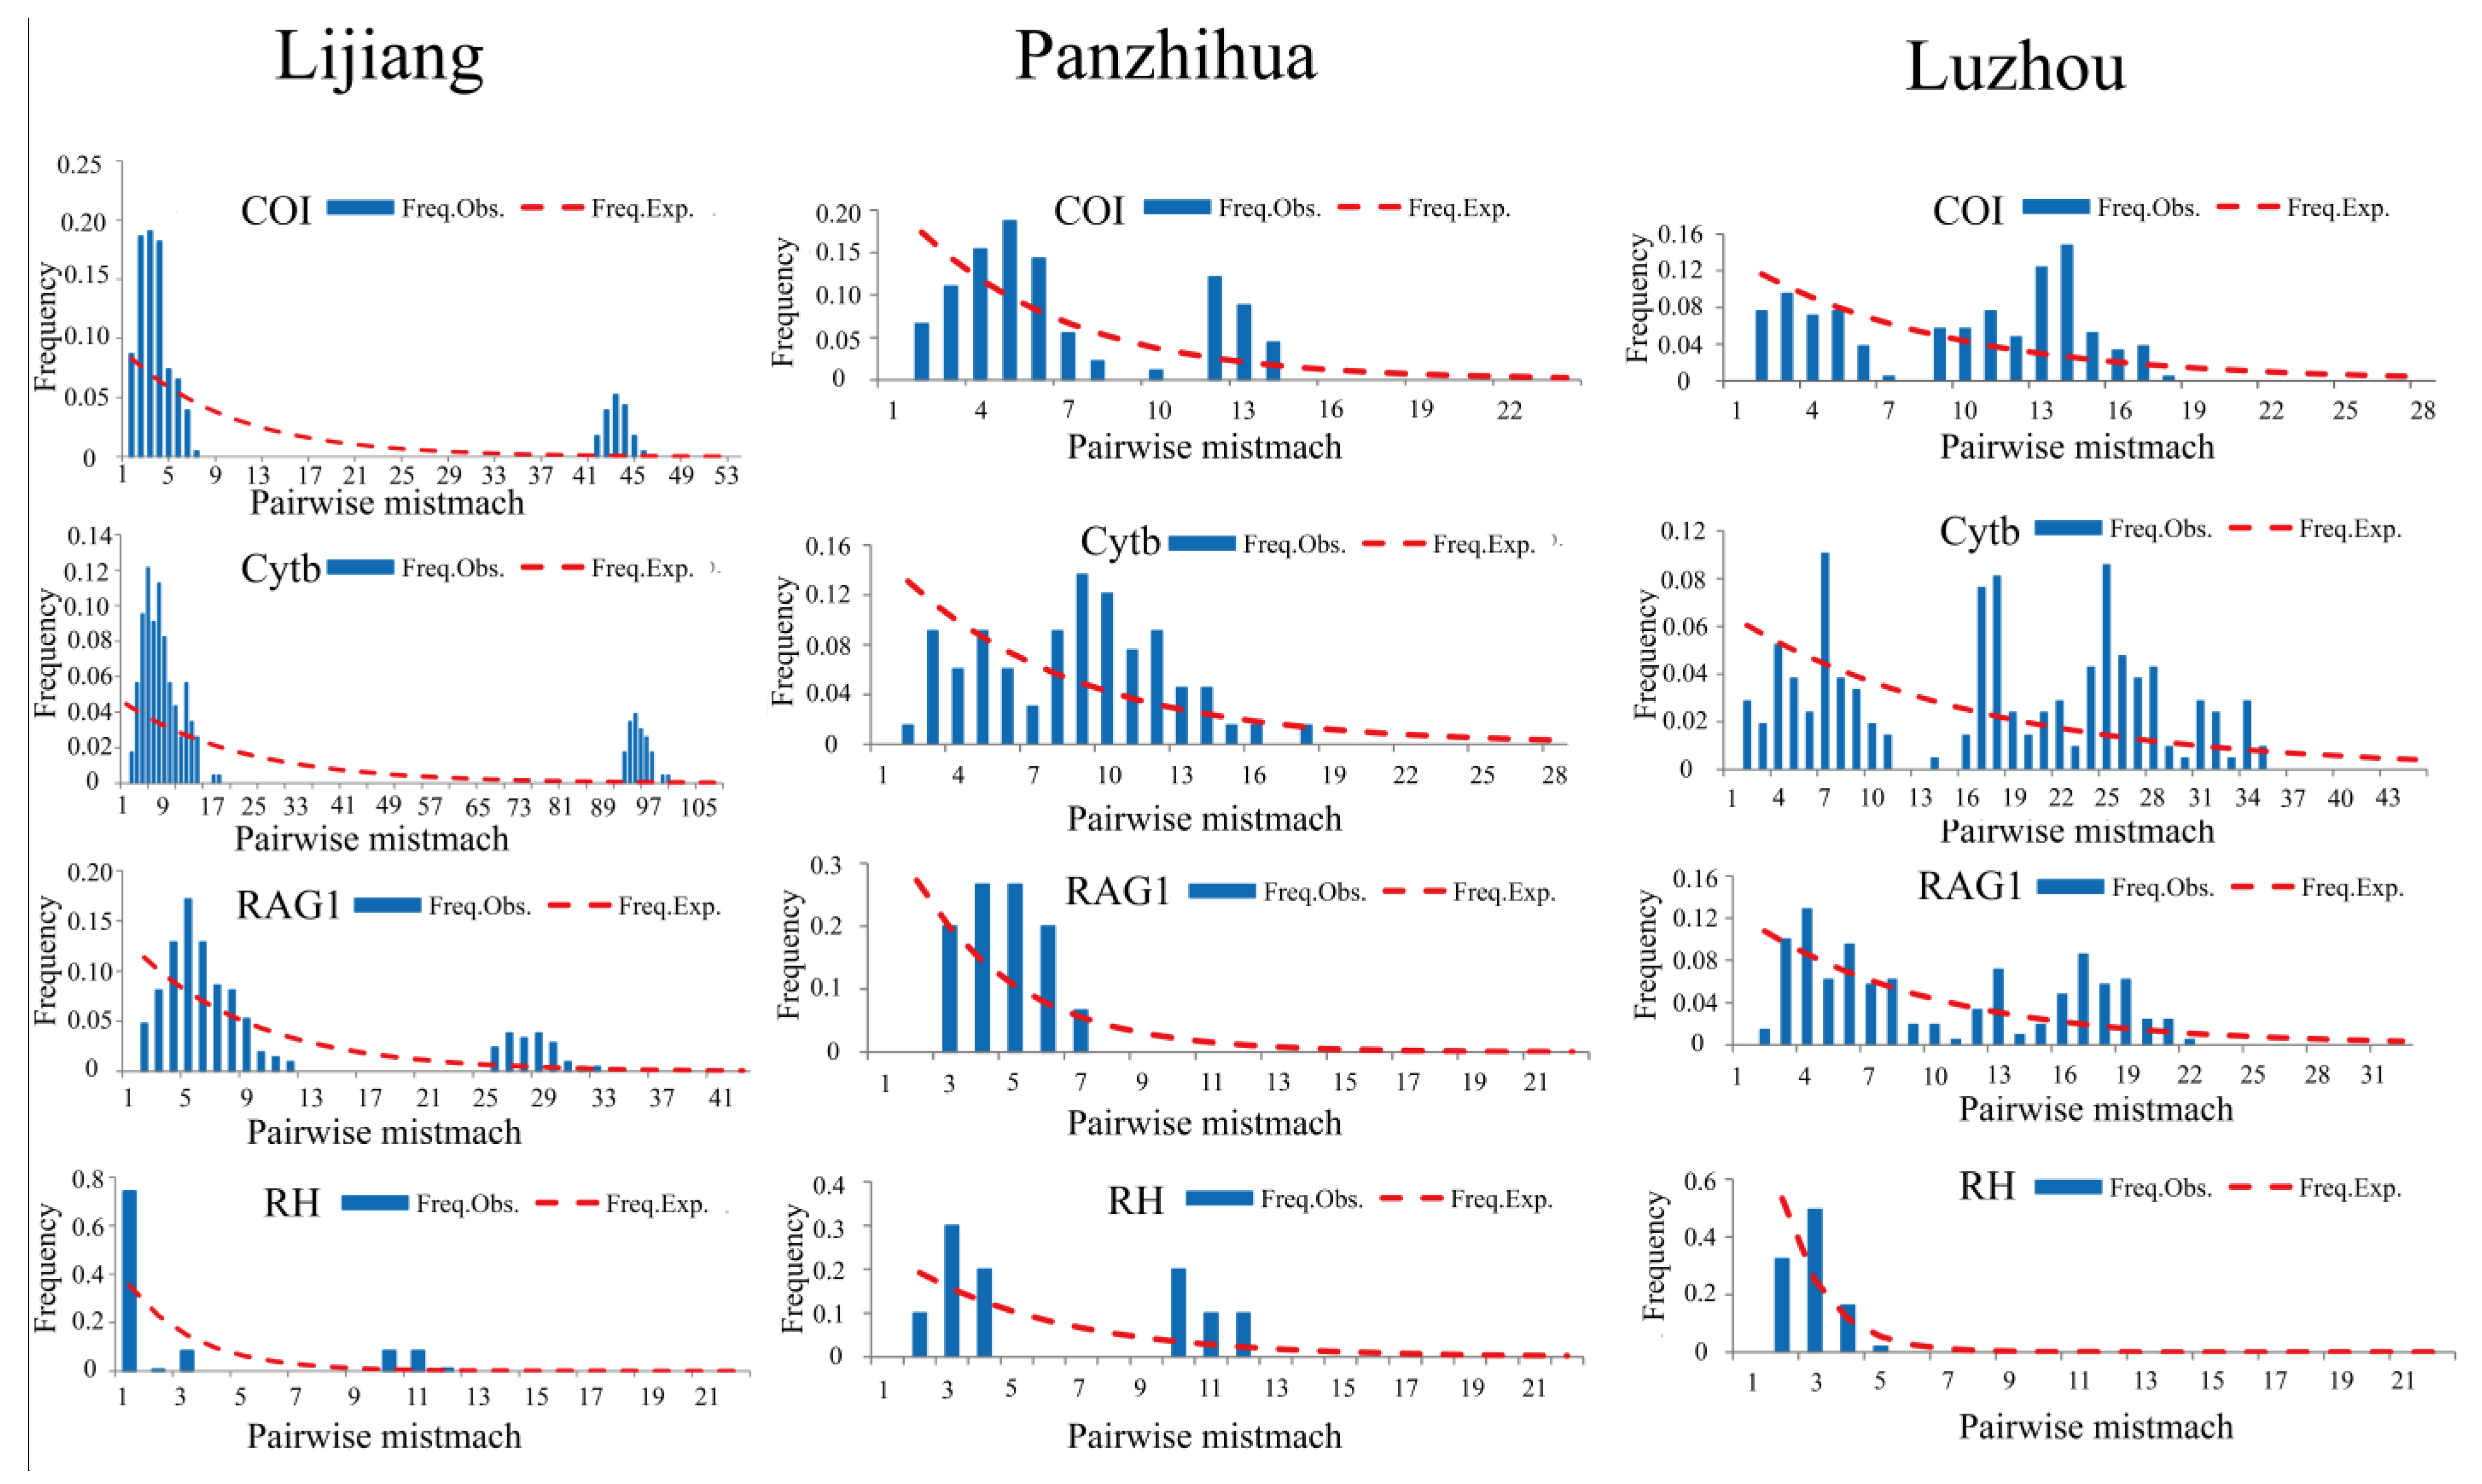
3.4. Population History Demography

Tajima’s D is usually an important indicator for inferring the population history. When Tajima’s D value is significantly greater than 0, it indicates that the population may have a severe bottleneck effect or balancing selection; when the Tajima’s D value is significantly less than 0, it indicates that the population may have recently undergone expansion and directional selection [38]. In this study, except for COI and Cytb genes in the Luzhou population, the Tajima’s D values of all genes in all populations were negative, but this was not statistically significant (Table 1). In addition, Tajima’s D values of all genes in the Lijiang population were the smallest among the three populations. For populations with a stationary demographic equilibrium, the shape of the mismatch distribution is usually ragged or multimodal, while the historical population expansion events are usually approximately unimodal [44,45]. The shape of the mismatch distribution of all genes in the Lijiang population was approximately unimodal, whereas only the RAG1 gene in the Panzhihua population and the RH gene in the Luzhou population were approximately unimodal (Figure 3). The mismatch distribution among different genes was different, possibly due to the influence of the differentiation lineage, resulting in the inconsistency of the expansion signal [46].

4. Discussion

In general, high levels of haplotype diversity and nucleotide diversity observed in J. sinensis populations were indicative of high genetic diversity in all populations, which was consistent with the results of some previous population genetics research on this species based on microsatellite [11,23] and mitochondrial D-loop studies [24]. Similar to the J. sinensis, other loaches in the upper YR also show a high level of genetic diversity, such as Lepturichthys fimbriata (h = 0.982, Pi = 0.0076) [26], Botia superciliaris (h = 0.986, Pi = 0.0037) [47], Leptobotia elongata (h = 0.916, Pi = 0.0045) [48], L. microphthalma (h = 0.958, Pi = 0.0042), and L. rubrilabris (h = 0.907, Pi = 0.0032) [49]. Therefore, high genetic diversity may be a common feature of loaches in the upper YR because of their similar ecological habits, such as spawning drifting eggs, migratory nature, and status as a demersal fish [24].
It is noteworthy that the Lijiang population, which has not been described in previous studies, showed the highest genetic diversity in this study. It is a recognized fact that cascade hydropower deeply interferes with fish genetic diversity and structure, and the degree of this intervention is usually affected by time, species, topography, etc. [50,51,52]. Moreover, J. sinensis, as an endemic species of the upper YR, is generally more sensitive to environmental changes at the genetic level [11,23,24]. The Lijiang region is closer to the upper YR, with a larger altitude gradient, a greater water level drop, and less cascade hydropower distribution than the Panzhihua and Luzhou regions. Therefore, the Lijiang population may be less affected by changes in hydrological factors caused by cascade hydropower, which may also be an important reason for its highest genetic diversity in the three populations.
Compared with genetic diversity, the genetic structure among populations can provide a broader perspective for judging the degree of interference in J. sinensis populations in the upper YR. The pairwise genetic divergences of the J. sinensis populations showed that the divergences between the Lijiang and Luzhou populations were more obvious than other pairwise populations, and the population pairwise FST values (ranging from 0.0962 to 0.1063) were statistically significant for all genes, which may be related to the geographical distance between these two populations and the relatively low level of population gene exchange. Moreover, the mean genetic distance between the Lijiang and Luzhou populations was also slightly greater than between other pairs of populations. Therefore, a significant moderate genetic divergence existed between the Lijiang and Luzhou J. sinensis populations. However, this moderate genetic differentiation has not resulted in distinct geo-population structures. Despite the presence of more graded hydroelectric barriers between the Lijiang and Luzhou populations, the AMOVA analysis showed that there was no obvious geographic population structure among the populations of J. sinensis because most of the molecular variation mainly occurred within the populations. This conclusion was also supported by the existence of a certain level of gene flow among populations. This trait may be related to the fish’s reproductive characteristic of producing drifting eggs which develop while drifting for longer distances in water, spread to various habitats as adults, and facilitate gene exchange among different populations [24]. Similar homogeneity is also found in other drifting egg fishes in the upper YR, such as Rhinogobio ventralis [53], Xenophysogobio boulengeri [54], L. microphthalma, and L. rubrilabris [49]. The population is a dynamic unit that species use to adapt to the surrounding environment geographically and physiologically and is greatly affected by the surrounding environment [55,56]. As described above, the habitat of the Lijiang population was very different from that of the Luzhou population. Therefore, the significant moderate genetic divergence between the Lijiang and Luzhou populations of J. sinensis was likely to be caused by this difference in environmental adaptation.
The approximately unimodal shape of the mismatch distribution of all genes showed that the Lijiang population is likely to have passed through a recent expansion, but the Panzhihua and Luzhou populations did not, because of the multimodal shape of the mismatch distribution [44,45]. The results demonstrated that J. sinensis populations had different demographic histories in different regions. The negative Tajima’s D values of all genes in the Lijiang population are the smallest among the three populations (and the RAG1 gene in the Lijiang population is statistically significant), which also proves that the population may have experienced recent population expansion.
Some previous studies have shown that the J. sinensis population expanded ~0.10–0.17 Ma ago during the interglacial period between the Lushan Subglacial period (~0.20–0.23 Ma) and the Dali subglacial period (~0.01–0.11 Ma) [24,43]. The interglacial period was warmer than the glacial period [57], which helped species survive and allowed species to spread out from their sanctuaries during the glacial period, thereby allowing populations to grow. Some fish species in the upper YR were also affected by the glacial period, and their populations, such as Rhinogobio cylindricus [58] and Coreius heterodon [59], have experienced expansions throughout history. As a result, compared with the other two populations, the Lijiang population experienced rapid expansion throughout history and may have accumulated a large amount of variation within the population, which is also consistent with the result of the highest genetic diversity of this population.
Populations of endemic fish species in the upper YR have declined or even disappeared in some parts of their ranges due to long-term human disturbance and/or environmental degradation [10]. In general, this study indicated that J. sinensis did not have an obvious geographic population structure and was still a single evolutionarily significant unit. Therefore, in situ conservation measures for this species are recommended. However, more cascaded hydropower stations are being built or planned in the upper YR, which will further compress and fragment the habitats of fishes with similar ecological habits to J. sinensis, further hindering population gene exchange. Therefore, in the future, it is necessary to continuously strengthen the genetic diversity monitoring of fish with similar ecological habits to J. sinensis in the upper reaches of the Yangtze River.

Supplementary Materials

The following supporting information can be downloaded at: https://www.mdpi.com/article/10.3390/fishes8020075/s1, Table S1: Primer information used in the study; Table S2: Information on all samples used in this study and GenBank accession number; Table S3: Gene flow (Nm: below the diagonal) was evaluated from the values of GammaSt and Fst for the Jinshaia sinensis populations.

Author Contributions

Y.L. (Yang Luo) and Y.S.: Collection, preservation, identification, and manuscript preparation; Y.Z. (Yufeng Zhang), R.C., Q.L., Y.Z. (Yu Zhang) and Y.L. (Yingwen Li): Identification and critical analysis of the manuscript. All authors have read and agreed to the published version of the manuscript.

Funding

This work was funded by the National Natural Science Foundation of China (grant number 32202939) and the Science and Technology Research Program of Chongqing Municipal Education Commission, grant number KJQN202100503.

Institutional Review Board Statement

Dead specimens were collected from fishing harbors following scientific collection ethics. All authors agreed.

Informed Consent Statement

Not applicable.

Data Availability Statement

All the aligned sequences were submitted to GenBank (https://www.ncbi.nlm.nih.gov/genbank/, accessed on 27 January 2023) under the accession numbers listed in Table S2. Furthermore, other available sequences in this study were obtained from the National Center of Biotechnology Information (NCBI) database (Table S2).

Acknowledgments

The authors sincerely thank all the crews for their help with the sample collection and data analysis.

Conflicts of Interest

The authors declare no competing interest.

References

  1. Liu, Z.G.; Bao, W.K.; Wu, N.; Liu, Q.; Pan, K.W.; Chen, Q.H.; Yin, K.P. Ecological reconstruction in the upper reaches of the Yangtze River: Environmental problems, degraded mechanism and rehabiltation methodology. World Sci-Tech R D 2000, 22, 32–34. [Google Scholar] [CrossRef]
  2. Liu, J.K.; Cao, W.X. Fish resources in the Yangtze basin and the strategy for their conservation. Resour. Environ. Yangtze Basin 1992, 1, 17–23. [Google Scholar]
  3. Gao, T.H.; Tian, H.W.; Ye, C.; Duan, X.B. Diversity and composition of fish in the mainstream of national nature reserve of rare and endemic fish in the upper Yangtze River. Freshw. Fish. 2013, 43, 36–42. [Google Scholar] [CrossRef]
  4. Wu, J.; Li, L.; Du, H.; Zhang, H.; Wang, C.; Wei, Q. Length-weight relations of 14 endemic fish species from the upper Yangtze River Basin, China. Acta Ichthyol. Piscat. 2013, 43, 163. [Google Scholar] [CrossRef] [Green Version]
  5. Liu, M.; Wang, D.; Gao, L.; Tian, H.; Liu, S.; Chen, D.; Duan, X. Species diversity of drifting fish eggs in the Yangtze River using molecular identification. PeerJ 2018, 6, e5807. [Google Scholar] [CrossRef] [PubMed] [Green Version]
  6. Liu, S.; Yang, J.; Chen, X. Discovery and its significance of spawning grounds of Jinshaia sinensis from upper and middle Jinshajiang River. Zool. Res. 2013, 34, 626–630. [Google Scholar]
  7. Zhou, C.S.; Liang, Y.S.; Huang, H.N. Ecological features of the spawing of certain fishes in the Hanjiang River after the construction of dams. Acta Hydrobiol. Sin. 1980, 2, 175–188. [Google Scholar]
  8. Duan, X.B.; Chen, D.Q.; Li, Z.H.; Wang, K.; Huang, M.J.; Liu, S.P. Current status of spawning grounds of fishes with pelagic eggs in the middle reaches of the Yangtze River after impoundment of the Three Gorges Reservior. J. Fish. Sci. China 2008, 4, 523–532. [Google Scholar] [CrossRef]
  9. Li, C. A preliminary Analysis of the Impacts of the Cascade Hydropower Development on the Fish Biodiversity in the Upper Reach of the Yangtze River; Huazhong University of Science & Technology: Wuhan, China, 2012. [Google Scholar]
  10. Chen, D.; Xiong, F.; Wang, K.; Chang, Y. Status of research on Yangtze fish biology and fisheries. Environ. Biol. Fishes 2009, 85, 337–357. [Google Scholar] [CrossRef]
  11. Shao, K.; Shi, F.; Tang, H.; Xiong, M.; Li, W.; Zhu, B. Isolation and characterization of microsatellite loci in Jinshaia sinensis. Conserv. Genet. Resour. 2012, 4, 1075–1077. [Google Scholar] [CrossRef]
  12. Nazir, A.; Khan, M.A.; Ghosh, P. Assessment of variations in metal concentrations of the Ganges River water by using multivariate statistical techniques. Limnologica 2022, 95, 125989. [Google Scholar] [CrossRef]
  13. Huang, S.L.; Wang, S.W. Conservation status and prospects of endangered aquatic wildlife in Yangtze River basin. J. Shanghai Ocean. Univ. 2020, 29, 128–138. [Google Scholar] [CrossRef]
  14. Shen, Y.; Guan, L.; Wang, D.; Gan, X. DNA barcoding and evaluation of genetic diversity in Cyprinidae fish in the midstream of the Yangtze River. Ecol. Evol. 2016, 6, 2702–2713. [Google Scholar] [CrossRef] [PubMed]
  15. Ding, X.M.; Yan, Y.H.; Li, Q.; Luo, X.; Tang, L.Z. Genetic diversity of goby Rhinogobius giurinus in the fragmented habitat in Nanpan River. Fish. Sci. 2020, 39, 852–862. [Google Scholar] [CrossRef]
  16. Ferguson, A.; Taggart, J.; Prodöhl, P.; McMeel, O.; Thompson, C.; Stone, C.; Mcginnity, P.; Hynes, R. The application of molecular markers to the study and conservation of fish populations, with special reference to Salmo. J. Fish Biol. 1995, 47, 103–126. [Google Scholar] [CrossRef]
  17. Nazir, A.; Khan, M.A. Stock discrimination of Sperata aor from river Ganga using microsatellite markers: Implications for conservation and management. Aquat. Living Resour. 2017, 30, 33. [Google Scholar] [CrossRef] [Green Version]
  18. Chen, W.; Shen, Y.; Gan, X.; Wang, X.; He, S. Genetic diversity and evolutionary history of the Schizothorax species complex in the Lancang River (upper Mekong). Ecol. Evol. 2016, 6, 6023–6036. [Google Scholar] [CrossRef] [Green Version]
  19. Shen, Y.; Kou, Q.; Chen, W.; He, S.; Yang, M.; Li, X.; Gan, X. Comparative population structure of two dominant species, Shinkaia crosnieri (Munidopsidae: Shinkaia) and Bathymodiolus platifrons (Mytilidae: Bathymodiolus), inhabiting both deep-sea vent and cold seep inferred from mitochondrial multi-genes. Ecol. Evol. 2016, 6, 3571–3582. [Google Scholar] [CrossRef] [Green Version]
  20. Chen, W.; Li, Y.; Cai, X.; Xiang, D.; Gao, S.; Li, C.; Lan, C.; Zhu, S.; Yang, J.; Li, X. Genetic Structure of an East Asian Minnow (Toxabramis houdemeri) in Southern China, with Implications for Conservation. Biology 2022, 11, 1641. [Google Scholar] [CrossRef]
  21. Lin, P.; Liu, F.; Li, M.; Gao, X.; Liu, H. Spatial pattern of fish assemblages along the river-reservoir gradient caused by the Three Gorge Reservoir (TGR). Acta Hydrobiol. Sin. 2018, 42, 1124–1134. [Google Scholar]
  22. Zhu, T.; Yang, D. Length–weight relationships of two fish species from the middle reaches of the Jinsha River, China. J. Appl. Ichthyol. 2016, 32, 747–748. [Google Scholar] [CrossRef]
  23. Duan, Y.J.; Zhang, F.T.; Cao, S.M.; Wang, J.W.; Tan, D.Q. Isolation and characterization of polymorphic microsatellite loci in Jinshaia sinensis. Acta Hydrobiol. Sin. 2012, 36, 148–151. [Google Scholar]
  24. Long, A.Y.; Tian, H.W.; Wang, D.Q.; Chen, D.Q.; Zhou, H.H.; Duan, X.B. Genetic diversity between Jinshaia sinensis and J. abbreviata in the upper reaches of Yangtze River based on mitochondrial DNA. Freshw. Fish. 2020, 50, 34–41. [Google Scholar] [CrossRef]
  25. Tang, Q.Y.; Liu, S.Q.; Yu, D.; Liu, H.Z.; Danley, P.D. Mitochondrial capture and incomplete lineage sorting in the diversification of balitorine loaches (Cypriniformes, Balitoridae) revealed by mitochondrial and nuclear genes. Zool. Scr. 2012, 41, 233–247. [Google Scholar] [CrossRef]
  26. Li, M.Q. Genetic diversity of Lepturichthys fimbriata in the upper reaches of the Yangtze River; Southwest University: Chongqing, China, 2020. [Google Scholar]
  27. Yang, L.; Mayden, R.L. Phylogenetic relationships, subdivision, and biogeography of the cyprinid tribe Labeonini (sensu) (Teleostei: Cypriniformes), with comments on the implications of lips and associated structures in the labeonin classification. Mol. Phylogenetics Evol. 2010, 54, 254–265. [Google Scholar] [CrossRef]
  28. Xiao, W.H.; Zhang, Y.P.; Liu, H.Z. Molecular systematics of Xenocyprinae (Teleostei: Cyprinidae): Taxonomy, biogeography, and coevolution of a special group restricted in east Asia. Mol. Phylogenetics Evol. 2001, 18, 163–173. [Google Scholar] [CrossRef] [Green Version]
  29. Ward, R.D.; Zemlak, T.S.; Innes, B.H.; Last, P.R.; Hebert, P.D.N. DNA barcoding Australia’s fish species. Philos. Trans. R. Soc. B Biol. Sci. 2005, 360, 1847–1857. [Google Scholar] [CrossRef]
  30. Kumar, S.; Stecher, G.; Tamura, K. MEGA7: Molecular Evolutionary Genetics Analysis version 7.0 for bigger datasets. Mol. Biol. Evol. 2016, 33, 1870–1874. [Google Scholar] [CrossRef] [Green Version]
  31. Nei, M. Molecular Evolutionary Genetics; Columbia University Press: New York, NY, USA, 1987. [Google Scholar]
  32. Tamura, K.; Nei, M.; Kumar, S. Prospects for inferring very large phylogenies by using the neighbor-joining method. Proc. Natl. Acad. Sci. USA 2004, 101, 11030–11035. [Google Scholar] [CrossRef] [Green Version]
  33. Excoffier, L.; Lischer, H. Arlequin suite ver 3.5: A new series of programs to perform population genetics analyses under Linux and Windows. Mol. Ecol. Resour. 2010, 10, 564–567. [Google Scholar] [CrossRef]
  34. Wright, S. The interpretation of population structure by F-Statistics with special regard to systems of mating. Evolution 1965, 19, 395–420. [Google Scholar] [CrossRef]
  35. Wright, S. Variability Within and Among Natural Populations; University of Chicago Press: Chicago, IL, USA, 1978. [Google Scholar]
  36. Leigh, J.W.; Bryant, D. Popart: Full-feature software for haplotype network construction. Methods Ecol. Evol. 2015, 6, 1110–1116. [Google Scholar] [CrossRef]
  37. Excoffier, L.; Smouse, P.E.; Quattro, J.J.G. Analysis of molecular variance inferred from metric distances among DNA haplotypes: Application to human mitochondrial DNA restriction data. Genetics 1992, 131, 479–491. [Google Scholar] [CrossRef] [PubMed]
  38. Tajima, F. Statistical method for testing the neutral mutation hypothesis by DNA polymorphism. Genetics 1989, 123, 585–595. [Google Scholar] [CrossRef]
  39. Librado, P.; Rozas, J. DnaSP v5: A software for comprehensive analysis of DNA polymorphism data. Bioinformatics 2009, 25, 1451–1452. [Google Scholar] [CrossRef]
  40. Nei, M. Part A: The unfolding genome. In Evolution of Human Races at the Gene Level; Progress in Clinical and Biological Research: New York, NY, USA, 1982; pp. 167–181. [Google Scholar]
  41. Fu, Y.X. Statistical tests of neutrality of mutations against population growth, hitchhiking and background selection. Genetics 1997, 147, 915–925. [Google Scholar] [CrossRef]
  42. Grant, W.; Bowen, B.W. Shallow population histories in deep evolutionary lineages of marine fishes: Insights from sardines and anchovies and lessons for conservation. J. Hered. 1998, 89, 415–426. [Google Scholar] [CrossRef] [Green Version]
  43. Long, A.Y. Population Genetics of Jinshaia Sinensis and J. abbreviata in the Upper Yangtze River; Shanghai Ocean University: Shanghai, China, 2020. [Google Scholar]
  44. Rogers, A.R.; Harpending, H. Population growth makes waves in the distribution of pairwise genetic differences. Mol. Biol. Evol. 1992, 9, 552–569. [Google Scholar] [CrossRef] [PubMed]
  45. Schneider, S.; Excoffier, L. Estimation of past demographic parameters from the distribution of pairwise differences when the mutation rates very among sites: Application to human mitochondrial DNA. Genetics 1999, 152, 1079–1089. [Google Scholar] [CrossRef]
  46. Avise, J.C.; Arnold, J.; Ball, R.M.; Bermingham, E.; Lamb, T.; Neigel, J.E.; Reeb, C.A.; Saunders, N.C. Intraspecific phylogeography: The mitochondrial DNA bridge between population genetics and systematics. Annu. Rev. Ecol. Syst. 1987, 18, 489–522. [Google Scholar] [CrossRef]
  47. Chen, D.Q.; Liu, S.P.; Duan, X.B. Genetic diversity of Botia superciliaris in the upper Yangtze River. Freshw. Fish. 2009, 39, 9–14. [Google Scholar] [CrossRef]
  48. Zhao, G.; Zhou, J.; Du, J.; Liu, G.; Chen, X.; Zhu, J.; Li, J. Genetic diversity of Elongate loach (Leptobotia elongata) inferred from mitochondrial DNA control region. Southwest China J. Agric. Sci. 2010, 23, 8. [Google Scholar]
  49. Shen, S.Y.; Tian, H.W.; Wang, D.Q.; Chen, D.Q.; Liu, S.P. Genetic diversity of Leptobotia rubrilabris in the upper Yangtze River inferred from mitochondrial control region. Freshw. Fish. 2017, 47, 83–90. [Google Scholar] [CrossRef]
  50. Lange, K.; Meier, P.; Trautwein, C.; Schmid, M.; Robinson, C.T.; Weber, C.; Brodersen, J. Basin-scale effects of small hydropower on biodiversity dynamics. Front. Ecol. Environ. 2018, 16, 397–404. [Google Scholar] [CrossRef]
  51. Ellis, L.E.; Jones, N.E. Longitudinal trends in regulated rivers: A review and synthesis within the context of the serial discontinuity concept. Environ. Rev. 2013, 21, 136–148. [Google Scholar] [CrossRef]
  52. Heggenes, J.; Røed, K. Do dams increase genetic diversity in brown trout (Salmo trutta)? Microgeographic differentiation in a fragmented river. Ecol. Freshw. Fish 2006, 15, 366–375. [Google Scholar] [CrossRef]
  53. Shao, K.; Yan, S.; Li, W.; Xiong, M.; Tang, H.; Shi, F. Genetic structure and diversity of Rhinogobio ventralis in the upper Yangtze River obtained by analysis of the mitochondrial DNA control region. J. Hydroecology 2018, 39, 7. [Google Scholar]
  54. Dong, W.; Wang, D.; Tian, H.; Yan, L.; Duan, X. Genetic structure of two sympatric gudgeon fishes (Xenophysogobio boulengeri and X. nudicorpa) in the upper reaches of Yangtze River Basin. PeerJ 2019, 7, e7393. [Google Scholar] [CrossRef] [Green Version]
  55. Bickham, J.W.; Sandhu, S.; Hebert, P.D.; Chikhi, L.; Athwal, R. Effects of chemical contaminants on genetic diversity in natural populations: Implications for biomonitoring and ecotoxicology. Mutat. Res. 2000, 463, 33–51. [Google Scholar] [CrossRef]
  56. Dale, J. Intraspecific variation in coloration. Bird Color. 2006, 2, 36–86. [Google Scholar]
  57. Fan, Q.; He, S. The parttern of upper and middle Yangtze drainages shaped the genetic structure and diversity of Hemiculter leucisculus revealed by mitochondrial DNA locus. Acta Hydrobiol. Sin. 2014, 38, 627–635. [Google Scholar]
  58. Pu, Y.; Tian, H.; Chen, D.; Duan, X.; Liu, S.; Wang, D. Genetic diversity of mitochondrial Cytb sequence in Rhinogobio cylindricus from the middle and upper Yangtze River. Freshw. Fish. 2019, 49, 14–19. [Google Scholar]
  59. Yuan, J.; Zhang, Q.; Li, F.; Zhu, C.; Luo, F. MtDNA control region sequence variation and genetic diversity of Coreius heterodon (Bleeker) in the upper and middle sections of the Yangtze River. Acta Hydrobiol. Sin. 2010, 34, 9–19. [Google Scholar] [CrossRef]
Figure 1. Sampling sites of Jinshaia sinensis in the upper reaches of the Yangtze River.
Fishes 08 00075 g001
Figure 2. Median-joining network of the haplotypes of Jinshaia sinensis based on four genes. Each circle represents a haplotype, and its diameter is proportional to the frequency.
Fishes 08 00075 g002
Figure 3. Expected (dashed red line) and observed (blue bar) mismatch distribution for Jinshaia sinensis based on all genes. X-axis = pairwise differences; Y-axis = frequency.
Fishes 08 00075 g003
Table 1. Genetic diversity indexes for all Jinshaia sinensis populations based on four genes. N: sample size; H: haplotypes numbers; h: haplotype (gene) diversity; Pi: nucleotide diversity; Tajima’s D: neutrality test values.
PopulationGeneNHhPiTajima’s D
LijiangCOI22120.913 ± 0.0380.0183 ± 0.0083−1.523
Cytb22221.000 ± 0.0140.0203 ± 0.0084−1.455
RAG121170.929 ± 0.0270.0060 ± 0.0014−1.310
RH2240.254 ± 0.0850.0022 ± 0.0008−1.069
PanzhihuaCOI14100.934 ± 0.0510.0079 ± 0.0020−1.025
Cytb12110.985 ± 0.0400.0063 ± 0.0005−1.387
RAG1660.909 ± 0.0460.0019 ± 0.0003−0.339
RH540.800 ± 0.0890.0046 ± 0.00150.249
LuzhouCOI21110.924 ± 0.0320.0126 ± 0.00120.526
Cytb21170.971 ± 0.0260.0147 ± 0.00160.067
RAG121190.962 ± 0.0130.0064 ± 0.0007−0.377
RH2150.660 ± 0.0580.0011 ± 0.0002−0.190
Table 2. Population pairwise FST fixation index (below the diagonal) and mean genetic distances within (on the diagonal) and between (above the diagonal) the Jinshaia sinensis populations. *: p < 0.05; **: p < 0.01.
GenesPopulationsLijiangPanzhihuaLuzhou
COILijiang0.0196 ± 0.00250.0140 ± 0.00190.0181 ± 0.0025
Panzhihua0.00690.0080 ± 0.00180.0110 ± 0.0022
Luzhou0.1043 **0.05090.0128 ± 0.0027
CytbLijiang0.0217 ± 0.00210.0144 ± 0.00140.0203 ± 0.0019
Panzhihua0.00510.0063 ± 0.00140.0125 ± 0.0017
Luzhou0.0963 **0.1201 **0.0150 ± 0.0021
RAG1Lijiang0.0062 ± 0.00090.0043 ± 0.00060.0069 ± 0.0009
Panzhihua0.03460.0021 ± 0.00070.0049 ± 0.0009
Luzhou0.0962 **0.1018 *0.0066 ± 0.0013
RHLijiang0.0023 ± 0.00070.0039 ± 0.00090.0018 ± 0.0005
Panzhihua0.1821 *0.0052 ± 0.00150.0031 ± 0.0009
Luzhou0.1063 **0.1857 **0.0011 ± 0.0006
Table 3. Analysis of molecular variance for Jinshaia sinensis populations based on each gene. *: p < 0.05; **: p < 0.01.
Source of VariationCOICytbRAG1RH
PercentageFSTPercentageFSTPercentageFSTPercentageFST
Among populations6.640.066 *7.980.080 **9.040.090 **12.990.130 **
Within populations93.3692.0290.9687.01
Disclaimer/Publisher’s Note: The statements, opinions and data contained in all publications are solely those of the individual author(s) and contributor(s) and not of MDPI and/or the editor(s). MDPI and/or the editor(s) disclaim responsibility for any injury to people or property resulting from any ideas, methods, instructions or products referred to in the content.

