Article

Effects of Stocking Density, Size, and External Stress on Growth and Welfare of African Catfish (Clarias gariepinus Burchell, 1822) in a Commercial RAS

by
Björn Baßmann
1,*,
Lisa Hahn
1,2,
Alexander Rebl
3,
Lisa Carolina Wenzel
1,
Marc-Christopher Hildebrand
1,
Marieke Verleih
3 and
Harry Wilhelm Palm
1
1
Department of Aquaculture and Sea-Ranching, Faculty of Agricultural and Environmental Sciences, University of Rostock, Justus-von-Liebig-Weg 6, 18059 Rostock, Germany
2
Department of Marine Biology, Institute for Biological Sciences, University of Rostock, Albert-Einstein Straße 3, 18055 Rostock, Germany
3
Fish Genetics Unit, Institute of Genome Biology, Research Institute for Farm Animal Biology (FBN), Wilhelm-Stahl-Allee 2, 18196 Dummerstorf, Germany
*
Author to whom correspondence should be addressed.
Fishes 2023, 8(2), 74; https://doi.org/10.3390/fishes8020074
Submission received: 11 January 2023 / Revised: 23 January 2023 / Accepted: 24 January 2023 / Published: 26 January 2023
(This article belongs to the Special Issue Welfare and Sustainability in Aquaculture)

Abstract

:
The effects of semi-intensive (100 kg m−3), intensive (200 kg m−3), and super-intensive (400 kg m−3) stocking densities on the growth and welfare of African catfish (Clarias gariepinus) were investigated under commercial production conditions. Plasma cortisol, glucose, and selected transcripts following a stress challenge, lactate, as well as skin lesions, were analyzed at regular intervals (from 12 g juveniles to 1.5–2.0 kg). The fish grew well, but after 23 weeks, the semi-intensively stocked fish had a mean final weight of 1830.5 g, significantly higher than the super-intensively stocked fish with 1615.4 g, and considerably higher than the intensively stocked fish with 1664.8 g (p > 0.05). Cortisol and glucose responses significantly differed between stressed and unstressed fish, but not between treatment groups. An unforeseen external stressor (nearby demolition noise) caused stress responses among all treatment groups, but was similarly coped with. Mortality ranged between 3.8–9.2%. In the juveniles, skin lesions were reduced under intensive or super-intensive densities, with the least under semi-intensive densities in outgrown fish. Expression profiles of 22 genes were compared in the spleen at semi-intensive and super-intensive densities. The transcript concentrations of most genes remained unchanged, except for slc39a8 and mtf1, which were significantly downregulated in stressed catfish under semi-intensive conditions. We demonstrated that African catfish growth performance and welfare depend on age and stocking density, also reacting to demolition noise. This supports farm management to optimize stocking densities during the grow-out of African catfish in RAS and suggests avoiding external stress.

1. Introduction

In finfish aquaculture, stocking density is a pivotal factor and an issue of frequent debate, as it may be a source of chronic stress, leading to physiological alterations, including stress responses, growth reduction, and impairment of health [1,2,3]. Based on these indicators, fish welfare can be considered diminished [2,4,5,6,7]. According to Ellis et al. [2] (p. 494), “... the term ’stocking density’ refers to the concentration at which fish are initially stocked into a system” (sensu strictu). However, most often, the term is used to describe the density of fish at any time. It may thus be understood as a dynamic factor, since the actual density increases or decreases as the fish grow or are removed from the rearing volume. Fish species in aquaculture are stocked at very different densities, typically ranging from < 10 to 100 kg m−3 [4,8]. This widely varies due to the different needs and/or tolerances of the respective species. Similarly, the impact of a specific stocking density on the species’ welfare may differ as well [6]. In Europe, fish farming is often industrialized and highly intensive [9]. According to Naylor et al. [10] (p. 1017), “intensification implies increasing the density of individuals, which requires greater use and management of inputs, greater generation of waste products, and increased potential for the spread of pathogens”. In this respect, particularly high, but also low stocking densities, may result in stress, poor fish health, and welfare [11,12,13], subsequently having a negative impact on the fish performance, which in turn may also have economic consequences [14,15].
A species whose global production in aquaculture has distinctly increased in recent years is the African catfish (Clarias gariepinus Burchell, 1822). In Germany, production in recirculating aquaculture systems (RASs) increased from 318,575 kg per year−1 to 1,193,137 kg per year−1 between 2011 and 2019 [16,17]. In moderate climates, this warm-water species is farmed in RASs, while ponds are predominantly used in tropical and subtropical regions [18]. The African catfish has a very good feed conversion ratio (FCR), a high growth potential, and is highly tolerant towards adverse environmental conditions, such as low oxygen or elevated nitrogen compounds in the water [19,20]. This is based on its biological adaptations to its natural habitats, which are often characterized by shrinking water bodies or complete drainage during the dry season. Especially favorable is their ability to utilize atmospheric oxygen with their arborescent organs [21]. For this reason, African catfish are adapted to survive for some time, densely packed inside smaller pools or even in moist substrates and mud [20]. This attribute is utilized in commercial aquaculture by stocking this species up to super-intensive densities (max. 500 kg m−3) [22].
Reduced growth, alteration of physiological processes, increased stress responses, and/or rise in mortality were described under high stocking densities [1,23,24,25,26,27]. According to van de Nieuwegiessen et al. [28], final densities between approx. 100–500 kg m−3 did not affect the growth and welfare of African catfish in a size range from approx. 1.0–1.5 kg fish−1. In contrast, wellbeing improved with increasing stocking density in fish between approx. 100–300 g at final densities between 16.7–315 kg m−3, as significantly fewer skin lesions occurred at the highest density. According to van de Nieuwegiessen et al. [22], African catfish juveniles between approx. 10–100 g showed a comparable growth performance and mortality at all the tested densities, but there was evidence that growth may be best at medium densities (175 kg m−3) and worst at the higher densities (300 kg m−3). Plasma cortisol, glucose, and lactate remained unaffected by stocking densities, and fish from both low (50 kg m−3) and high densities (300 kg m−3) showed no cortisol response to an additional acute stress challenge. The authors suggested an impaired cortisol response related to the downregulation of components of the hypothalamic-pituitary-interrenal (HPI) axis in fish as a result of chronic stress: the adrenocorticotropic hormone (ACTH) or cortisol receptors [22,29]. African catfish fry between approx. 0.1–0.3 g showed no significant differences in growth performance at stocking densities between 10–30 fish L−1, but aggressive behavior was less frequent at higher stocking densities [30]. In juvenile African catfish (approx. 10–100 g) under extensive stocking densities (500 and 1125 fish m−3), increased agonistic interactions during the first weeks were described. In contrast, mature African catfish from higher stocking densities showed the highest number of skin lesions after stress induction. In general, however, aggression and the number of lesions were described to decrease with age. It was suggested that both low and high stocking densities might impair welfare [22,28].
So far, most findings have originated from experiments in aquaria and not under commercial conditions. Therefore, the present study presents the growth performance and welfare of African catfish throughout an entire grow-out period in a commercial RAS under intensive conditions. We evaluate the dependence of current fish welfare indicators and the expression of several genes on fish size under three different stocking densities. In addition, the effect of an unforeseen external stressor during the experiment is discussed.

2. Materials and Methods

2.1. Production System, Maintenance, and Water Quality

A commercially scaled RAS at the aquaculture research facility ‘FishGlassHouse’ of the University of Rostock (Germany) was used for this experiment. It consisted of nine identical rearing tanks (each measuring (L × W × H) 1.8 × 1.0 × 0.7 m, 1.26 m3), a settling tank (1.76 m3, total effective surface area: 108.08 m2) to remove suspended solids from the water, a trickling filter (5.6 m2, specific surface area: 125.00 m2 m−3, total volume: 11.80 m3, total specific surface area: 1474.20 m2) for biological water treatment, and a sump (4.41 m3). The total system contained approximately 16.90 m3 of water [31]. An automatic temperature control/heater and a float switch for water level regulation were located in the sump. Tap water was used to replace evaporated water.
The water parameters of temperature, pH, oxygen concentration and saturation, electric conductivity (EC), salinity, and redox potential were controlled each day, after trickling filtration (before the rearing tanks) with a portable multimeter (Hach-Lange HQ40D, Germany). Weekly water samples were taken and analyzed in triplicate with an automatic photometric-analyzer (Gallery™, Thermo Fisher Scientific) to monitor concentrations of ammonium/ammonia (NH4+/NH3), nitrite (NO2), and nitrate (NO3). If the pH dropped below a threshold of 5, lime hydrate was added to the RAS or the water was changed in order to accordingly adjust the water quality. After starting the experiment, the settling tank was cleaned once a week; later, it was cleaned much more frequently to ensure system stability. The water quality parameters in the course of the experiment are summarized in Table 1.

2.2. Fish Stocking, Feeding, and Growth

Three different treatment groups were compared with a semi-intensive (100 kg m−3), intensive (200 kg m−3) and super-intensive (400 kg m−3) stocking density. On 18 January 2021, a total of 1848 African catfish juveniles of mixed sex were obtained from a local farmer (Fischzucht Abtshagen GmbH & Co. KG, Abtshagen, Germany). The fish were randomly stocked with either 88, 176, or 352 fish in 3 of the 9 tanks (randomized block-design), respectively, to reach an approximate final weight of 100, 200, or 400 kg m−3 at a slaughter weight of 1.5 kg. From each stocking density, 100 individual weight and length measurements were recorded as representative samples. Since newly added individuals are often harassed, fish in this study were not graded in order to avoid affecting the respective group compositions, and thus possibly influencing the results.
The fish were fed with a catfish diet (Alltech Coppens, pellet sizes of 1.5–4.5 mm) according to a commercial feeding protocol from Alltech Coppens for African catfish of 10–2000 g at 5.62–0.84% BW d−1. Feeding took place every two hours between 07:00 p.m.–05:00 a.m. by using automatic feeders. The FCR, the specific growth rate (SGR), and the condition index (CI) were calculated for each sampling date.
FCR = TFI/Wf − Wi
with TFI = total feed intake [g], Wi = initial fish weight [g], and Wf = final fish weight [g].
SGR = (ln(Wf) − ln(Wi))/t × 100
with Wi = initial fish weight [g] and Wf = final fish weight [g], t = days.
CI = fish mass [g] × 100/fish length [cm]3
After final sampling, the individual weights and total body lengths of 100 fish per stocking density were recorded again. The experiment was expected to last 5 to 6 months, depending on when the fish would reach their slaughter weight.

2.3. Sampling

All treatments were carried out in accordance with the EU guidelines 2010/63/EU for animal experiments and were approved by the relevant ethics committee.
The fish of the three treatment groups (semi-intensive, intensive, and super-intensive) were sampled at the beginning (i.e., after stocking and a one-week adaptation period) and regularly afterwards at 6-week intervals throughout the entire growth phase. In each sampling, three fish per tank (nine fish per treatment group) were anesthetized (eugenol bath, dosage: 50 mg L−1) and blood sampled over their caudal blood vessels within 5 min. Another three fish per tank (nine fish per treatment group) were anesthetized and blood sampled after additional induced stress; i.e., after netting and 30-min confinement in a tub without water but under humidification. According to Martins et al. [32], air exposure up to 1 h is a rather moderate stressor for African catfish. In each case, blood glucose and lactate levels were determined in situ using test strips (Roche, Accu Check Aviva/Accutrend Plus, Mannheim, Germany). The remaining blood was anticoagulated (BD Vacutainer, 5.4mg K-EDTA, Franklin Lakes, NJ, USA) and stored on ice for later centrifugation (Hettich Universal 320 R, 10 min at 10,000 rpm and 4 °C, Tuttlingen, Germany). The plasma was separated from the cells. Cortisol was analyzed in the plasma by enzyme-linked immunosorbent assay (ELISA, Cusabio fish cortisol, sensitivity: 0.0023 ng mL−1, Wuhan, China) according to the manufacturer’s instructions using a micro-plate reader at 450 nm (iMark, Bio-Rad, Hercules, CA, USA). The cortisol concentrations were then calculated using a standard curve with Curve Expert 1.4.
The number and area of skin lesions were recorded for each fish. In order to determine the lesion area, a clear template with a 0.25 cm2 grid was placed over each lesion and the smallest possible area was recorded. All lesion areas per fish were then calculated. Sex, total body length, and weight were recorded. Each sampled fish was also implanted with a microchip (Mini Star ID, 1.4 × 8 mm) at an identical position, subcutaneously, close to the dorsal fin, in order to distinguish ‘experimental fish’ from accompanying fish, which were not sampled, later on. The latter were kept among the experimental fish to achieve the respective stocking densities. After sampling, the anesthetized fish were transferred to an aerated recovery tank and returned to their respective tanks after reflexes and reactivity were regained.
The final sampling was preponed by one week (in week 23 instead of week 24), because the fish had already reached their slaughter weight. Afterwards, all fish were weighed (in groups) and double checked for microchips. All fish with microchips were separated from the accompanying fish, properly stunned, killed, and separately disposed.

2.4. External Stressor

During the course of the experiment, at about the time of the third sampling, renovation work began in the adjacent building of the RAS facility used. This resulted in an unexpected stressor for the fish due to considerable noise impact. The demolition noise occurred for several hours each day and continued for several weeks, especially covering samplings 3 and 4. Therefore, the experiment can be divided into three different phases, the regular experiment between sampling 1 and 2, the time where the demolition noise took place (samplings 3–4), and a phase without any further disturbance (sampling 5). The noise level was not acoustically measured, but as it involved chiseling off ceilings and rebuilding exterior facades with heavy machinery, it can be assumed that > 90 dB was reached [33].

2.5. RNA Isolation and Multiplex Quantitative PCR

Total RNA was extracted from individual spleens (n = 3 per group: stressed or unstressed fish under semi-intensive or super-intensive stocking densities from sampling 3 or sampling 5) using 1 mL TRIzol Reagent (Thermo Fisher Scientific, Waltham, MA, USA). After RNA purification using the RNeasy Mini Kit (Qiagen, Venlo, The Netherlands), the RNase-free DNase I (Qiagen) was used to digest residual DNA. Then, the concentration and the purity of the extracted RNA were assessed using a NanoDrop OneC spectrophotometer (NanoDrop Technologies, Wilmington, NC, USA).
The expression of four reference genes (rna18s, rpl, actb, gapdh) and twenty-two target genes (Table A1; [34]) was profiled in the extracted RNA specimens from all of the groups using the integrated fluidic circuit (IFC) technology of the Standard BioTools Gene Expression biochips. The multiplex quantitative PCR (qPCR) analyses were performed on one 48.48 IFC chip (Standard BioTools, South San Francisco, CA, USA) using the BioMark HD system (Standard BioTools). To this end, the total RNA was adjusted at a concentration of 10 ng µL−1 and reverse-transcribed (42 °C, 30 min) using the Reverse Transcription Master Mix (Standard BioTools). The resulting cDNA aliquots were mixed with primers (100 µM) and the PreAmp master mix (Standard BioTools), and preamplified in 15 cycles (95 °C, 15 s; 60 °C, 4 min) in a TAdvanced thermocycler (Biometra, Jena, Germany). After this pre-amplification step, exonuclease I (New England BioLabs, Ipswich, MA, USA) was added to degrade single-stranded oligonucleotide primers, followed by a 30-min incubation period at 37 °C. Then, 43 µL TE buffer (Sigma, St. Louis, MO, USA) was added per sample and each 50-µL-cDNA sample was diluted in SsoFast EvaGreen Supermix with Low ROX (Bio-Rad) and 20 × DNA Binding Dye Sample Loading Reagent (Standard BioTools) to produce the sample mixes. After priming the 48.48-IFC chip in the MX Controller (Standard BioTools), the primers and the sample mixes together with one no-template (water) control were transferred to the assay and sample inlets on the primed 48.48-IFC chip. Finally, multiplex qPCR was conducted following the manufacturer’s thermal protocol ‘GE Fast 48.48 PCR + Melt v2.pcl’.

2.6. Statistics

Statistical tests were conducted with the Statistical Package for the Social Sciences (SPSS, v. 25, IBM Corp., 2017, Armonk, NY, USA) statistical software package. First, the resulting data were tested for distribution. Then, the non-parametric Kruskal-Wallis test by ranks and post hoc multiple range tests were conducted; Tukey’s-HSD test for variance homogeneity and Dunnett-T3 test for variance inhomogeneity. Significance values were adjusted for several tests by the Bonferroni correction. All tests were performed with a significance level of p < 0.05.
For plasma cortisol and glucose, significances were only indicated within one sampling between stressed and unstressed fish of one single treatment group, as well as between stressed or unstressed fish of different treatment groups. No distinction was made between stressed and unstressed specimens for weight, length, CI, lactate, lesion number, and lesion area. Significances were indicated in this regard between treatment groups of one single sampling, as well as between similar treatment groups of different samplings.
The qPCR data were analyzed using the Fluidigm RealTime PCR Analysis Software (v. 4.5.2, South San Francisco, CA, USA) and normalized against the geometric mean of three suitable normalizer genes (rna18s, actb, gapdh). Copy numbers were calculated on the basis of ideal standard curves assuming a primer efficiency of 100%. GraphPad Prism software (v. 9.1.0, San Diego, CA, USA) was used for the statistical analysis of the normalized qPCR data. Significant differences (p < 0.05) between the different groups were assessed using two-way analysis of variance (ANOVA) followed by a Holm-Šídák’s post hoc test to correct for multiple comparisons.

3. Results

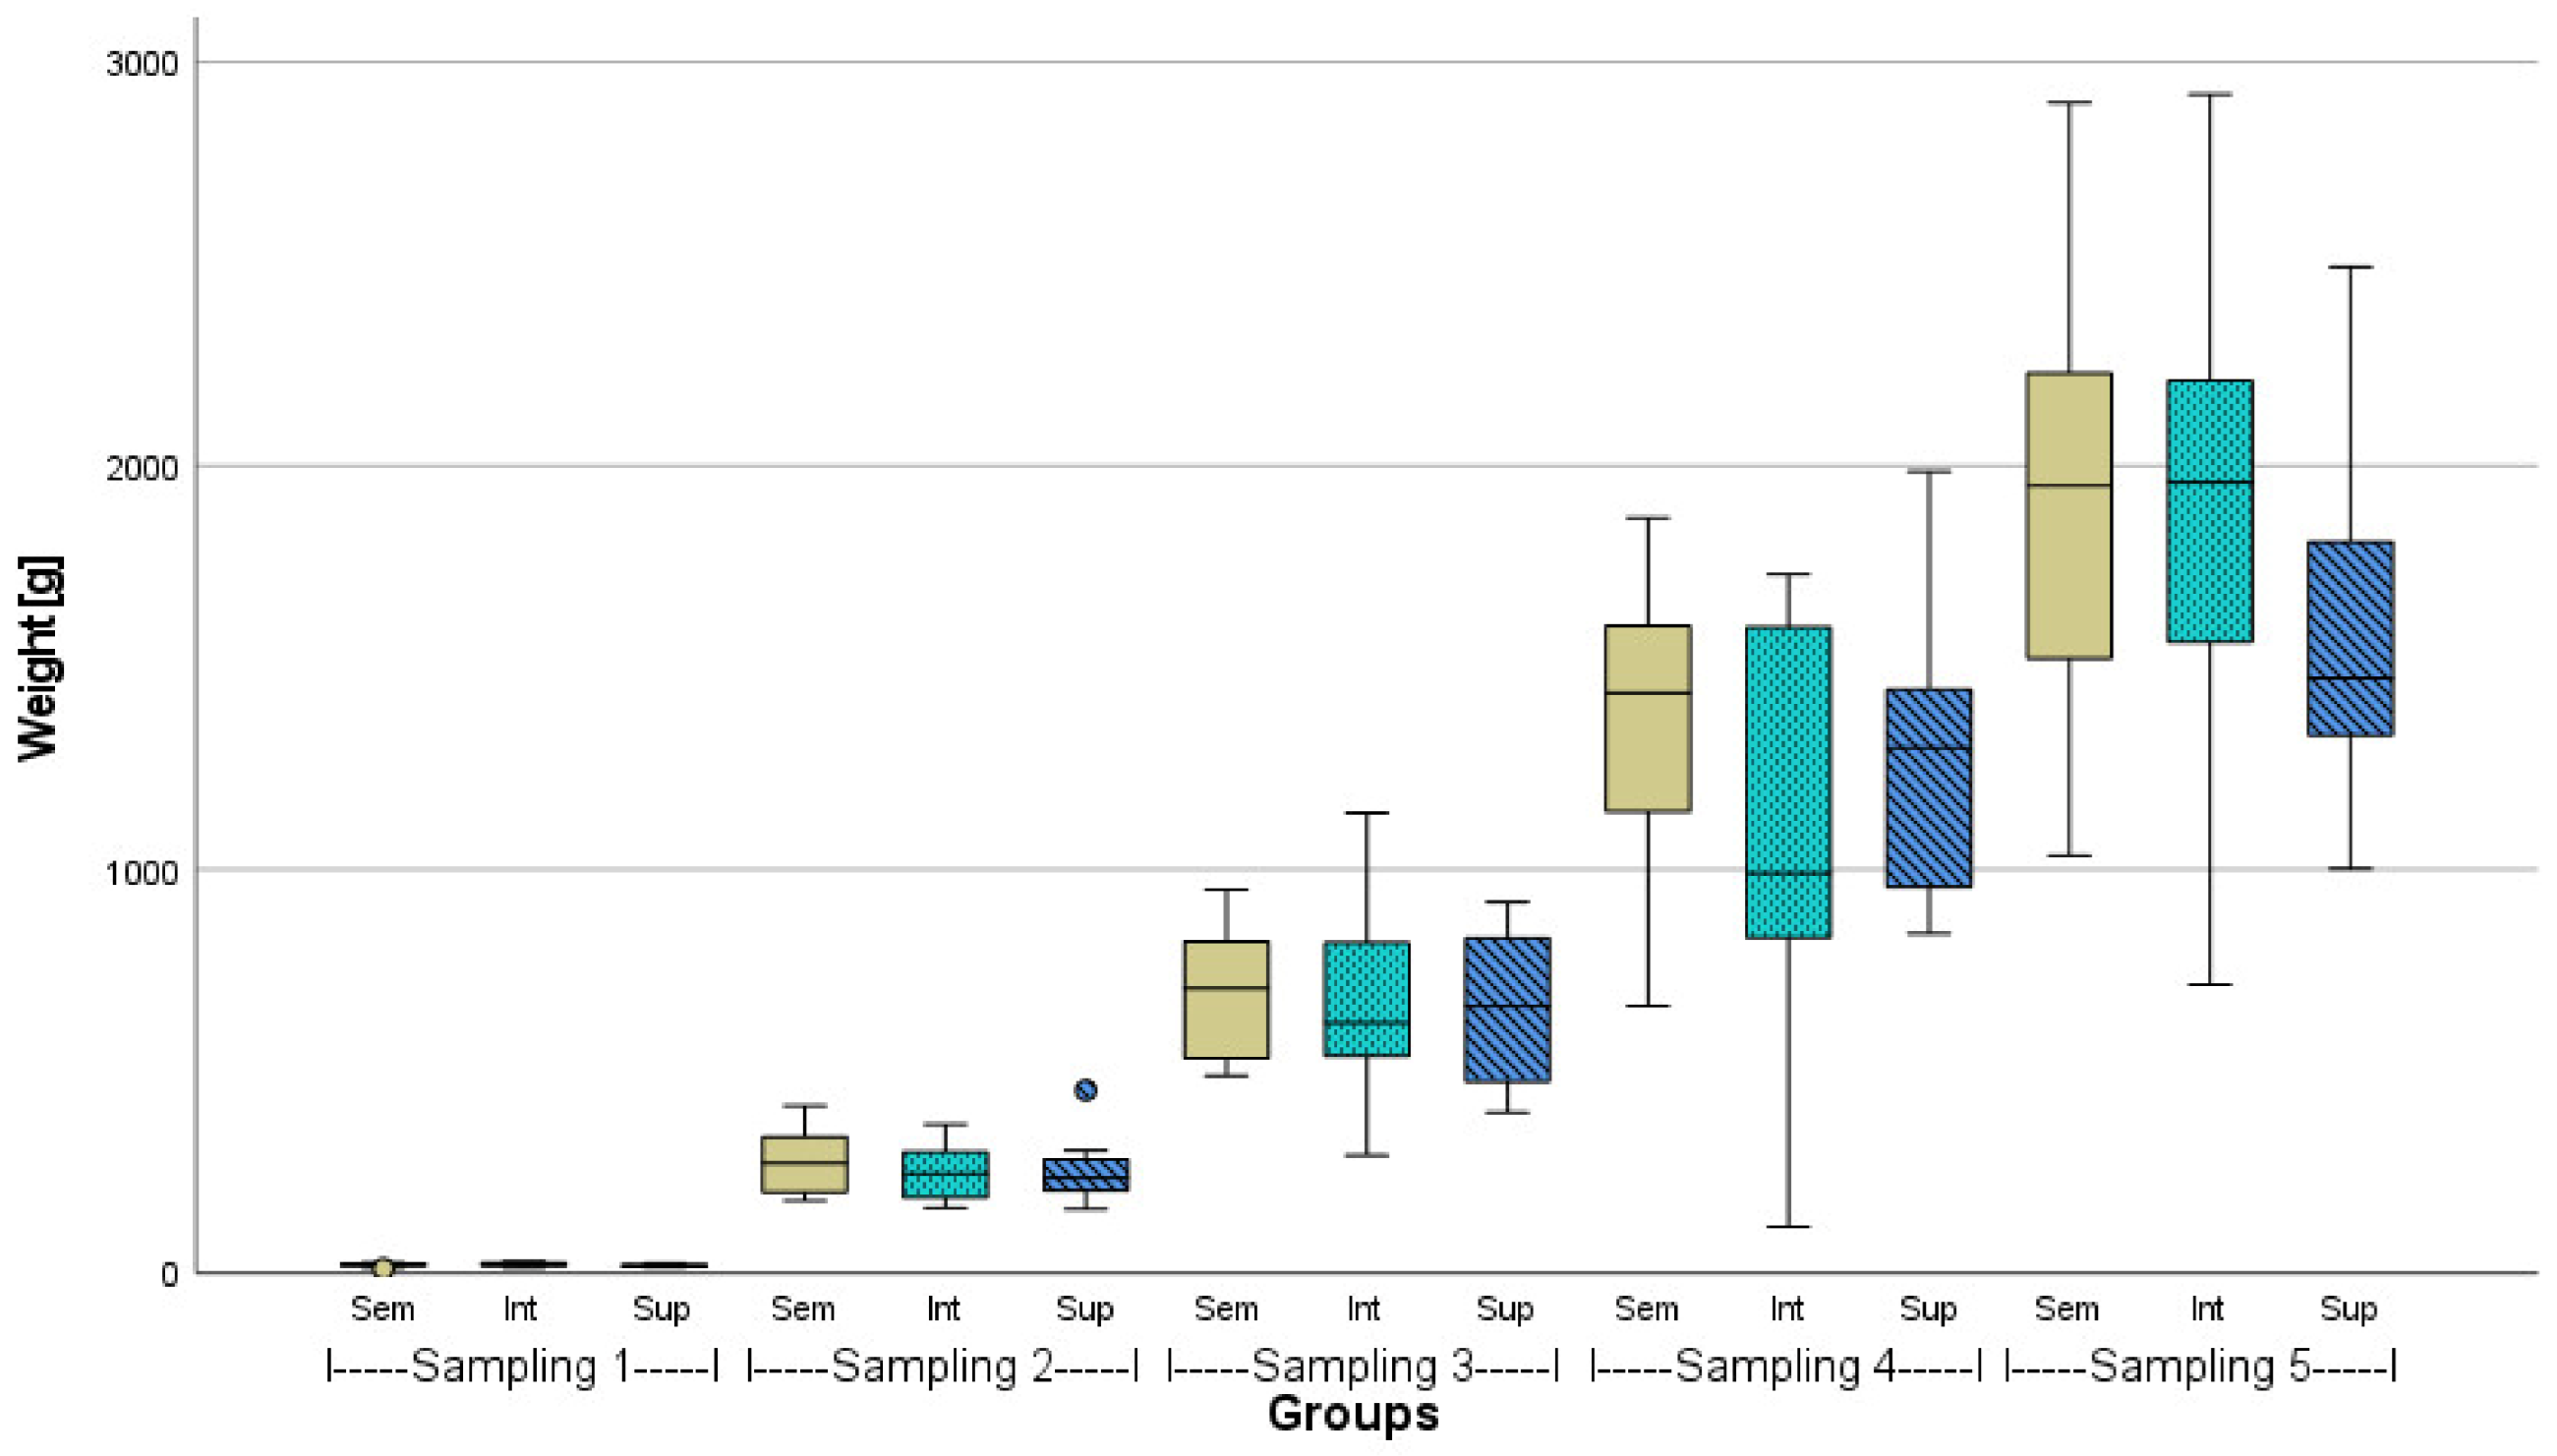
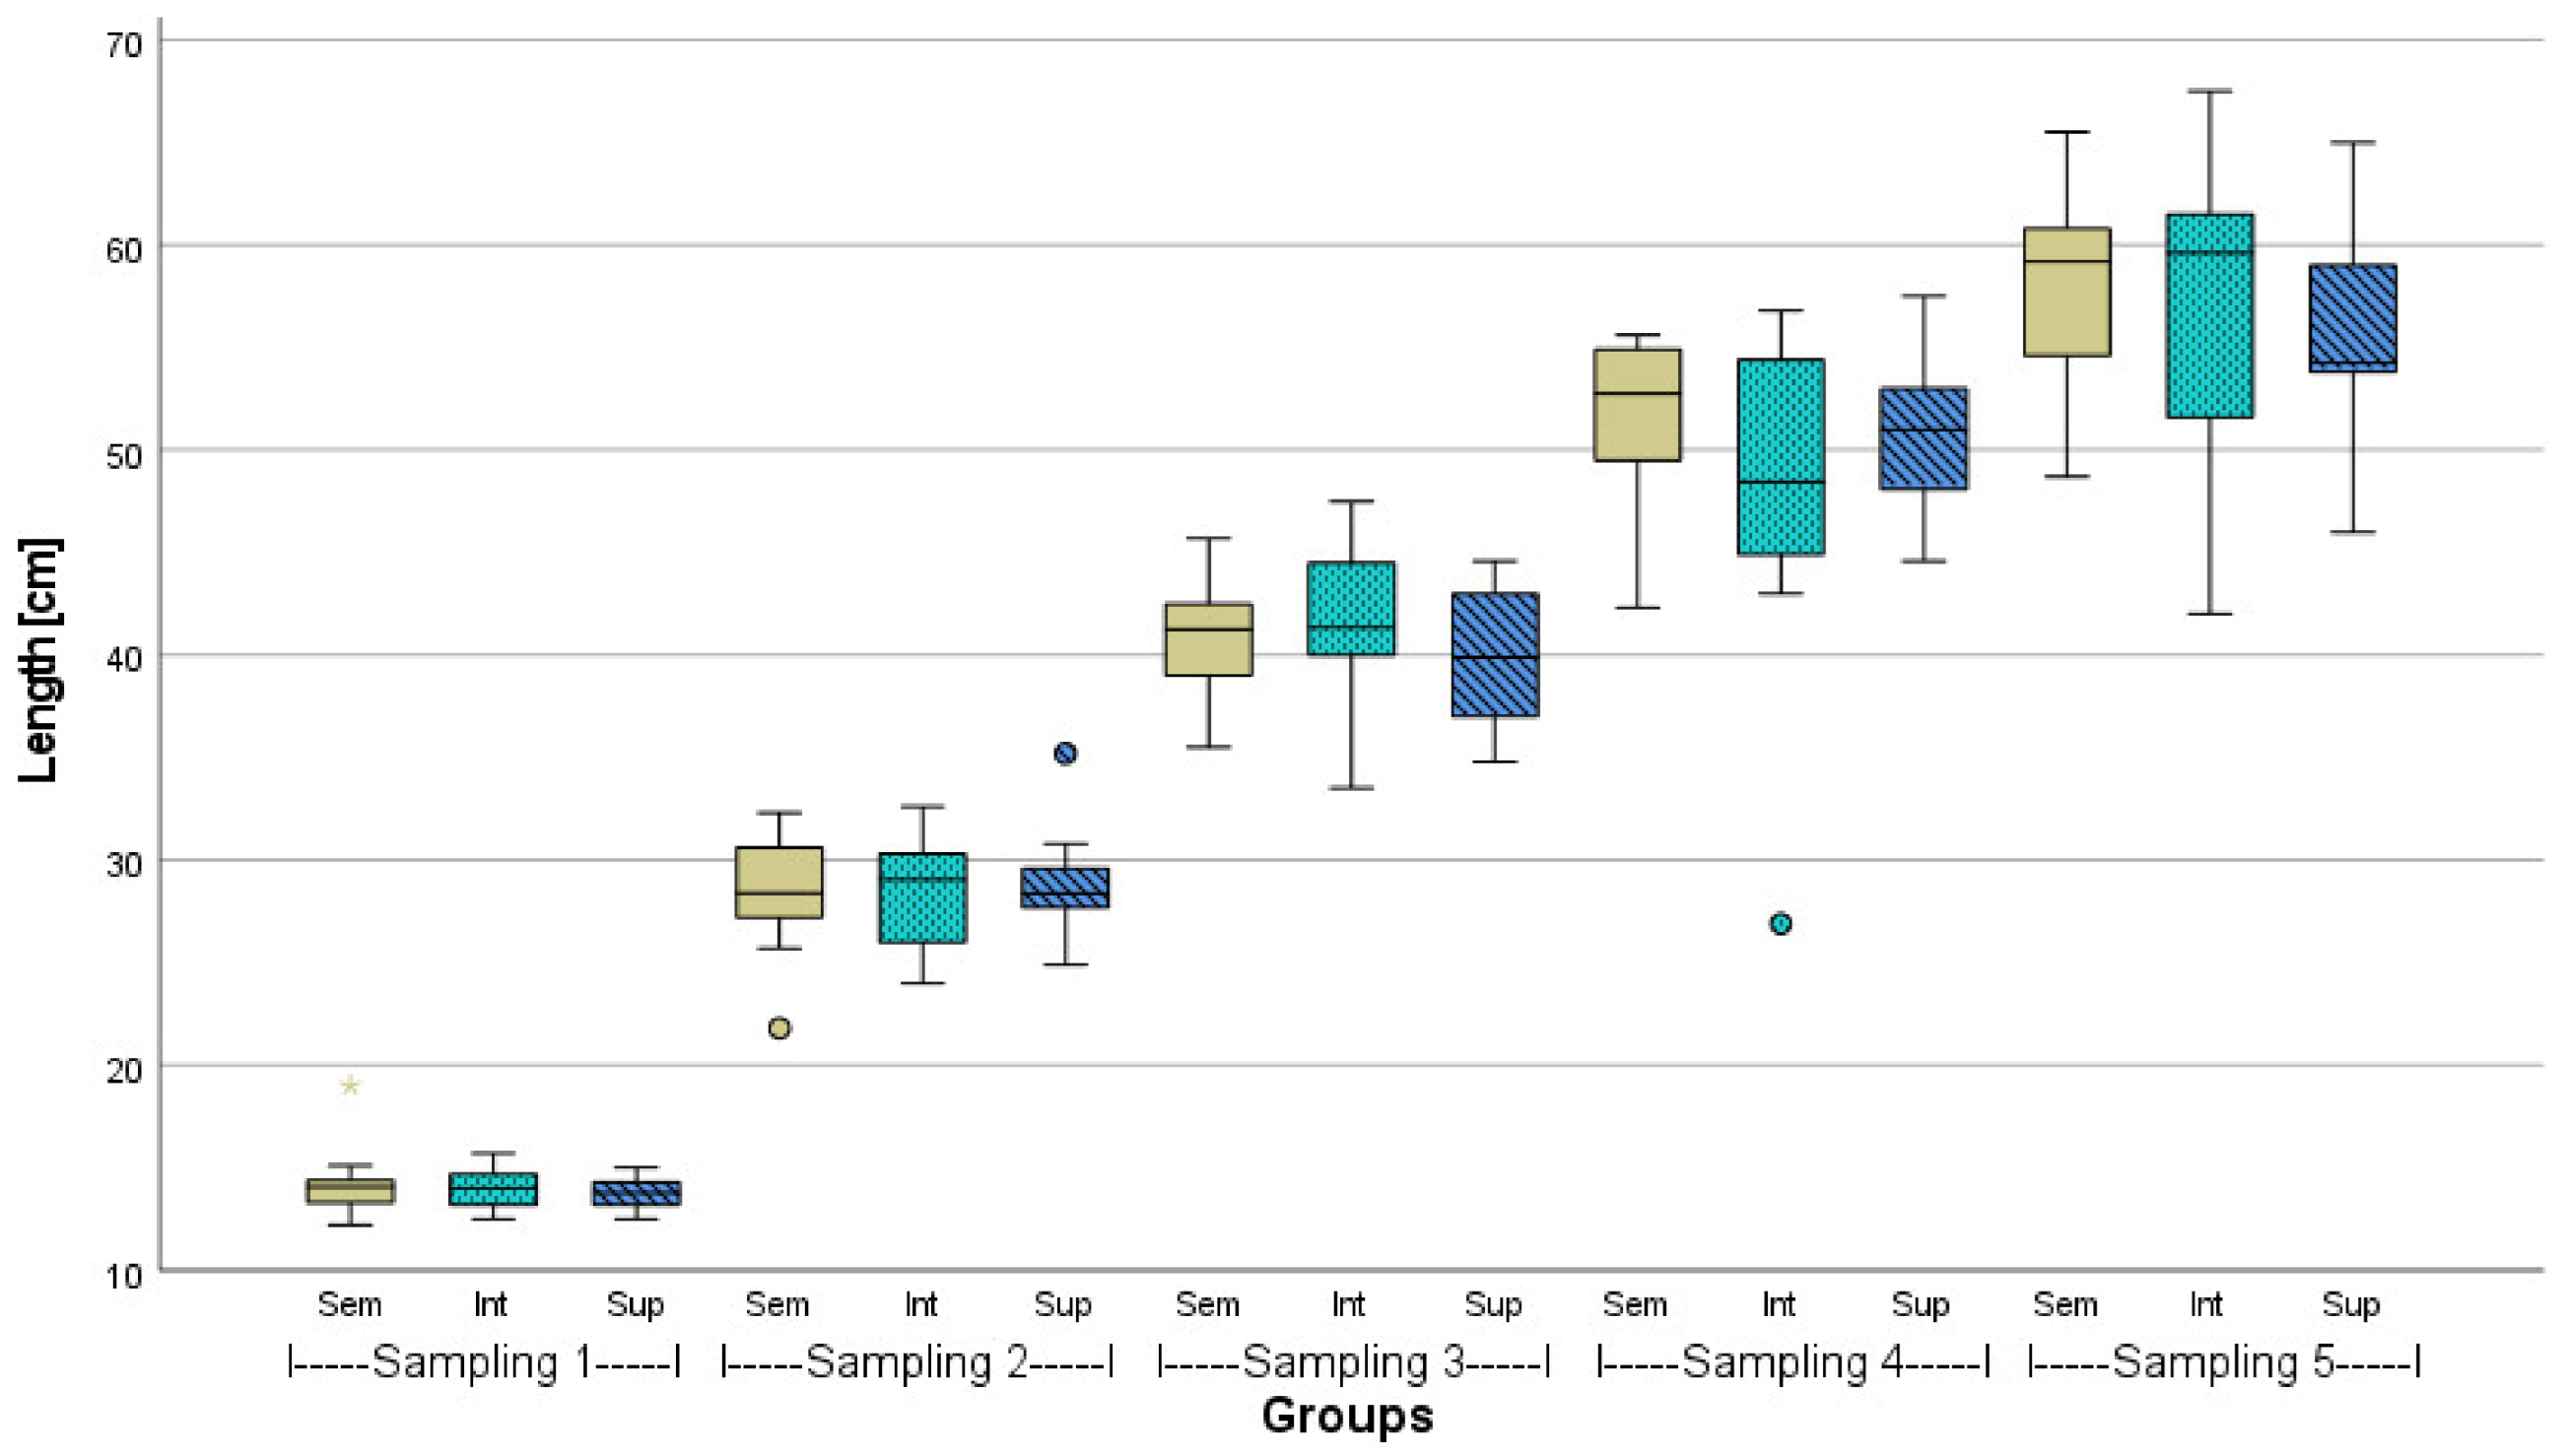
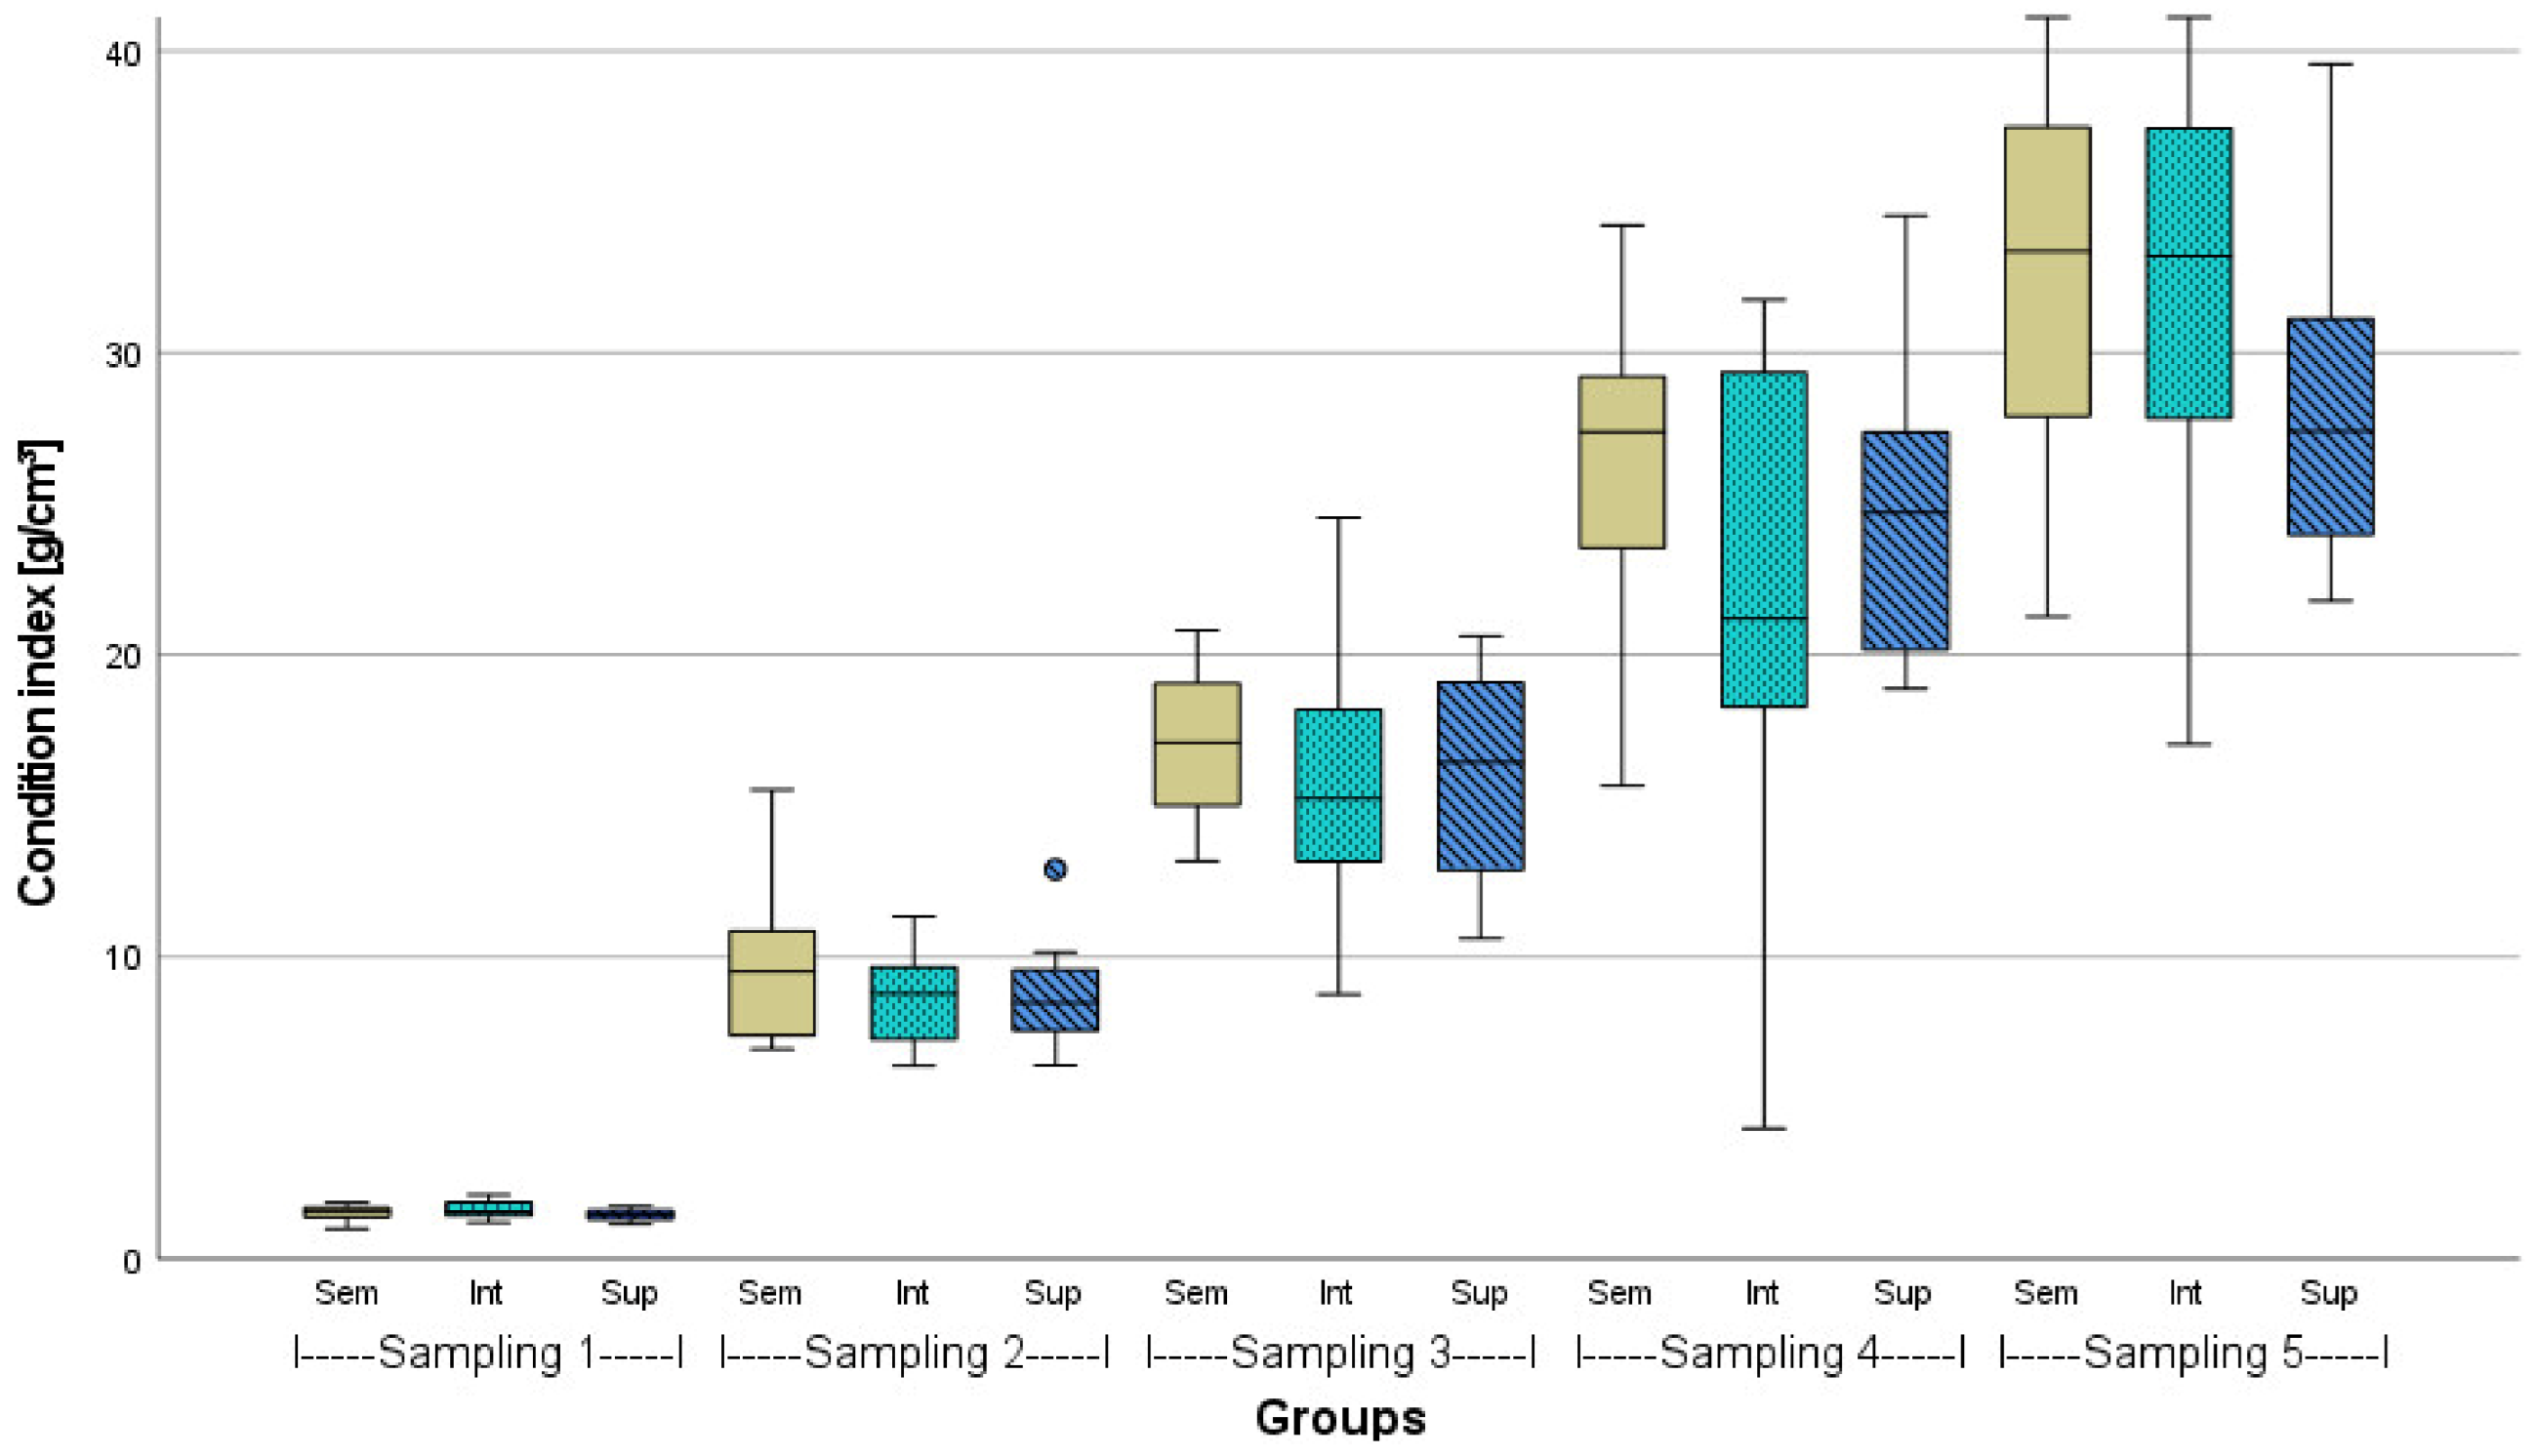
3.1. Fish Growth Performance

The mean initial and final weights and lengths of African catfish (n = 100) from the different stocking densities are given in Table 2. Before stocking, the weights of the representative sampling (n = 100) were statistically the same (p > 0.05). However, the lengths of the 100 fish measured in the intensive stocking density were found to be significantly different from both other groups. After 23 weeks, the mean weights in the semi-intensive density were about 200 g higher than in the higher stocking densities and significantly different from the super-intensive density (p < 0.05). In one semi-intensive and two super-intensive tanks, a few fish were caught due to organ sampling. That is why the stocking density is slightly lower at the end in these respective tanks. A comparative growth performance, including the CI of the fish from the three stocking densities over the course of the experiment based on sampling after 6 weeks each (n = 18), is given in the Appendix (Figure A1, Figure A2 and Figure A3).
The FCR tended to increase in all three stocking densities. Between the second-last and final sampling (T4 and T5, Table 3), the intensive stocking density showed the lowest FCR and, therefore, the best feed conversion rate. Throughout the entire experiment, the super-intense stocking density showed the comparatively weakest FCR. The SGR decreased with increasing age or weight of the fish. Comparing the three stocking densities, the highest SGR values were recorded under an intensive stocking density between T0 and T1, T2 and T4, and between T4 and T5 (Table 3).

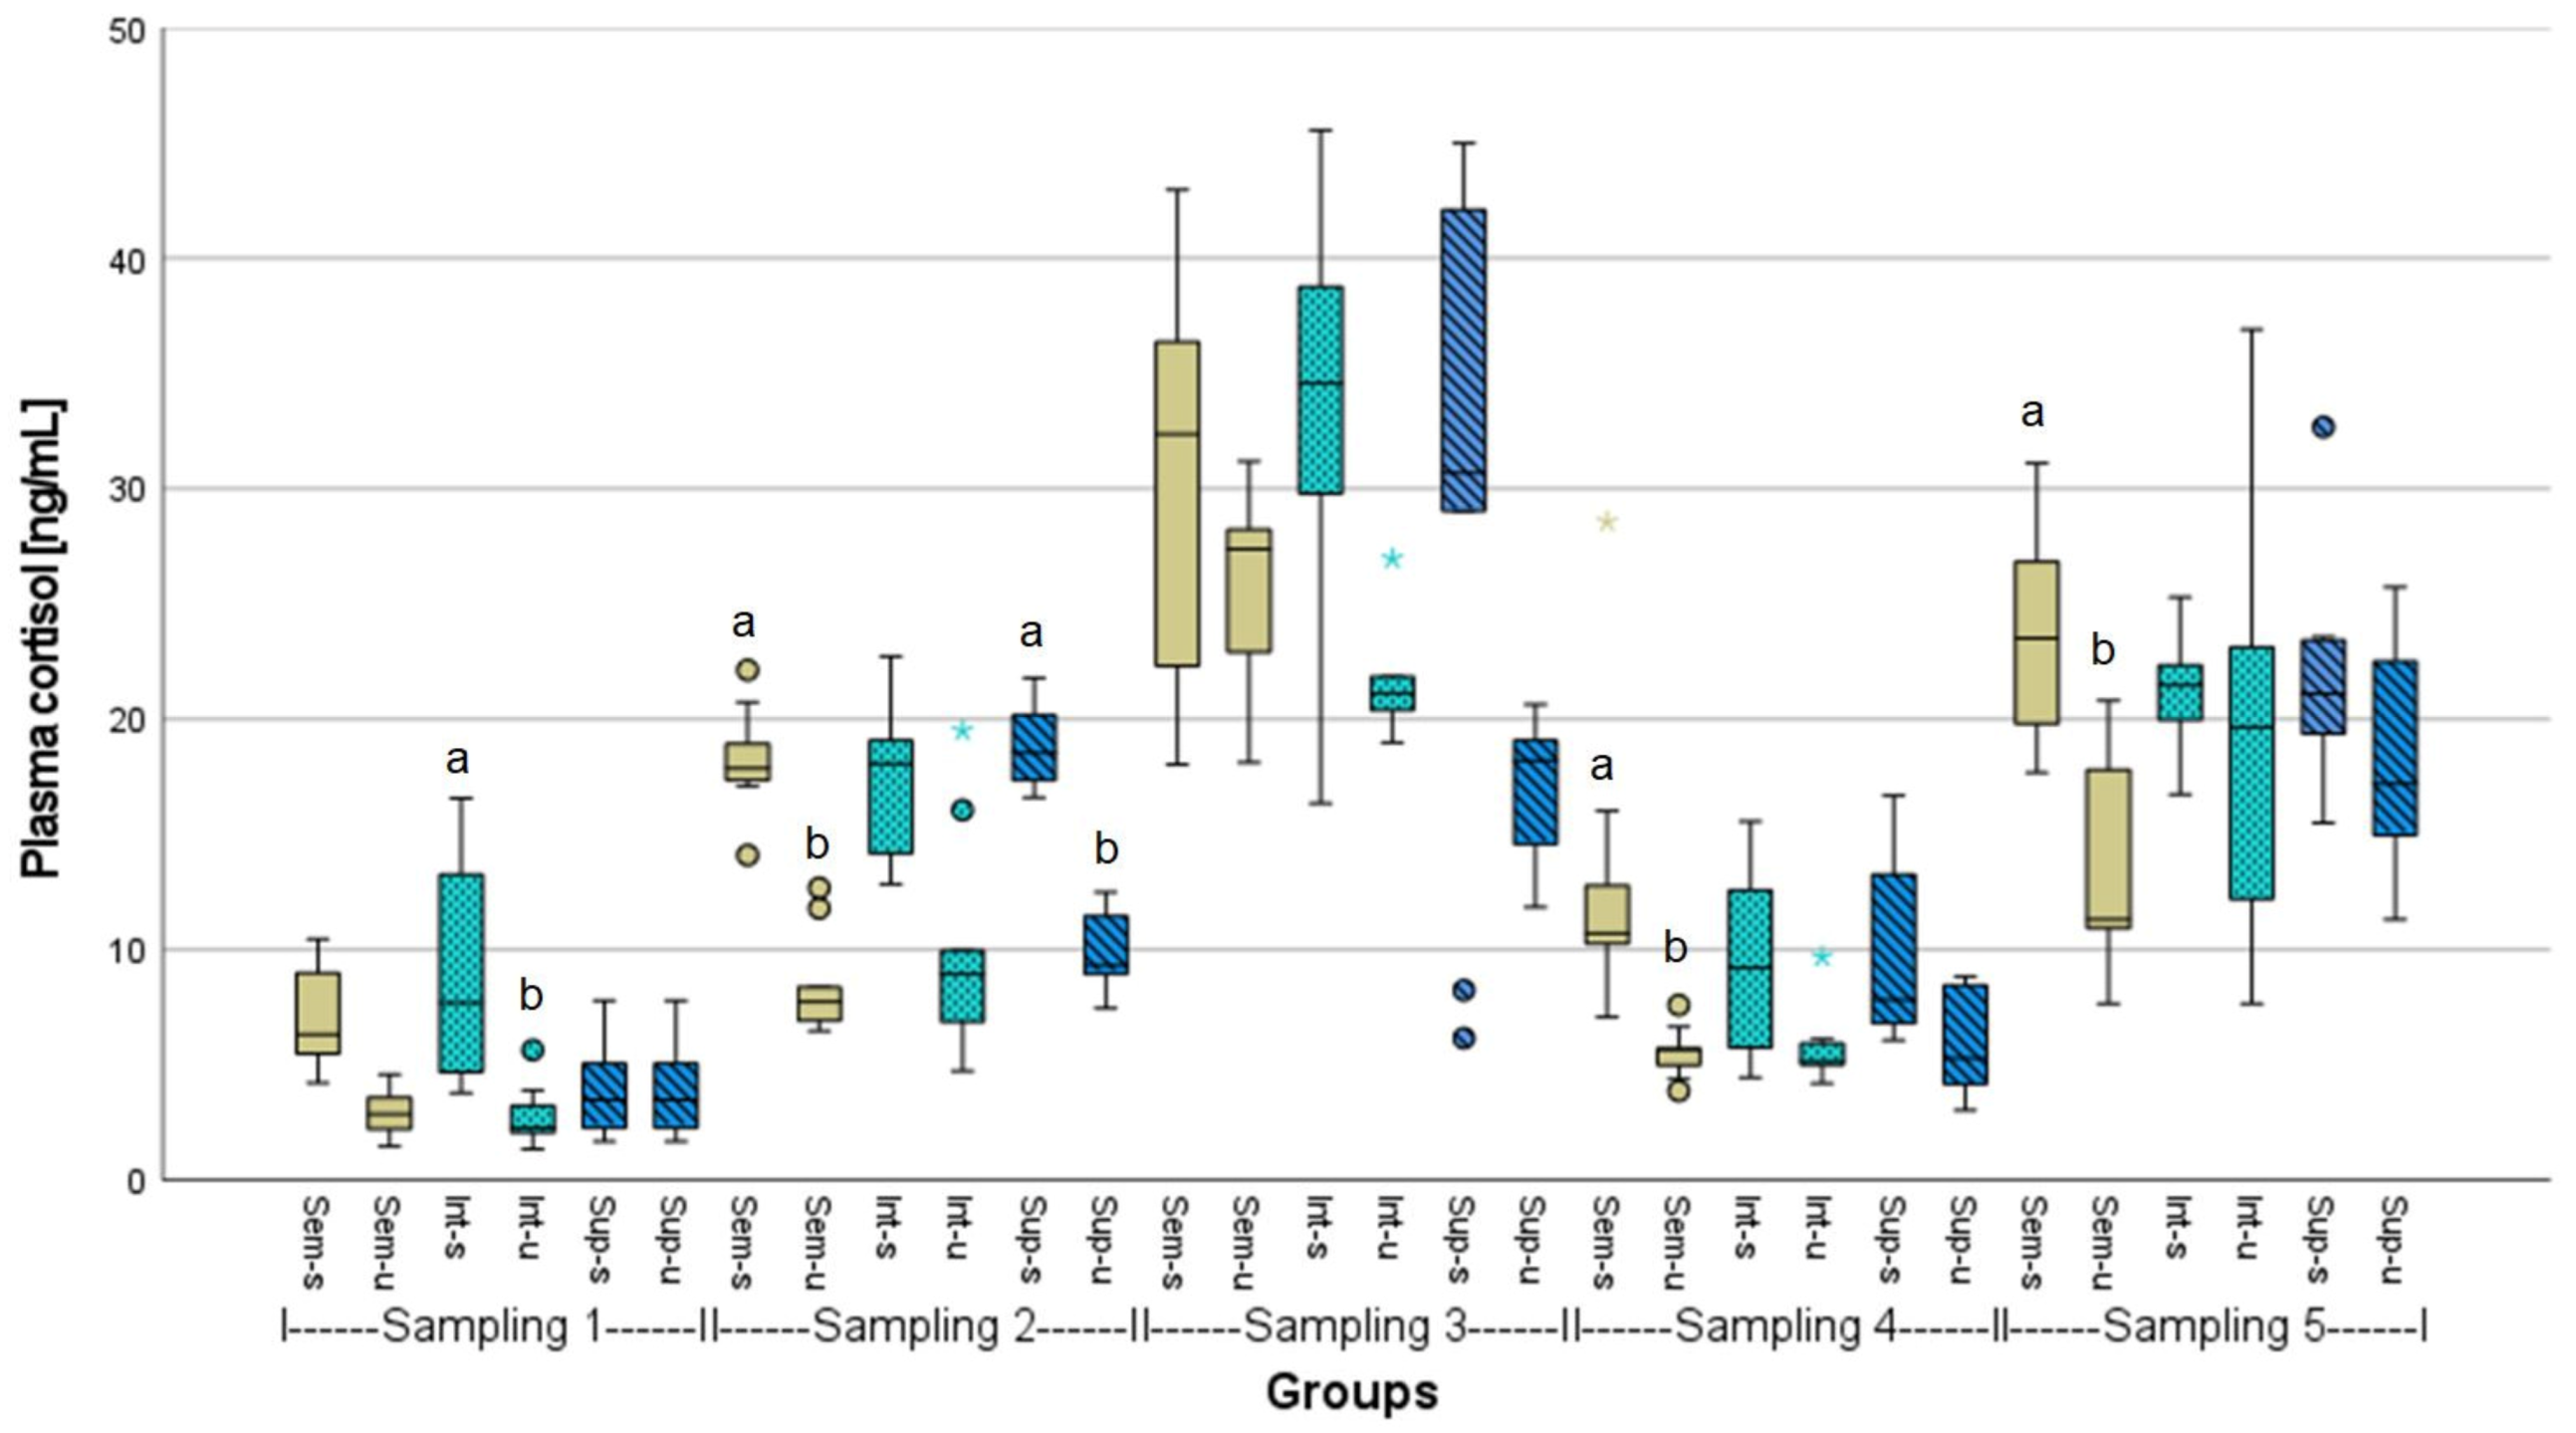
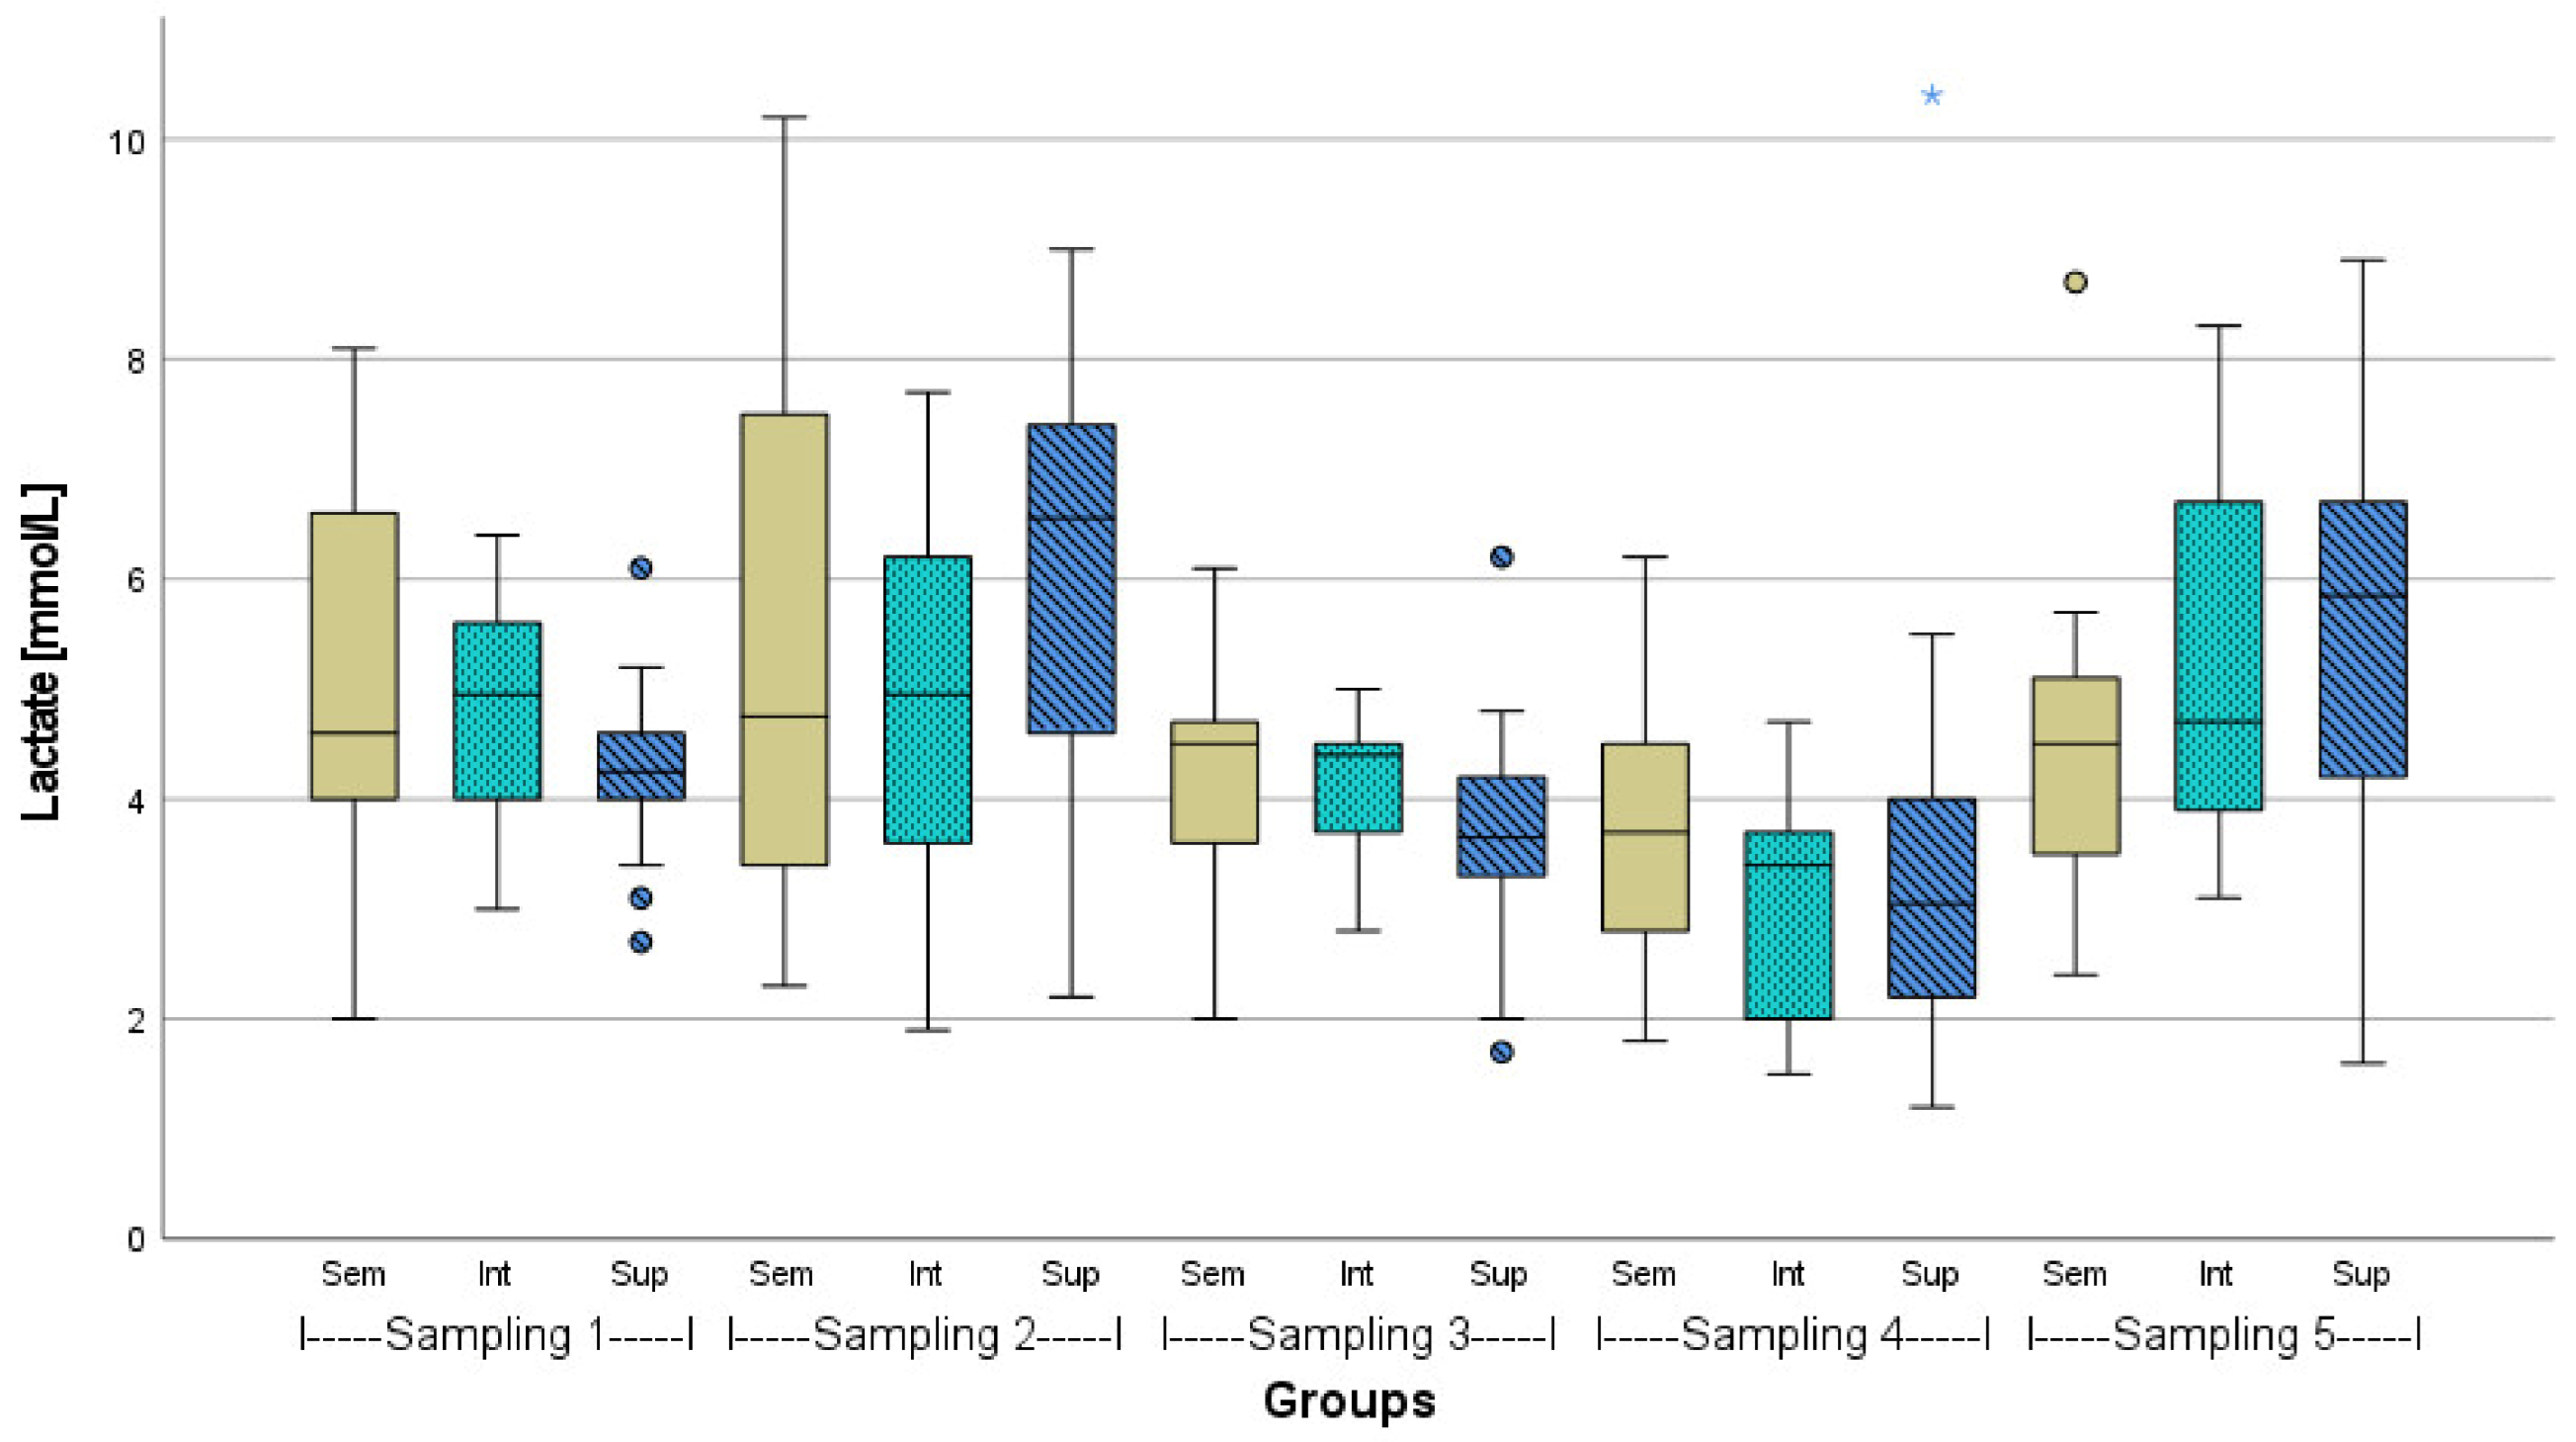
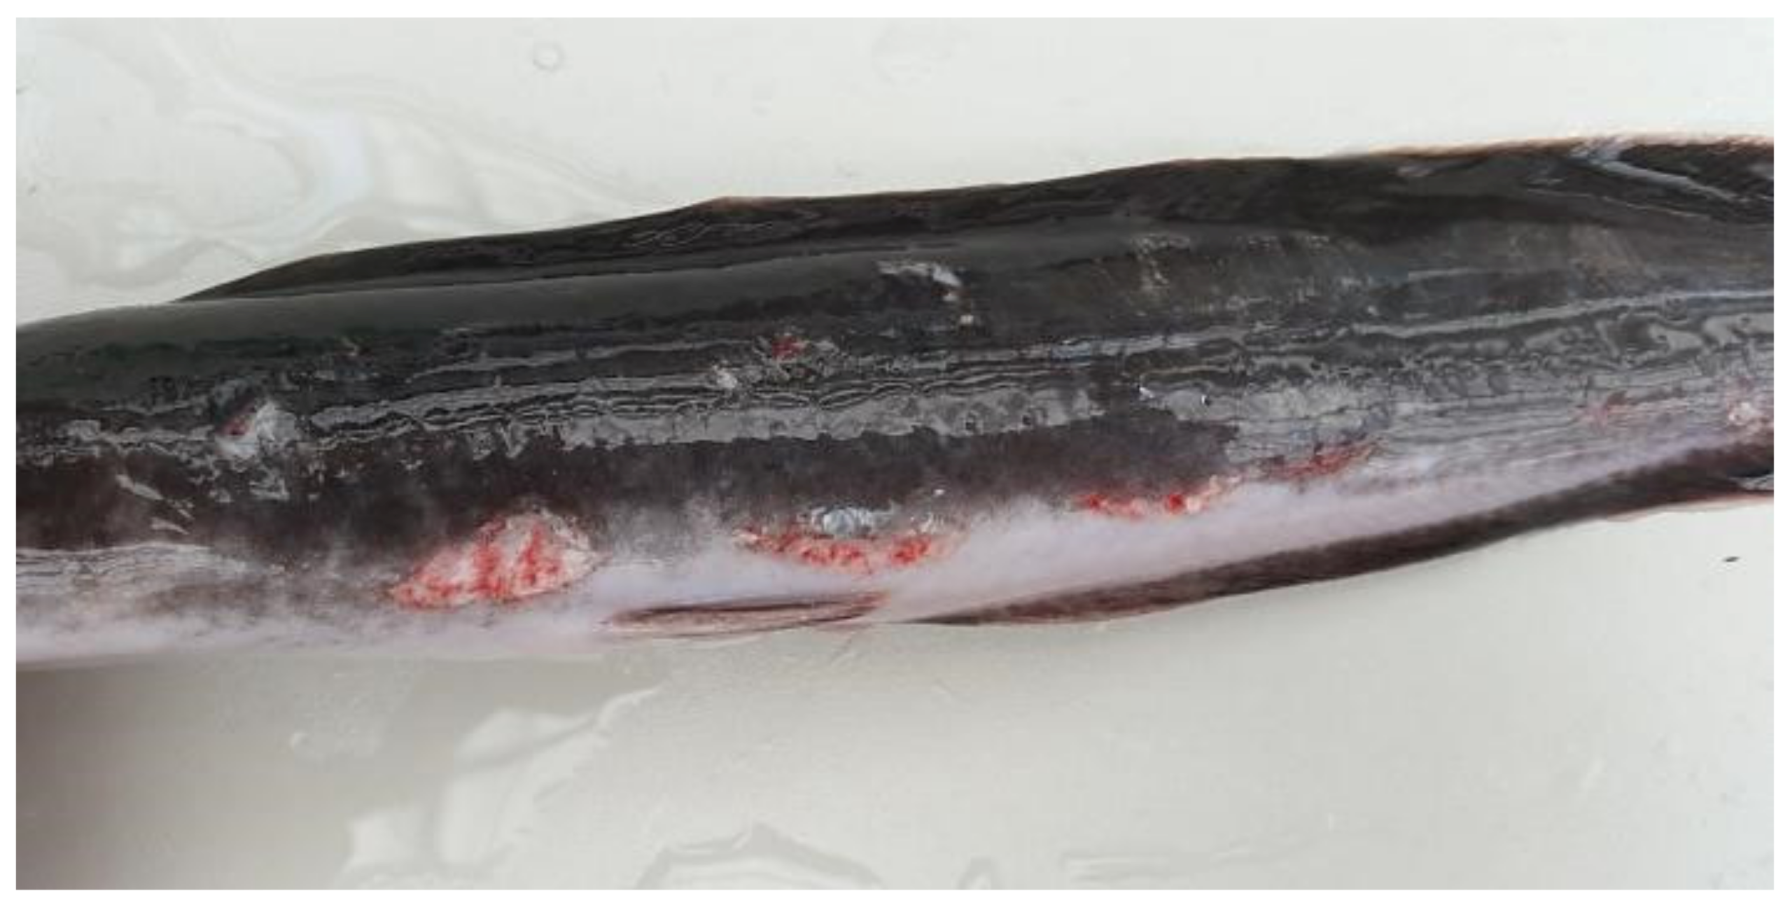
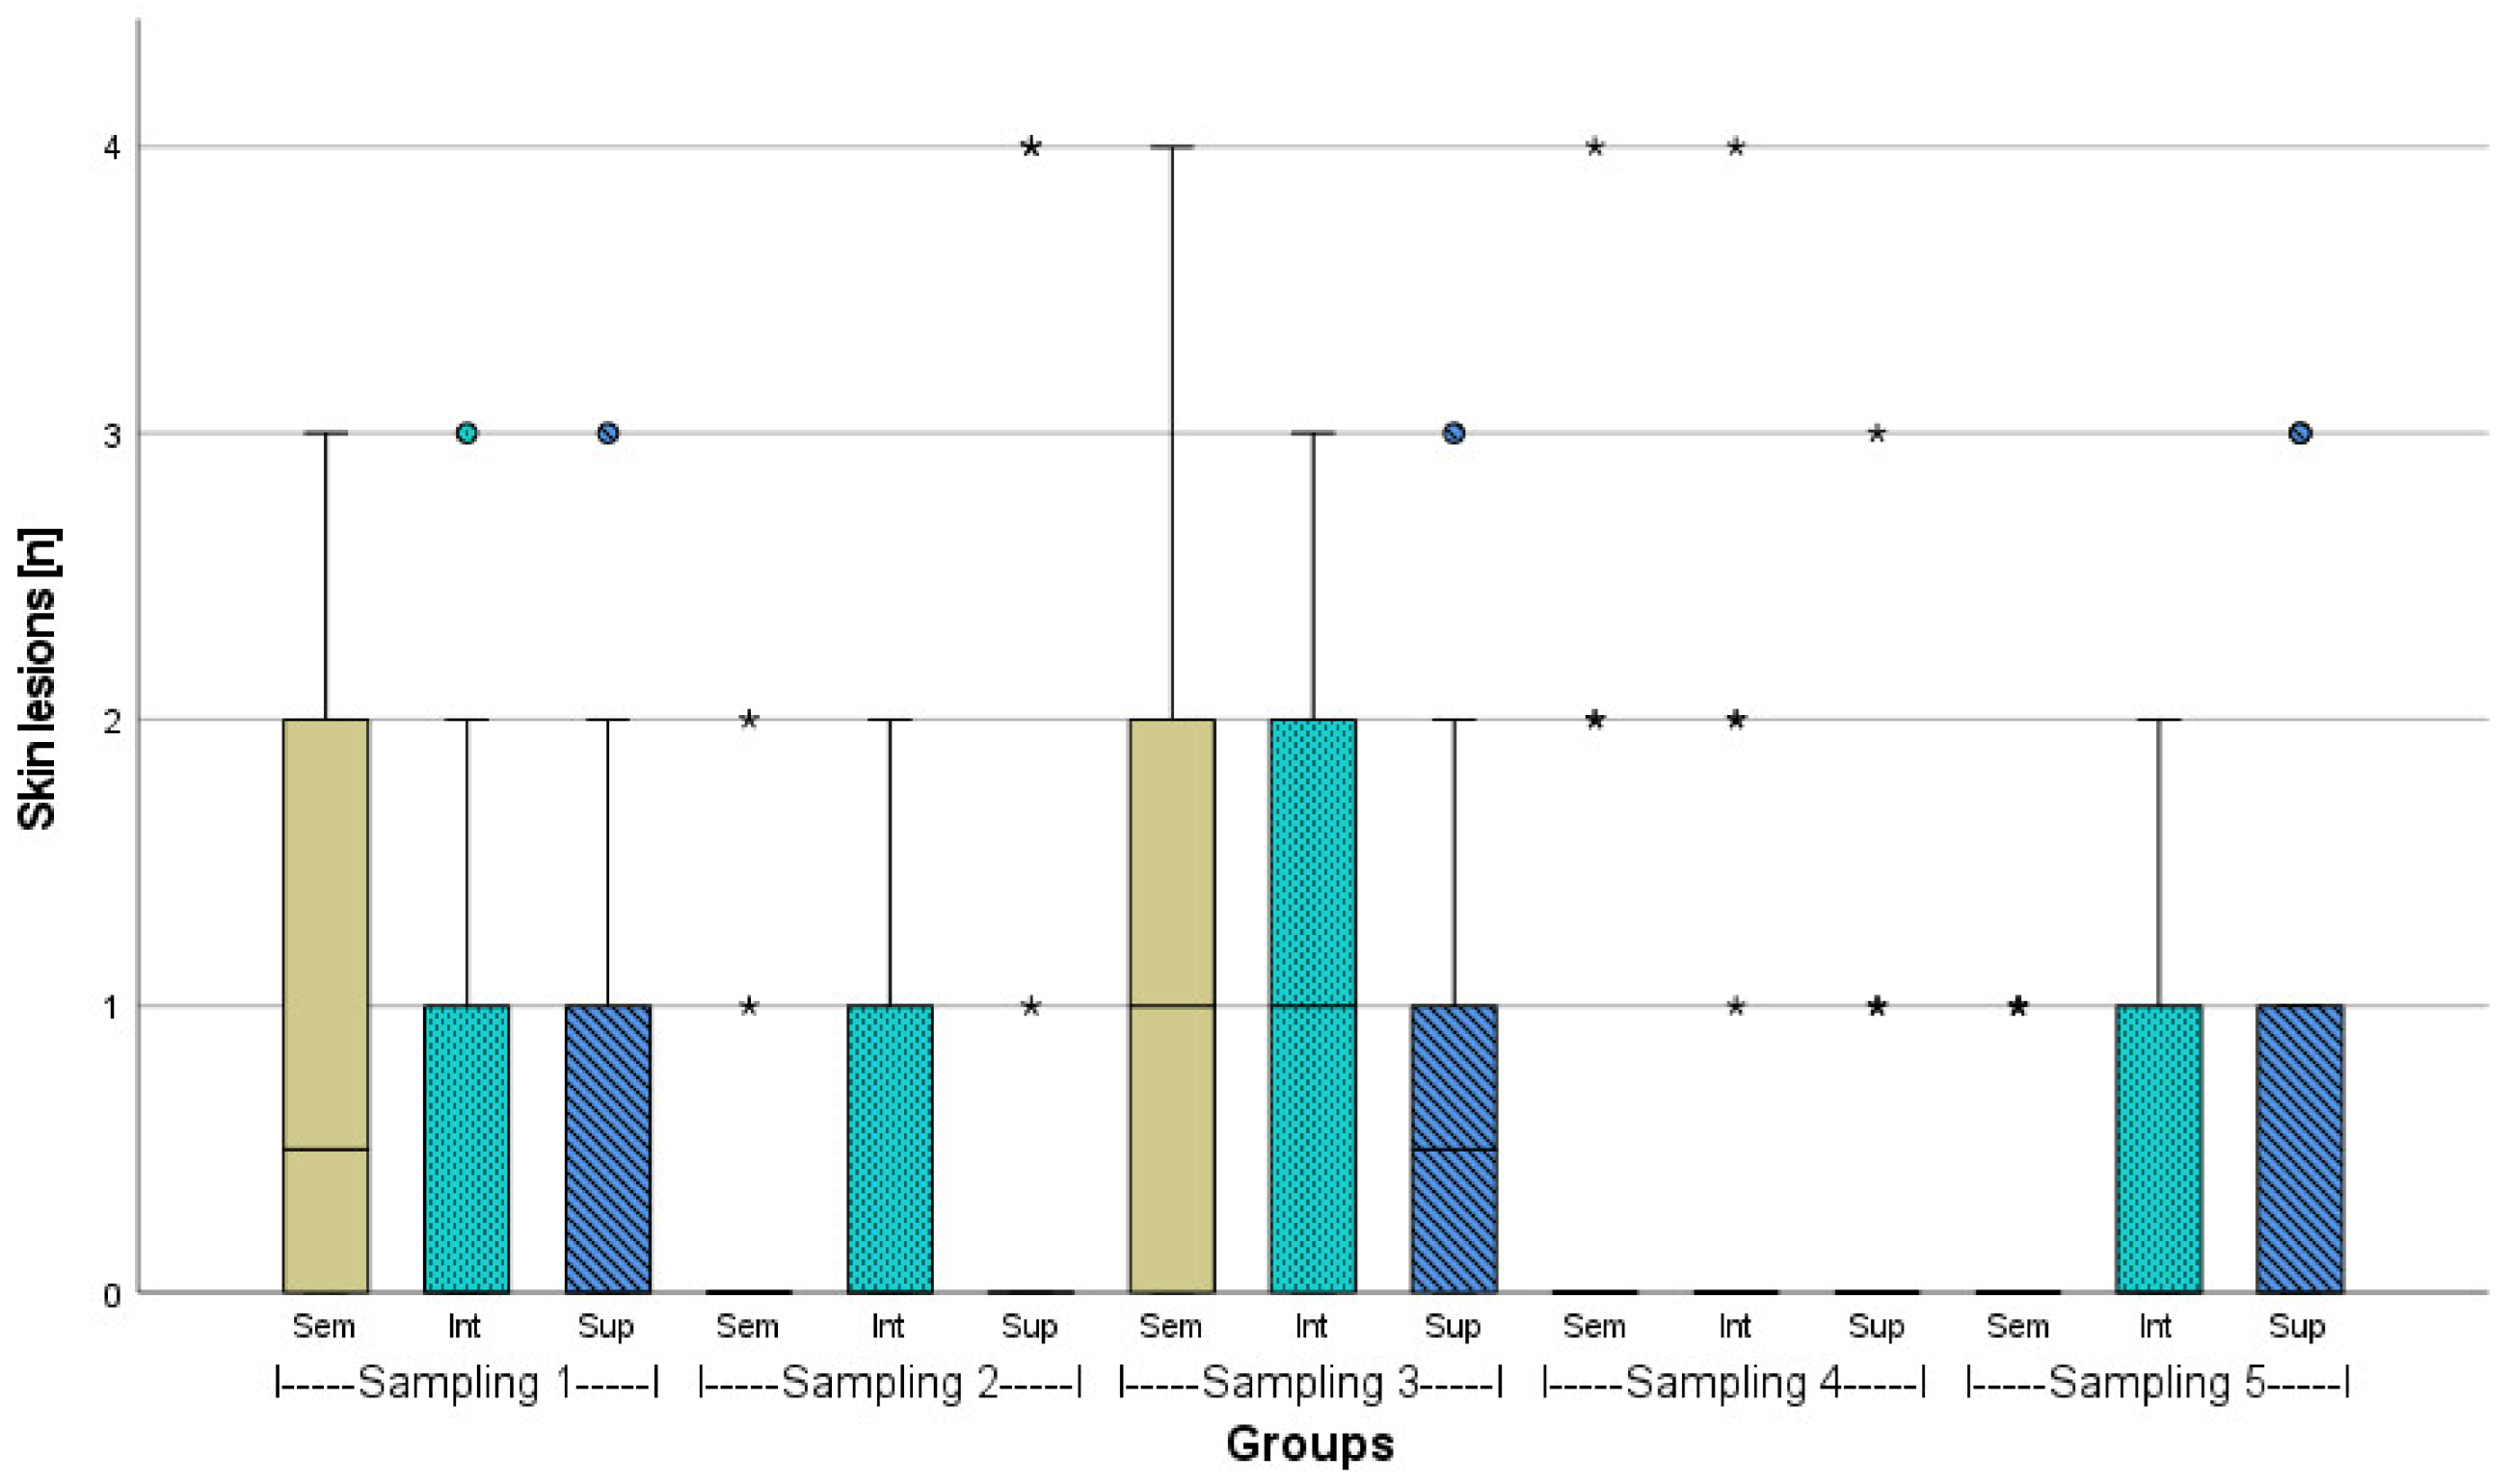
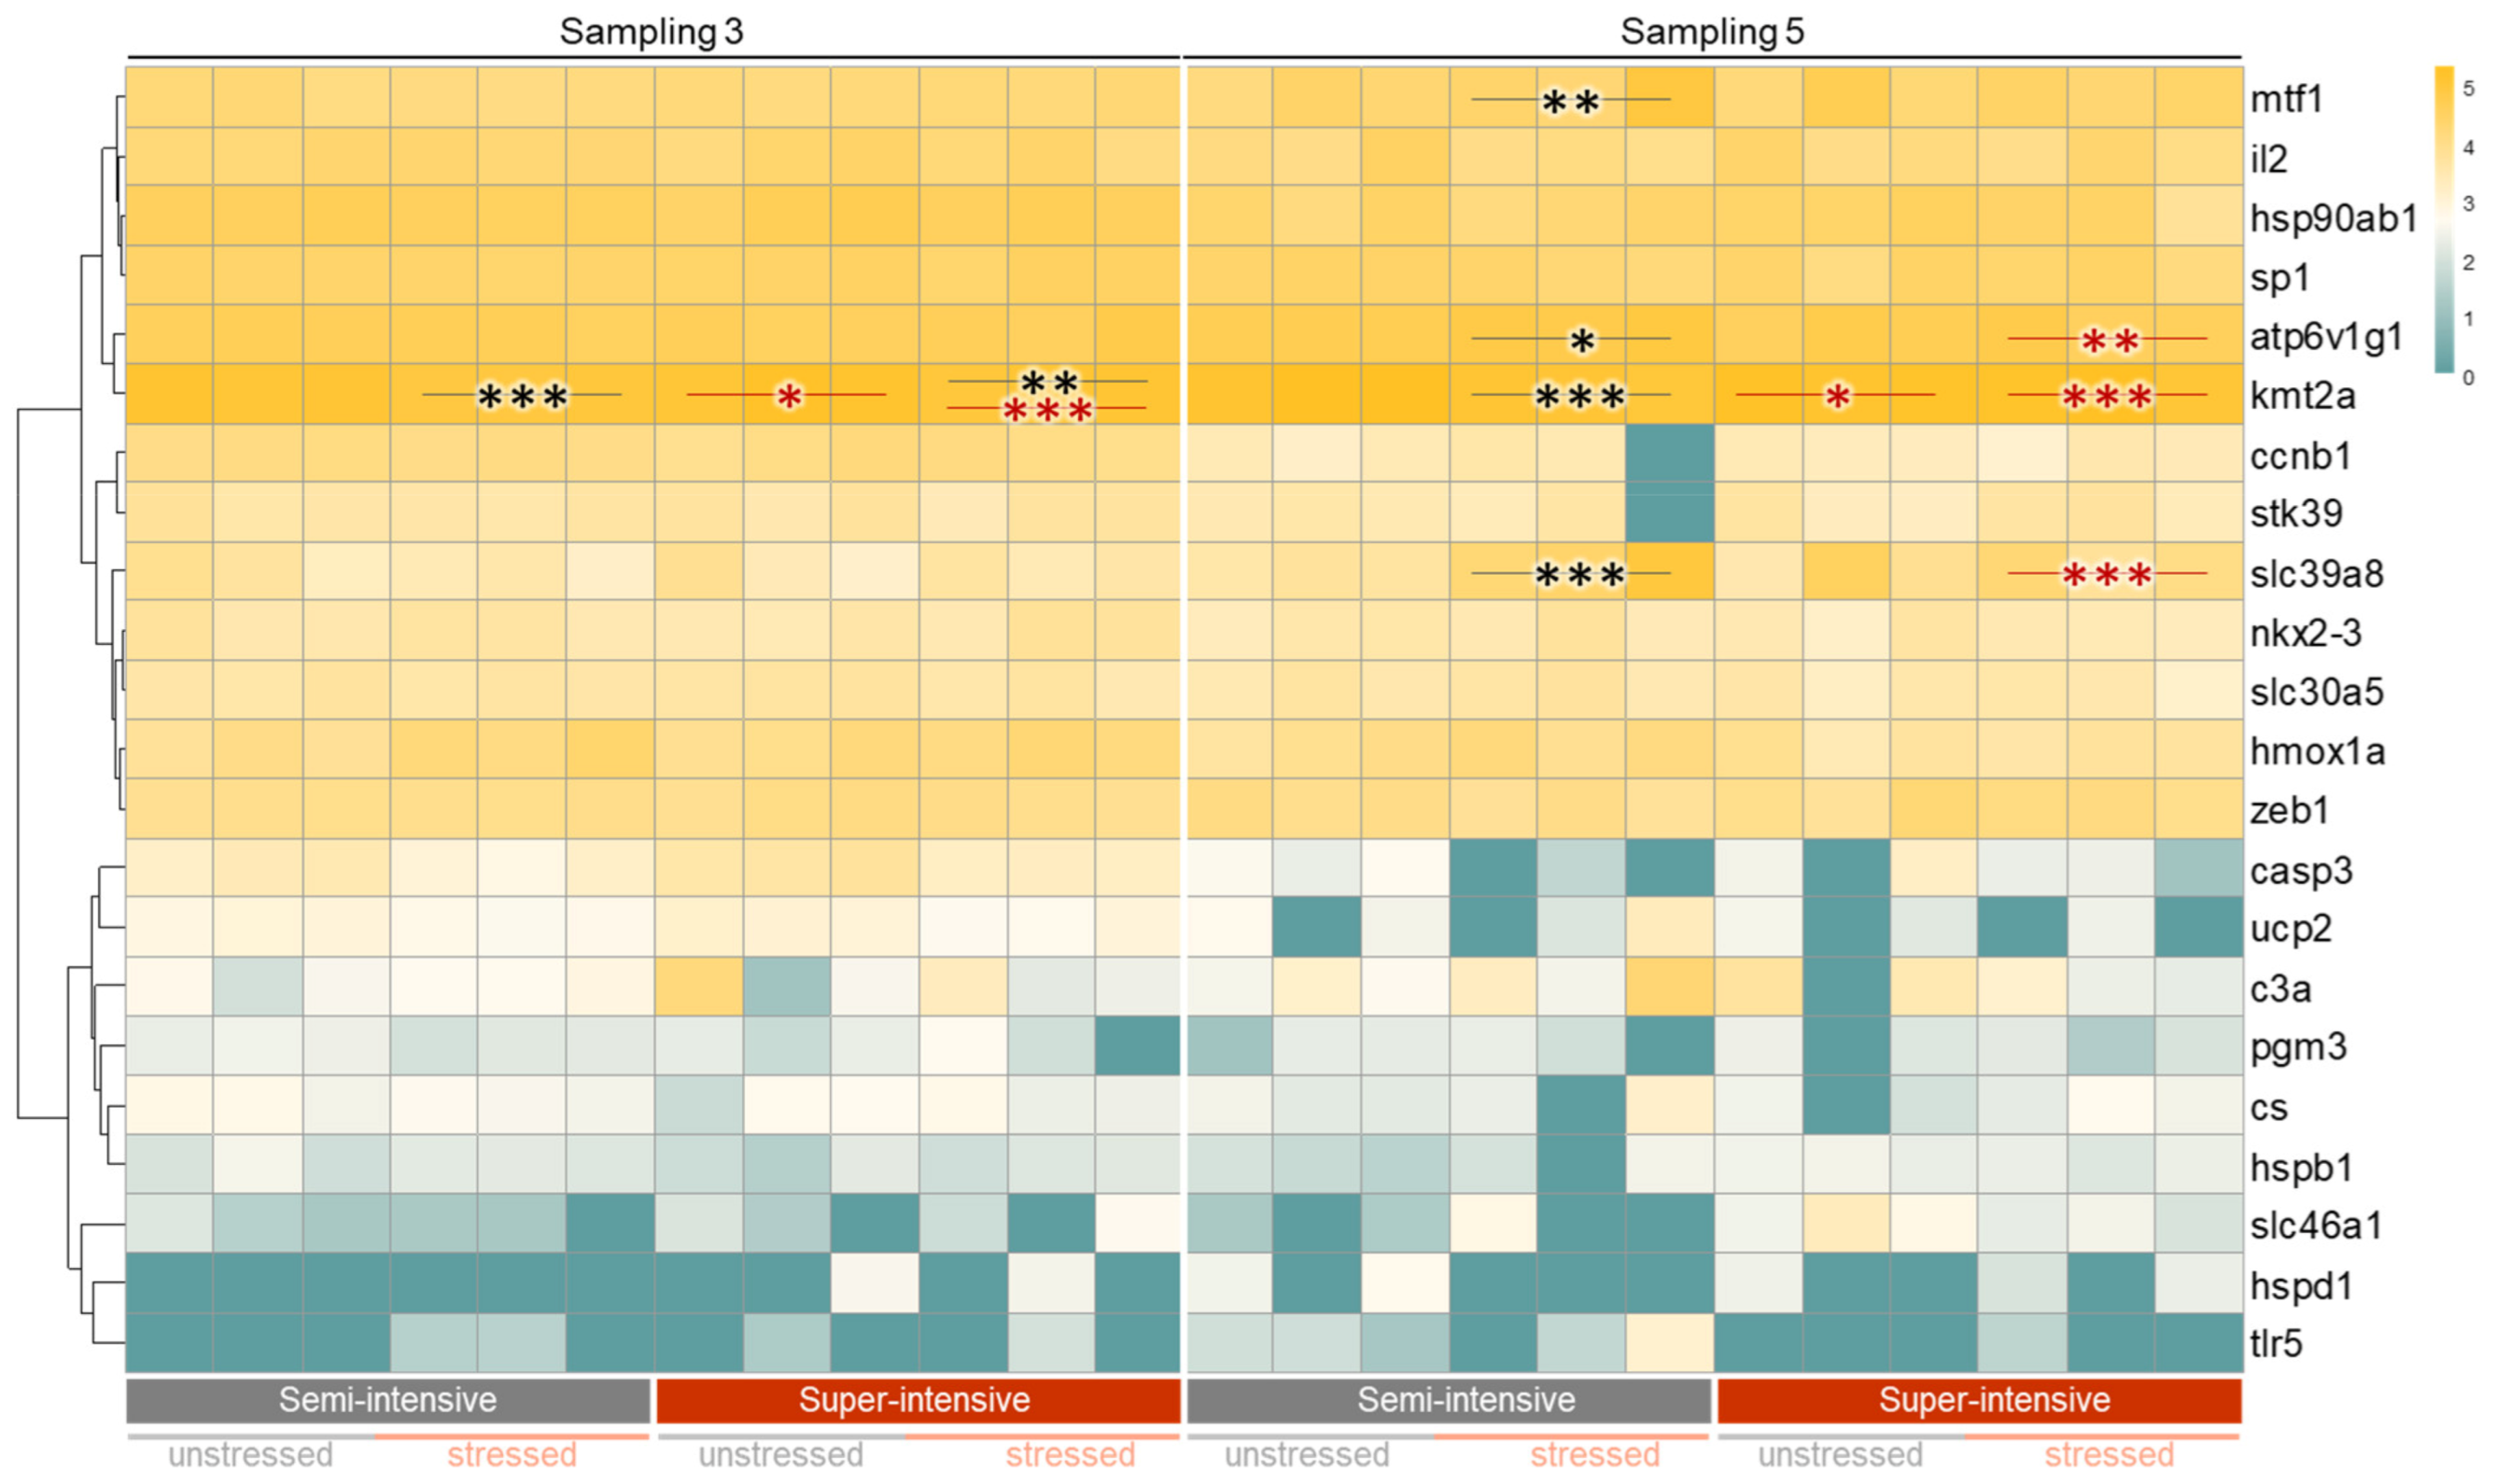
3.2. Evaluation of Fish Welfare

Mortality varied between the rearing tanks, ranging from 2.59% to 14.62% (Table 4). The intensive stocking density showed the lowest mortality in total, while the super-intensive stocking density showed the highest mortality on average (p > 0.05). No increased mortality was observed during the phase of demolition noise.
The mean plasma cortisol responses of samplings 1, 2, 4, and 5 were in a range of 2.7 to 24.1 ng mL−1 (Figure 1). Significant differences between unstressed and stressed fish, but not between the different stocking densities, were found within the respective samplings. At the first sampling, the cortisol responses were identical between stressed and unstressed fish kept at the super-intensive stocking density. The highest cortisol levels during the experiment, with most values between 17.1 and 32.2 ng mL−1, were recorded in the third sampling, meaning the beginning of the second phase of the experiment, when the demolition noise likely affected the fish. However, during the fourth sampling, cortisol levels had already returned to the normal range, although the demolition noise was still ongoing. All relevant significances within a single sampling between unstressed and stressed fish in a treatment group, as well as between unstressed or stressed fish in a treatment group between different samplings, are given in Table A2.
Blood glucose mainly ranged between 3.8 and 8.1 mmol L−1. There were significant differences between unstressed and stressed fish within the sampling groups. However, there were no significant differences between different stocking densities within a single sampling. Notably, the mean glucose values mainly were higher at the third sampling, and the interquartile ranges and upper Whiskers were mostly wider compared to the majority of boxplots at other samplings (Figure A4).
The lactate values mainly ranged between 2 and 8 mmol L−1 (Figure 2). There were neither significant differences between the different stocking densities within one sampling nor between the samplings. Nevertheless, in the second phase of the experiment (under the influence of the demolition noise), i.e., from the third to the fourth sampling, all of the lactate values noticeably decreased and increased again to approximately their initial level at the fifth sampling.
Skin lesions due to agonistic interactions occurred during the entire experiment (Figure 3, Figure 4 and Figure A5). At the first and third sampling, several skin lesions per individual were found under all stocking densities, whereas at the second and fourth sampling, the number of lesions decreased in general. At the first sampling, the semi-intensively stocked juveniles had the highest number of lesions, while at the fifth sampling, the adult fish had more lesions at intensive and super-intensive stocking densities compared to the semi-intensive stocking density. In particular, during the third sampling, meaning the beginning of the second phase (with noise impact), the highest number and largest skin lesions were determined in total. Significant differences (p > 0.05) were not found.
Gene profiling focused on the third and fifth samplings, which were noticeable due to the high number of injured individuals. We hypothesized that skin lesions might entail not only stress, but also immune responses. Therefore, we quantified the transcript number of 22 selected genes in the spleen tissue of either unstressed or stressed African catfish kept under semi-intensive or super-intensive conditions (Figure 5). The spleen was chosen as the target tissue because it responds to both immune and stress-related stimuli. For instance, it has been well proven that the spleen stores red blood cells under stress conditions and/or during metabolic alterations.
The obtained qPCR data revealed a moderate impact on the level of the selected transcripts. At the third sampling, only kmt2a was slightly (1.2- to 1.3-fold, p < 0.002) downregulated in both unstressed and stressed African catfish kept under super-intensive versus semi-intensive conditions, and also in stressed versus unstressed individuals kept under both semi- and super-intensive conditions.
At the fifth sampling, kmt2a was again differentially expressed between both unstressed and stressed African catfish kept under super-intensive versus semi-intensive conditions, and also in stressed versus unstressed individuals kept under semi-intensive conditions; however, in each case, the deviation was only between 1.1 and 1.5 (with p < 0.03). Similarly low (1.4- to 1.6-fold) but statistically significant (p < 0.02) were the deviations of the atp6v1g1 levels between stressed versus unstressed African catfish kept under semi-intensive conditions and stressed individuals kept under super-intensive versus semi-intensive conditions.
In contrast, slc39a8 was this study’s most strongly regulated differentially expressed gene. In stressed African catfish kept under semi-intensive conditions, slc39a8 was 9.7-fold down-regulated (with p = 0.008) compared to the unstressed cohort; in stressed individuals kept under super-intensive conditions, slc39a8 was 3.9-fold up-regulated (with p < 0.0001) compared to the stressed catfish kept under semi-intensive conditions.
The levels of mtf1 were moderately down-regulated by 2.2 (with p = 0.008) in stressed African catfish kept under semi-intensive conditions compared to unstressed fish. The transcript concentrations of the remaining 18 genes examined showed no significant alterations. Nevertheless, the 24-fold decrease in casp3 transcripts (with p > 0.05) in stressed catfish kept under semi-intensive conditions compared to unstressed individuals may be worth mentioning.

4. Discussion

In the present study, the stocking density influenced the growth performance of African catfish under commercial rearing conditions. In addition, the effects of stocking density in relation to fish size, as well as external stress due to construction noise on different fish welfare indicators, were demonstrated.
In commercial RASs, African catfish can reach slaughter weight in about 6 months; in ponds, this may take longer [35]. The production time depends in particular on the water temperature and feed quality and quantity. In the present study, African catfish at all stocking densities reached appropriate slaughter weights after 23 weeks; 1 week earlier than expected. The water quality in the RAS was also found to provide suitable conditions for African catfish aquaculture without much potential to impair fish welfare. However, due to the very high stocking densities, this required an increased effort. Consequently, the cultivation conditions, as well as the growth performance, can be described as very good in each of the sampled groups.
Van de Nieuwegiessen et al. [28] indicated no growth difference between African catfish from different stocking densities (96.9–485.6 kg m−3) after the final growth phase from approx. 1000–1500 g fish−1. In addition, partially contradictory findings have been reported. For instance, Toko et al. [36] described the influence of rather extensive stocking densities (4–8 fish m−3) on juvenile African catfish (approx. 35–150 g) in ponds, whereby growth performance significantly increased with increasing densities. However, other studies have reported lower growth with increasing densities in juveniles of approx. 30–100 g in tanks at 35–125 kg m−3 [37,38,39], or in pond cages at max. 63 kg m−3 [40]. According to Hecht and Appelbaum [41], particularly in early developmental stages (larvae) of African catfish, stocking density can have an impact on growth. Li et al. [42] pointed out the heterogeneity of studies regarding the effect of stocking densities on growth.
In the present study, the super-intensively stocked fish showed the weakest growth performance, significantly different to the growth performance of semi-intensively stocked fish, which was approx. 13% better. This was also visible when comparing the FCR or CI (Table 3, Figure A3). Consequently, this study comes to similar conclusions regarding the influence of stocking density on growth as several previous studies; it is the case, even in commercial-scale RAS culture, that African catfish tend to grow slightly less under high stocking densities than under extensive conditions. This clearly contradicts the study by van de Nieuwegiessen et al. [28].
Mortality or survival of African catfish, with respect to stocking density, has again been differently described. Van de Nieuwegiessen et al. [22] reported a mortality rate of 2.5% under aquarium conditions, regardless of stocking density. Akinwole and Faturoti [43] described a survival rate of 75–93% (conversely, 7–25% mortality) for different developmental stages in commercial RASs. Palm et al. [31] found survival rates of 96% for extensively (50 kg m−3) to 81% for intensively (200 kg m−3) stocked fish. In the present study, mortality was not directly correlated with the increase in stocking density. The highest mortality was found in a super-intensive density tank, while it was overall lower in intensive and semi-intensive densities. However, African catfish survival rates can vary between different tanks, possibly due to differences in group composition, a factor that is difficult to control. Based on our experience, we see a higher risk of a greater percentage of African catfish dying under higher stocking densities. Unfortunately, in the present study it was not possible to investigate at what time how many fish died at each stocking density because the carcasses were quickly eaten by conspecifics.
Boerrigter et al. [44] described the physiological stress-related indicators, plasma cortisol, glucose, and lactate, prior to and post stress in juveniles of African catfish (8–10 g). The basal levels (unstressed) for cortisol were at 6.5–15.3 ng mL−1, for glucose at 3.7–5.4 mmol L−1, and for lactate at 1.3–2.2 mmol L−1, respectively. Directly, as well as 30 and 60 min after stressing, the fish plasma cortisol was at 12–48,5 ng mL−1, glucose at 4.2–6.8 mmol L−1, and lactate at 1.1–2.3 mmol L−1, respectively. Martins et al. [45] described, in particular after stress induction, higher levels of more than 100 ng mL−1 for plasma cortisol and up to 8 mmol L−1 for glucose. Manuel et al. [46] depicted basal levels of cortisol for adults of African catfish (1–1.5 kg) at < 10 ng mL−1; after handling, stress cortisol increased to 35 ng mL−1, and after 3-h transportation to 50 ng mL−1. These authors reported plasma glucose between approx. 3.5–6.5 mmol L−1, with only minor elevations after stress induction. Van de Nieuwegiessen et al. [28] reported basal lactate levels in adult African catfish (1–1.5 kg) with approx. 3 mmol L−1, and elevated levels of 3.6–4.9 mmol L−1 after stress.
In the present study, the mean plasma cortisol and glucose levels of fish from each stocking density were in comparable ranges. Significant or at least trended differences with about two-fold elevated cortisol levels were frequently found between stressed and unstressed fish within one sampling. Both the basal levels and the elevations of cortisol due to induced stress were considered regular, according to the observations of Boerrigter et al. [44]; thus, the different stocking densities had at least no effect on this stress indicator. This is in contrast to the findings of van de Nieuwegiessen et al. [22], according to which an impaired cortisol response was observed under the lowest and highest stocking densities, and a down-regulation of ACTH or a depletion of the cortisol receptors due to chronic stress was suspected.
The overall glucose level can be considered relatively high in the measured ranges, but we assume that this could also be related to feeding, as earlier described by Polakof et al. [47]. In fact, feeding in our experiment was aimed at promoting excellent growth, which was achieved. In addition, we detected significant increases due to induced (acute) stress compared to basal levels, and no differences between semi-intensively and super-intensively stocked fish, suggesting feeding was the reason for an overall high glucose level. The mean lactate values were still within the normal range, albeit some fish had slightly elevated values compared to the abovementioned references. The induced stress was inappropriate to affect lactate levels because no physical activity or hypoxic stress was imposed by it. Lactate, as a gluconeogenic precursor, is directly related to blood glucose (also elevated) and generally increases with increased physical activity and/or oxygen deficiency. Both may have occurred under the high stocking densities tested.
The number of skin lesions on African catfish has been recorded in several studies [22,28,32,48,49,50]. The number largely varied between 0–5 per fish, depending on developmental stage and group composition. Studies addressing the area of skin lesions in African catfish are not known to the authors to date. In the present study, both the stocking densities and the respective developmental stage/fish size were relevant for the number and area of skin lesions. While early juveniles under semi-intensive stocking density had twice as many skin lesions on average as under intensive or super-intensive stocking density, it was reversed towards the end of the production period. Here, the matured fish under semi-intensive stocking densities showed very few skin lesions, while the number and area of bite wounds remained similar under intensive and super-intensive stocking densities. In any case, the occurrence of skin lesions may impair welfare. If possible, this should be considered for the different growth stages, also with regard to their current stocking density [51]. This behavioral change was already evident from other studies. According to Kaiser et al. [52] and van de Nieuwegiessen et al. [22], juvenile African catfish frequently show agonistic interactions, particularly under low stocking densities. This decreases under higher densities where the fish form “dense clusters […] with constant movement and low aggression” [22] (p. 241). Information on adult African catfish is scarce, particularly at intensive or super-intensive stocking densities of commercial facilities. However, there is evidence that overall aggression decreases, resulting in fewer skin lesions [22,28].
Van de Niewegiessen et al. [22] described that skin problems and consequently infections might increase at stocking densities above 300 kg m−3. Similar findings could not be generally confirmed in our study. However, a few fish in fact had to be removed from the super-intensive stocking density due to very severe and partially infected skin lesions.
The recording of somatic indices and the quantification of metabolic parameters of African catfish was complemented by gene-expression analysis to simultaneously quantify 22 genes associated with metabolism, immunity, and stress physiology. The transcript concentrations of most of these genes slightly changed or did not change significantly across the groups investigated, except for two genes. Both slc39a8 and mtf1 were significantly at least two-fold down-regulated in stressed African catfish kept under semi-intensive conditions compared to the unstressed fish. Mtf1 encodes a transcription factor that is involved in cellular adaptation to a range of stress conditions [53]. Slc39a8 codes for a transporter-like protein that maintains zinc homeostasis [54] and regulates cell migration [55]. It would be highly speculative to suggest possible functions of both gene products in African catfish, but the reduced levels of both mtf1 and slc39a8 might indicate an impending maladaptation of African catfish to adverse conditions. Previous single-gene expression analyses indicated few transcriptional parameters that could serve as potential indicator genes of stress responses in Clarias sp. [56,57]. The present study adds mtf1 and slc39a8 to the list of potential indicator genes that might be included in future studies on the welfare of African catfish.
Coppola et al. [58] described the noise as a physical stressor on animals leading to physiological, behavioral, and anatomical responses. It is well-known that anthropogenic noise affects many species [59]. Anthropogenic noise, which may include the background and partly loud noises of a mechanized aquaculture system, as well as other anthropogenic noise impacts (including construction and demolition noise), can negatively affect fish behavior, health, and welfare [60,61,62]. This presupposes that acoustic waves are transmitted from air into water. In the second phase of the experiment, particularly during the time of the third sampling, all treatment groups showed an increase in plasma cortisol and glucose levels, with noticeably larger interquartile ranges and upper Whiskers, slightly flattened lactate levels, and a larger number of skin lesions (including an increase in injured surface area), indicating that the fish were generally affected or stressed. Apparently, endogenous stress responses occurred more frequently in this second phase under noise exposure. The tentatively decreased lactate levels may indicate altered behavior, such as a reduction in swimming activity. At the same time, the African catfish reacted more aggressively, as evidenced by the increased incidence of skin lesions. Most likely, the demolition noise raised the stress levels in the African catfish and led to behavioral alterations. Therefore, it is recommended that external stressors in aquaculture, including loud noises, need to be avoided, especially if they persist for an extended period, preventing a chronic stress situation for the fish. It could have negative consequences for their wellbeing, health, and growth.

5. Conclusions

The growth of African catfish was very high at all stocking densities. However, at the end of the experiment, the semi-intensively stocked fish had significantly higher weights (by about 13%) than the super-intensively stocked fish. This study further demonstrates that particularly for early juvenile life stages of African catfish, intensive or super-intensive stocking density, whereas for matured fish, semi-intensive stocking density results in less aggression and fewer skin lesions. In addition, the fish welfare investigation revealed evidence of the influence of the demolition noise that occurred. We therefore suggest an adaptation of stocking density during the growth phases of African catfish after size-grading and the avoidance of external stressors in aquaculture to enhance production efficiency and fish welfare.

Author Contributions

Conceptualization, B.B. and L.C.W.; methodology, B.B.; validation, B.B.; formal analysis, B.B., A.R. and M.-C.H.; investigation, B.B., L.H., A.R., L.C.W., M.-C.H. and M.V.; resources, B.B. and L.C.W.; data curation, B.B., L.H., A.R. and M.V.; writing—original draft preparation, B.B.; writing—review and editing, B.B., A.R., L.C.W., M.-C.H., M.V. and H.W.P.; visualization, B.B. and A.R.; supervision, H.W.P.; project administration, B.B.; funding acquisition, H.W.P. All authors have read and agreed to the published version of the manuscript.

Funding

This research was funded by the project “Performance and process water management in commercial (integrated) aquaculture systems with African catfish (Clarias gariepinus) in Mecklenburg-Western Pomerania” (MV-II.1-LM-007: 139030000103, EMFF: 7302).

Institutional Review Board Statement

The animal study protocol was approved by the relevant Ethics Committee of the “Landesamt für Landwirtschaft, Lebensmittelsicherheit und Fischerei Mecklenburg-Vorpommern” (LALLF MV, approval number: 7221.3-1-042/20, date of approval: August 20, 2020).

Data Availability Statement

The data presented in this study are available on a reasonable request from the corresponding author. The data are not publicly available.

Acknowledgments

We thank Ulrich Knaus for project coordination and supporting with materials and feeds. We thank Philipp Sandmann, Ronja Siebert, Julian Bertram, and Tim Fuhrmann for their support with system maintenance and assistance during samplings (University of Rostock). We thank Ingrid Hennings, Brigitte Schöpel, and Franziska Witt for their excellent technical assistance (FBN, Dummerstorf).

Conflicts of Interest

The authors declare no conflict of interest. The funders had no role in the design of the study; in the collection, analyses, or interpretation of data; in the writing of the manuscript; or in the decision to publish the results.

Appendix A

Table A1. Oligonucleotide-primer sequences derived from Clarias gariepinus, Ictalurus punctatus, or Pangasianodon hypophthalmus.
Gene SymbolGene ProductFunctionSense Primer (5‘→3‘),
Antisense Primer (5‘→3‘)
Source (Species; Accession Code)Amplicon Length (bp)
Reference genes:
rna18s18S ribosomal RNAStructure of eukaryotic ribosomesCTCTGCTGGACGATGGCTTAC,
TCGATGAAGAACGCAGCCAGC
C. gariepinus; GQ46523994
actbActin-betaCell structure and motility, intercellular signallingACCACCACAGCCGAGAGAGAA,
CTTCCAGCCATCTTTCCTTGGT
C. gariepinus;
EU527191
204
gapdhGlyceraldehyde-3-phosphate dehydrogenaseCarbohydrate metabolismTATGAAGCCCGCTGAGATCCC,
GCCTCTTCTCACTTGCAGGGT
C. gariepinus;
AF323693
106
rplRibosomal protein, large subunitStructure of eukaryotic ribosomesACTAAATAGCAACTGATCCCTATC,
GAATATCTGACCACTAAGATCCG
C. gariepinus; MW080924134
Target genes:
atp6v1g1ATPase H+ transporting v1 subunit g1Intercellular Fe homeostasisCGGAAAAACCGCCGCTTGAAG,
GACCAAGGAAGCCGCGGCAC
P. hypophthalmus; XM_026922532
106
c3aComplement component 3, variant aBacteria opsonisation and destructionATGTCTTTCGATGTCACGGTTTAT,
TCGAACCAAGAGTAACGGCATG
I. punctatus; XM_017457024114
casp3Caspase 3ApoptosisCTCTTTATCATTCAGGCTTGTCG,
GTACTCTACTGCTCCAGGTTATT
I. punctatus; XM_017473312139
ccnb1Cyclin b1Control of the G2/M transition phase of the cell cycleTCAAAAATCGGAGAGGTTACAGC,
TGCACTTTGCTCCCTCTCTGG
I. punctatus; NC_030443103
csCitrate synthaseAerobic metabolismGGTGGTGAAGTGTCCGATGAAA,
GCTATGGGCATGCTGTCCTGA
I. punctatus; XM_01748751094
hmox1aHeme oxygenase 1Cellular response to xenobiotic stimulusGATTCTTCTGTGTTCCCTGTATG,
CCATCTACTTCCCTCAGGAGC
I. punctatus; XM_017491622104
hsp90ab1Heat-shock protein 90 alpha family class b member 1Chaperone function, stress responseGAACATCAAGCTGGGCATCCAT,
TTACTACATCACTGGTGAGAGCA
I. punctatus; XM_017456214167
hspb1Heat-shock protein family b (small) member 1Differentiation of cell types, stress responseACAGGACAACTGGAAGGTGAAC,
GATTATCGGAAACCATGAGGAGA
Clarias batrachus; KT359728107
hspd1Heat shock protein family d (hsp60) member 1Chaperone function, stress responseGCACGCTTGTCCTCAACAGGTT,
AGACATGGCGATTGCTACTGGA
I. punctatus; XM_017469365113
il2Interleukin-2Activation and proliferation of lymphocytesGTCGGCCTGGGAAAAAGCCAAT,
TTATGTGTTTGCACCAGACAACG
I. punctatus; XM_017474923162
kmt2aLysine-specific methyltransferase 2aRegulation of early development and hematopoiesisATTGGGTCGAAATCGTGCTGTAT,
ATGATAAGTCTTCAGTGGCAGGT
I. punctatus; XM_017490460121
mtf1Metal regulatory transcription factor 1Catabolic regulation of cartilagesGTAGGAGGGCATTCAGGGAAC,
AGTCAGAACGCTGCCCCCTC
I. punctatus; XM_017475296146
nkx2-3NK2 homeobox 3Cell differentiationTACAGGACAACCTGGTGGAAAG,
ACAACTCTTGGTTTCCTGCTCTT
I. punctatus; XM_017464595119
pgm3Phosphoglucomutase 3Carbohydrate metabolismGACACAGGCAGGGCTGAATCT,
CTTCGTACAGCACACTGTAACC
I. punctatus; XM_017494096112
slc30a5Solute carrier family 30, member 5Zinc transportationAATAGTCACCAAAAGACAGTGGAT,
CATCGTTGTGCTCGAACAACAG
I. punctatus; XM_017459891134
slc39a8Solute carrier family 39, member 8 alias ZIP8Cellular zinc uptake, protection from inflammation-related injury and deathTTTAACCTGATCTCAGCCATGTC,
TATGTTCCCTGAGATGAATGCCA
I. punctatus; XM_017489708151
slc46a1Solute carrier family 46, member 1Folate transportationAATGGCGACATGCACAAGGGTAT,
AGAACAGCCTTGCCCCAGGG
I. punctatus; XM_017491375129
sp1SP1 transcription factorCell growth, apoptosis, differentiation and immune responsesAGCACAGCAGGTGATCAGGGA,
GAGAAGCGTGCACATGTCCATA
I. punctatus; XM_017450095119
stk39Serine/threonine kinase 39Stress responseTGTAGTTGTTGCTGCTAACCTTC,
AGATCCCTGACGAGGTGAAGC
I. punctatus; XM_017469076116
tlr5Toll-like receptor 5Detection of bacteriaGGCAGCATGGGAAAGGGAGTT,
GTTAAGGCTCTGGATCTGTCCA
I. punctatus; NM_001200229103
ucp2Uncoupling protein 2Regulation of production of reactive oxygen species, function of mitochondriaGGCTCCAGATCCAAGGGGAGA,
CCACGTAGTCTCTACAACGGG
I. punctatus; XM_017489367131
zeb1Zinc finger e-box binding homeobox 1Repression of interleukin-2 functionGCAGAGACCAGCGGCATGTAA,
ATACGAGTGCCCCAACTGTAAAA
I. punctatus; XM_017483097156
Figure A1. Weight gain of African catfish from three different stocking densities (Sem = semi-intensive, Int = intensive, Sup = super-intensive) over 23 weeks, n = 18, p > 0.05 in respective samplings. Circlet = outlier.
Fishes 08 00074 g0a1
Figure A2. Total body length of African catfish from three different stocking densities (Sem = semi-intensive, Int = intensive, Sup = super-intensive) over 23 weeks, n = 18, p > 0.05 in respective samplings. Circlets = outliers, asterisk = extreme value.
Fishes 08 00074 g0a2
Figure A3. Condition indices of African catfish from three different stocking densities (Sem = semi-intensive, Int = intensive, Sup = super-intensive) over 23 weeks, n = 18, p > 0.05 in respective samplings. Circlet = outlier.
Fishes 08 00074 g0a3
Table A2. Cortisol: Relevant significances within a single sampling between unstressed and stressed fish in a treatment group, and between unstressed or stressed fish in a treatment group between different samplings. Sem = semi-intensive; Int = intensive; Sup = super-intensive; the number before the stocking density abbreviation indicates the respective sampling; u = unstressed, s = stressed.
Group Comparisonp-ValueGroup Comparisonp-ValueGroup Comparisonp-Value
Within a sampling Within a sampling Within a sampling
2Sem-u-2Sem-s0.0221Int-u-1Int-s0.0472Sup-u-2Sup-s0.038
4Sem-u-4Sem-s0.043Between samplings Between samplings
5Sem-u-5Sem-s0.0321Int-u-2Int-u0.0211Sup-u-2Sup-u0.040
Between samplings 1Int-s-2Int-s0.0261Sup-s-2Sup-s0.000
1Sem-u-2Sem-u0.0421Int-u-3Int-u0.0001Sup-u-3Sup-u0.000
1Sem-s-2Sem-s0.0061Int-s-3Int-s0.0001Sup-s-3Sup-s0.000
1Sem-u-3Sem-u0.0001Inti-u-5Int-u0.0001Sup-s-4Sup-s0.049
1Sem-s-3Sem-s0.0002Int-u-3Int-u0.0031Sup-u-5Sup-u0.000
1Sem-u-5Sem-u0.0012Int-u-5Int-u0.0431Sup-s-5Sup-s0.000
1Sem-s-5Sem-s0.0004Int-s-2Int-s0.0484Sup-s-2Sup-s0.031
2Sem-u-3Sem-u0.0004Int-u-3Int-u0.0004Sup-u-3Sup-u0.002
4Sem-u-3Sem-u0.0004Int-s-3Int-s0.0004Sup-s-3Sup-s0.002
4Sem-s-3Sem-s0.0044Int-u-5Int-u0.0014Sup-u-5Sup-u0.001
4Sem-u-5Sem-u0.0184Int-s-5Int-s0.0044Sup-s-5Sup-s0.008
4Sem-s-5Sem-s0.013
5Sem-u-3Sem-u0.021
Figure A4. Glucose levels of stressed (s) or unstressed (u) African catfish (n = 9) under three different stocking densities (Sem = semi-intensive, Int = intensive, Sup = super-intensive). Kruskal-Wallis test with Tukey-HSD or Dunnett-T3 post hoc test, significances (p < 0.05) are only given within the respective samplings, marked by letters. Circlets = outliers; asterisks = extreme values.
Fishes 08 00074 g0a4
Figure A5. Total skin lesion area of African catfish in three different stocking densities (Sem = semi-intensive, Int = intensive, Sup = super-intensive), n = 18, p > 0.05. In sampling 3, in Sem, a value of 3, and in Sup a value of 4 is not illustrated. Circlets = outliers; asterisks = extreme values.
Fishes 08 00074 g0a5

References

  1. Montero, D.; Izquierdo, M.S.; Tort, L.; Robaina, L.; Vergara, J.M. High stocking density produces crowding stress altering some physiological and biochemical parameters in gilthead seabream, Sparus aurata, juveniles. Fish Physiol. Biochem. 1999, 20, 53–60. [Google Scholar] [CrossRef]
  2. Ellis, T.; North, B.; Scott, A.P.; Bromage, N.R.; Porter, M.; Gadd, D. The relationships between density and welfare in farmed rainbow trout. J. Fish Biol. 2002, 61, 493–531. [Google Scholar] [CrossRef]
  3. Carbonara, P.; Alfonso, S.; Gai, F.; Gasco, L.; Palmegiano, G.; Spedicato, M.T.; Zupa, W.; Lembo, G. Moderate stocking density does not influence the behavioural and physiological responses of rainbow trout (Oncorhynchus mykiss) in organic aquaculture. Aquac. Res. 2020, 51, 3007–3016. [Google Scholar] [CrossRef] [Green Version]
  4. Conte, F.S. Stress and the welfare of cultured fish. Appl. Anim. Behav. Sci. 2004, 86, 205–223. [Google Scholar] [CrossRef]
  5. Ashley, P.J. Fish welfare: Current issues in aquaculture. Appl. Anim. Behav. Sci. 2007, 104, 199–235. [Google Scholar] [CrossRef]
  6. Baldwin, L. The effects of stocking density on fish welfare. Plym. Stud. Sci. 2011, 4, 372–383. [Google Scholar]
  7. Oké, V.; Goosen, N.J. The effect of stocking density on profitability of African catfish (Clarias gariepinus) culture in extensive pond systems. Aquaculture 2019, 507, 385–392. [Google Scholar] [CrossRef]
  8. Ferreira, H.; Ramalho Ribeiro, A.; Dias, J.; Yúfera, M.; Arias, A.M.; Falcão, M.; Serpa, D.; Aires, T.; Pousão-Ferreira, P.; Cunha, M.E.; et al. Sustainable semi-intensive polyculture of seabream and sole in earthen ponds. Aquac. Eur. 2010, 35, 17–21. [Google Scholar]
  9. Lymbery, P. In too deep The welfare of intensively farmed fish. A report for Compassion in World Farming Trust. 2002. Available online: https://citeseerx.ist.psu.edu/document?repid=rep1&type=pdf&doi=0adba50d39fb67867286eed5f52c7c2ccb586d62 (accessed on 23 January 2023).
  10. Naylor, R.L.; Hardy, R.W.; Buschmann, A.H.; Bush, S.R.; Cao, L.; Klinger, D.H.; Little, D.C.; Lubchenco, J.; Shumway, S.E.; Troell, M. A 20-year retrospective review of global aquaculture. Nature 2021, 591, 551–563. [Google Scholar] [CrossRef]
  11. Ortuno, J.; Esteban, M.A.; Meseguer, J. Effects of short-term crowding stress on the gilthead seabream (Sparus aurata L.) innate immune response. Fish Shelf. Immunol. 2001, 11, 187–197. [Google Scholar] [CrossRef]
  12. North, B.P.; Turnbull, J.F.; Ellis, T.; Porter, M.J.; Migaud, H.; Bron, J.; Bromage, N.R. The impact of stocking density on the welfare of rainbow trout (Oncorhynchus mykiss). Aquaculture 2006, 255, 466–479. [Google Scholar] [CrossRef]
  13. Yarahmadi, P.; Miandare, H.K.; Fayaz, S.; Caipang, C.M.A. Increased stocking density causes changes in expression of selected stress-and immune-related genes, humoral innate immune parameters and stress responses of rainbow trout (Oncorhynchus mykiss). Fish Shelf. Immunol. 2016, 48, 43–53. [Google Scholar] [CrossRef] [PubMed]
  14. Farhaduzzaman, A.M.; Hanif, A.; Khan, S.; Osman, M.H.; Shovon, N.H.; Rahman, M.K. Perfect Stocking Density Ensures Best Production and Economic Returns in Floating Cage Aquaculture System. J. Aquac. Res. Dev. 2020, 11, 1–7. [Google Scholar] [CrossRef]
  15. Debnath, D.; Das, B.K.; Yengkokpam, S.; Das, P.; Yadav, A.K.; Sharma, N.; Borah, S.; Ray, B.C.; Kakati, A.; Sarkar, U.K.; et al. Evaluating growth, production and economics of a new candidate species Labeo bata in cages: A regional model for table fish production in floodplain wetlands of North East India. Aquaculture 2022, 546, 737344. [Google Scholar] [CrossRef]
  16. Destatis, Statistisches Bundesamt. Land und Forstwirtschaft, Fischerei. Erzeugung in Aquakulturbetrieben 2012. Available online: https://www.statistischebibliothek.de/mir/servlets/MCRFileNodeServlet/DEHeft_derivate_00009985/2030460127004.pdf (accessed on 16 November 2022).
  17. Destatis, Statistisches Bundesamt. Land und Forstwirtschaft, Fischerei. Erzeugung in Aquakulturbetrieben 2020. Available online: https://www.statistischebibliothek.de/mir/servlets/MCRFileNodeServlet/DEHeft_derivate_00061752/2030460207004.pdf (accessed on 16 November 2022).
  18. Dauda, A.B.; Natrah, I.; Karim, M.; Kamarudin, M.S.; Bichi, A. African catfish aquaculture in Malaysia and Nigeria: Status, trends and prospects. Fish. Aquac. J. 2018, 9, 1–5. [Google Scholar] [CrossRef]
  19. Roques, J.A.; Schram, E.; Spanings, T.; van Schaik, T.; Abbink, W.; Boerrigter, J.; de Vries, P.; van de Vis, H.; Flik, G. The impact of elevated water nitrite concentration on physiology, growth and feed intake of African catfish Clarias gariepinus (Burchell 1822). Aquac. Res. 2015, 46, 1384–1395. [Google Scholar] [CrossRef]
  20. Păpuc, T.; Petrescu-Mag, I.V.; Gavriloaie, C.; Botha, M.; Kovacs, E.; Coroian, C.O. Swimming in the mud-a short review of environmental parameter ranges tolerated by Clarias gariepinus. Extreme Life Biospeol. Astrobiol. 2019, 11, 9–17. [Google Scholar]
  21. Belão, T.C.; Leite, C.A.C.; Florindo, L.H.; Kalinin, A.L.; Rantin, F.T. Cardiorespiratory responses to hypoxia in the African catfish, Clarias gariepinus (Burchell 1822), an air-breathing fish. J. Comp. Physiol. B 2011, 181, 905–916. [Google Scholar] [CrossRef] [PubMed]
  22. Van de Nieuwegiessen, P.G.; Boerlage, A.S.; Verreth, J.A.; Schrama, J.W. Assessing the effects of a chronic stressor, stocking density, on welfare indicators of juvenile African catfish, Clarias gariepinus Burchell. Appl. Anim. Behav. Sci. 2008, 115, 233–243. [Google Scholar] [CrossRef]
  23. Schram, E.; van der Heul, J.W.; Kamstra, A.; Verdegem, M.C.J. Stocking density-dependent growth of Dover sole (Solea solea). Aquaculture 2006, 252, 339–347. [Google Scholar] [CrossRef]
  24. Liu, B.; Liu, Y.; Sun, G. Effects of stocking density on growth performance and welfare-related physiological parameters of Atlantic salmon Salmo salar L. in recirculating aquaculture system. Aquac. Res. 2017, 48, 2133–2144. [Google Scholar] [CrossRef]
  25. Refaey, M.M.; Li, D.; Tian, X.; Zhang, Z.; Zhang, X.; Li, L.; Tang, R. High stocking density alters growth performance, blood biochemistry, intestinal histology, and muscle quality of channel catfish Ictalurus punctatus. Aquaculture 2018, 492, 73–81. [Google Scholar] [CrossRef]
  26. Long, L.; Zhang, H.; Ni, Q.; Liu, H.; Wu, F.; Wang, X. Effects of stocking density on growth, stress, and immune responses of juvenile Chinese sturgeon (Acipenser sinensis) in a recirculating aquaculture system. Comp. Biochem. Physiol. Part C Toxicol. Pharmacol. 2019, 219, 25–34. [Google Scholar] [CrossRef] [PubMed]
  27. Oyarzún, R.; Paredes, R.; Saravia, J.; Morera, F.J.; Muñoz, J.L.P.; Ruiz-Jarabo, I.; Mancera, J.M.; Vargas-Chacoff, L. Stocking density affects the growth performance, intermediary metabolism, osmoregulation, and response to stress in Patagonian blennie Eleginops maclovinus. Aquaculture 2020, 515, 734565. [Google Scholar] [CrossRef]
  28. Van de Nieuwegiessen, P.G.; Olwo, J.; Khong, S.; Verreth, J.A.; Schrama, J.W. Effects of age and stocking density on the welfare of African catfish, Clarias gariepinus Burchell. Aquaculture 2009, 288, 69–75. [Google Scholar] [CrossRef]
  29. Wendelaar Bonga, S.E. The stress response in fish. Physiol. Rev. 1997, 77, 591–625. [Google Scholar] [CrossRef]
  30. Wenzel, L.C.; Berchtold, E.; Palm, H.W. Effects of stocking density and grading on behaviour, cannibalism and performance of African catfish (Clarias gariepinus) fry. Aquac. Rep. 2022, 27, 101400. [Google Scholar] [CrossRef]
  31. Palm, H.W.; Knaus, U.; Wasenitz, B.; Bischoff, A.A.; Strauch, S.M. Proportional up scaling of African catfish (Clarias gariepinus Burchell, 1822) commercial recirculating aquaculture systems disproportionally affects nutrient dynamics. Aquaculture 2018, 491, 155–168. [Google Scholar] [CrossRef]
  32. Martins, C.I.; Schrama, J.W.; Verreth, J.A. The effect of group composition on the welfare of African catfish (Clarias gariepinus). Appl. Anim. Behav. Sc. 2006, 97, 323–334. [Google Scholar] [CrossRef]
  33. Haufe, Handwerker auf Baustellen sind unterschiedlicher Lärmbelastung Ausgesetzt. Available online: https://www.haufe.de/arbeitsschutz/sicherheit/laermbelastung-auf-baustellen_96_156758.html (accessed on 15 February 2022).
  34. Hildebrand, M.-C.; Rebl, A.; Nguinkal, J.A.; Palm, H.W.; Baßmann, B. Effects of Fe-DTPA on Health and Welfare of the African Catfish Clarias gariepinus (Burchell, 1822). Water 2023, 15, 299. [Google Scholar] [CrossRef]
  35. Hecht, T. A review of on-farm feed management practices for North African catfish (Clarias gariepinus) in sub-Saharan Africa. In On-Farm Feeding and Feed Management in Aquaculture; FAO Fisheries and Aquaculture Technical Paper No., 583; Hasan, M.R., New, M.B., Eds.; FAO: Rome, Italy, 2013; pp. 463–479. [Google Scholar]
  36. Toko, I.; Fiogbe, E.D.; Koukpode, B.; Kestemont, P. Rearing of African catfish (Clarias gariepinus) and vundu catfish (Heterobranchus longifilis) in traditional fish ponds (whedos): Effect of stocking density on growth, production and body composition. Aquaculture 2007, 262, 65–72. [Google Scholar] [CrossRef]
  37. Dai, W.; Wang, X.; Guo, Y.; Wang, Q.; Ma, J. Growth performance, hematological and biochemical responses of African catfish (Clarias gariepinus) reared at different stocking densities. Afr. J. Agric. Res. 2011, 6, 6177–6182. [Google Scholar] [CrossRef]
  38. Wang, X.; Dai, W.; Xu, M.; Pan, B.; Li, X.; Chen, Y. Effects of stocking density on growth, nonspecific immune response, and antioxidant status in African catfish (Clarias gariepinus). Isr. J. Aquac. Bamidgeh 2013, 65, 1–6. [Google Scholar]
  39. Wang, X.M.; Gao, J.W.; Xu, M.; Mo, B.L.; Dai, W.; Chen, C.H. Responses of growth rates and growth hormone levels of African catfish (Clarias gariepinus) to stocking density. Iran. J. Fish. Sci. 2017, 16, 698–710. [Google Scholar]
  40. Hengsawat, K.; Ward, F.J.; Jaruratjamorn, P. The effect of stocking density on yield, growth and mortality of African catfish (Clarias gariepinus Burchell 1822) cultured in cages. Aquaculture 1997, 152, 67–76. [Google Scholar] [CrossRef]
  41. Hecht, T.; Appelbaum, S. Notes on the growth of Israeli sharptooth catfish (Clarias gariepinus) during the primary nursing phase. Aquaculture 1987, 63, 195–204. [Google Scholar] [CrossRef]
  42. Li, L.; Shen, Y.; Yang, W.; Xu, X.; Li, J. Effect of different stocking densities on fish growth performance: A meta-analysis. Aquaculture 2021, 544, 737152. [Google Scholar] [CrossRef]
  43. Akinwole, A.O.; Faturoti, E.O. Biological performance of African Catfish (Clarias gariepinus) cultured in recirculating system in Ibadan. Aquac. Eng. 2007, 36, 18–23. [Google Scholar] [CrossRef]
  44. Boerrigter, J.G.; van den Bos, R.; van de Vis, H.; Spanings, T.; Flik, G. Effects of density, PVC-tubes and feeding time on growth, stress and aggression in African catfish (Clarias gariepinus). Aquac. Res. 2016, 47, 2553–2568. [Google Scholar] [CrossRef]
  45. Martins, C.I.; Schrama, J.W.; Verreth, J.A. The relationship between individual differences in feed efficiency and stress response in African catfish Clarias gariepinus. Aquaculture 2006, 256, 588–595. [Google Scholar] [CrossRef]
  46. Manuel, R.; Boerrigter, J.; Roques, J.; van der Heul, J.; van den Bos, R.; Flik, G.; van de Vis, H. Stress in African catfish (Clarias gariepinus) following overland transportation. Fish Physiol. Biochem. 2014, 40, 33–44. [Google Scholar] [CrossRef]
  47. Polakof, S.; Panserat, S.; Soengas, J.L.; Moon, T.W. Glucose metabolism in fish: A review. J. Comp. Physiol. B 2012, 182, 1015–1045. [Google Scholar] [CrossRef] [PubMed]
  48. Baßmann, B.; Brenner, M.; Palm, H.W. Stress and welfare of African catfish (Clarias gariepinus Burchell, 1822) in a coupled aquaponic system. Water 2017, 9, 504. [Google Scholar] [CrossRef] [Green Version]
  49. Baßmann, B.; Harbach, H.; Weißbach, S.; Palm, H.W. Effect of plant density in coupled aquaponics on the welfare status of African catfish, Clarias gariepinus. J. World Aquac. Soc. 2020, 51, 183–199. [Google Scholar] [CrossRef]
  50. Palm, H.W.; Berchtold, E.; Gille, B.; Knaus, U.; Wenzel, L.C.; Baßmann, B. Growth and Welfare of African Catfish (Clarias gariepinus Burchell, 1822) under Dietary Supplementation with Mixed-Layer Clay Mineral Montmorillonite-Illite/Muscovite in Commercial Aquaculture. Aquac. J. 2022, 2, 227–245. [Google Scholar] [CrossRef]
  51. Huntingford, F.A.; Adams, C.; Braithwaite, V.A.; Kadri, S.; Pottinger, T.G.; Sandøe, P.; Turnbull, J.F. Current issues in fish welfare. J. Fish Biol. 2006, 68, 332–372. [Google Scholar] [CrossRef] [Green Version]
  52. Kaiser, H.; Weyl, O.; Hecht, T. Observations on agonistic behaviour of Clarias gariepinus larvae and juveniles under different densities and feeding frequencies in a controlled environment. J. Appl. Ichthyol. 1995, 11, 25–36. [Google Scholar] [CrossRef]
  53. Günther, V.; Lindert, U.; Schaffner, W. The taste of heavy metals: Gene regulation by MTF-1. Biochim. Biophys. Acta (BBA) Mol. Cell Res. 2012, 1823, 1416–1425. [Google Scholar] [CrossRef] [Green Version]
  54. Jeong, J.; Eide, D.J. The SLC39 family of zinc transporters. Mol. Asp. Med. 2013, 34, 612–619. [Google Scholar] [CrossRef] [Green Version]
  55. Wu, D.M.; Liu, T.; Deng, S.H.; Han, R.; Xu, Y. SLC39A4 expression is associated with enhanced cell migration, cisplatin resistance, and poor survival in non-small cell lung cancer. Sci. Rep. 2017, 7, 7211. [Google Scholar] [CrossRef] [Green Version]
  56. Swaleh, S.B.; Banday, U.Z.; Asadi, M.A.; Usmani, N. Biochemical profile and gene expression of Clarias gariepinus as a signature of heavy metal stress. Environ. Pollut. 2020, 264, 114693. [Google Scholar] [CrossRef] [PubMed]
  57. Kari, Z.A.; Kabir, M.A.; Dawood, M.A.; Razab, M.K.A.A.; Ariff, N.S.N.A.; Sarkar, T.; Pati, S.; Edinur, H.A.; Mat, K.; Ismail, T.A.; et al. Effect of fish meal substitution with fermented soy pulp on growth performance, digestive enzyme, amino acid profile, and immune-related gene expression of African catfish (Clarias gariepinus). Aquaculture 2022, 546, 737418. [Google Scholar] [CrossRef]
  58. Coppola, C.L.; Enns, R.M.; Grandin, T. Noise in the animal shelter environment: Building design and the effects of daily noise exposure. J. Appl. Anim. Welf. Sci. 2006, 9, 1–7. [Google Scholar] [CrossRef] [Green Version]
  59. Kunc, H.P.; Schmidt, R. The effects of anthropogenic noise on animals: A meta-analysis. Biol. Lett. 2019, 15, 20190649. [Google Scholar] [CrossRef] [PubMed]
  60. Bart, A.N.; Clark, J.; Young, J.; Zohar, Y. Underwater ambient noise measurements in aquaculture systems: A survey. Aquac. Eng. 2001, 25, 99–110. [Google Scholar] [CrossRef]
  61. Wysocki, L.E.; Dittami, J.P.; Ladich, F. Ship noise and cortisol secretion in European freshwater fishes. Biol. Conserv. 2006, 128, 501–508. [Google Scholar] [CrossRef]
  62. Hang, S.; Zhao, J.; Ji, B.; Li, H.; Zhang, Y.; Peng, Z.; Zhou, F.; Ding, X.; Ye, Z. Impact of underwater noise on the growth, physiology and behavior of Micropterus salmoides in industrial recirculating aquaculture systems. Environ. Pollut. 2021, 291, 118152. [Google Scholar] [CrossRef] [PubMed]
Figure 1. Plasma cortisol responses of stressed (s) or unstressed (u) African catfish (n = 9) under three different stocking densities (Sem = semi-intensive, Int = intensive, Sup = super-intensive). Kruskal-Wallis test with Tukey-HSD or Dunnett-T3 post hoc test, significances (p < 0.05) are only given within the respective samplings, marked by letters. Circlets = outliers; asterisks = extreme values.
Fishes 08 00074 g001
Figure 2. Lactate level of African catfish (n = 18) in three different stocking densities (Sem = semi-intensive, Int = intensive, Sup = super-intensive), p > 0.05. Circlets = outliers; asterisk = extreme value.
Fishes 08 00074 g002
Figure 3. Skin lesions (bite marks) on an African catfish in the typical jaw form of this species as result of agonistic interactions. The photo was contrast-enhanced by 25%.
Fishes 08 00074 g003
Figure 4. Number of external injuries (skin lesions) of African catfish (n = 18) in three different stocking densities (Sem = semi-intensive, Int = intensive, Sup = super-intensive), p > 0.05. In sampling 3, in Sem, a value of 6, and in Sup a value of 8 is not illustrated. Circlets = outliers; asterisks = extreme values.
Fishes 08 00074 g004
Figure 5. Hierarchical clustering of log10-transformed transcript numbers measured in the spleen of individual African catfish. The fish were kept under semi-intensive or super-intensive conditions, and individuals of both groups were exposed to stress, while a cohort remained unstressed (indicated below the heatmap). The sampling time points are indicated above the heatmap. The transcripts quantified are listed as gene symbols on the right margin; transcript levels are colored according to the scale on the left. Black asterisk(s) indicate a different expression in the stressed group compared to the matching unstressed group of the same stocking density and at the same sampling timepoint; red asterisk(s) indicate a different expression in the super-intensive group versus the semi-intensive group under the same conditions (either unstressed or stressed) and at the same sampling timepoint (*, p < 0.05; **, p < 0.01; *** p < 0.001).
Fishes 08 00074 g005
Table 1. Water parameters as mean ± standard deviation (SD) and minimum/maximum values between samplings (T0–T1, T1–T2, etc.). The parameters were measured every day (or weekly *).
Mean ± SDMin/Max
(T0–T1)
Min/Max
(T1–T2)
Min/Max
(T2–T3)
Min/Max
(T3–T4)
Min/Max
(T4–T5)
Temperature [°C]26.1 ± 1.624.2/26.123.8/26.719.0/27.523.6/28.025.7/28.6
O2 [mg L−1]6.0 ± 0.97.1/8.16.1/8.34.1/8.74.7/6.84.4/6.2
O2 [%]74.0 ± 10.990.4/96.574.4/103.550.8/97.160.1/82.653.1/80.2
pH6.7 ± 0.97.7/8.23.7/8.16.1/7.76.1/7.85.0/7.2
EC [µS cm−1]1382 ± 451762/883906/1610672/1520814/22301371/2480
Salinity [‰]0.7 ± 0.20.4/0.40.4/0.80.4/0.70.4/1.10.7/1.2
RedOx [mV]160.1 ± 31.7173.6/194.5158.8/276.2120.2/192.0105.7/191.260.8/174.3
NH4 * [mg L−1]13.60 ± 3.889.62/18.999.03/14.738.80/13.418.48/16.508.78/13.21
NO2 * [mg L−1]0.19 ± 0.170.03/0.030.09/0.490.06/0.360.05/0.350.07/0.37
NO3 * [mg L−1]475 ± 154591/606511/518339/346325/750344/349
Table 2. Initial and final weights and total body lengths of African catfish (mean ± standard deviation, SD, n = 100), p > 0.05, superscripts indicate significant differences between the groups.
Intended Stocking Densityn Fish Tank−1Mean Weight Fish−1
[g] ± SD
Mean Lengths Fish−1
[cm] ± SD
de facto Density Tank−1
[kg m−3]
Before stockingSemi-intensive
(0.84 kg m−3)
88
88
88
12.5 ± 1.912.1 ± 0.7a0.87
0.87
0.87
Intensive
(1.68 kg m−3)
176
176
176
12.4 ± 1.911.6 ± 0.8b1.72
1.72
1.72
Super-intensive
(3.35 kg m−3)
352
352
352
12.2 ± 1.612.0 ± 0.6a3.41
3.41
3.41
After 23 weeksSemi-intensive
(100 kg m−3)
55
73
73
1830.5 ± 596.7 a57.3 ± 6.389.15 *
106.40
106.85
Intensive
(200 kg m−3)
161
161
163
1664.8 ± 588.5 a,b55.6 ± 7.8230.62
212.34
214.96
Super-Intensive
(400 kg m−3)
284
313
309
1615.4 ± 451.7 b56.1 ± 5.1364.52 *
401.13
396.60 *
* deviation due to organ samplings.
Table 3. The feed conversion ratio (FCR) and specific growth rate (SGR) of African catfish 1 week after stocking (T0–T1), after 6 weeks (T1–T2), after 12 weeks (T2–T3), after 18 weeks (T3–T4), and after 23 weeks, at the final weighing of all fish (T4–T5). Calculations are based on sub-samplings (n = 18 per group), except totals (right column).
Stocking Density T0–T1T1–T2T2–T3T3–T4T4–T5T0–T5
(in Total)
Semi-intensive
(100 kg m−3)
FCR
SGR [% d−1]
0.7
7.0
0.7
6.0
0.8
2.2
0.7
1.7
1.1
0.9
0.77
3.0
Intensive
(200 kg m−3)
FCR
SGR [% d−1]
0.6
7.8
0.7
5.8
0.7
2.4
0.9
1.4
0.8
1.2
0.75
3.0
Super-intensive
(400 kg m−3)
FCR
SGR [% d−1]
0.7
6.8
0.7
6.0
0.8
2.3
0.8
1.6
1.2
0.7
0.83
2.9
Table 4. Mortality in the three treatment groups with semi-intensive, intensive, and super-intensive stocking densities (p > 0.05).
Stocking DensityMortality Tank−1 [%]Mean [%] ± SD
Semi-intensive (100 kg m−3)2.597.12 ± 3.92
9.56
9.20
Intensive (200 kg m−3)3.893.79 ± 0.59
4.32
3.16
Super-Intensive (400 kg m−3)14.629.24 ± 4.80
7.71
5.40
Disclaimer/Publisher’s Note: The statements, opinions and data contained in all publications are solely those of the individual author(s) and contributor(s) and not of MDPI and/or the editor(s). MDPI and/or the editor(s) disclaim responsibility for any injury to people or property resulting from any ideas, methods, instructions or products referred to in the content.

