Article

Catch Estimates and Species Composition of Recreational Fishing in Israel

1
School of Zoology, George S. Wise Faculty of Life Sciences, Tel Aviv University, Tel Aviv 39040, Israel
2
Nature and Parks Authority, Jerusalem 9103401, Israel
3
The Steinhardt Museum of Natural History, Tel Aviv University, Tel Aviv 39040, Israel
*
Author to whom correspondence should be addressed.
Fishes 2023, 8(2), 69; https://doi.org/10.3390/fishes8020069
Submission received: 21 December 2022 / Revised: 18 January 2023 / Accepted: 18 January 2023 / Published: 23 January 2023
(This article belongs to the Section Fishery Economics, Policy, and Management)

Abstract

:
Recreational fishing is common around the Mediterranean Sea. The number of recreational fishers is growing, and they are using increasingly efficient fishing techniques. However, fisher activity is heterogeneous, both temporally and spatially, making it very difficult to determine this sector’s fishing pressure and annual yields. Therefore, estimates of annual yields and ecological effects of this fishing sector are limited. In this study, we undertook an extensive survey designed to document and quantify recreational fishing patterns across the Israeli Mediterranean shoreline. We comprehensively quantified recreational fishing using three complementary strategies: (1) ground surveys, including interviews with anglers on the coast, (2) personalized phone interviews, and (3) aerial surveys by helicopter. These methods were used to calculate annual recreational yield and to estimate species and size composition, which were then compared to the commercial fishing catch. We found that a recreational catch makes up between 10%-37% of the total annual fishing yields, which is similar to estimates from other regions of the Mediterranean. We also found that non-indigenous species are among the most common species in recreational catch and have become a significant part of local fishery yields. Recreational angling from the coast targets smaller, reef associated species compared to recreational fishers at sea. We identified 23 species common to both recreational fishing and commercial fishing, over which conflicts between fishing sectors may arise. These results can be used to more accurately manage Israeli fisheries and can provide a baseline against which to compare future changes in a region under the threats of climate change, biological invasions, and growing human pressure.

1. Introduction

Marine resources are declining, primarily as a result of human consumption [1,2,3]. Commercial fishing has been considered as the main sector responsible for this decline, while recreational fishing was thought to have a negligible effect on total yields [4]. However, recreational fishing is a widespread coastal activity, and its popularity is increasing globally [5] with largely unknown consequences to the marine environment [6]. Estimating recreational fishing activities is a challenging task due to the highly diverse fishing activities which are heterogeneous, both temporally and spatially [5]. From individual anglers on the coast to deep sea fishing trips, the boundaries of these activities are broad, possibly overlapping, and may conflict with commercial fisheries [7,8]. This great variation in fishing activity makes it very difficult to determine annual yields, fishing pressure, and impacts on the marine ecosystem [9].
Recent evaluations have suggested that global marine annual recreational yields are around 900,000 tons, representing a little less than 1% of total marine catch [10]. However, recreational fishers rarely report their activities, and catch evaluations are considered to be underestimated [6]. Furthermore, catch may vary greatly between countries and regions, and thus evaluations may overlook areas where yields are higher than average. In some cases, recreational yields may even exceed commercial catch [10]. Moreover, apart from biomass reduction, recreational fishing activities may impact size distribution and change species composition [6,11]. Therefore, there is an urgent need to improve our knowledge of recreational fishing, which acquires detailed species-level data specific to fishing methods and locations [12,13].
In the Mediterranean Sea, the popularity of recreational fishing is increasing together with improved and more efficient fishing techniques [5]. Awareness of the importance of evaluating the magnitude and characteristics of this sector has increased, with several studies evaluating the ecological impacts and contributions of recreational fishing [7,12,14,15,16,17,18,19,20]. Some studies analyze the fisher profile and motivation [19], while others describe catch composition and ecological effect [20,21]. These studies emphasize that recreational fishing may substantially affect vulnerable species catch size and may impact the reproductive potential of fish.
These new insights point to the substantial part recreational fishing holds in terms of yields [7], which have been increasing together with the number of fishers [22]. In the Mediterranean, the catch size of recreational fishing is generally estimated to be between 10–50% of the total catch size [23]. However, some studies estimate much smaller contributions of recreational fishers. For example, for some common species, recreational catch only corresponded to 0.8% of the commercial catch [24].
Due to the large spatiotemporal variation in recreational fishing activity, sampling measures are often more complex than the surveys used for evaluating commercial fishing. New evolving methods include data collected from social media [25]. Other studies use satellite data to evaluate the number of fishing vessels [8]. Nevertheless, regardless of the method used, some parts of the Mediterranean Sea remain poorly investigated.
The Eastern Mediterranean (Levantine) basin is located on the front-line of an extensive invasion via the Suez Canal. The Levant is also the hottest and saltiest region of the Mediterranean Sea [26,27,28]. These conditions benefit thermophilic non-indigenous species of Red Sea origin [29,30,31], turning the Levantine basin into a unique blend of native and non-indigenous species. In Israel, even though commercial fishing is declining, recreational fishing has increased in popularity. For example, according to the Israel Nature and Parks Authority, only 1000 fishers hold a commercial fishing license, while over 6000 fishers hold a recreational fishing license (excluding angling from the shore), and the number exceeds 70,000 when including angling [32]. However, there is currently no data on recreational fisher activity patterns, species composition of the catch, or annual yields. Information on the magnitude and spatiotemporal characteristics of recreational fishing in the extreme climate of the Eastern Mediterranean Sea is rare (Michailidis et al., 2020).
In this study, we surveyed the Israeli coast and quantified recreational fishing techniques, fishing preferences, catch biomass, and target species composition using a diversity of methods. These include coastal and aerial surveys, phone interviews, and shore interviews. We also compared the catch composition and length distribution of recreational fishing to that of the commercial fishing industry. Our study is the first to comprehensively characterize the recreational fishing sector activities along the Israeli coastline. We thus provide an important estimate of the contribution and impact of this fishing sector in a region suffering from extreme climatic conditions and severe invasion.

2. Methods

2.1. Data Collection

We used three different methods to monitor recreational fishing: (1) coastal surveys including interviews, (2) phone surveys, and (3) aerial surveys from a helicopter. All surveys were conducted between 2016 and 2018. Additionally, we obtained complementary data regarding the number of registered fishers and fishers holding licenses from the Israeli Ministry of Agriculture and the Israel Nature and Parks Authority.

2.2. Coastal Surveys

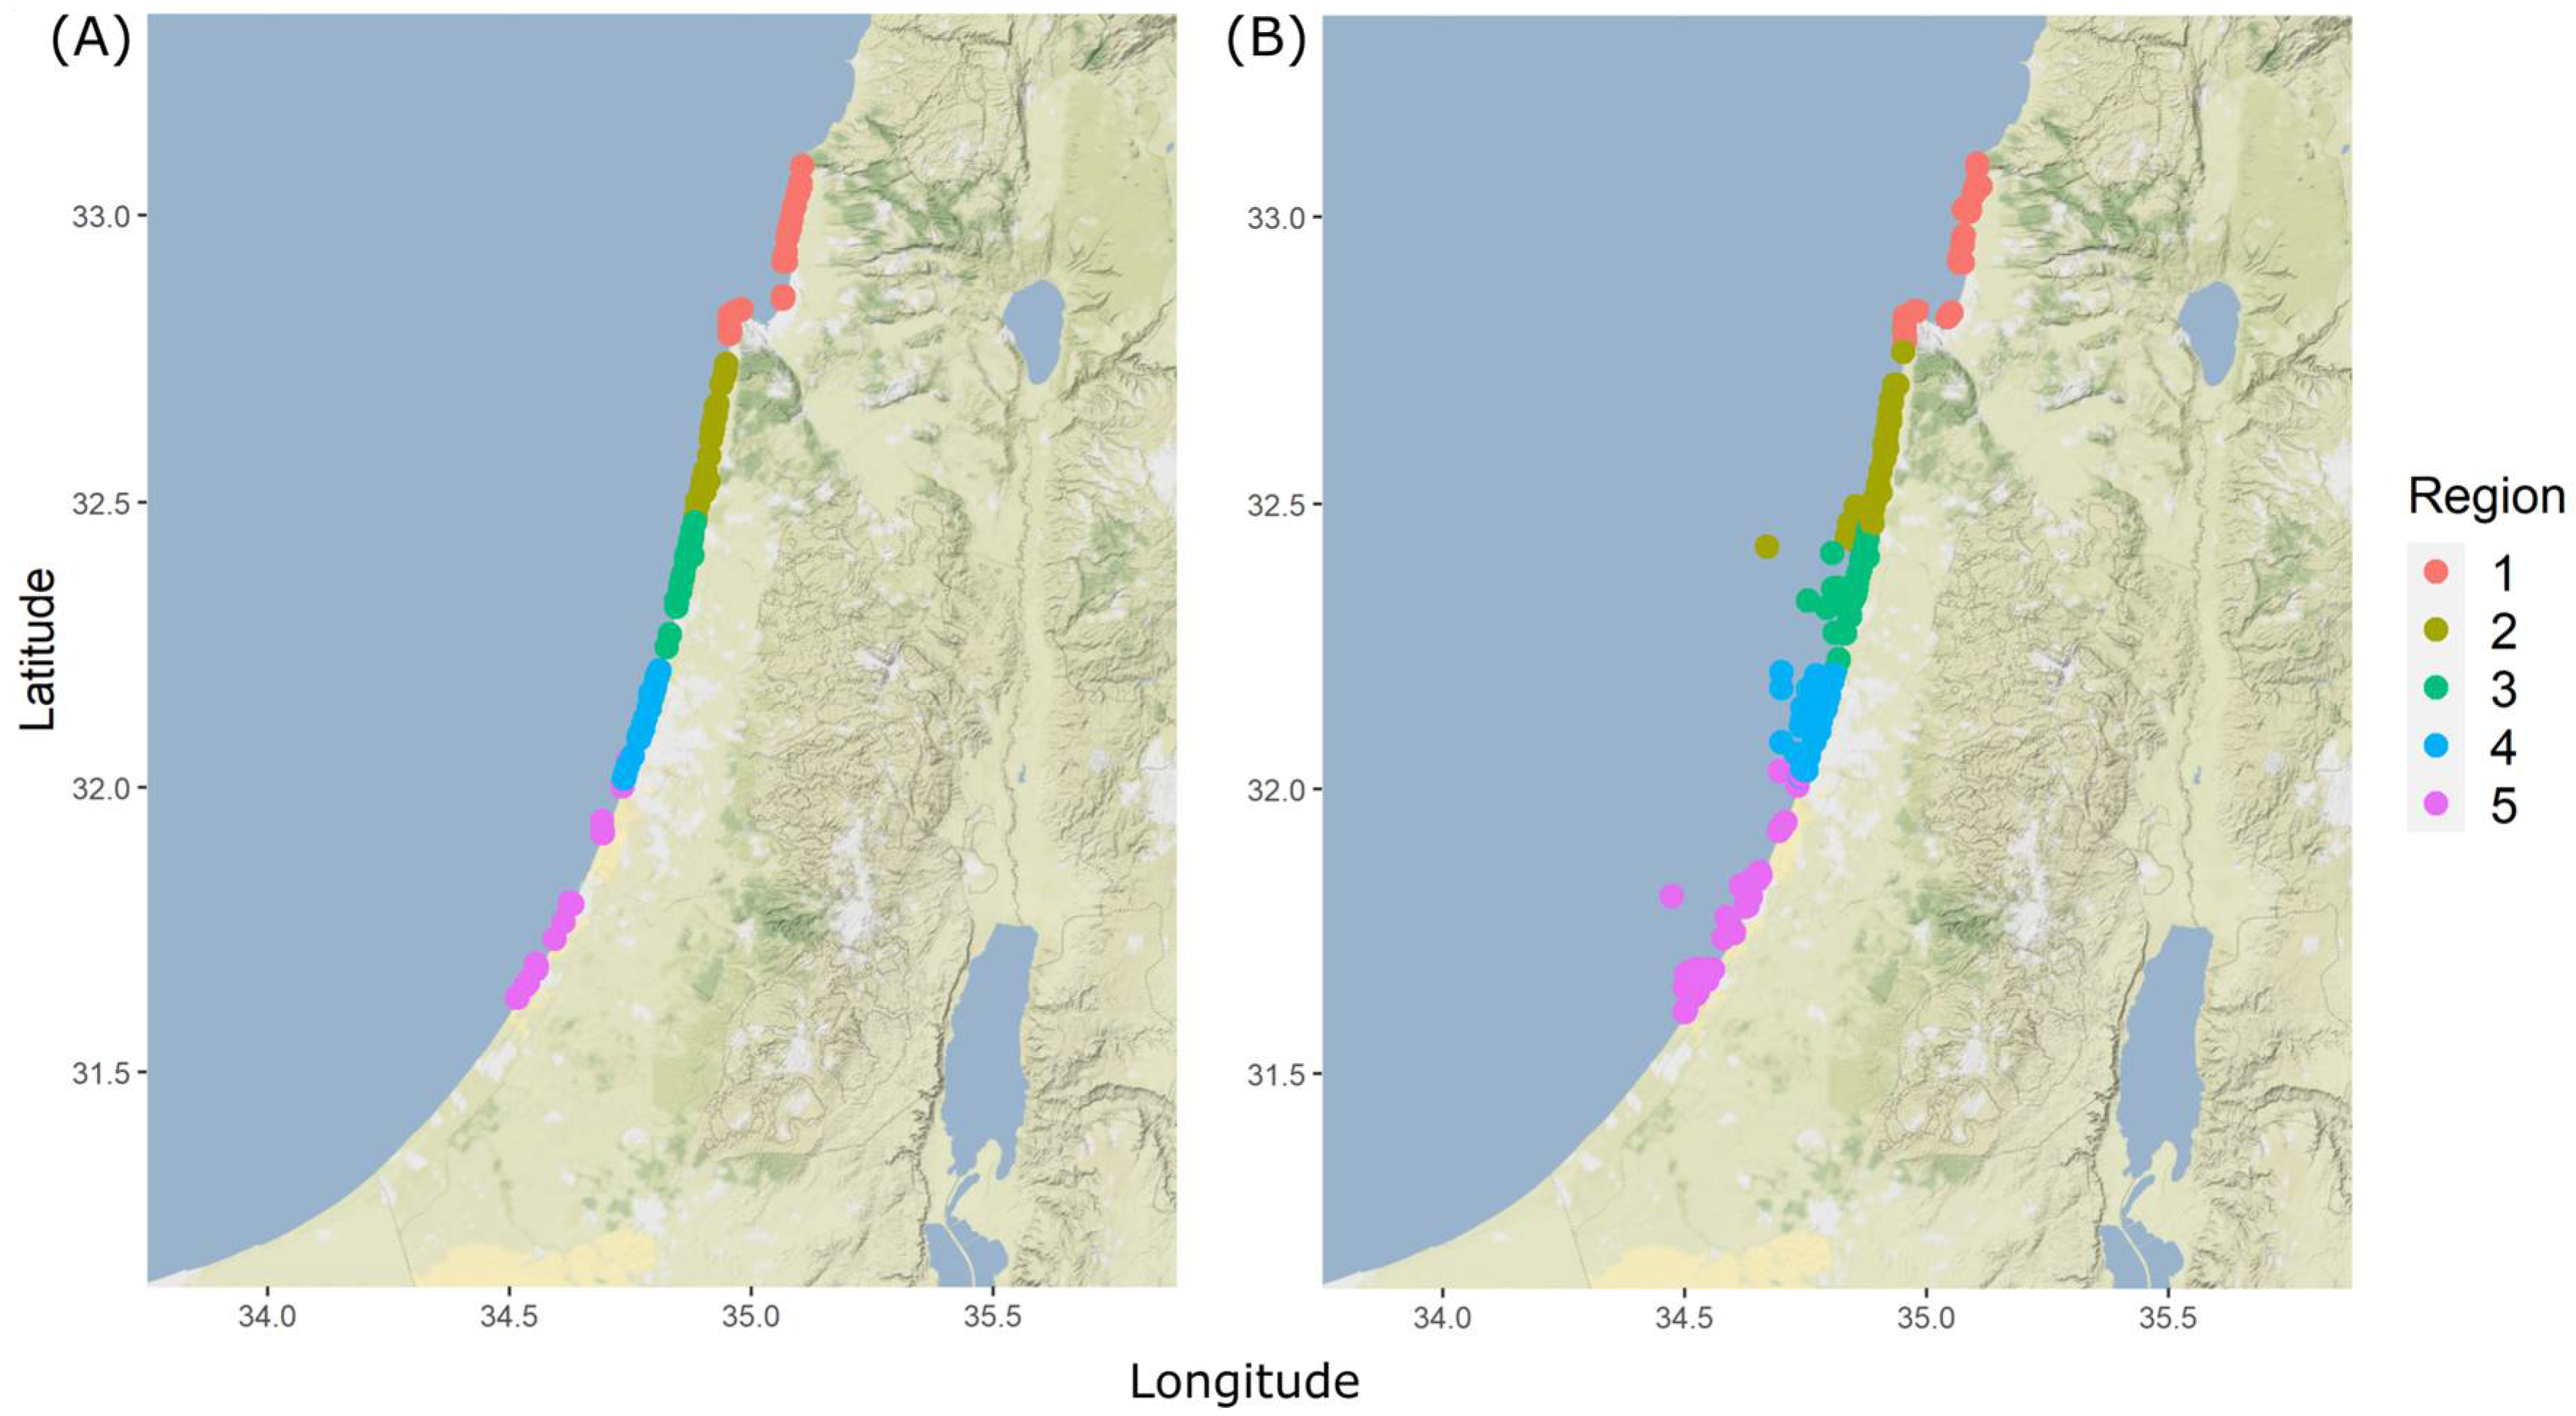
The coastal surveys covered a substantial part of the Israeli coast (120 km out of 145 km available for fishing, excluding areas that were not accessible by foot such as ports or military areas). The total Israeli Mediterranean coastline was divided into five regions (Figure 1). Each region was then split into different sites with a mean coastline length of 3 km. Different sites within each region were surveyed once every fortnight during a period of two years by a team of 15 surveyors. Weekends and weekdays were given equal sampling effort (although recreational fishing peaks on weekends). The time of the survey varied in order to capture dial variation, but surveys were not conducted at night, due to security reasons, and because this is when most recreational fishing is minimal.
Each coastal survey was composed of two steps. First, surveyors walked along a segment of coast, and documented the number of fishers and the number of fishing poles. Second, on the return, surveyors interviewed fishers and documented their catch. With the permission of the fisher, the surveyors measured and documented all the fish caught. When possible, fish total length (TL) was documented to the nearest millimeter, and a picture was taken for identification. In addition, surveyors questioned the fishers, and the following parameters were recorded: (1) Fishing duration (hours): the time measured since the fisher’s arrival; (2) time of the interview; and (3) fisher experience: number of years fishing. In addition, the surveyors recorded at the site level: (1) month (1 to 12 calendar months); (2) sea condition: quiet/wave/storm; (3) MPA (protected/non-protected): within or outside a marine protected area where all fishing methods are forbidden, except angling from the coast; and (4) hotspot (yes/no): these were defined as artificial sites less than 1 km long, such as ports and marinas. At these sites, the mean number of fishers was much higher than in the open coast (10.2 fishers compared to 4.5).
During 2017–2018, 274 surveys were conducted in 43 different sites along the Israeli coast, 1254 fishers were interviewed, and 3350 individual fishes representing 38 species were documented (Tables S1 and S2 ).
Biomass was calculated using a species-specific, Mediterranean-based length-weight relationship (W = aLb) gathered from FishBase [33], choosing values estimated as close as possible to the Israeli coast.

2.3. Phone Interviews

The time that fishers spend on the shore during angling from boats or kayaks, or during spear fishing, is brief and hence under-sampled from shore surveys. Thus, we contacted by phone fishers who use these methods of fishing in the open sea. We then spoke with each fisher at least once a month asking them to report their fishing activities. The same questionnaire used for the shore surveys was applied here. The phone interviews took place between August 2017 and January 2018. We managed to recruit 34 fishers that were willing to be regularly interviewed, and who were distributed along the entire Israeli coastline (Figure 1B). The fishers were divided into three groups: 13 fishers angling from a boat (78 interviews), 12 angling from kayaks (46 interviews), and 9 spear fishers (96 interviews).

2.4. Aerial Surveys

We used helicopter surveys to document the number of fishers more accurately along the entire Israeli coast. There were four helicopter flights during the time of the survey, each covering half the Israeli Mediterranean coast, so that all together, the entire coast was surveyed twice. On each flight, two surveyors documented fishing activities. One of the surveyors focused on the number of anglers from the shore, and the other on fishing activities at the open sea (fishing from kayaks, fishing from boats, or spear fishing). The surveys were conducted on Friday mornings, in January 2017, January 2018, November 2016, and March 2017.

2.5. Commercial Fishing Data Collection

We compared the length distributions and species composition from recreational fishing to other commercial fishing sectors: trawl fishery [34] and artisanal fishery (set nets and long-lines [35,36]). For details on catch estimates and the species composition of these methods see File S1 and Tables S3 and S4.

2.6. Statistical Analysis

Coastal Surveys: Annual Catch

The annual catch extracted by anglers fishing from the shore was calculated using two separate models, one that calculated the extracted biomass per fisher per hour (kg/hour/fisher) (“biomass model”) and the other, the number of fishers per kilometer (“fisher model”). The results of these two models were combined to estimate the total annual catch along the Israeli coast. The two models were constructed using GAMs (General Additive Models) which are suitable for describing nonlinear relationships between variables, and capable of dealing with cyclic data [37,38]. All GAMs were constructed using the ‘mgcv’ R package.
For the biomass model, we used ‘catch (kg)’ per hour as the response variable. The response variable was zero-inflated and thus modeled with a Tweedie distribution (p = 1.5) [39,40,41] Candidate predictors included: (1) time of the interview (morning/noon/evening), (2) hotspot (yes/no), (3) substrate (sand/rock/artificial), (4) sea condition (quiet/wave/storm), (5) MPA (protected/non-protected) as fixed effects, (6) Fishing duration (hours), which represented the time each fisher was fishing until the time of the interview. This was modeled using a univariate adaptive smoother, appropriate when there is a large variation (“wiggleness”) in the variable. (7) Month was modeled using a cyclic cubic regression spline smoother with the knot number (k) defined to be 12. (8) Fisher experience (years) was modeled using the cubic regression smoother. Finally, site was used as a random effect.
For the fisher model, we estimated the number of fishers per kilometer. We used a negative binomial distribution to deal with zero inflation in the count data. The candidate predictors were (1) hotspot (yes/no), (2) time of the interview (morning/noon/evening), (3) MPA (protected/non-protected), (4) sea condition (quiet/wave/storm), and (5) day of the week (weekday/weekend) as fixed effects. As in the biomass model, month was calculated with a cyclic cubic regression spline smoother, and site was modeled as a random effect.
In both cases, we used AICc to exclude less-supported variables and we chose the best supported explanatory variables while avoiding over fitting. When the difference between models in AICc was small, we preferred models that had common variables between the fisher and biomass models to facilitate the calculation of the summed catch.

2.7. Predictions

To predict the annual catch for the Israeli coast, we needed to multiply, per each site and each month, the number of fishers (number/km) and biomass (kg per fisher/hour) estimated by the GAMs, by (1) the number of available fishing days a month, (2) the number of fishing hours per day, and (3) the number of kilometers available for fishing, to obtain annual estimates. These were then summed across months and sites to obtain the total annual catch.
The number of days suitable for fishing in a month is dependent on weather conditions, and can change from one year to another. Thus, we examined different scenarios for each fishing technique (angling from the coast, fishing from a boat or a kayak, and spear fishing) according to estimations made by 7 marine rangers of the INPA (Israeli Nature and Parks Authority) who spend their day in the sea and encounter fishers regularly. We used the mean estimation, but presented also the min and max estimations. As we only examined fishing activity during the day, the number of fishing hours per day ranged between 12 and 16, according to the seasonal variation. Finally, as the coastal surveys covered almost all of the Israeli coast available for fishing, we could sum the biomass predicted at each site to receive annual yields with high accuracy. To account for the 25 km that were available for fishing but were not surveyed, we calculated the mean biomass and the number of fishers per km for a non-hotspot site, and added it to the calculation.
The final calculation of biomass was based on predicting the biomass caught for one hour, at each one of the sites, during the different months of the year, for a fisher with 20 years of experience (experience significantly affected biomass and 20 years of experience was both the mean and median fisher experience). We then multiplied the catch per hour by 12 h of fishing, and by the number of available fishing days (according to the two scenarios explained above, 70%, 78%, and 85% of days available for fishing). This was then multiplied by the fisher density estimates (at each site and across months, for both weekdays and weekends as we observed 1.7 more fishers on weekends):
A n u a l   b i o m a s s   p e r s i t e   p e r   m o n t h = P r e d i c t e d   b i o m a s s   c a u g h t   ( p e r   h o u r ) × 12   h o u r s ×   N u m b e r   o f   a v a i l a b l e   f i s h i n g   d a y s   ( 70 % ,   78 %   a n d   85 % ) ×   N u m b e r   o f   f i s h e r s   ( f i s h e r s   d e n s i t y )
These values were summed across sites and months to derive Israel’s annual catch.
In addition to the calculation of the annual biomass fished along the Israel coast, which included fish reported to be released, we compiled, following the same protocol, an estimation of the kept annual biomass based on the fishers’ reports.

2.8. Fishing at Sea

Annual yields of angling from a boat, angling from a kayak, and spear fishing were calculated based on phone and aerial surveys. The biomass extracted was estimated using two different methods:

2.8.1. Method 1: The Number of Fishers Based on Registered Fishing Licenses

In the first method, we used the product of biomass per fishing day, mean fishing days per month (both estimated from the phone surveys), number of months per year (12), and the number of active fishers.
The number of active fishers was estimated using the number of fishing licenses registered in the Israeli Ministry of Agriculture and the Israel Nature and Park Authority. The number of licensed fishers may be misleading, as not all fishers are regularly active. Thus, we calculated three different scenarios for the number of active fishers, according to estimations made by 5 marine rangers of the INPA. Presented are mean (82% are active), maximum (90% are active), and minimum (75% are active) estimations. Fishers angling from a boat, or a kayak hold the same license. Since we could not separate the biomass of each technique, we calculated the weighted total biomass for these two methods assuming the relative number of fishers from the boat and kayak is similar to their relative number in the interviews.
A n n u a l   b i o m a s s r e g i s t e r d   f i s h i n g   l i c e n s e s = B i o m a s s   p e r   f i s h i n g   d a y ×   m e a n   f i s h i n g   d a y s   p e r   m o n t h ×   n u m b e r   o f   m o n t h s   a   y e a r   ( 12 ) ×   a c t i v e   f i s h e r s   ( 75 % ,   82 %   o r   90 % )
We repeated this calculation for the reported kept biomass to assess the magnitude of catch and release practice.

2.8.2. Method 2: The Number of Fishers Based on Aerial Observations

For the second method, we used the number of fishers observed from the aerial surveys. We calculated the mean biomass per fishing day as reported on the phone surveys and multiplied it by the number of fishers observed from the aerial survey, the number of available fishing days a month, the number of months a year, and turnover rate. Turnover rate means the number of times new fishers arrive and leave during one day. We set the turnover rate as three, using the assumption that new fishers arrive and leave three times a day: early morning, morning, and afternoon. As all aerial surveys were conducted on weekends, to estimate the number of fishers on weekdays, we divided the number of fishers observed by 1.7, which is similar to the ratio observed for angling from the shore (1.7 on weekends compared to weekdays). The total number of fishers was estimated by calculating the mean density across all surveys, multiplied by the number of available kilometers for fishing. Again, we used estimations of 7 marine rangers of the INPA for the number of available fishing days. We show the mean (285), maximum (310), and minimum (255) estimations. These scenarios are more restrictive than the ones used to assess the available fishing day for anglers, as the fishing at sea methods are more sensitive to sea conditions (visibility, waves, etc.):
A n n u a l   b i o m a s s a r e a l   o b s e r v a t i o n s   = B i o m a s s   p e r   f i s h i n g   d a y × f i s h e r s   o b s e r v e d ×   t u r n o v e r   r a t e   ( 3 ) × n u m b e r   o f   m o n t h s   a   y e a r   ( 12 ) ×   a v a i l a b l e   f i s h i n g   d a y s   ( 250 ,   283   o r   310 )
We repeated this calculation for the kept biomass only.

2.9. Comparing among Fishing Methods

We made comparisons among the different fishing methods by calculating the predicted annual catch for each species for each fishing method, separated into size bins. We compared the absolute catch values of anglers from the coast and recreational fishing at sea, and compared these to commercial fishing from trawling, set nets, and long lines.

The Calculations Involved Several Steps

(1)
The annual yields of commercial methods were based on the most recent estimations made in 2017 by the Israeli Fisheries Department in the Ministry of Agriculture (unpublished data). In total, the Israeli fishing fleet extract about 1500 tons a year. The trawl fisheries extract about 775 tons, and the nets and long lines about 638 tons.
(2)
We estimated the relative proportion of each size bin of each species from the total catch of each fishing method. Here, we assumed that the proportion of the species and size binds from each survey represents their proportion in the annual catch. Data sources used for the relative proportion of each species are described in File S1.
(3)
To convert biomass to the number of individuals, we divided the absolute biomass by the mean weight of fish within each size bin.

3. Results

3.1. Angling from the Shore

We documented 38 species, of which 12 species were non-indigenous. In total, 3350 individuals with a biomass of 138 kg were recorded. Two non-indigenous species were the most common species in the catch: Siganus rivulatus and Sillago suezensis (representing 48% and 13% of the catch, respectively). The indigenous species Diplodus sargus was the next most abundant species representing 12% of the catch. All the other species represent <7% of the individuals. In terms of biomass, the most abundant taxa in the catch were Mugilidae followed by the non-indigenous Siganus rivulatus and Diplodus sargus (17%, 17% and 16%, respectively). All the other species represented <9% of the biomass.
The variables that best explained the variability in the number of fishers included day of the week, month, and sea condition. The chosen model explained 48% of the variability in the number of fishers (conditional R2, Table S5, Figure S1). The variables that best explained the variability in biomass included fishing duration (hours), month (1–12), and fisher experience. The chosen model explained 30.9% of the variability in biomass (conditional R2, Table S6, Figure S2). The mean biomass was 0.74 (±0.30 SD) kg/per fishing hour.
To produce the best match between the fisher and biomass models, we used the first biomass model and the fifth best fishermen model (∆AIC = 2.14 from the best supported model, for detailed AICc model selection see Tables S7 and S8). By multiplying the models for biomass and the number of anglers, we found that anglers from the shore extract between 360 and 393 tons of fish a year (Table 1). This variation in yields reflects the difference in the number of days available for fishing (Table 1).
Using the fisher model, we also documented that fishing activities in hotspots, such as marinas and wave breakers, were 3.44 higher than in non-hotspot sites (Figure S3), and 1.7 higher on weekends compared to weekdays (Figure S4). Surprisingly, fishers did not prefer MPAs, and this predictor was therefore excluded in the process of model selection. Using the biomass model, we found significant seasonal variation in catch per hour, with a peak mode in biomass during the fall (October). Minimum values were found at the end of the winter and the beginning of spring (February–April) (Figure 2A).

3.2. Fishing at Sea

During the aerial surveys, a total of 1587 fishers were documented: 1402 anglers from the shore, 60 recreational fishing boats, 25 anglers from a kayak, and 100 spear fishers.
Through the phone surveys, we recorded a catch of 1010 individual fish with a total biomass of 846 kg, representing 39 species from which 6 are non-indigenous. The non-indigenous species Nemipterus randalli was the most abundant species in the catch, representing 28% of the catch. The rest of the species represented <7% of the individuals. In terms of biomass, the most abundant species was the non-indigenous Lagocephalus sceleratus representing 17% of the catch, followed by the non-indigenous Scomberomorus commerson and the native species Seriola dumerili and Thunnus alalunga (representing 16%, 15%, and 12% of the biomass, respectively). The rest of the species represented <5% of the biomass (for the detailed species list see Tables S9 and S10). We found that angling from a boat produced the highest catch rate, with a mean 5.18 (±5.76 SD) kg/day, followed by angling from a kayak 3.77 (±3.40) kg/day, and spear fishing 1.59 (±1.59) kg/day.
Predicting the recreational annual biomass fished at sea was conducted by using two different methods to estimate the number of fishers: (1) from the number of licensed fishers, and (2) from aerial surveys. Estimates of the biomass, extracted by fishing techniques at sea, vary greatly between the two calculation methods. When using the first method, we find that annual yields vary between 571 to 712 tons (depending on estimated active licenses; Table 2). However, when estimating the number of fishers using the data collected by the aerial surveys, values vary between 96 and 121 tons a year (Table 3). A seasonal variation in biomass also appears in these fishing methods, as biomass peaks in spring and at the beginning of summer (May–June), and the minimum values are in summer (July–August, Figure 2B).

3.3. Comparison with Commercial Methods

The Israeli commercial fishing industry extracts about 1500 tons a year via different fishing methods including trawling (~775 ton), set nets and long lines (~638 ton), and purse seine (~150) (unpublished data from the Fisheries department in the Ministry of Agriculture). Thus, recreational angling from the coast represents 7% to 10% of total fish biomass extracted, while the recreational fishing at sea represents 3% to 27% of the total biomass extracted.
Comparing the species caught in recreational fishing to trawl, set nets, and long lines fisheries (i.e., commercial fishing), we found 15 species common to recreational angling from the coast and commercial fishing, and 18 species common to recreational fishing at the open sea and commercial fishing (Figure 3, and detailed species list in Table S11).
A high similarity in species composition was found between recreational angling from the coast, and the set nets and long lines methods. Both methods target small species associated with the rocky reef such as Diplodus sargus and Siganus rivulatus (composing 17% and 17% of the catch for recreational angling and set nets and long lines, respectively) (Figure 4A–D). These species are caught in smaller sizes by angling from the coast than in commercial methods. In addition, the total biomass caught by recreational angling from the shore is much lower than that of set nets and long lines. For example, ~50,000 individuals of Diplodus sargus are caught yearly by recreational angling from the coast, representing three tons. However, in set nets and long lines, the total biomass sums up to 9.5 tons (over three times more, Figure 4A,B). Pelagic species, such as Scomberomorus commerson, have a relatively low commonality with recreational angling from shore, and are mainly caught by commercial methods (822 kg in recreational angling from shore compared to 3.5 and 2.5 tons in set nets/long-lines and trawling, respectively). Other species were more commonly caught in the trawl fishing, such as Boops boops of which 41.3 tons are caught by trawling and only 224 kg and 452 kg are caught by recreational angling from the shore and set nets/long-lines, respectively. Finally, Caranx crysos and Sparus aurata are mainly caught by recreational angling from shore. However, they are common in the commercial fishing catch as well. For example, 11 tons of Caranx crysos are caught annually by recreational angling from the shore and only 1.5 tons and 5.6 tons in set nets/long-lines and trawls, respectively (Figure 4E–H).
When comparing recreational fishing at sea and the other commercial methods, we find that the species Mycteroperca rubra and Dentex gibbosus are caught mainly by recreational fishers. For example, the biomass of Mycteroperca rubra caught by recreational fishing at sea (5.1%) is higher than in all other methods. While, annually, 11 tons of Mycteroperca rubra are caught in recreational fishing at sea, and only 456 kg and 361 kg are caught in set nets/long lines and trawl fishing, respectively (Figure 5A,B). Small species such as the non-indiginous Siganus rivulatus and species from the Sparidae family, such as Diplodus sargus and Lithognathus mormyrus, are mainly caught in set nets and long lines. For example, the annual catch of Siganus rivultus in recreational fishing at sea is 104 kg compared to 104 tons in set nets and long line fishery. The non-indigenous Nemipterus randelli is common both in recreation fishing at sea and in trawl fishing. However, the representation of this species in the annual trawl catch (218 tons) considerably exceeds the catch by recreational fishing (5.3 tons).
Other species are caught by multiple fishing methods, including recreational fishing at sea. These species include highly commercial species such as Pagrus coeruleostictus (6.5 tons in recreational fishing at sea, 10 tons in set nets and long-lines, and 11.5 tons in trawl catch, Figure 5C,D), Scomberomorus commerson (3.5 tons in recreational fishing at sea, 3.5 tons in set nets and long-lines, and 2.5 tons in trawl catch, Figure 5E,F) and Seriola dumerili (34 tons in recreational fishing at sea, 20.5 tons in set nets and long-lines, and 9.4 tons in trawl catch, Figure 5G,H). For the last three species, smaller young individuals are caught by trawling, while the intermediate and large individuals are caught by recreational fishing and set nets/long-lines (Figure 5).
Examining seasonality patterns, we found that the biomass in all fishing methods reaches the highest values in winter (December–February). Both recreational methods (angling from shore and fishing at sea) also hit a peak in the fall (October–November). Recreational fishing at sea has an additional peak in the end of spring and beginning of summer (May–June), which is similar to a peak in the set nets fishery (Figure S7).

4. Discussion

In this study, we document recreational fishing at an entire country level for two years, and we use different strategies to provide the most comprehensive estimate to date of recreational fishing in Israel. We find that recreational fishing composes 18–45% of total annual biomass extracted from the sea, which is similar to estimates from other Mediterranean countries [42,43]. We find differences between the species targeted by each of the fishing methods. However, some highly commercial species are caught by several methods, showing that these methods likely compete over catch. We also show that in this area of the Mediterranean, non-indigenous species have become an important part of the catch in all fishing methods. This result is compatible with other studies conducted in the eastern Mediterranean Sea, which showed that the two most important species in the catch were invasive rabbitfishes (Siganus luridus and Siganus rivulatus) [42]. We recommend that recreational fishing must be considered non-negligible, and should be monitored and managed.

4.1. Total Catch

We find that recreational fishing composes a substantial portion, of between 18–45%, of total annual biomass extracted from the sea. Our results of total annual biomass extracted fall within the range estimated in other Mediterranean countries. For example, a review of studies from Spain, France, Italy, and Turkey found that total catch of recreational fishing ranges from 10% up to 50% of the total commercial fishing catch (Font & Lloret, 2014). We also fall into the range of similar results as those obtained in former, less detailed evaluations made in Israel [32]. A recent study examining the recreational catch in Cyprus found that the marine recreational catch exceeds the coastal commercial catch by 46% [42]. Studies conducted along the Turkish coast and in Malta show that the recreational fishing catch constitutes about 30% of commercial fishing [7,44] and in Tunisia, recreational fishers’ catch represents 20–40% of commercial fishing catch [43]. Furthermore, for certain species, a greater proportion of recreational fishing was found. For example, in Portugal, the recreational catch of Diplodus saragus was estimated to constitute 65% of the commercial landings [45]. Taken together, recreational catch estimates compared to commercial catch in Israel appear to be within the range found in other Mediterranean countries.
We found that the catch of recreational angling from shore represents 15–18% of the annual biomass extracted yearly across all fishing methods. Recreational fishing at sea represents a more variable estimate, with the higher end estimated values exceeding those of angling from the coast (4–27%). The reason for such high estimates for recreational fishing at sea (up to 27%) compared to shore could be explained by each species’ method targets [6,10,46]. For example, anglers from the coast may target smaller species with lower biomass than fishers at sea who target large species, and therefore may reach higher catch [19]. The wide variability in estimating recreational catch at sea is mainly due to the challenge of documenting these activities compared to the anglers fishing from the coast [45]. This variation in estimated yields illustrates the importance of documenting fishing activities to the lowest resolution, in terms of gear and species, possible in order to fully understand the fishery impact [4], especially where there is a variety of recreational fishing methods [2,19]. Without detailed documentation of the catch of specific fishing methods and species, evaluations can be partial and potentially misleading.

4.2. Catch Composition

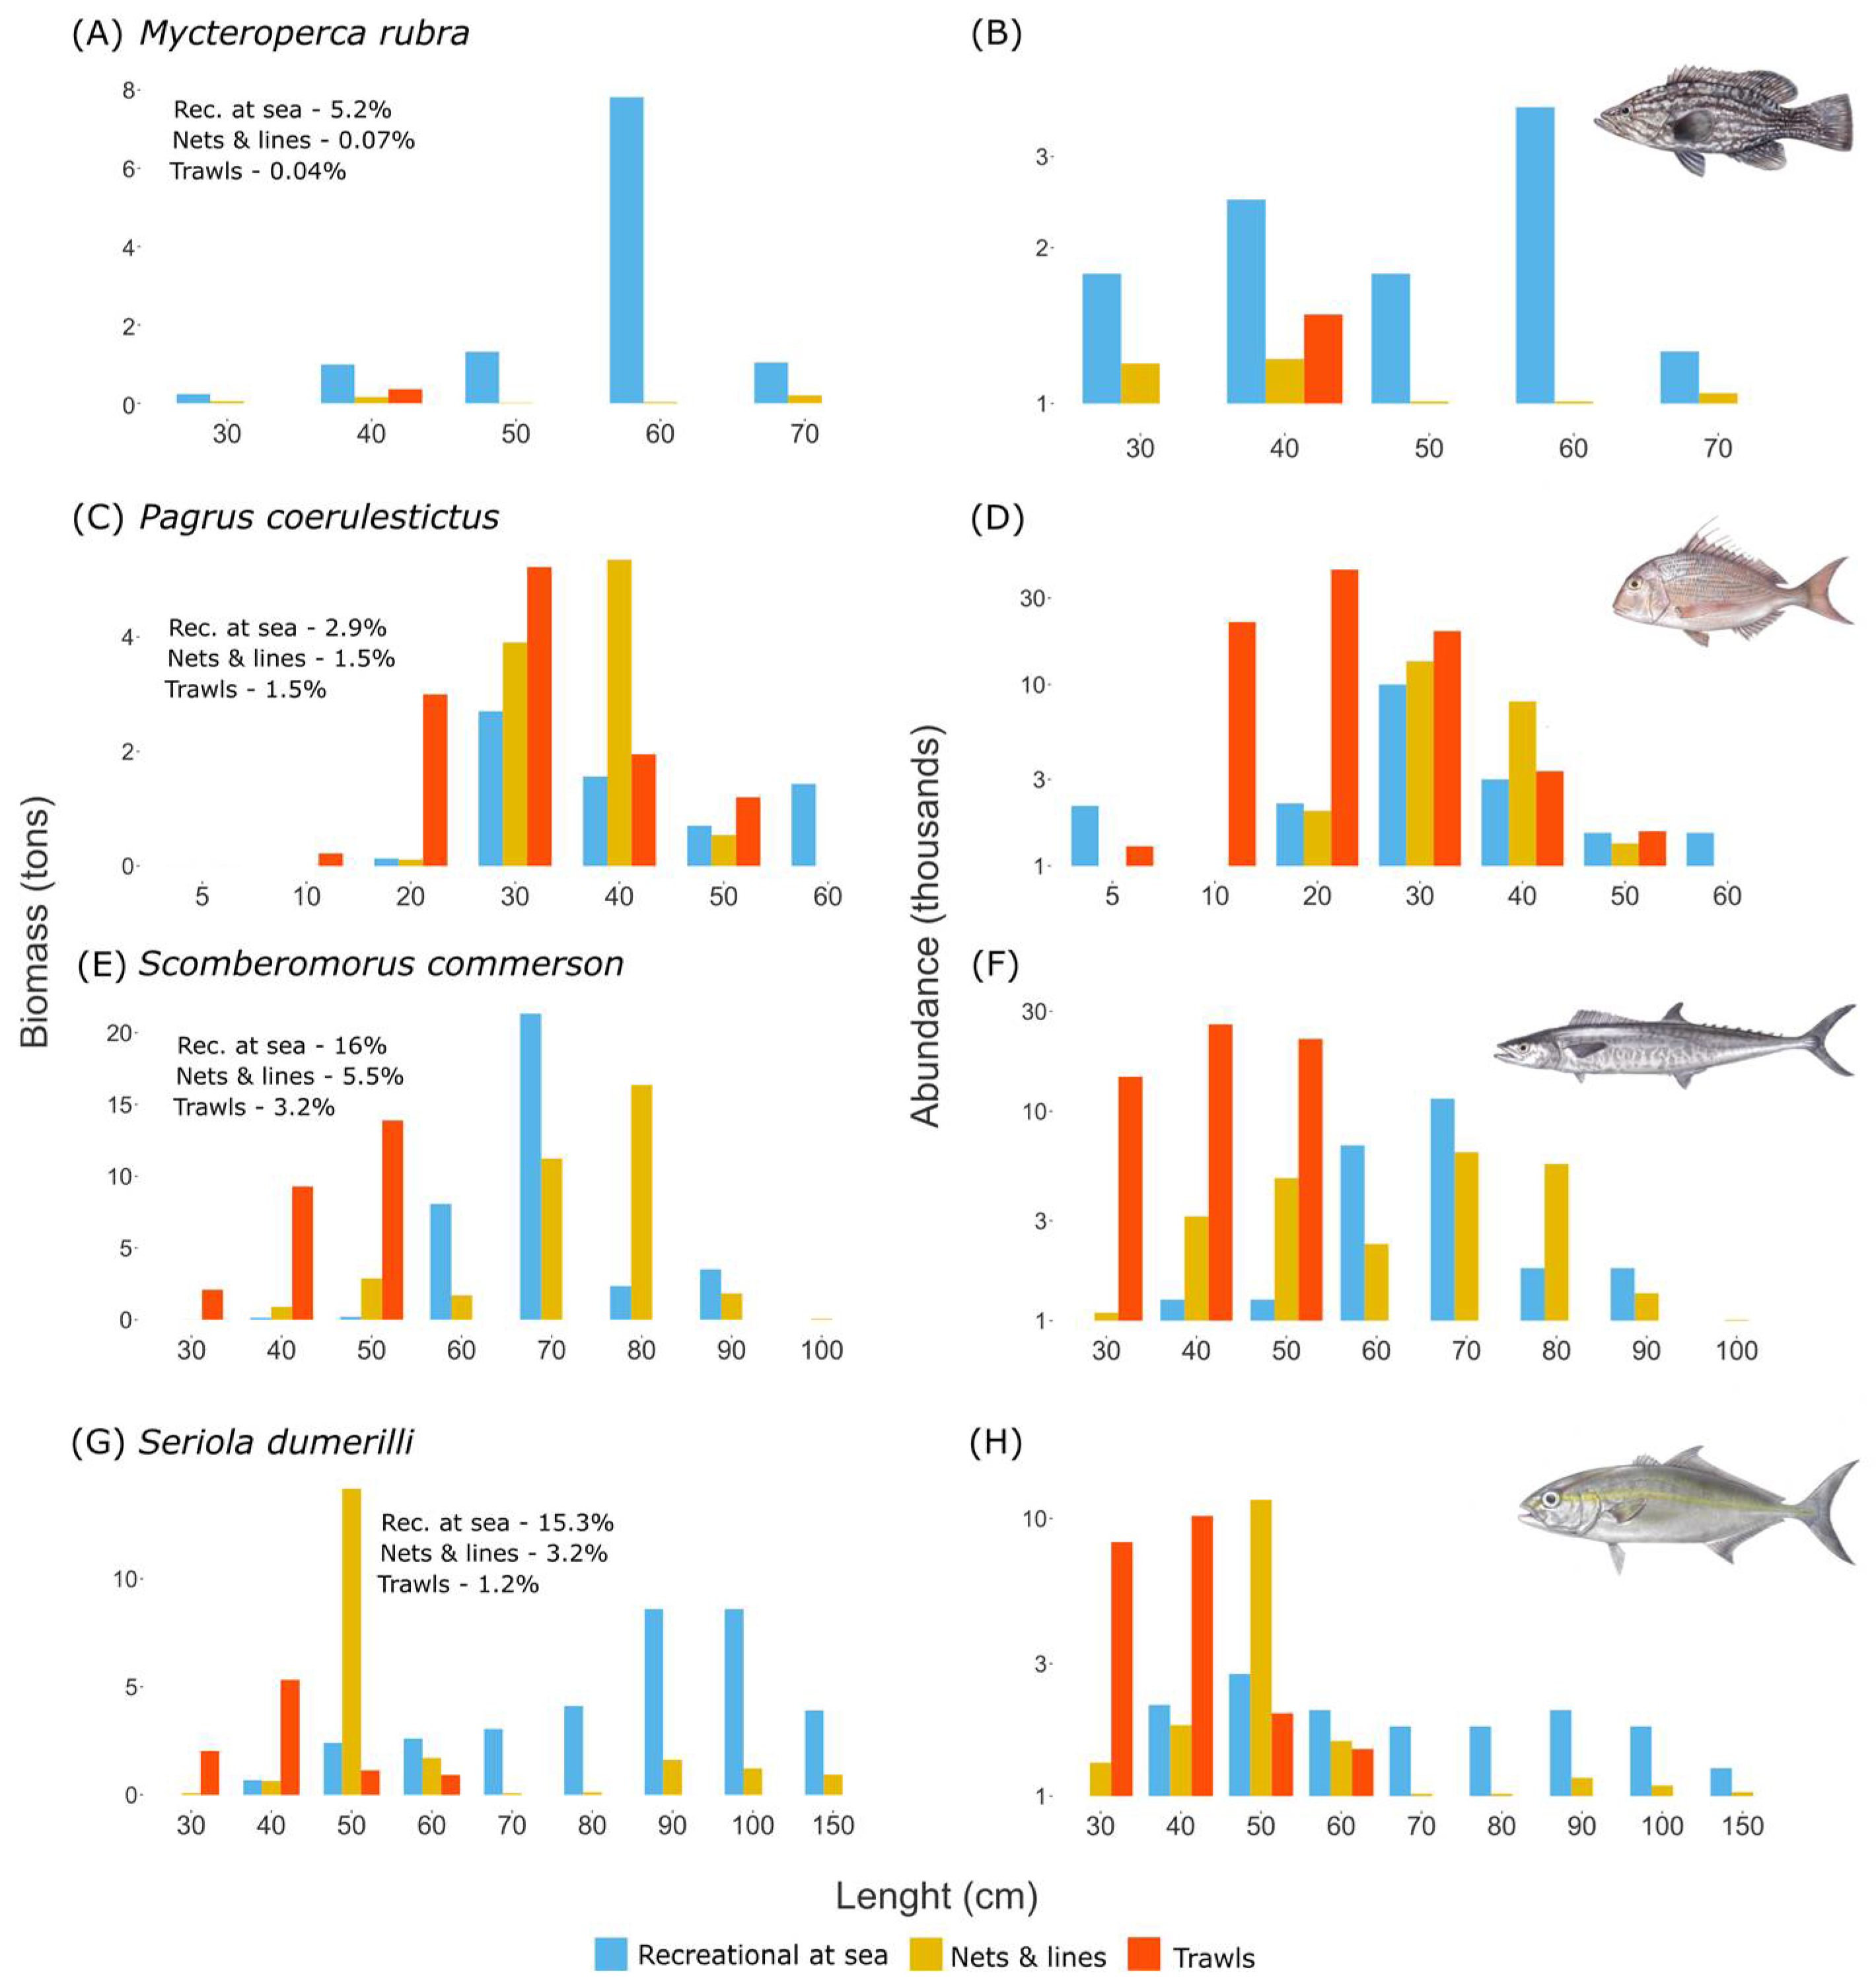
The variety of the recreational fishing sector and the multispecies character of the Mediterranean Sea lead to a large variety of caught species. We find that recreational fishing from the coast targets mostly small reef-associated species such as Diplodus sargus, Lithognathus mormyrus, and species from the Mugilidae family. Recreational fishing at sea targets larger species such as the grouper Mycteroperca rubra, the Sparide Pagrus coeruleostictus, and pelagic species such as Seriola dumerili.
Interestingly, non-indigenous species have become an important part of the catch within all recreational methods examined. Some species such as Scomberomorus commerson, Siganus rivulatus, and Nemipterus randelli are heavily fished both in recreational and commercial fishing. The presence of non-indigenous species in the catch had already been shown to have a positive effect on the trawl industry in Israel [31]. However, some of the non-indigenous species such as Siganus rivulatus are known to have additional disastrous ecological impacts by removing algae cover from reef meadows [27]. Other species such as Lagocephalus sceleratus (the most abundant species in the recreational fishing at sea) are less favored by fishers as they are poisonous and cannot be consumed or sold. This species also causes damage to fishing gears of both recreational and commercial set nets and long lines, by cutting nets and lines, and by eating fish already caught in the fishing gear [47]. Overall, non-indigenous species have become an integral part of recreational fishing. This study thus provides a baseline against which to compare future changes to local fish biodiversity.

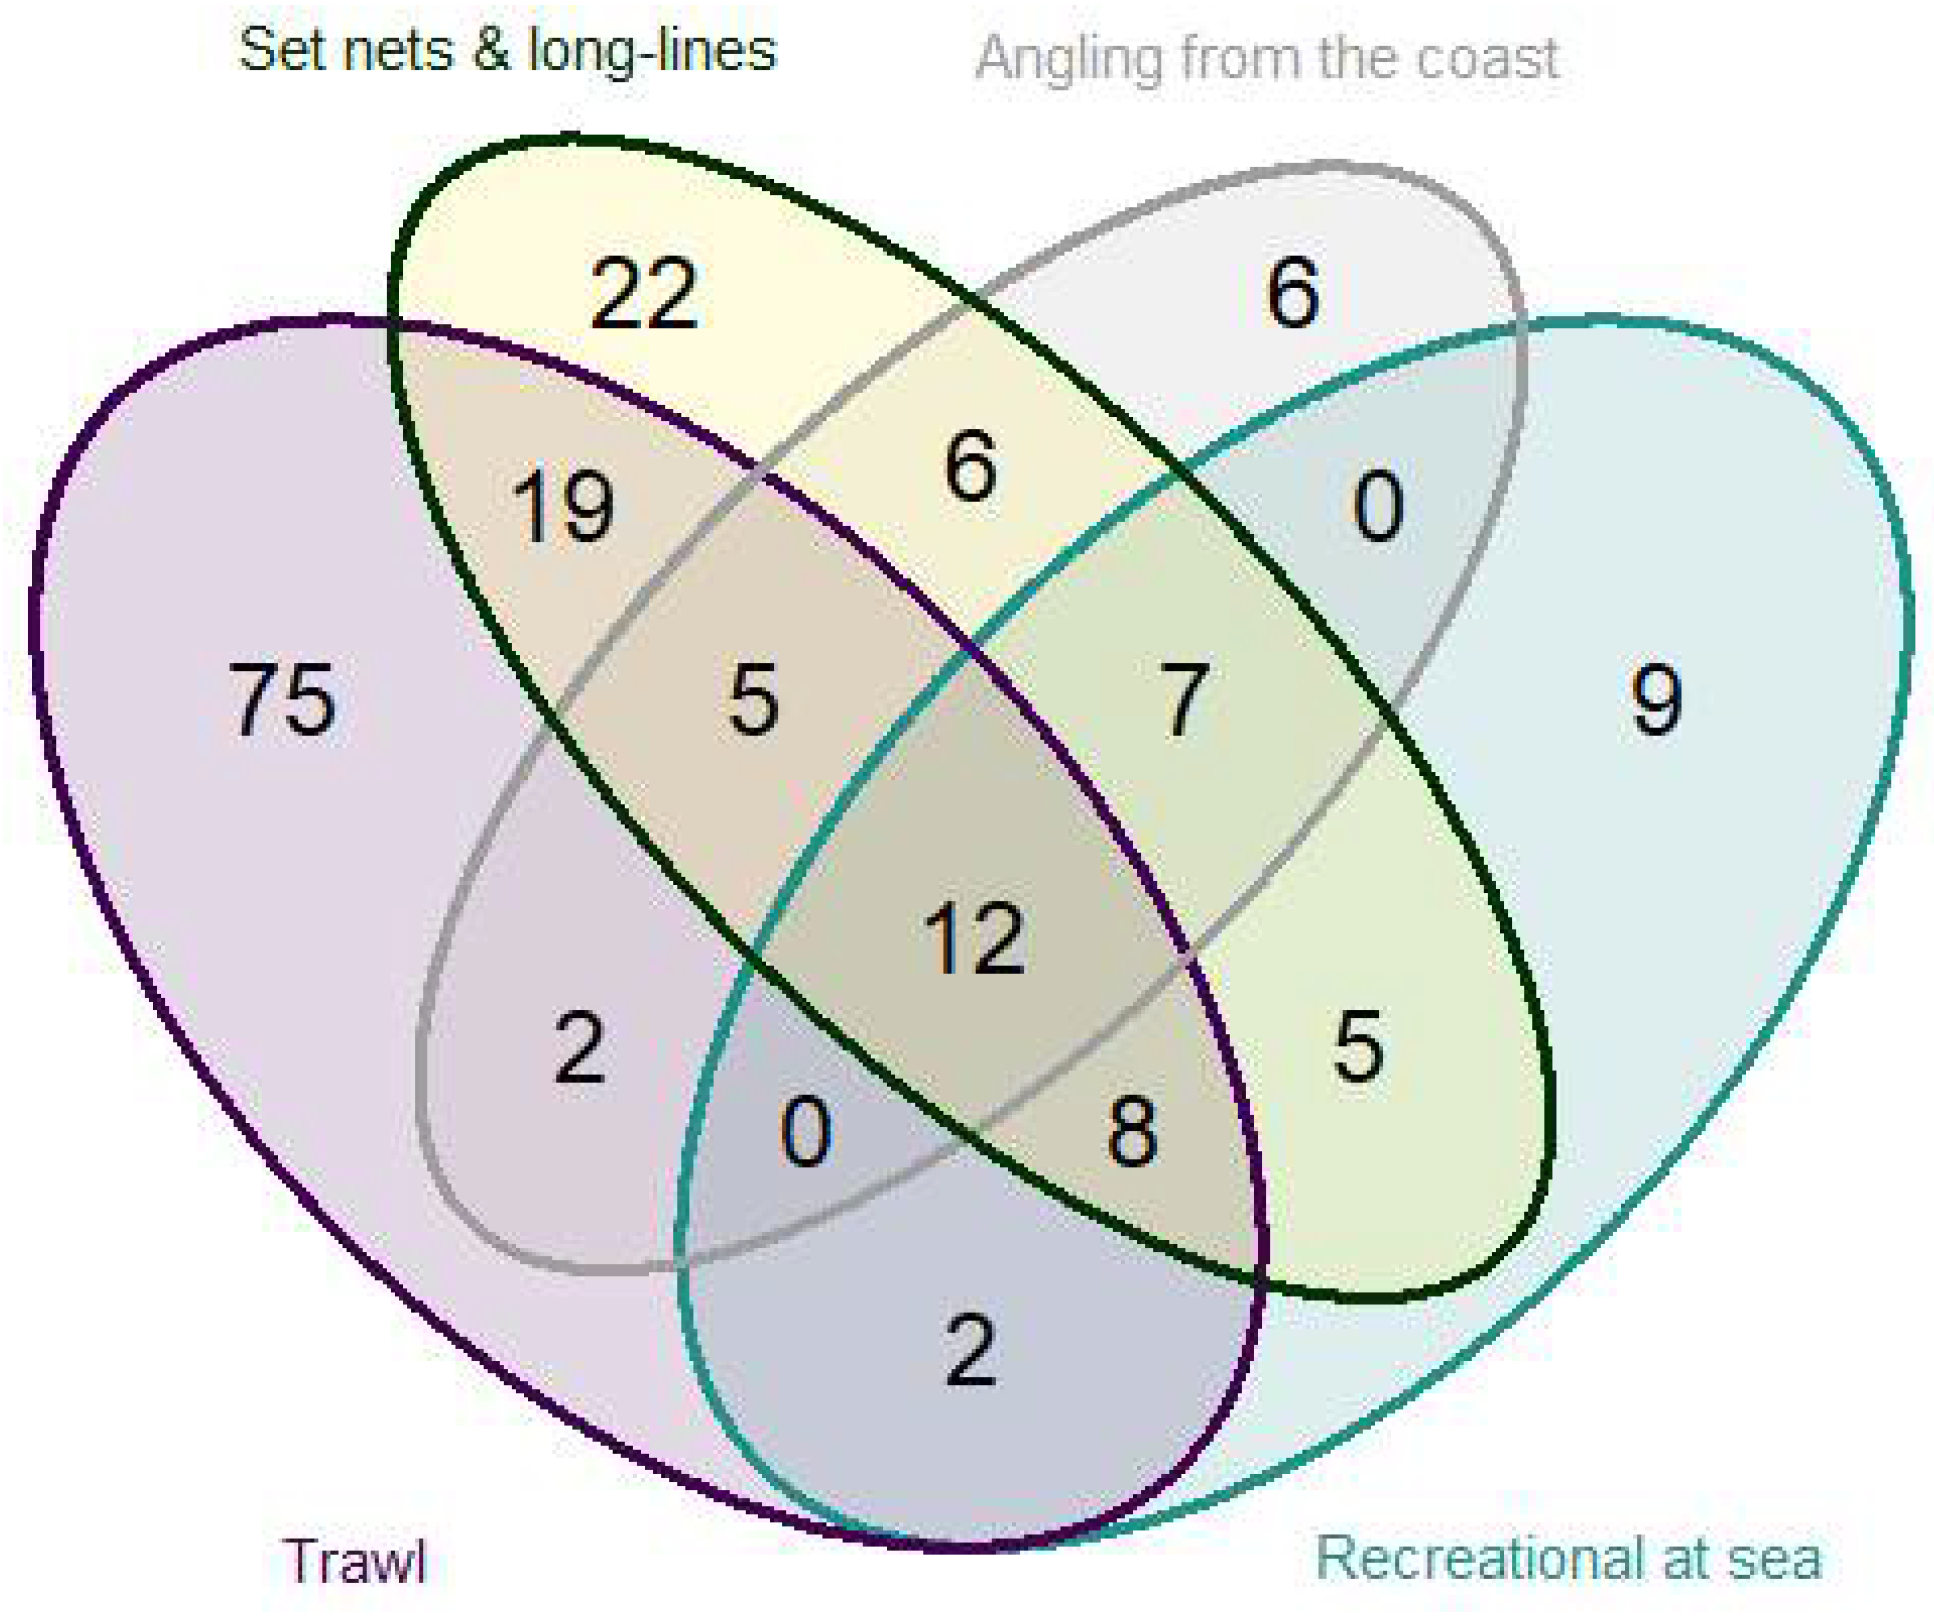
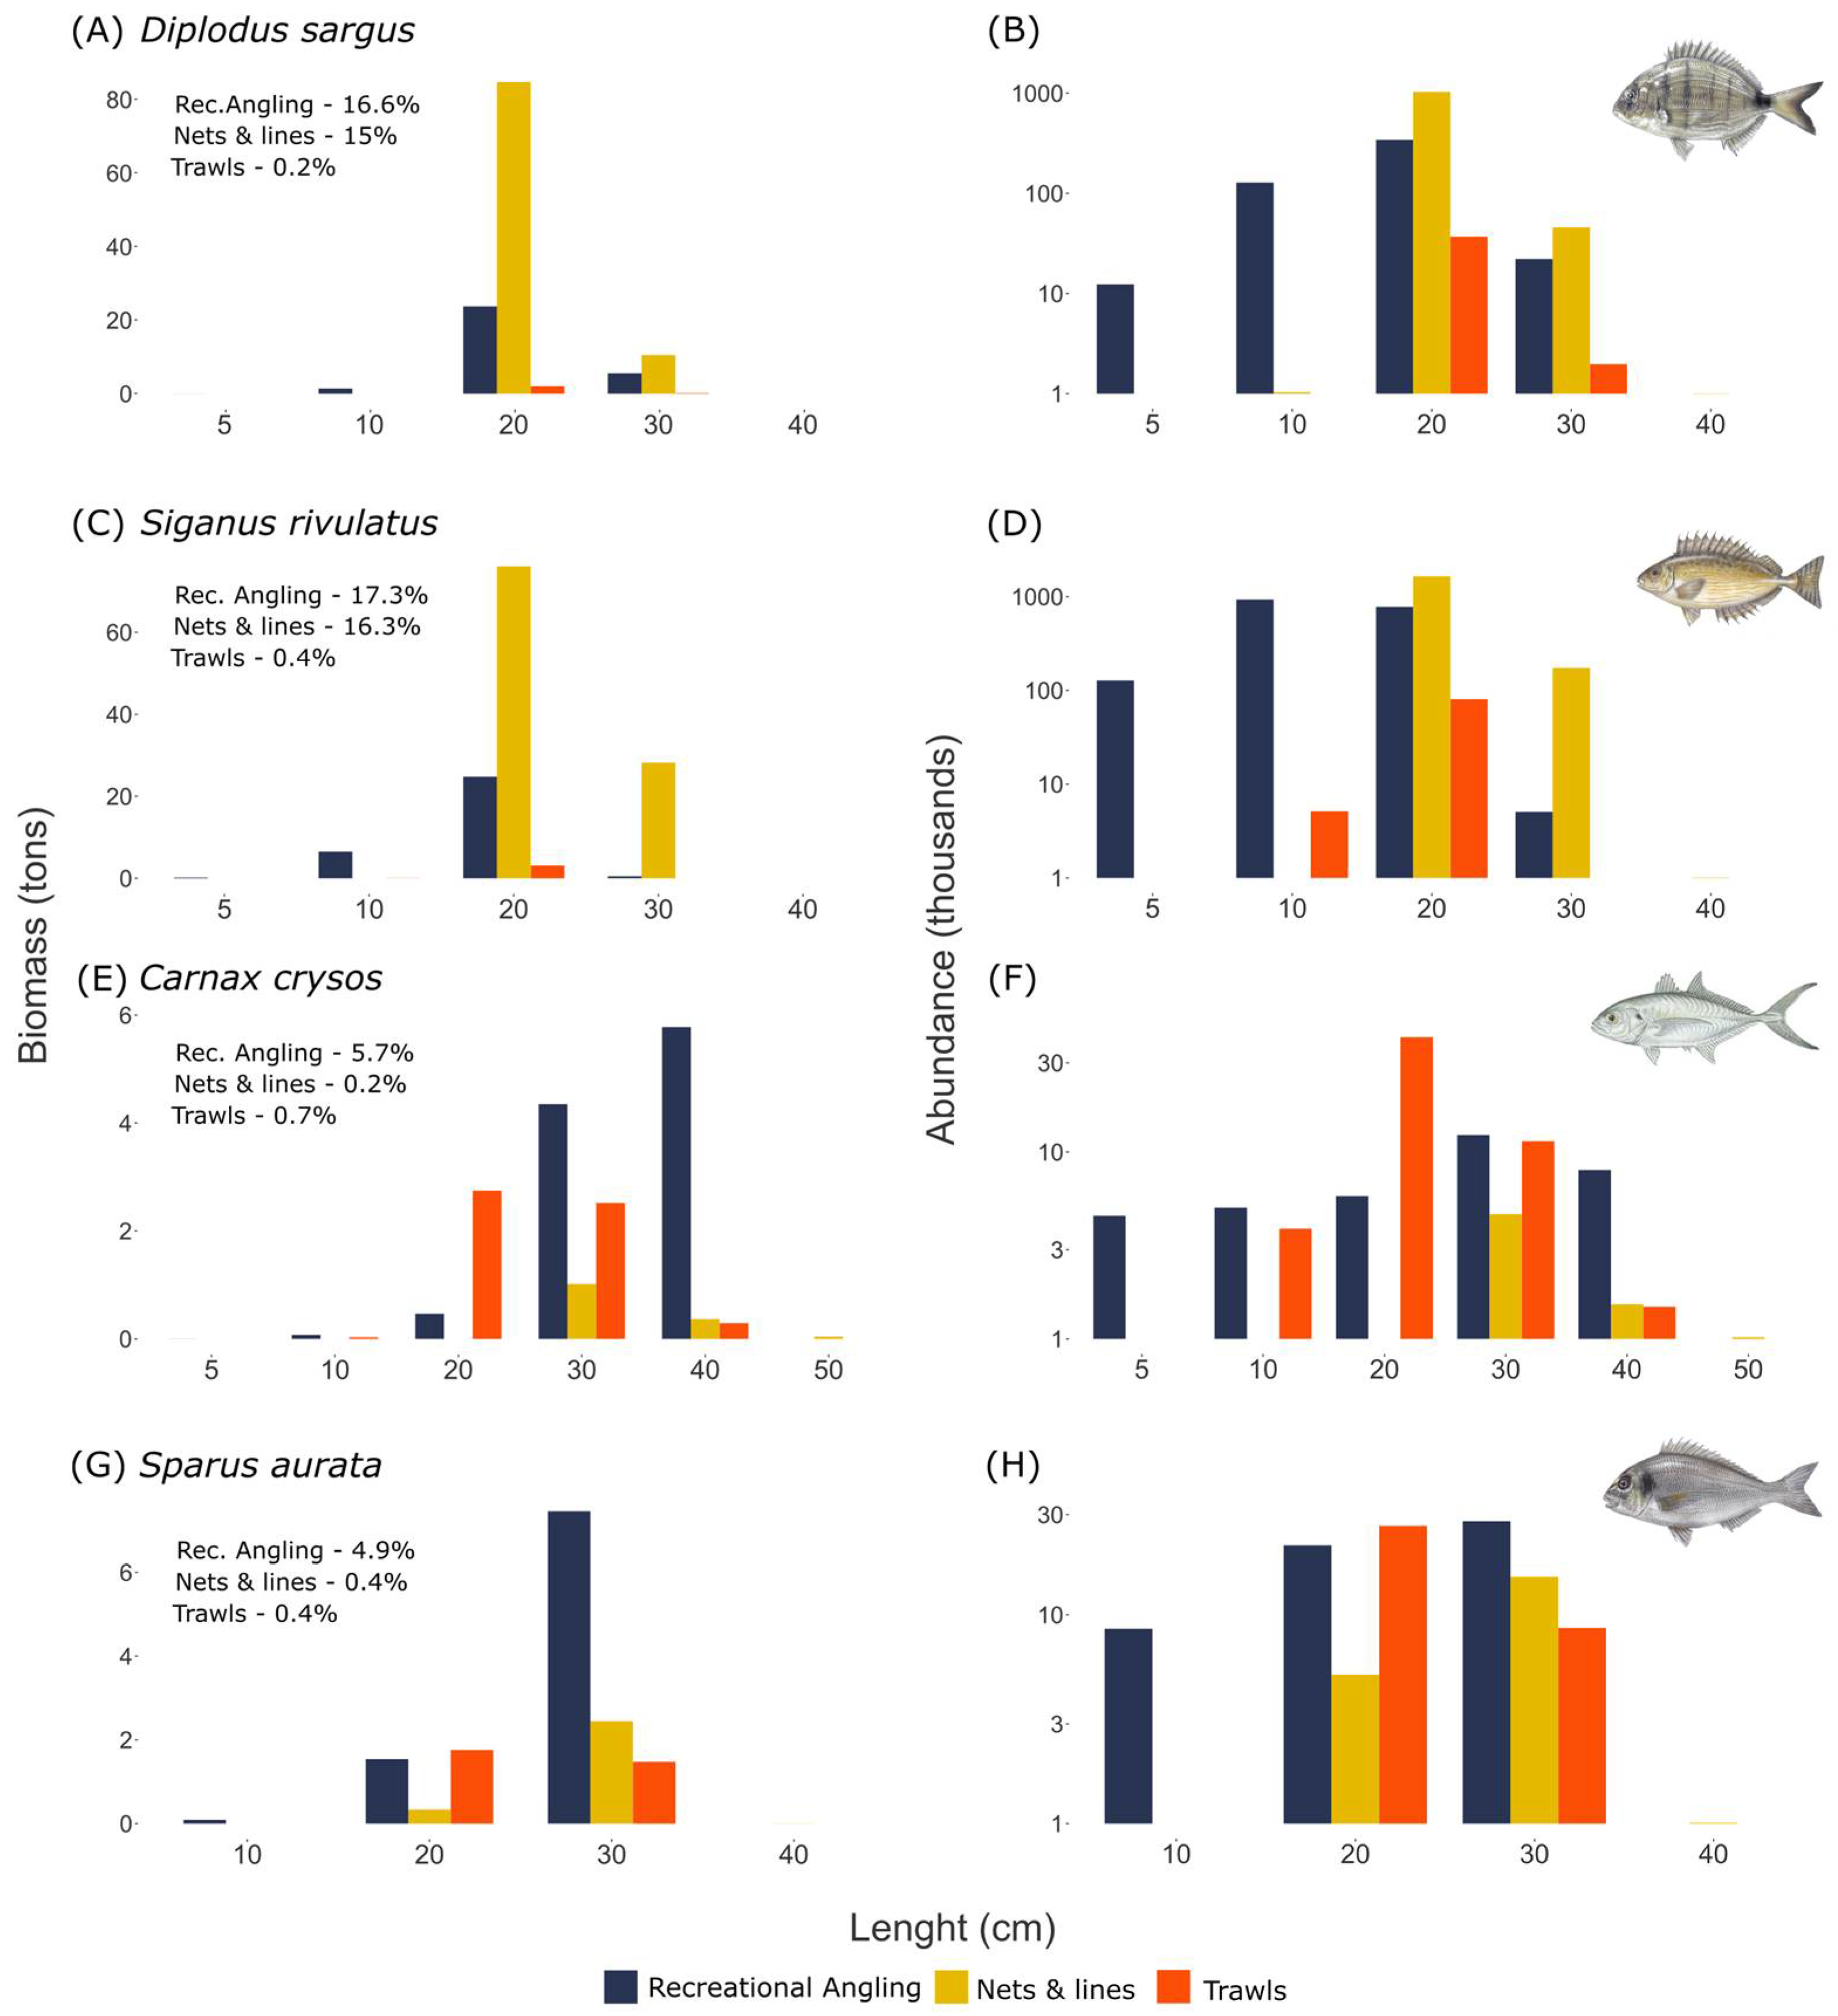
4.3. Comparing Recreational and Commercial Fishing

We find that species composition of recreational fishing at sea overlaps with set nets and long lines. However, recreational fishing at sea targets a wider size range with a focus on larger sizes compared to set nets and long lines. Thus, the total annual biomass of species such as Seriola dumerili and the non-indigenous Scomberomorus commerson, may be equal, or even exceed the catch of the commercial methods. In addition, the catch of large high-quality spawners from species such as Seriola dumerili and Mycteroperca rubra through recreational fishing at sea can also damage the overall stock of the species [48]. For example, the individuals 
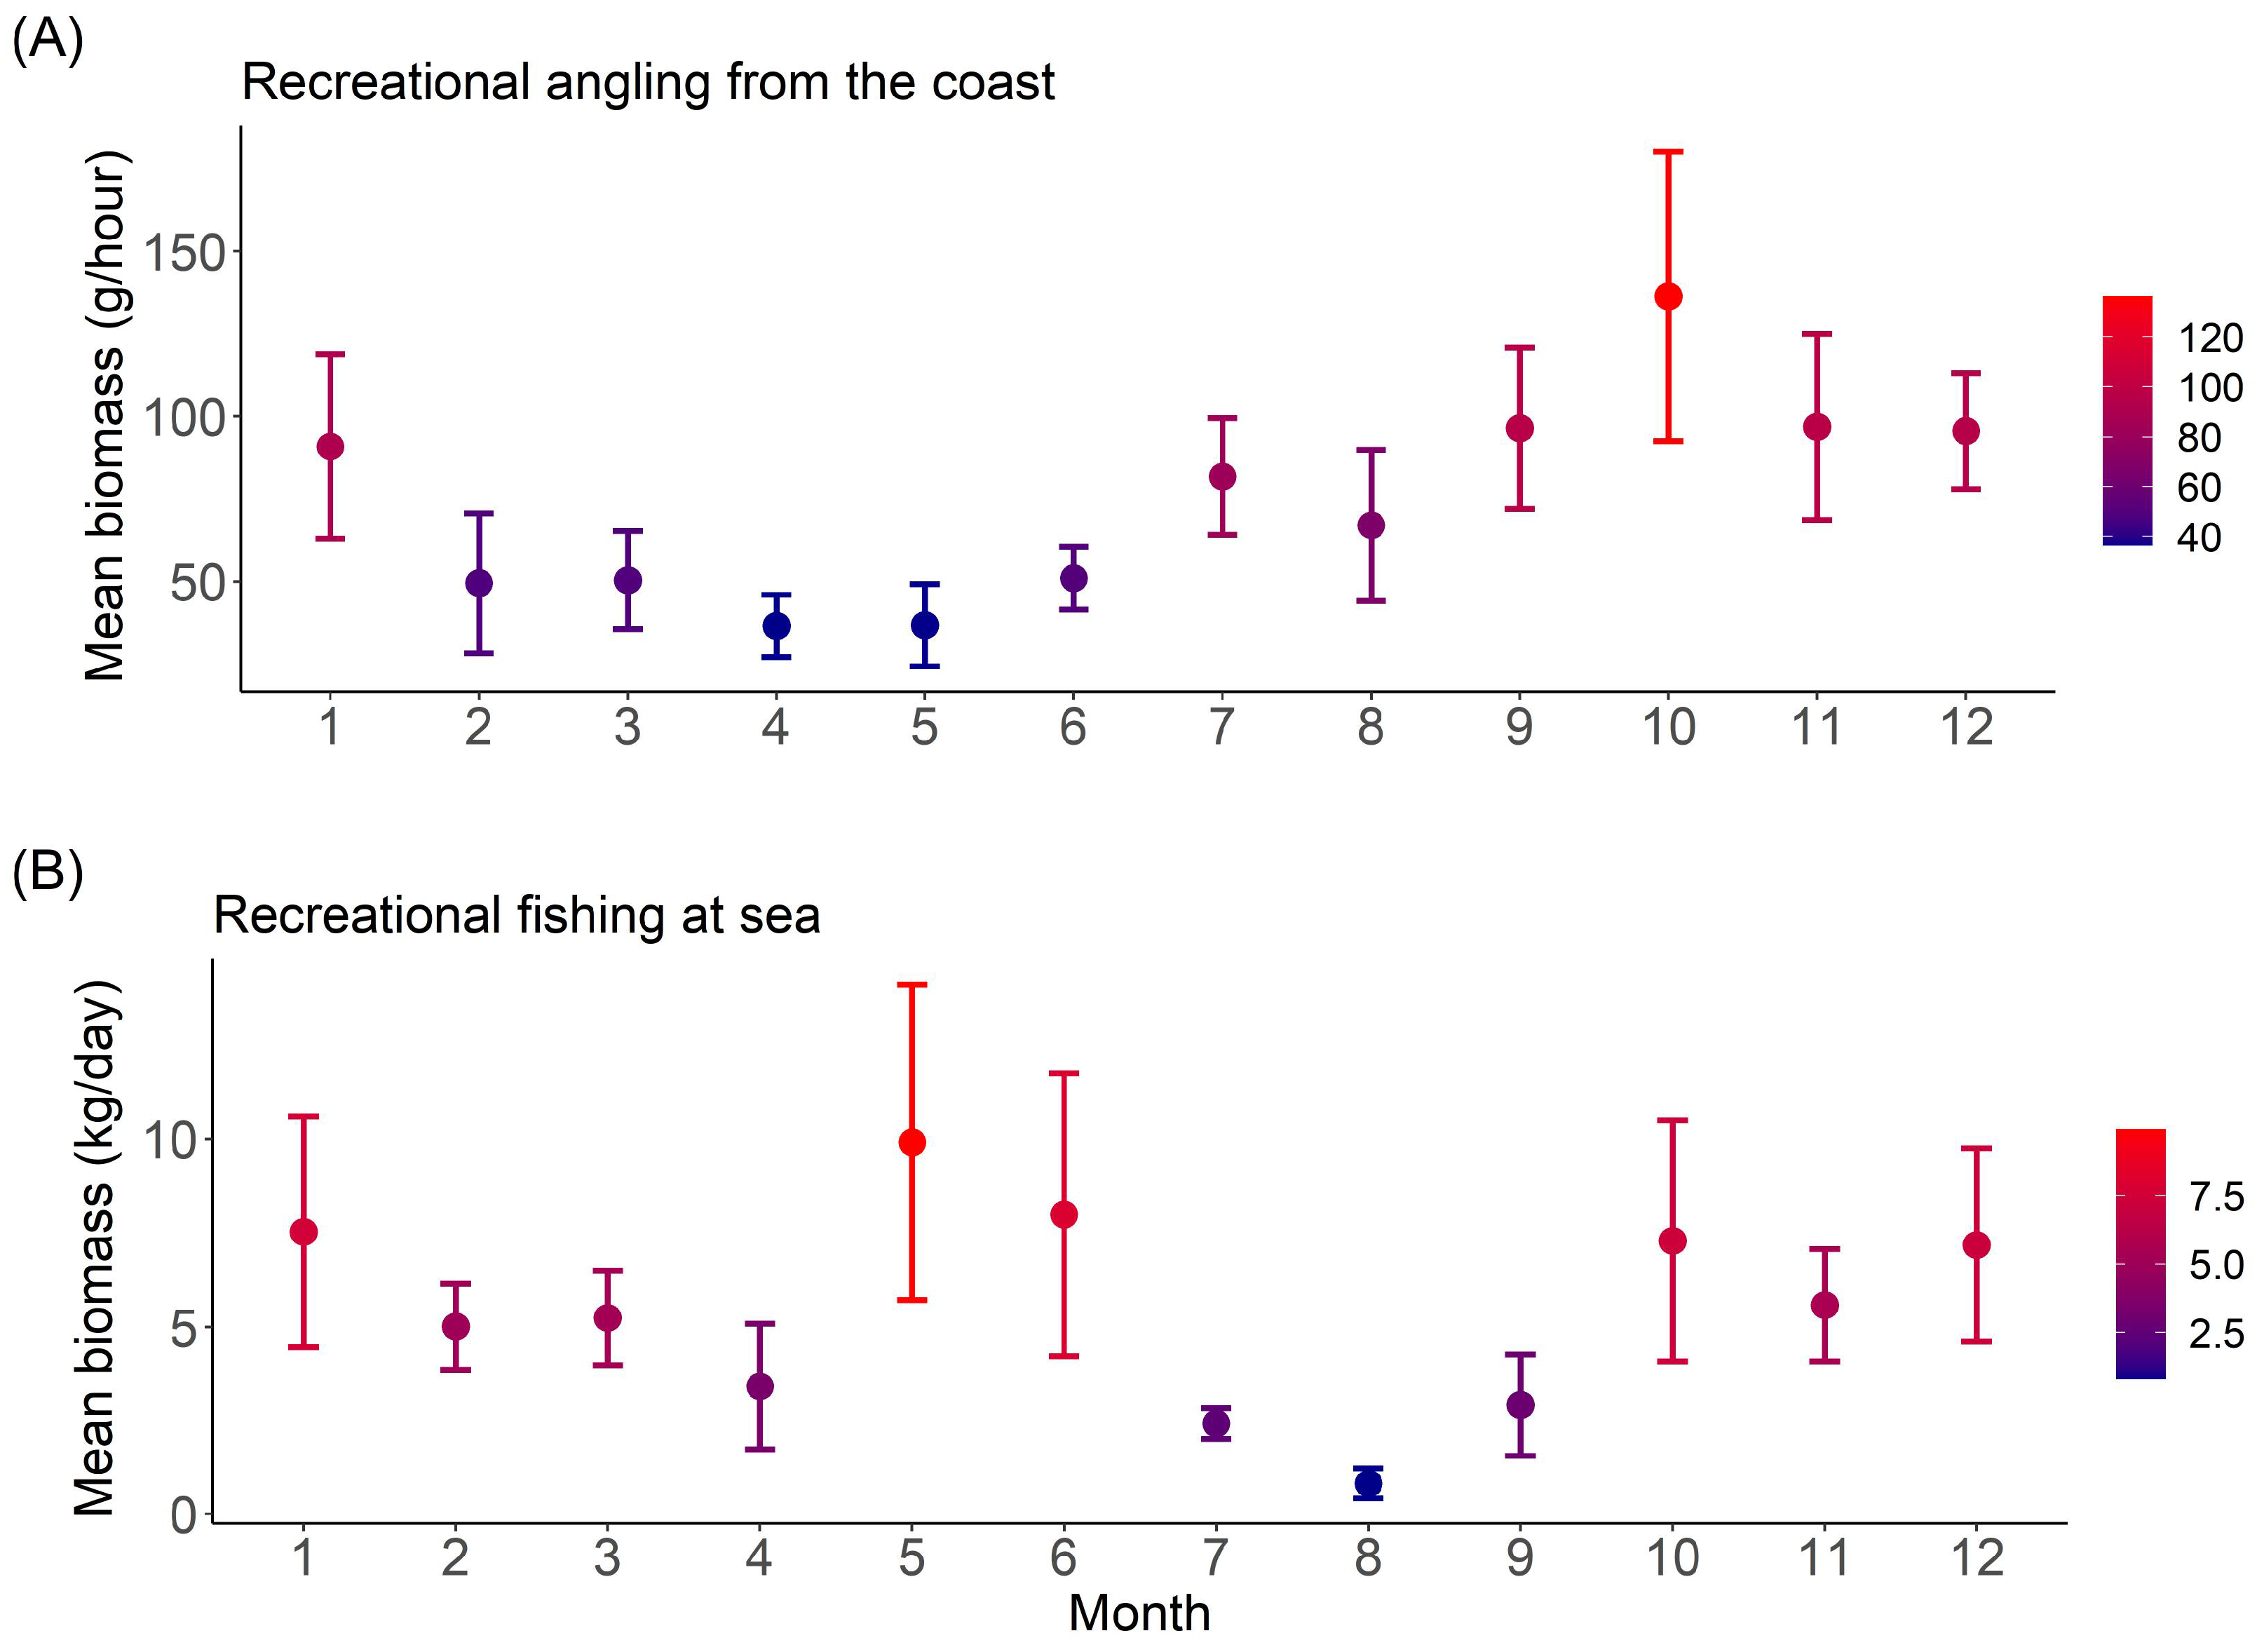
Seriola dumerili, that are larger than 100 cm (length at first maturity of this species is at 99.5 cm), represent 17% of all the individuals caught in recreational fishing at sea. However, individuals of the same size represent only 1% of all the individuals caught in the set nets and long line fishery. We also show that recreational fishing at sea and set nets and long lines have a common seasonal peak at the end of spring and the beginning of summer (May–June), that results in the catch of common seasonal species such as Seriola dumerili and Scomberomorus commerson. Similar seasonality increases the potential conflict between recreational fishing at sea, and set nets and long lines.
Trawl fishery has a low overlap in terms of species composition with both angling from the coast and recreational fishing at sea. However, for some species, such as Caranx crysos and Sparus aurata, that represent only a small fraction of the trawl catch (0.4% and 0.7%, respectively), the total biomass caught by recreation fishing and commercial trawling are comparable (annual catch of 11 tons in recreational angling and 5.6 tons in trawls for Cranx crysos, 9 tons in recreational angling compared to 3.2 tons in trawls for Sparus aurata). Additionally, the trawl industry targets many young individuals of species caught also by recreational fishing at sea, such as Scomberomorus commerson or Pagrus coeruleostictus. For example, we estimate that annually 38,600 individuals of the species Scomberomorus commerson are caught at sizes smaller than the size at first maturity (50 cm) by the trawl industry compared to only 260 individuals caught annually at the same size by the recreational fishing at sea.
Similar conflicts between fishing sectors were found in other Mediterranean countries [8,16,21,43,48]. Some of these conflicts stem from recreational fishing targeting high trophic level predators, leading to a large effect on the food web as a whole [15]. Besides the ecological aspect, this conflict between small-scale commercial fishing and recreational fishers manifests itself economically, as recreational fishers often illegally sell their catch. According to Ben Lamine et al. 2018, up to 47.91% of non-professional fishers admitted to selling their catch. Our study shows that in Israel, most potential ecological conflict is between recreational fishing at sea, and set nets and long lines. This overlap supports the necessity to include recreational data in stock assessments and ecosystem management of the coastal areas [21]. On the other hand, we find that angling from the coast, although it may extract substantial annual biomass, has low overlap with commercial fishing methods. Overall, this study illustrates the importance of estimating species-level catch for all fishing methods in order to evaluate and compare fishing impacts.

4.4. Caveats

The coastal surveys were effective for documenting angling activity from the shore. During the two years of surveys, we managed to cover a significant part of the Israeli coastline: 120 km out of the 145 km available for fishing. The amount of data collected enabled us to perform advanced statistical models to predict the annual catch with a high confidence. In contrast, tracking the catch of active recreational fishers at sea (i.e., angling from a boat or a kayak and spear fishing) is almost impossible from the coast, mainly due to these fishing techniques being sporadic and the fishers’ individualistic character. Thus, in this study, we combined several different methods to evaluate the number and catch of recreational fishers at sea: (1) aerial survey, (2) registered fishing licenses, and (3) phone surveys. Each one of the methods has assumptions and limitations.
To estimate catch composition, we used phone surveys. There are a few potential problems with this method of data collection. First, as opposed to the coastal surveys where the data was collected by surveyors in the field, phone surveys are exposed to a reporting bias where the fishers may not be accurately describing their catch in terms of species and biomass [8,10,17]. Additionally, we reached fishers via personal communications, meaning one fisher led to another. This strategy may result in a bias caused by interviewing a particular group of fishers with similar expertise, and may not necessarily be a representative of the catch by fishers with different experience and background. We also could not obtain data regarding illegal recreational fishing (professional recreational fishers who sell their catch), which may include a substantial part of this sector [43]. However, despite some potential bias, this method is commonly used in recreational fishing surveys [8,10,17].
Aerial survey is an expensive but useful method quantifying recreational activity [45]. When comparing the predictions made using the number of licensed fishers to the ones made by the aerial survey, we see that the estimated annual yields are considerably lower for the aerial surveys. Even though in Israel recreational fishing license and registration is mandatory, not all registered fishers are necessarily active, and evaluating the number of active fishers per day is a challenging task. The aerial surveys provide a real snapshot of the active fishers at the present time, and thus may more accurately describe the actual activity. However, fishing activities may occur during the entire day and even at night; thus, there may be a higher turnover rate than we estimated, which is hard to quantify.

4.5. Monitoring Fishing Activities in Israel

Our study provides information on recreational fisher habits, which can assist in monitoring and coastal spatial planning. For example, we found that anglers prefer to fish on artificial substrates in hot spots over marinas, fishing ports, and wave breakers where the number of fishers per survey was the highest. Fishers do not occur in high densities in MPAs, as, in many cases, it is more difficult to approach comfortable fishing locations.
Monitoring should be extended to include regularly collected long term data. This can reveal changes in catch composition and length distribution of the catch, and expose changes associated with climate change or environmental extremes. An update in the Israeli fishing regulations occurred in 2016, and since 2018 these regulations are more regularly enforced by the Israel Nature and Parks Authority (INPA). A team of 15 marine rangers are responsible for implementing fishing regulations, such as a 5 kg/two big fish bag limits, and seasonal restrictions. This may induce long term changes on the impacts of recreational fishers.
Additional monitoring could be based on ranger documentation of fishing activities at the open sea. As opposed to other studies on recreational fishing that are made from land, rangers are regularly present at the open sea. Thus, they can document recreational fisher activity patterns, and approach fishing boats and kayaks and document their catch. For recreational fishing to be managed correctly, a systematic sampling plan should be made for rangers to collect data for monitoring.

5. Conclusions

As opposed to commercial fishing, recreational fishing is a leisure activity and the increase in this activity demonstrates human longing to spend more time in nature. The number of recreational fishers and their annual catch highlights the importance of understanding the dynamics of this fishing sector, as well as its ecological influences and interactions with commercial fisheries. Here, we provide an estimation of the annual yields of recreational fishing in Israel. We calculate absolute values of specific species yearly catch to a high resolution of individual sizes, abundance, and biomass. This was directly compared to the catch of other fishing methods, and we point to 18 species that overlap with the commercial fishing industry, indicating a potential conflict between fishing sectors. These results illustrate the complex relationship between the different fishing methods on target species. While some species are mostly affected by one method, other species are highly exploited by all fishing methods, and in all stages of their life history (young as well as mature). These differences between the fishing methods could not be detected without including individual catch lengths, and thus illustrate the importance of documenting catch in detail. This study presents the most detailed description to date of recreational fishing in Israel, creating a baseline of this sector’s catch and species composition.

Supplementary Materials

The following supporting information can be downloaded at https://www.mdpi.com/article/10.3390/fishes8020069/s1, Table S1. Species identity and abundance as observed in the coastal surveys; Table S2. Species identity and biomass as observed in the coastal surveys; Table S3. Species identity and abundance and origin as documented in the trawl surveys; Table S4. Species identity, abundance, and origin as documented in the set nets surveys; Table S5. Summary of the GAM fitted for the number of fishers per km. The response variable was number of fishers/km and the predictors were the day of the week (weekend or weekday) and month, which were treated as fixed effects, and fishing site which was treated as a random effect; Table S6. Summary of the GAM fitted for the angling annual biomass. The response variable was biomass (kg) and the predictors were fishing duration (h), month, fisher experience (year), and fishing site that was treated as a random effect; Table S7. Fisher model–AIC model selection results; Table S8. Biomass model–AIC model selection results; Table S9. Species identity, abundance, and origin as documented in the phone surveys; Table S10. Species identity, biomass, and origin as documented in the phone surveys; Table S11. The common species among recreational and commercial methods; Table S12. Annual biomass estimates in tons for the species caught in recreational angling from the coast compared to the commercial set nets and long lines and the trawl industry. Only the species common for all methods are shown; Table S13. Annual abundance estimates for the species caught in recreational angling from the coast compared to the commercial set nets and long lines and the trawl industry Only the species common for all methods are shown; Table S14. Annual biomass estimates for the species caught in recreational fishing at sea compared to the commercial set nets and long lines and the trawl industry. Only the species common for all methods are shown; Figure S1. Number of fisher model: deviance vs. fitted values; Figure S2. Biomass model: deviance vs. fitted values; Figure S3. The mean number of fishers in a hotspot compared to a non-hotspot site. Error bars represent standard error; Figure S4. The mean number of fishers on a weekday and weekends. Error bars represent standard error; Table S15. Annual abundance estimates for the species caught in fishing at sea compared to the commercial set nets and long lines and the trawl industry. Only the species common to all methods are shown; Figure S5. Common species of recreational angling from the cost (blue), nets and long-lines (yellow), and trawl fishing (orange). Figures are divided to (A) biomass and (B) abundance for each individual species. Species were divided by length into size bins represented in the x axis. Length at first maturity (cm) of the species appears at the right upper corner of the figure (L.m). The bottom key shows the proportion each species represents from the total catch of the method (in %); Figure S6. Common species of recreational fishing at sea (blue), nets and long-lines (yellow), and trawl fishing (orange). Figures are divided to (A) biomass and (B) abundance for each individual species. Species were divided by length into size bins represented in the x axis. Length at first maturity (cm) of the species appears at the right upper corner of the figure (L.m). The bottom key shows the proportion each species represents from the total catch of the method (in %); Figure S7. Mean catch biomass per day across months for (A) trawling (B) set nets and long-lines (C) recreational angling from the coast (D) recreational fishing at sea. Error bars represent standard error. We find that the biomass in all fishing methods reaches high values in winter (December-February). The recreational methods (angling from the coast and fishing at sea) both peak in fall (October-November). Recreational fishing at sea peak in the end of spring beginning of summer (May–June) is compatible with a peak in the set nets fishery at the same time; File S1. Detailed protocols for the trawl and set nets and long-line surveys used for biomass estimates and species composition comparisons.

Author Contributions

Conceptualization, O.F. and Y.B.-A.; methodology, O.F., T.G. and J.B.; formal analysis, O.F., T.G. and J.B.; data curation, T.G., A.W. and H.Y.-S.; writing—original draft preparation, O.F. and J.B.; writing—review and editing, O.F., T.G. and J.B.; visualization, O.F. and T.G.; supervision, Y.B.-A. and J.B. All authors have read and agreed to the published version of the manuscript.

Funding

This research received no external funding.

Data Availability Statement

Please contact corresponding author.

Acknowledgments

We would like to thank the Israeli Nature and Parks Authority and the Department of Fisheries and Aquaculture, Israel Ministry of Agriculture and Rural Development, for funding this research. We would also like to thank all the surveyors who participated in the field survey: Mai Lazarus, Chen Rabi, Shira Salingre, Noy Shapira, Hila Galili, Eli Geler, Noa Faime, Tal Elmaliach, Hila Fishov, Renanel Pikholtz, Tamar Jina, Oshra Yosef, Israel Levi, and Poria Frid. Thank you to Mai Lazarus for the phone surveys, Ruth Yahel for scientific advice and Daphna Shapiro-Goldberg for editing; to Dor Edelist and Shahar Malamud for providing data for the commercial coastal and trawling fishing industry; to Tuvia Kurtz for bountiful fish illustrations and to all the fishers who were willing to participate.

Conflicts of Interest

The authors declare no conflict of interest.

References

  1. He, Q.; Silliman, B.R. Climate Change, Human Impacts, and Coastal Ecosystems in the Anthropocene. Curr. Biol. 2019, 29, R1021–R1035. [Google Scholar] [CrossRef] [PubMed]
  2. Steneck, R.S.; Pauly, D. Fishing through the Anthropocene. Curr. Biol. 2019, 29, 987–992. [Google Scholar] [CrossRef] [PubMed]
  3. Macusi, E.D.; Deepananda, A.K.; Conte, A.R.; Katikiro, R.E.; Fadli, N.; Jimenez, L.A. Human induced degradationa of coastal resources in asia pacific and implicationa on managment and food security. J. Nat. Stud. 2011, 9, 13–28. [Google Scholar]
  4. Cooke, S.J.; Cowx, I.A.N.G. The Role of Recreational Fishing in Global Fish Crises. Bioscience 2004, 54, 857–859. [Google Scholar] [CrossRef]
  5. Hyder, K.; Weltersbach, M.S.; Armstrong, M.; Ferter, K.; Townhill, B.; Ahvonen, A.; Arlinghaus, R.; Baikov, A.; Bellanger, M.; Birzaks, J.; et al. Recreational sea fishing in Europe in a global context—Participation rates, fishing effort, expenditure, and implications for monitoring and assessment. Fish Fish. 2017, 19, 225–243. [Google Scholar] [CrossRef]
  6. Lewin, W.-C.; Weltersbach, M.S.; Ferter, K.; Hyder, K.; Mugerza, E.; Prellezo, R.; Radford, Z.; Zarauz, L.; Strehlow, H.V. Potential Environmental Impacts of Recreational Fishing on Marine Fish Stocks and Ecosystems. Rev. Fish. Sci. Aquac. 2019, 27, 287–330. [Google Scholar] [CrossRef]
  7. Unal, V.; Acarli, D.; Gordoa, A. Characteristics of Marine Recreational Fishing in the anakkale Strait (Turkey). Mediterr. Mar. Sci. 2010, 11, 315–330. [Google Scholar] [CrossRef] [Green Version]
  8. Keramidas, I.; Dimarchopoulou, D.; Pardalou, A.; Tsikliras, A.C. Estimating recreational fishing fleet using satellite data in the Aegean and Ionian Seas (Mediterranean Sea). Fish. Res. 2018, 208, 1–6. [Google Scholar] [CrossRef]
  9. Rocklin, D.; Levrel, H.; Drogou, M.; Herfaut, J.; Veron, G. Combining Telephone Surveys and Fishing Catches Self- Report: The French Sea Bass Recreational Fishery Assessment. PLoS ONE 2014, 9, e87271. [Google Scholar] [CrossRef] [Green Version]
  10. Freire, K.M.F.; Belhabib, D.; Espedido, J.C.; Hood, L.; Kleisner, K.M.; Lam, V.W.L.; Machado, M.L.; Mendonça, J.T.; Meeuwig, J.J.; Moro, P.S.; et al. Estimating Global Catches of Marine Recreational Fisheries. Front. Mar. Sci. 2020, 7, 12. [Google Scholar] [CrossRef] [Green Version]
  11. Lewin, W.-C.; Arlinghaus, R.; Mehner, T. Documented and Potential Biological Impacts of Recreational Fishing: Insights for Management and Conservation. Rev. Fish. Sci. 2006, 14, 305–367. [Google Scholar] [CrossRef]
  12. Darmanin, S.A.; Vella, A. First central mediterranean scientific field study on recreational fishing targeting the ecosystem approach to sustainability. Front. Mar. Sci. 2019, 6, 390. [Google Scholar] [CrossRef]
  13. Cabanellas-Reboredo, M.; Palmer, M.; Alós, J.; Morales-Nin, B. Estimating harvest and its uncertainty in heterogeneous recreational fisheries. Fish. Res. 2017, 188, 100–111. [Google Scholar] [CrossRef]
  14. Morales-Nin, B.; Moranta, J.; García, C.; Tugores, M.P.; Grau, A.M.; Riera, F.; Cerdà, M. The recreational fishery off Majorca Island (western Mediterranean): Some implications for coastal resource management. ICES J. Mar. Sci. 2005, 62, 727–739. [Google Scholar] [CrossRef]
  15. Prato, G.; Barrier, C.; Francour, P.; Cappanera, V.; Markantonatou, V.; Guidetti, P.; Mangialajo, L.; Cattaneo-Vietti, R.; Gascuel, D. Assessing interacting impacts of artisanal and recreational fisheries in a small Marine Protected Area (Portofino, NW Mediterranean Sea). Ecosphere 2016, 7, e01601. [Google Scholar] [CrossRef]
  16. Giovos, I.; Keramidas, I.; Antoniou, C.; Deidun, A.; Font, T.; Kleitou, P.; Lloret, J.; Matić-Skoko, S.; Said, A.; Tiralongo, F.; et al. Identifying recreational fisheries in the Mediterranean Sea through social media. Fish. Manag. Ecol. 2018, 25, 287–295. [Google Scholar] [CrossRef]
  17. Radford, Z.; Hyder, K.; Zarauz, L.; Mugerza, E.; Ferter, K.; Prellezo, R.; Strehlow, H.V.; Townhill, B.; Lewin, W.-C.; Weltersbach, M.S. The impact of marine recreational fishing on key fish stocks in European waters. PLoS ONE 2018, 13, e0201666. [Google Scholar] [CrossRef] [Green Version]
  18. Gordoa, A.; Dedeu, A.L.; Boada, J. Recreational fishing in Spain: First national estimates of fisher population size, fishing activity and fisher social profile. Fish. Res. 2019, 211, 1–12. [Google Scholar] [CrossRef]
  19. Venturini, S.; Merotto, L.; Campodonico, P.; Cappanera, V.; Fanciulli, G.; Cattaneo-Vietti, R. Recreational fisheries within the Portofino MPA and surrounding areas (Ligurian Sea, Western Mediterranean Sea). Mediterr. Mar. Sci. 2019, 20, 506–520. [Google Scholar] [CrossRef] [Green Version]
  20. Lloret, J.; Font, T. A comparative analysis between recreational and artisanal fisheries in a Mediterranean coastal area. Fish. Manag. Ecol. 2013, 20, 148–160. [Google Scholar] [CrossRef]
  21. Moutopoulos, D.K.; Katselis, G.; Kios, K.; Tsotskou, A.; Tsikliras, A.C.; Stergiou, K.I. Estimation and reconstruction of shore-based recreational angling fisheries catches in the Greek Seas (1950–2010). J. Biol. Res. 2014, 20, 376–381. [Google Scholar]
  22. Font, T.; Lloret, J. Biological and Ecological Impacts Derived from Recreational Fishing in Mediterranean Coastal Areas Biological and Ecological Impacts Derived from Recreational Fishing. Rev. Fish. Sci. Aquac. 2014, 22, 73–85. [Google Scholar] [CrossRef]
  23. Diogo, H.; Veiga, P.; Pita, C.; Sousa, A.; Lima, D.; Gil Pereira, J.; Gonçalves, J.M.S.; Erzini, K.; Rangel, M. Reviews in Fisheries Science & Aquaculture Marine Recreational Fishing in Portugal: Current Knowledge, Challenges, and Future Perspectives. Rev. Fish. Sci. Aquac. 2020, 28, 536–560. [Google Scholar] [CrossRef]
  24. Sbragaglia, V.; A Correia, R.; Coco, S.; Arlinghaus, R. Data mining on YouTube reveals fisher group-specific harvesting patterns and social engagement in recreational anglers and spearfishers. ICES J. Mar. Sci. 2020, 77, 2234–2244. [Google Scholar] [CrossRef]
  25. Coll, J.; Linde, M.; García-Rubies, A.; Riera, F.; Grau, A.M. Spear fishing in the Balearic Islands (west central Mediterranean): Species affected and catch evolution during the period 1975–2001. Fish. Res. 2004, 70, 97–111. [Google Scholar] [CrossRef] [Green Version]
  26. Rilov, G.; Peleg, O.; Yeruham, E.; Garval, T.V.; Vichik, A.; Raveh, O. Alien turf: Overfishing, overgrazing and invader domination in south-eastern Levant reef ecosystems. Aquat. Conserv. 2018, 28, 351–369. [Google Scholar] [CrossRef]
  27. Ozer, T.; Gertman, I.; Kress, N.; Silverman, J.; Herut, B. Interannual thermohaline (1979–2014) and nutrient (2002–2014) dynamics in the Levantine surface and intermediate water masses, SE Mediterranean Sea. Glob. Planet. Chang. 2017, 151, 60–67. [Google Scholar] [CrossRef]
  28. Galil, B.S.; Mienis, H.K.; Hoffman, R.; Goren, M. Non-indigenous species along the Israeli Mediterranean coast: Tally, policy, outlook. Hydrobiologia 2021, 848, 2011–2029. [Google Scholar] [CrossRef]
  29. Givan, O.; Parravicini, V.; Kulbicki, M.; Belmaker, J. Trait structure reveals the processes underlying fish establishment in the Mediterranean. Glob. Ecol. Biogeogr. 2017, 26, 142–153. [Google Scholar] [CrossRef]
  30. van Rijn, I.; Kiflawi, M.; Belmaker, J. Alien species stabilize local fisheries catch in a highly invaded ecosystem. Can. J. Fish. Aquat. Sci. 2019, 77, 752–761. [Google Scholar] [CrossRef] [Green Version]
  31. Goren, M.; Shultz, D.; Gafni, A. Catch and management of the fishery industry in Israel. In Proceedings of the Society for the Protection of Nature in Israel, Tel Aviv, Israel, 14–21 November 2013. [Google Scholar]
  32. Froese, R.; Pauly, D. FishBase. World Wide Web Electronic Publication. 2023. Available online: https://www.fishbase.se/search.php (accessed on 17 January 2023).
  33. Edelist, D. Bottom trawl monitoring surveys conducted along the coast of Israel in 2017–2020. In Israel Ministry of Agriculture and Rural Development Report; MOAG: Beit Dagan, Israel, 2021. [Google Scholar]
  34. Malamud, S.; Belmaker, J. Coastal fishing Survey along the Israeli coast. In Israel Ministry of Agriculture and Rural Development Report; MOAG: Beit Dagan, Israel, 2016. [Google Scholar]
  35. Frid, O.; Belmaker, J. Catch dynamics of set net fisheries in Israel. Fish. Res. 2019, 213, 1–11. [Google Scholar] [CrossRef]
  36. Wood, S.N. Generalized Additive Models: An Introduction with R; Chapman and Hall/CRC: New York, NY, USA, 2016; pp. 1–496. [Google Scholar]
  37. Hastie, T.J. Statistical Models in S, 1st ed.; Chapman & Hall: London, UK, 1992. [Google Scholar]
  38. Candy, S.G. Modelling catch and effort data using generalized linear models, the tweedie distribution, random vessel effects and random stratum-by-year effect. CCAMLR Sci. 2004, 11, 59–80. [Google Scholar]
  39. Shono, H. Application of the Tweedie distribution to zero-catch data in CPUE analysis. Fish. Res. 2008, 93, 154–162. [Google Scholar] [CrossRef]
  40. Kurz, C.F. Tweedie distributions for fitting semicontinuous health care utilization cost data. BMC Med. Res. Methodol. 2017, 17, 171. [Google Scholar] [CrossRef] [Green Version]
  41. Michailidis, N.; Katsanevakis, S.; Chartosia, N. Recreational fisheries can be of the same magnitude as commercial fisheries: The case of Cyprus. Fish. Res. 2020, 231, 105711. [Google Scholar] [CrossRef]
  42. ben Lamine, E.; di Franco, A.; Romdhane, M.S.; Francour, P. Comparing commercial, recreational and illegal coastal fishery catches and their economic values: A survey from the southern Mediterranean Sea. Fish. Manag. Ecol. 2018, 25, 456–463. [Google Scholar] [CrossRef]
  43. Khalfallah, M.; Dimech, M.; Ulman, A.; Zeller, D.; Pauly, D. Reconstruction of Marine Fisheries Catches for the Republic of Malta (1950–2010). Mediterr. Mar. Sci. 2017, 18, 241–250. [Google Scholar] [CrossRef] [Green Version]
  44. Veiga, P.; Ribeiro, J.; Gonçalves, J.M.S.; Erzini, K. Quantifying recreational shore angling catch and harvest in southern Portugal (north-east Atlantic Ocean): Implications for conservation and integrated fisheries management. J. Fish Biol. 2010, 76, 2216–2237. [Google Scholar] [CrossRef]
  45. Fay, G. Integrating recreational fi sheries data into stock assessment: Implications for model performance and subsequent harvest strategies. Fish. Manag. Ecol. 2015, 22, 197–212. [Google Scholar] [CrossRef]
  46. Kalogirou, S. Ecological characteristics of the invasive pufferfish Lagocephalus sceleratus (Gmelin, 1789) in the eastern Mediterranean Sea—A case study from Rhodes. Mediterr. Mar. Sci. 2013, 14, 251–260. [Google Scholar] [CrossRef] [Green Version]
  47. Berkeley, S.A.; Hixon, M.A.; Larson, R.J.; Love, M.S. Fishereis sustainability via protection of age structure and spacial distrebution of fish populations. Fisheries 2004, 29, 23–32. [Google Scholar] [CrossRef]
  48. Silvestri, R.; Colella, S.; de Renieri, S.; Mannini, P. Italian marine recreational fishery: State of the art and interactions with artisanal fishery. Biol. Mar. Mediterr. 2016, 23, 30–36. [Google Scholar]
Figure 1. Sampling maps. (A) Coastal survey sampling map and (B) recreational fishing-at-sea locations reported by the phone surveys.
Fishes 08 00069 g001
Figure 2. Predicted mean catch biomass (g/hour) for recreational angling from shore (A), and recreational angling fishing at sea kg/day (B) at each month. When angling from the coast, biomass peaks in the fall (October) and reaches minimum values in spring (April). However, for recreational fishing at sea, biomass peaks in spring and the beginning of summer (May and June), and reaches minimum values in the summer (July–August). Error bars represent standard error.
Fishes 08 00069 g002
Figure 3. Venn diagram of the number of species caught in the different fishing methods, and the species common to different methods.
Fishes 08 00069 g003
Figure 4. (AH) Common species caught by recreational angling from shore (blue), nets and long-lines (yellow), and trawl fishing (orange). Figures are divided into biomass and abundance for each species. Species were divided by length into size bins, as shown on the x axes. The bottom key shows the proportion each species represents from the total catch of the method (in %). For all species results see Figure S5 and Tables S12 and S13.
Fishes 08 00069 g004
Figure 5. (AH) Common species of the recreational fishing at sea (light blue), nets and long-lines (yellow), and trawl fishing (orange). Figures are divided into biomass and abundance for each species. Species were divided by length into size bins as shown on the x axes. The proportion each species represents from the total catch of the method (in %). For all species results see Figure S6 and Tables S14 and S15.
Fishes 08 00069 g005
Table 1. Annual biomass (in tons) extracted by recreational anglers from the coast, along the Israeli shoreline.
Available Fishing Days a MonthTotal Annual Biomass (tons)
78%360
70%343
85%393
Table 2. Estimated annual total and kept biomass (tons) for recreational fishing at sea using. Estimates are based on the number of registered fishers.
Fishing MethodAnnual Biomass (75% Active License)Annual Biomass (82% Active License)Annual Biomass (90% Active License)
Angling from a boat or kayak448490538
Spear123134147
Total biomass (tons)Total571624712
Angling from a boat or kayak 311340374
Spear 121133146
Kept biomass (tons)Total kept432473520
Table 3. Estimated annual biomass (tons) for recreation fishing at sea. Estimates are based on different estimations of the number of available fishing days for each fishing method.
Fishing MethodAvailable Days (%)Annual Biomass
(tons)
Annual Kept Biomass
(tons)
Spear402626
Kayak50197
Boat507663
Total 12196
Spear705049
Kayak763112
Boat7611495
Total 195156
Spear301919
Kayak30114
Boat406151
Total 9174
Disclaimer/Publisher’s Note: The statements, opinions and data contained in all publications are solely those of the individual author(s) and contributor(s) and not of MDPI and/or the editor(s). MDPI and/or the editor(s) disclaim responsibility for any injury to people or property resulting from any ideas, methods, instructions or products referred to in the content.

