Article

Effects of Multiple Freeze-Thaw Cycles on Protein and Lipid Oxidation, Microstructure and Quality Characteristics of Rainbow Trout (Oncorhynchus mykiss)

1
Heilongjiang River Fisheries Research Institute, Chinese Academy of Fishery Sciences, Harbin 150070, China
2
Supervision, Inspection and Testing Center for Fishery Environment and Aquatic Products (Harbin), Ministry of Agriculture and Rural Affairs, Harbin 150070, China
3
Laboratory of Quality and Safety Risk Assessment for Aquatic Products (Harbin), Ministry of Agriculture and Rural Affairs, Harbin 150070, China
4
Key Laboratory of Control of Quality and Safety for Aquatic Products, Ministry of Agriculture and Rural Affairs, Beijing 100041, China
*
Authors to whom correspondence should be addressed.
Fishes 2023, 8(2), 108; https://doi.org/10.3390/fishes8020108
Submission received: 9 January 2023 / Revised: 8 February 2023 / Accepted: 10 February 2023 / Published: 13 February 2023
(This article belongs to the Section Physiology and Biochemistry)

Abstract

:
Multiple freeze-thaw cycles due to temperature fluctuations irreversibly damage the muscle tissue of fish, thereby reducing their edibility. The aim of this study was to determine the effects of the number of freeze-thaw (F–T) cycles on protein and lipid oxidation, microstructure, physical index, and nutritional quality of rainbow trout muscle. The results showed that F–T cycles accelerated protein carbonyl formation and thiobarbituric acid reactive substances (TBARS) generation (p < 0.05), as well as increased the loss of total sulfhydryl (SH) groups (p < 0.05). Moreover, transmission electron microscope (TEM) images illustrated that the microstructure of muscle fibers was loosed and disintegrated after the third F–T cycle, causing a reduction in water holding capacity (WHC). In addition, muscles lost the intrinsic color of fresh meat after the fifth cycle, with lightness L* and yellowness b* increasing, while redness a* declined (p < 0.05). The hardness, springiness, and chewiness of muscles decreased, and the shear force first increased and then decreased after the third cycle. Furthermore, the proximate components, essential amino acids (EAAs), and total amino acids (TAAs), decreased significantly after the third cycle (p < 0.05) due to the decrease of WHC as well as protein and lipid oxidation. The results indicated that the quality of rainbow trout muscle changed after the third cycle, deteriorated seriously after the fifth cycle, and was unacceptable after the seventh cycle. Therefore, it is necessary to reduce the temperature fluctuation to less than three times during freezing. The results provided a reference for the identification and classification of frozen aquatic products.

1. Introduction

The rainbow trout (Oncorhynchus mykiss), which is native to the coast of the Pacific Ocean in North America, is a typical cold-water fish species [1]. The muscles of rainbow trout are characterized by high protein content and low carbohydrate content, which are beneficial to human health along with high nutritional and economic values [2]. Meanwhile, rainbow trout is difficult to survive in long-term transportation due to high oxygen consumption [3,4]. Therefore, it is sold across the country in the form of processed fish blocks [5], which are kept at a low temperature in order to guarantee their edible quality and nutrition value.
Frozen storage is a convenient and effective preservation method that can decelerate the deterioration of meat quality and regulate the supply of meat products to reduce food waste [6]. According to the Codex International Food Standards and the International Refrigeration Association, frozen foods should be stored at −18 °C or lower [7]. However, the freeze-thaw phenomenon is inevitable in practical production due to temperature fluctuations in storage, consumption, or repeated turnover [8,9,10], and the accretion of ice crystals causes the physicochemical changes that reduce the quality of meat products.
Biochemical reactions and microbial growth are determined by the degree of water availability in the food, which is usually expressed as water activity (aw) [11]. It is defined as the ratio of the equilibrium vapor pressure of the sample to the equilibrium vapor pressure of pure solution under identical conditions [12]. In frozen foods, most biochemical reactions are suppressed due to the lower activity of water [13]. However, lipids are unstable chemical food components that readily participate in oxidative reactions even at aw less than 0.1 [13,14]. Temperature fluctuations can affect the oxidation process in meat systems, and excessive lipid oxidation can decrease edibility and produce an unpleasant odor [15,16]. Protein oxidation is most likely accelerated by lipid oxidation due to F–T cycles, which are the main factors causing meat quality deterioration besides microorganisms [17]. The discovery that muscle proteins were susceptible to oxidative reactions was just put forward in the late 1990s [18]. Recently, many studies have focused on it, but the mechanisms of freezing-induced protein oxidation are not well understood. Resarch showed that repeated F–T cycles tended to accelerate the ice recrystallization process, cause serious mechanical injuries, and give rise to the oxidation of proteins and lipids [19,20]. Hu et al. (2021) [21] used Raman spectra analysis as an index and showed that the secondary structure of myofibrillar protein in Trachurus murphyi muscle was changed by F–T treatments. Meanwhile, degradation of myofibrillar protein made fillets soften and reduced WHC [22]. Integrity of muscle tissue structure is essential for maintaining the fine quality of frozen meat; ice crystals are formed during the freezing, causing major pressure on cellular substances in the unfrozen fraction, which may affect the microstructural recovery after thawing [23]. Contrarily, some research considers that ice crystals do not ineluctably determine the quality of frozen meat because the tissue of the meat can reabsorb water during the thawing process, unless it has been damaged by protein-modified denaturation [7]. Cao et al. (2022) [24] and Li et al. (2023) [25] indicated that F–T cycles caused muscle structure disruption, accelerated protein and lipid oxidation, and WHC reduction.
At present, some researchers have evaluated the changes in physiochemistry and microstructure caused by temperature fluctuations, but their evaluations are not wide enough, in particular the absence of changes in nutrients. Meanwhile, studies on the storage quality of rainbow trout are few and insufficient, which results in a lack of theoretical basis for guiding frozen product identification. In this experiment, the microstructural changes were determined by TEM, the oxidation of proteins and lipids was assessed, as were the physical parameters (pH, thawing loss, cooking loss, color, texture, and shear force) and nutritional quality of rainbow trout muscle. The aim of our research is to comprehensively evaluate the deterioration of fish quality during the F–T cycles, establish thresholds, and provide references for quality identification and grading of frozen aquatic products.

2. Materials and Methods

2.1. Sample Preparation

Thirty freshly caught rainbow trout (O. mykiss) samples (average weight = 0.81 ± 0.012 kg) were transported from Bohai station (Mudanjiang, Heilongjiang, China) to the laboratory and euthanized with ice water before experiment. The fish samples were beheaded, eviscerated, and de-skinned, then cut evenly into two sections along the fish spine. The 60 fish fillets were rinsed, drained, and trimmed to the same shape as the frozen fish fillets sold in supermarkets. Samples were vacuum-packed separately, marked 1 to 60. The F–T samples were stored at −20 °C for 48 h and then thawed at 4 °C for 12 h in order to imitate the repeated F–T cycles during the commercial sale process; the whole sequence stands for one F–T cycle. Subsequently, the thawed samples were treated with F–T cycles until a total of 9 F–T cycles were finished. Each F–T treatment randomly selected 6 samples for testing.

2.2. Color Texture and Shear Force Analysis

The color of samples was determined using the automatic color difference meter (WSC-S, Shanghai Physical Optics Co., Ltd., Shanghai, China), which was expressed as L* (lightness), a* (redness/greenness), and b* (blueness/yellowness).
The samples were cut into 2 × 3 × 1 cm pieces in the direction of the muscle fiber, then analyzed according to the research method described by Xu et al. (2019) [26] with slight modifications. The quality indicators (hardness, springiness, and chewiness) were measured by the texture analyzer (TMS-PRO, FTC, Sterling, VA, USA). The main measurement parameters were as follows: pre-measurement speed, 2.0 mm/s; measurement speed, 1.0 mm/s; post-measurement speed, 2.0 mm/s; degree of compression, 30%; interval between the two probe measurements, 5.0 s; trigger force, 0.10N; probe type, TMS-75mm cylindrical Perspex probe (75 mm diameter). All indicators were measured 6 times on different fish specimens, then the results were averaged.
Cutlets (2 × 1 × 1 cm) were taken from the upper dorsal part of rainbow trout, with their shear force (N) determined using the TMS-PRO texture analyzer. The main parameters measured were as follows: probe type: TMS Light Weight Blade Set; maximum force sensing range, 250 N; return stroke, 35 mm; testing speed, 30 mm/min. Six individual fish specimens were measured, and the average value was obtained.

2.3. pH and WHC (Thawing Loss, Cooking Loss) Analysis

The minced fish meat (1g) was homogenized with distilled water (10 mL). The pH values were measured using pH meter (pHs-3C, Shanghai Leici Instrument Factory, Shanghai, China).
The masses m1 and m2 of rainbow trout were accurately weighed, corresponding to before and after thawing, respectively. Measurements were taken in triplicate, and thawing loss was measured by the following equation:
Thawing   loss   ( % ) = m 1 m 2 m 1   ×   100
The samples were sliced into 2.0 × 3.0 × 1.5 cm pieces and then placed in moisture-impermeable polyethylene bags (0.2 mm) individually. Fish meats were cooked in water bath at 80 °C for 15 min. The masses m3 and m4 of rainbow trout were weighed accurately, corresponding to the before and after cooking, respectively. Measurements were taken in triplicate. The cooking loss was measured by the following equation:
Cooking   loss   ( % ) = m 3 m 4 m 3   ×   100  

2.4. Lipid Oxidation

Lipid oxidation was evaluated by thiobarbituric acid-reactive substances (TBARS) according to the method of Jiang et al. (2019) [27]. The mixture of 5 g chopped block sample and 20mL 7.5% trichloroacetic acid solution with 0.1% ethylene diamine tetraacetic acid (EDTA) was homogenized, then filtered using filter paper. The filtrate was mixed with 0.02 mol/L 2-thiobarbituric acid (1:1, v/v) in glass test tubes, then placed in boiling water for 40 min. The tubes were cooled down using running tap water. The absorbance of the TBA value was measured at 532 nm by spectrophotometer (U4100, Hitachi, Tokyo, Japan). TBARS were calculated using a standard curve for malondialdehyde (MDA), and 1,1,3,3-tetraethoxy-propane (TEP) was used as standard compound. The amounts of TBARS were expressed as mg MDA/kg sample.

2.5. Preparation of Myofibrillar Protein (MP)

The extraction of MP was determined as described by Zhang et al. (2016) [28], with some modifications. A certain quantity of minced muscle was homogenized with chilled buffer (1:10, w/v) containing 0.05 M KCl and 20 mM Tris-maleate (pH 7.0) using a homogenizer (Ultra Turrax T25, IKA, Staufen, Germany). Afterwards, the homogenate was centrifuged at 8512 g at 4 °C for 15 min by a centrifuge (Allegra X-30R, Beckman Coulter, Brea, CA, USA). The precipitate was washed twice in accordance with the above method. The precipitate was rinsed with a buffer containing 0.6 M KCl and 20 mM Tris-maleate (pH 7.0) through 2 min homogenization. The homogenate was extracted at 4 °C for 60 min and then centrifuged at 8512 g at 4 °C for 20 min. The protein concentration was measured by the Biuret method.

2.6. Determination of Carbonyl Content

Carbonyl content was determined by the 2,4-dinitrophenylhydrazine (DNPH) method according to Soyer et al. (2010) [29]. Briefly, 1 mL of diluted MP solution (2 mg/mL) was mixed with 1 mL 10 mM DNPH solution (in 2 M HCl) for 1 h at room temperature and light-free. Afterwards, the mixture was precipitated with 2 mL 20% trichloroacetic acid (TCA) and centrifuged at 8512 g at 4 °C for 15 min. The pellet was washed three times with 1 mL ethanol/ethyl acetate solution (1:1 v/v). The mixture was centrifuged under the same conditions as above. Subsequently, the precipitate was dissolved in 3 mL 6 M guanidine (in 2 M HCl) and statically reacted at 37 °C for 15 min, then centrifuged at 8512 g for 3 min to obtain the supernatant for determination. The absorbance was measured at 370 nm, and the carbonyl content was expressed as nmol/mg protein and calculated by the following equation:
Carbonyl   content   ( nmol   DNPH / mg   pro ) = A 1 × V 1 ε × C 1
where A1 is the measured absorbance, V1 is the dilution volume, C1 is the concentration of muscle fiber, and ε is the molar extinction coefficient.

2.7. Determination of Total Sulfhydryl (SH) Content

According to the method of Benjakul et al. (1997) [30], with some modifications, the total SH content was determined using 5,5′-dithiobis (2-nitrobenzoic acid) (DTNB). Briefly, 1 mL of MP solution (4 mg/mL) was mixed with 9 mL of 0.2 M Tris-HCl buffer (pH 6.8), including 2% SDS, 8 M urea, and 10 mM EDTA. Then, 4mL of the mixture was mixed equally with 0.5mL 0.1% DTNB-Tris-HCl buffer and reacted under stationary conditions at 40 °C for 25 min. The absorbance was measured at 412 nm with a spectrophotometer. 0.6 M KCl replaced the sample as a blank. SH concent was expressed as mol/105 g protein, calculated by the following equation:
  SH   concent   ( mol / 10 5 g ) = A 2 × V 2 C 2   × ω
where A2 is the measured absorbance, C2 is the concentration of muscle fiber, ω is the molar extinction coefficient, and V2 is the dilution volume.

2.8. Muscle Fiber Microstructure

The blocks (size: 1 × 1 × 1 mm) were fixed with 2.5% glutaraldehyde solution for 24 h, then rinsed with 0.1 M phosphate buffer solution (PBS, pH 7.2), then post-fixed in the 1% OsO4. After fixing, the fish specimens were rinsed with PBS (0.1 M, pH 7.2), dehydrated with gradient ethanol, and then embedded in epoxy resin. These thin sections were dyed with uranyl acetate as well as lead citrate and then observed by transmission electron microscope (H-7650, Hitachi, Tokyo, Japan) according to the method of Qi et al. (2012) [31] with some modifications. Photomicrographs were made at magnification ×25,000.

2.9. Approximate Nutrition Component and Amino Acid Composition Analysis

Moisture, crude protein, and crude ash content were determined according to Cao et al. (2022) [24] with slight modifications. The crude fat was using a method of Cheng et al. (2020) [32]. Results were expressed as g/100 g sample.
Hydrolysed amino acids were determined using a high-speed amino acid analyzer (L-8900, Hitachi, Tokyo, Japan) based on the method described by Cai et al. (2021) [33].

2.10. Statistical Analysis

All samples analyzed were performed with three replicate measurements unless otherwise specified. Differences between mean values were analyzed by one-way analysis of variance (ANOVA), the least significant difference (LSD) test was performed in SPSS 26.0 software (SPSS Inc., Chicago, IL, USA), and p < 0.05 was considered statistically significant. The data fulfilled the LSD test conditions and were expressed as mean ± standard deviation (SD). Graphing was performed with Origin 2021.

3. Results and Discussion

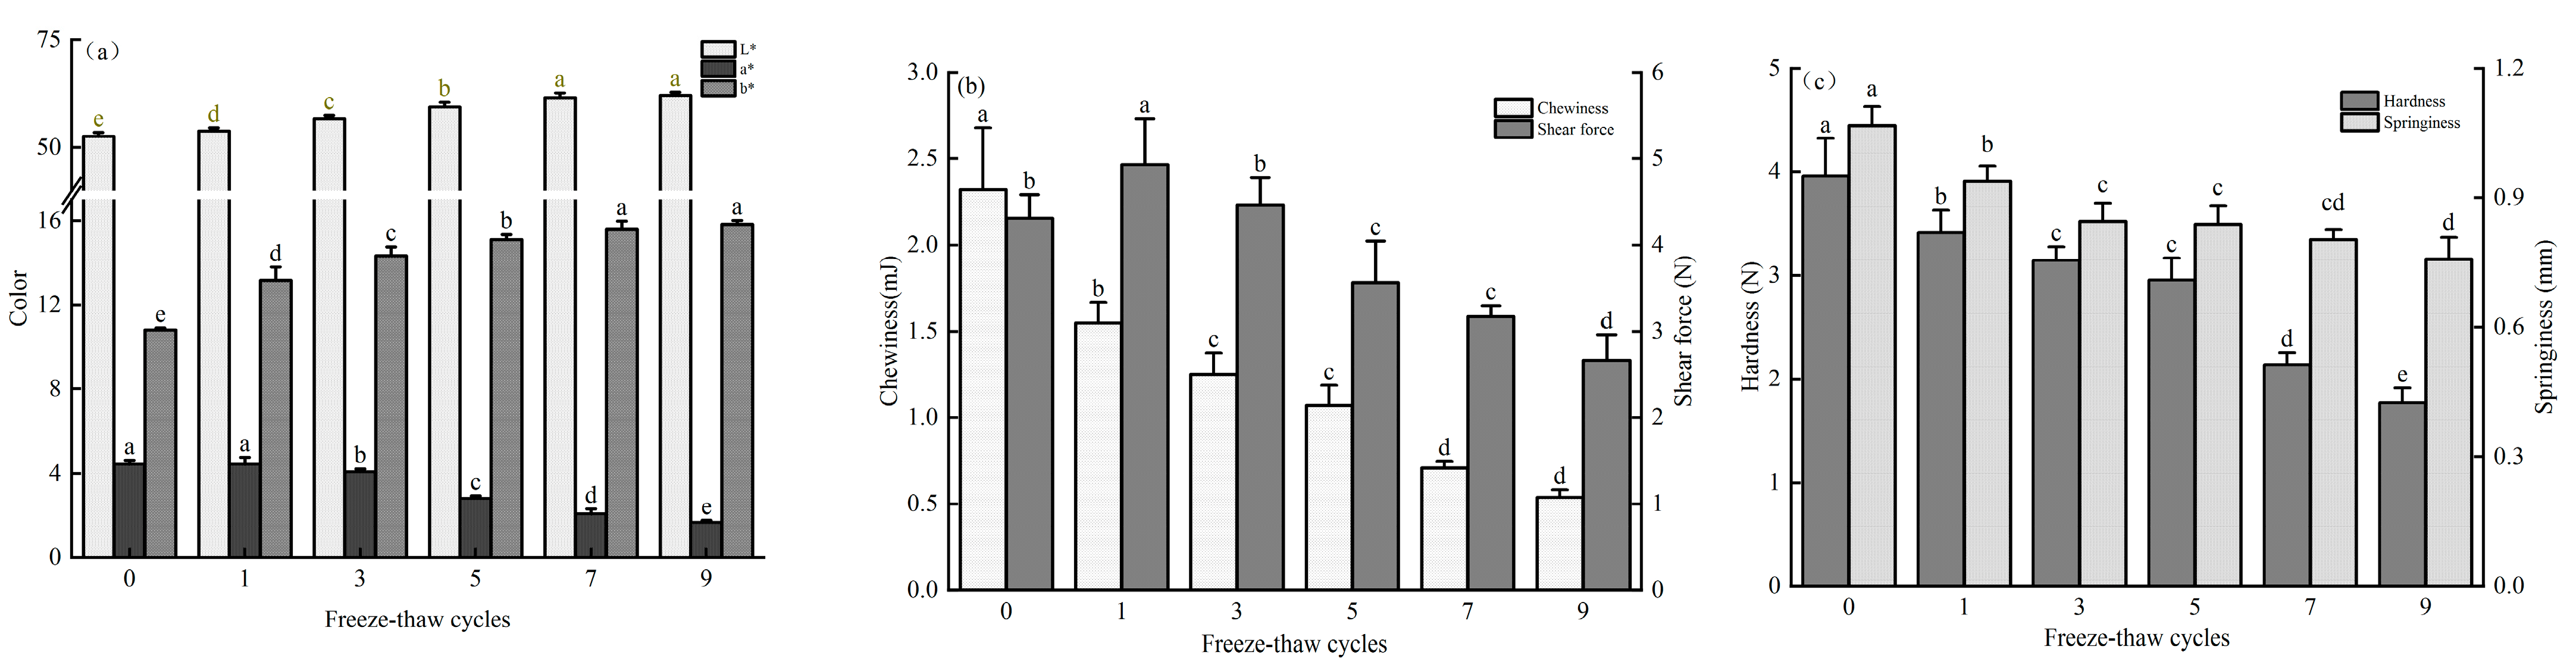
3.1. Effect of Freeze-Thaw Cycles on Color, Shear Force, and Texture

Meat color is the most important factor influencing the purchasing power of customers and a critical indicator that distinguishes fresh meat from frozen meat [34]. It could be known from Figure 1a that with the increase in F–T cycles, L* and b* values of fish meat increased significantly from the first cycle to the seventh cycle, while a* declined significantly after the third cycle, which was consistent with the results obtained by Hu et al. (2021) [21] and Li et al. (2023) [25]. Additionally, L* and b* increased from 52.65 and 10.81 (fresh meat) to 62.11 and 15.83 after the ninth cycle, respectively, while a* decreased from 4.45 (fresh meat) to 1.66 under the same conditions. During F–T cycles, the integrity of muscle tissues was destroyed by the continuous reformation of ice crystals (shown in Section 3.4), and the free water content between tissues increased. After thawing, the light reflectivity of the fish surface increased, which could also be promoted by the change in the protein conformation, thus increasing L* [35,36], which was consistent with the continuous increase in the thawing loss (shown in Section 3.2). Under frozen conditions, the activity of metmyoglobin reductase was repressed so that metmyoglobins were accumulated in quantity instead of being transformed into oxymyoglobins, thus decreasing the a* of muscles [37]. Furthermore, the degradation reactions of pigments and the free radicals were generated by the oxidation of unsaturated fatty acids, which react with amines in proteins, thus generating yellow pigments that change the meat’s color [38].
Tenderness is a sensory characteristic deciding which type of meat is accepted by consumers, and shear force is an intuitive means of reflecting meat tenderness. As shown in Figure 1b, the shear force of rainbow trout increased (p < 0.05) after the first cycle, indicating a decline in meat tenderness. However, it significantly dropped since the third cycle (p < 0.05), where the difference between the shear force in the fifth cycle and that in the seventh cycle was insignificant (p > 0.05). It has been reported that thawed meat usually shows a larger shear force than unfrozen meat due to the juice drain. With the increase in F–T cycles, moreover, muscle fibers rupture more significantly, accompanied by more serious damage to the connective tissue membrane and a smaller shear force [39].
The texture characteristics, such as hardness, springiness, and chewiness of fish meat can serve as an important basis for consumers to judge the flavor of meat products. In this study, the texture quality of rainbow trout meat was determined under the mode of texture profile analysis (TPA), which is used to imitate what occurs inside the mouth, allowing to obtain a force–time curve through two sample compression cycles that is meaningful to identify some texture properties of food [40]. As displayed in Figure 1b,c, it could be known that the hardness, springiness, and chewiness of rainbow trout muscles declined with the increase in F–T cycles. The hardness, which is related to the size of ice crystals, the tissue integrity, and the muscle water loss, reflects the internal binding force needed to keep the meat in shape and affects the sensory and functional characteristics of meat products. Comparing with fresh samples, the treated samples showed markedly dropped hardness after the first and third cycles (p < 0.05), insignificantly different hardness in the third cycle from that in the fifth cycle (p > 0.05), and significantly declined hardness after the seventh cycle (p < 0.05), demonstrating that the fish muscle may have softened. Fresh fish had not been frozen in storage, and the ice crystals had not damaged the muscle fibers, suggesting that tighter muscle fibers can get a better hardness value. Xie et al. (2020) [41] indicated that the degradation of muscle proteins was the primary cause for the reduction in hardness. The springiness reflects the ability of the network structure formed by proteins and their hydration layer in fish meat to resist external forces. In this study, the springiness dropped significantly after the first and third F–T cycles (p < 0.05) and kept declining in the later stage, but no significant differences were observed (p > 0.05). Myosin and actin were decomposed with an increasing degree due to the activity of some muscular endogenous enzymes, which further reduced the intracellular binding force and springiness of the muscle [41]. The chewiness, which refers to the effort made to chew until swallowing the food, is associated with the hardness and springiness, and a greater chewiness value denotes a better mouthfeel. In this study, the chewiness presented a declining trend with the increase in F–T cycles (p < 0.05), indicating a worsening taste. Lan et al. (2020) [42] showed that the texture characteristics of Pacific white shrimp were significantly influenced by repeated F–T cycles. These findings coincided with the experimental results obtained in this study. To be specific, repeated F–T cycles result in recrystallization, promote the mechanical injury of muscle cells, aggravate protein oxidation, and increase the degree of lipid oxidation, all of which can degrade the texture characteristics and edibility of fish meat and reduce the product yield rate.

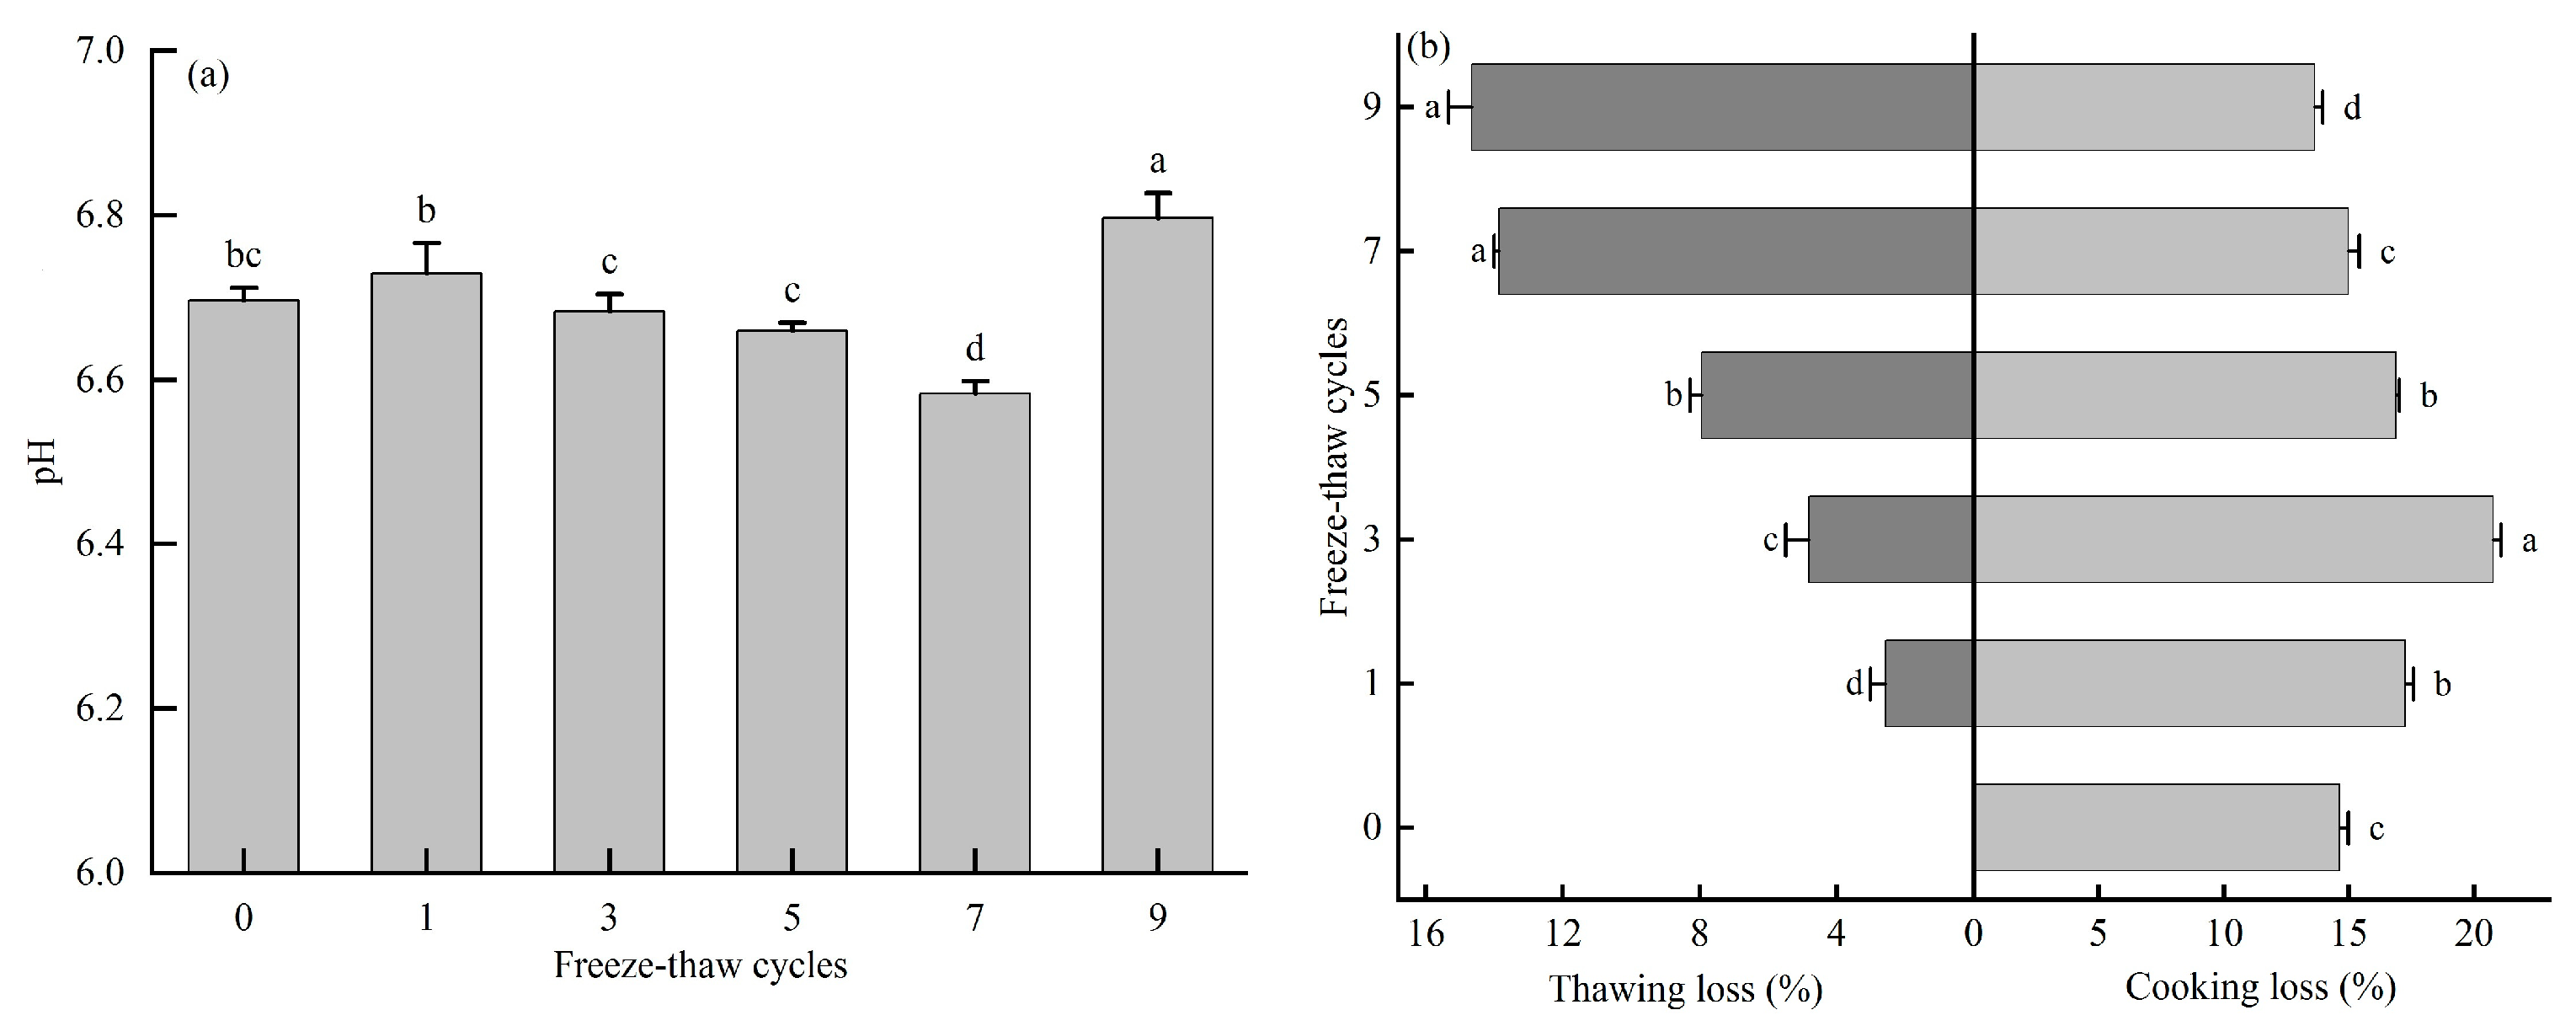
3.2. Effect of Freeze-Thaw Cycles on pH, Thawing Loss, and Cooking Loss

The pH value is one of the primary factors influencing the WHC of meat products, which mainly rests on muscle glycogen in the muscle. It could be observed from Figure 2a that the pH value of rainbow trout increased from 6.70 (fresh fish meat) to 6.73 after the first F–T cycle (p > 0.05), decreased to 6.58 after the seventh cycle, and rose to 6.80 after the ninth cycle (p < 0.05). The pH value was affected by various factors in repeated F–T cycles. Specifically, the pH value decreased most likely due to muscle glycogen being degraded under an oxygen-free condition during the thawing process, thus generating lactic acids, and because adenosine triphosphate was decomposed to generate acidic substances such as phosphocreatine. Another reason was that the solute concentration increased with moisture loss in meat and hydrogen ions were released due to protein denaturation [43,44]. Subsequently, the muscle of rainbow trout entered a decay stage, in which the protein degradation was accelerated to accumulate several alkaline substances such as ammonia and amines, thus leading to an increase in pH value [45].
Thawing loss can affect the tenderness and tissue state of muscles, which is a main index to evaluate the degree of water loss from the muscle during thawing. It is generally believed that lower thawing losses indicate better meat quality [46]. As shown in Figure 2b, the thawing loss of rainbow trout increased significantly (p < 0.05) in the early stage, tended to a stable status after the seventh cycle, and became 5.68 times that of the initial stage after the ninth cycle. Jiang et al. (2019) [27] and Li et al. (2022) [47] found that the thawing loss of muscles, which increased with the repeated F–T cycles, was closely related to the microstructure of muscle tissues and the ice crystal state. The muscular cytomembranes and organelles were continuously injured until rupture owing to the mechanical force of ice crystals, thus leading to the massive juice drain [48]. Meanwhile, the muscle protein degradation induced by ice recrystallization decreased the hydration ability of proteins, which caused the degradation of WHC and moisture loss until saturation.
The cooking loss is the main index used to appraise the eating quality of food. It refers to the loss of water-soluble components and liquid during the heating process [49]. Under repeated F–T cycles, the cooking loss firstly grew and then declined after the fifth cycle, and significant differences were observed (p < 0.05) (Figure 2b), which coincided with the result obtained by Wang et al. (2015) [48]. Due to the F–T cycles, denatured proteins were more susceptible to thermal denaturation, which resulted in more intense protein aggregation and further increased the cooking loss [50]. Meanwhile, it is also believed that the network structure formed by proteins was weakened and the WHC was degraded after the muscle proteins were denatured because of freezing. In the later freeze-thaw stage, the thawed juice loss and moisture loss reached their maximum values, thereby decreasing the cooking loss.

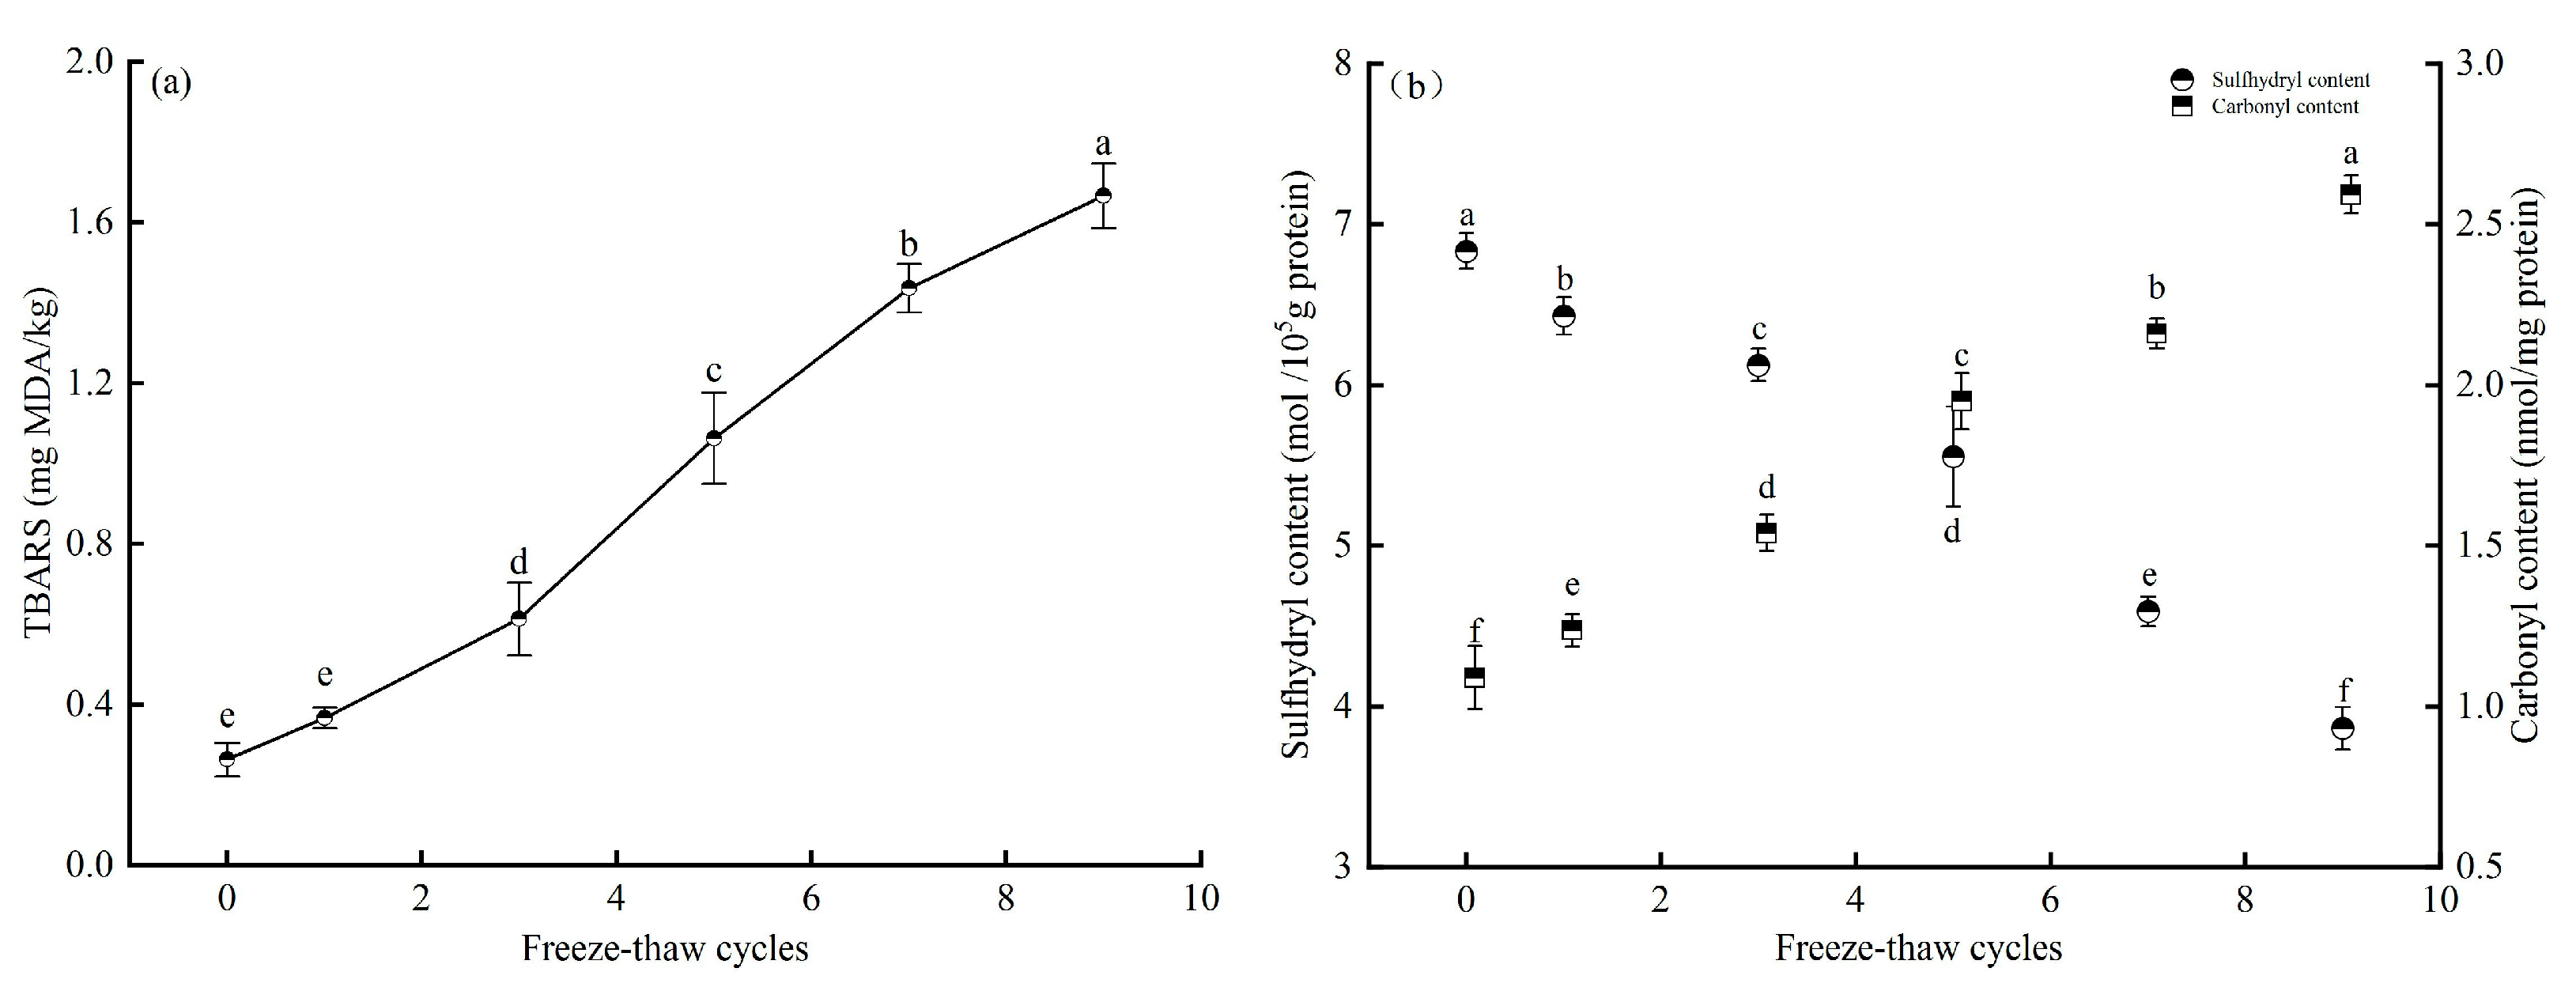
3.3. Effect of Freeze-Thaw Cycles on Lipid and Protein Oxidation

TBARS is an index evaluating the lipid oxidation degree of aquatic products, and a higher value indicates more serious lipid decay. The enzymatic activity is weakened and the microbial growth is inhibited by cryopreservation, but lipid hydrolysis and oxidation still occur, which exert adverse effects on the color, flavor, texture, odor, and nutritional quality of meat [51]. As demonstrated in Figure 3a, the TBARS value of fresh meat increased from 0.26 mg/kg to 0.37 mg/kg after the first cycle (p > 0.05) and grew significantly after the third cycle (p < 0.05), manifesting that the lipids in fish meat were continuously oxidized during the F–T cycles. It was possibly because partial lipid antioxidative enzymes were inactivated due to the repeated F–T cycle. In addition, the ice crystal structure in fish meat was changed, thus destroying the integrity of muscle cells so that some oxidation-promoting components, especially heme iron, were released [27]. Moreover, the ice crystals formed in the repeated F–T cycles developed into micropores on the sample surface, and the contact area between lipids and air was enlarged, which facilitated lipid oxidation.
The protein oxidative pathway can lead to protein degradation and denaturation, as well as the cleavage and crosslinking of the protein backbone and the conversion of amino acids. The carbonyl formation, which denotes the occurrence of protein oxidation, is used to measure the oxidation degree of proteins. The variation trends of the carbonyl content in the myofibrillar proteins of rainbow trout are displayed in Figure 3b. The carbonyl content kept a gradually increasing trend (p < 0.05) with the increase in F–T cycles. The carbonyl content in fresh rainbow trout meat was 1.09 nmol/mg and rose to 2.59 nmol/mg after the ninth cycle. Research showed that the amino acids carrying NH2– or NH– on the side chain were rather sensitive to hydroxyl radicals, which were converted into carbonyl groups during the protein oxidation process, thus increasing the carbonyl content [52].
Sulfhydryl (SH), which is the most active group in proteins, can be altered by changes in protein structure. Thus, SH plays a significant role in the stability of protein spatial structure. Besides, disulfide bonds, which mark protein oxidation, can be formed because of SH oxidation. Figure 3b shows the changes in total SH content in the muscle of rainbow trout during F–T cycles. It was found that the SH content gradually declined (p < 0.05) during F–T cycles, indicating that the protein oxidation degree was increased. This change pattern is similar to the trend of SH content in Pacific white shrimp researched by Jommark et al. [53]. The reason for the reduction of SH content was that the spatial 3D structure of proteins was altered due to the formation of ice crystals, and the SH embedded in molecules was subsequently exposed and oxidized to form disulfide bonds [54].
In this study, when TBARS was 1.42 times the original, the process of protein oxidation was accelerated. Generally, protein oxidation is thought to be related to other oxidative reactions that occur in foods, such as lipid oxidation and enzymatic reactions in which oxygen serves as a catalyst. Nikoo et al. (2019) [55] indicated that lipid oxidation products such as hydroperoxides, free radicals, and aldehydes (α, β-unsaturated aldehydes) might act as protein oxidation substrates and possess a high ability to induce protein oxidative denaturation. Wang et al. (2018) [56] observed that the interrelationship among TBARS, protein carbonyls, and metmyoglobin content of muscle presented good correlations during refrigerated and supercooled storage. Baron et al. (2007) [57] indicated that lipid and protein oxidation seemed to develop simultaneously when rainbow trout meat was stored at −20 °C. Alternatively, superoxide anion and hydrogen peroxide are produced during the oxidation of oxymyoglobin and furthermore react with iron to produce hydroxyl radicals, which penetrate into the hydrophobic lipid region and hence facilitate lipid oxidation [58]. The interactions between lipids and proteins during oxidation enhanced the initial oxidative reactions and were important for quality loss with a high impact on taste and texture.

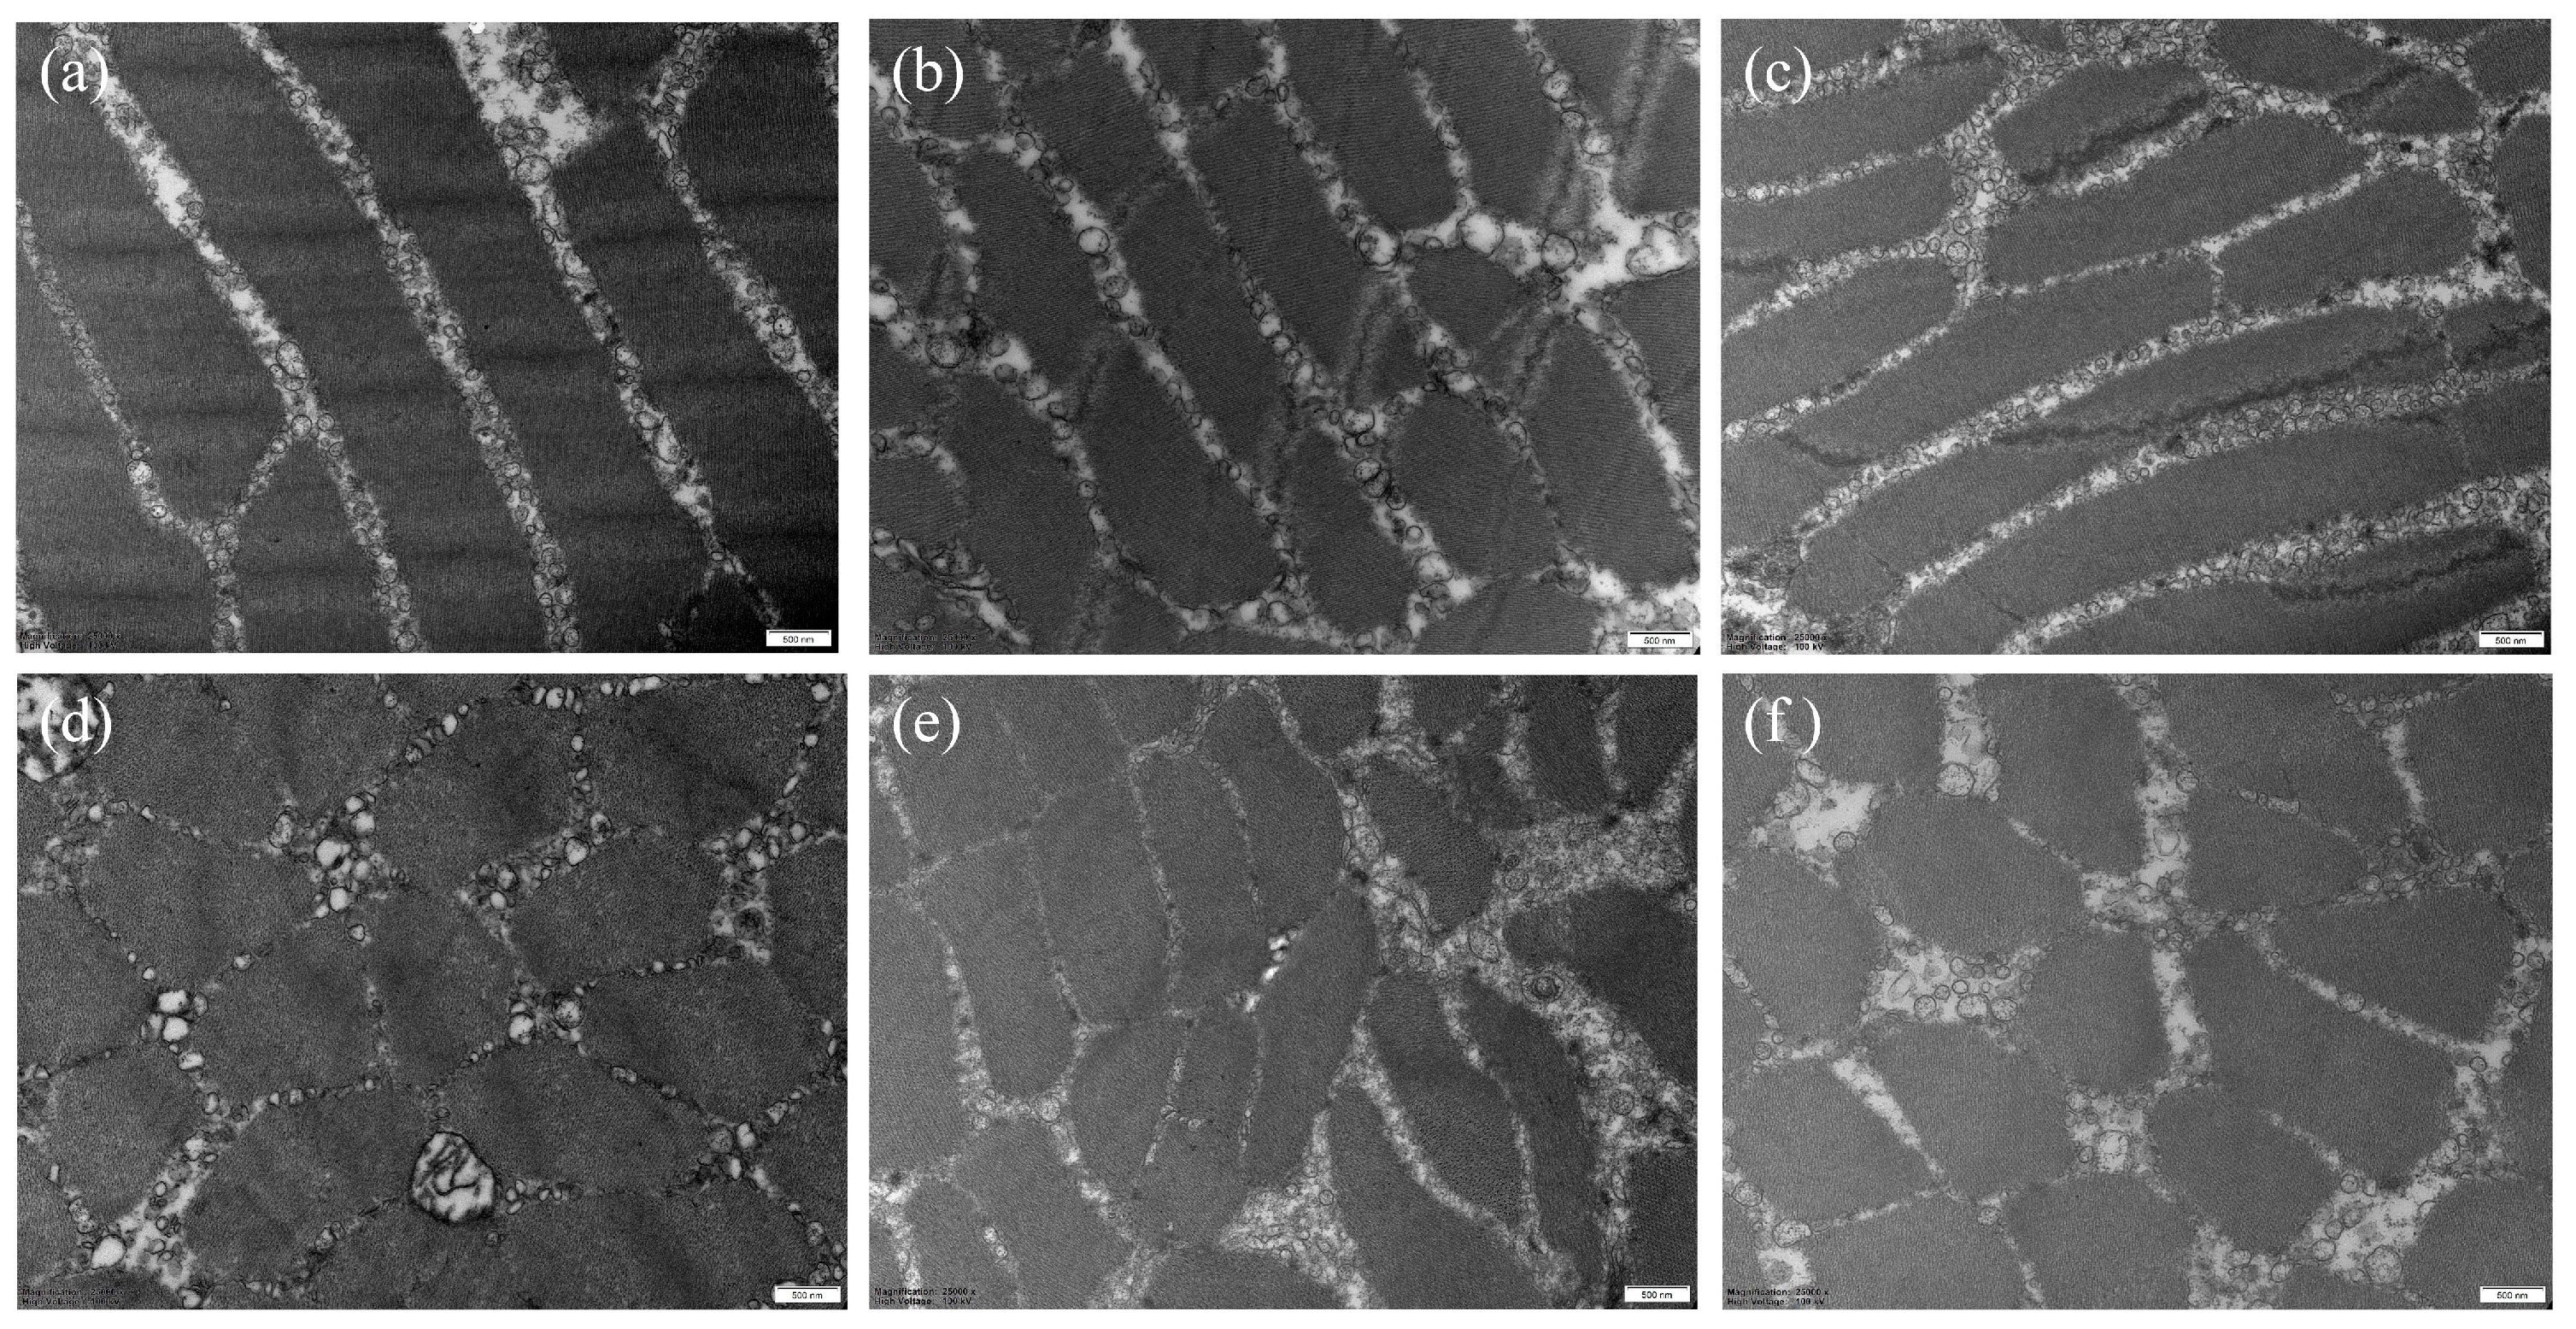
3.4. Effect of Freeze-Thaw Cycles on Tissue Histology

The microstructure analysis of the rainbow trout indicated that the repeated F–T cycles caused an adverse effect on the microstructure of fish muscle, in accordance with the result demonstrated by Tan et al. (2018) [59]. It could be observed from Figure 4 that as the numbers of F–T cycles increased, the muscle tissues transitioned from a tight and orderly state into a disorderly and unsystematic state. In the fresh sample group, the muscle fibers were intact as well as tightly and orderly structured, accompanied by the clear and orderly arrangement of light bands, dark bands, Z lines, and M lines. After the first F–T cycle, the muscle fiber microstructure was destructed, which was mainly manifested by the enlarged gaps between muscle fibers, misaligned and partially degraded Z lines, and blurred M lines. After the third cycle, the muscle fiber structure was destructed more seriously, as evidenced by the large-area rupture, disintegration of muscle fibers, and the disappearance of M lines. From the fifth cycle to the ninth cycle, the muscle fiber structure was loose and incompact, which was in line with the reduction of shear force. The gaps between muscle fibers were enlarged due to the destruction of endomysia and muscle fiber bundles, which might promote the formation of water channels and negatively impact the WHC [47]. These results were identical to those reported on the thawing loss and cooking loss (shown in Section 3.2). Meanwhile, fiber gaps were enlarged and fibers were segmented, thus destructing the network structure of muscle tissues. As a result, a large amount of free water stored in the gaps between muscle tissues could not be bound and was expelled, and finally the moisture content in the muscle of rainbow trout was reduced. Moreover, the integrity of the muscle microstructure was impacted by the degradation of main proteins in muscle fibers and the mechanical damage of ice crystals in the repeated freeze-thaw cycles. Consequently, the original texture of fresh meat was lost, and thus the edible quality of rainbow trout meat was degraded.

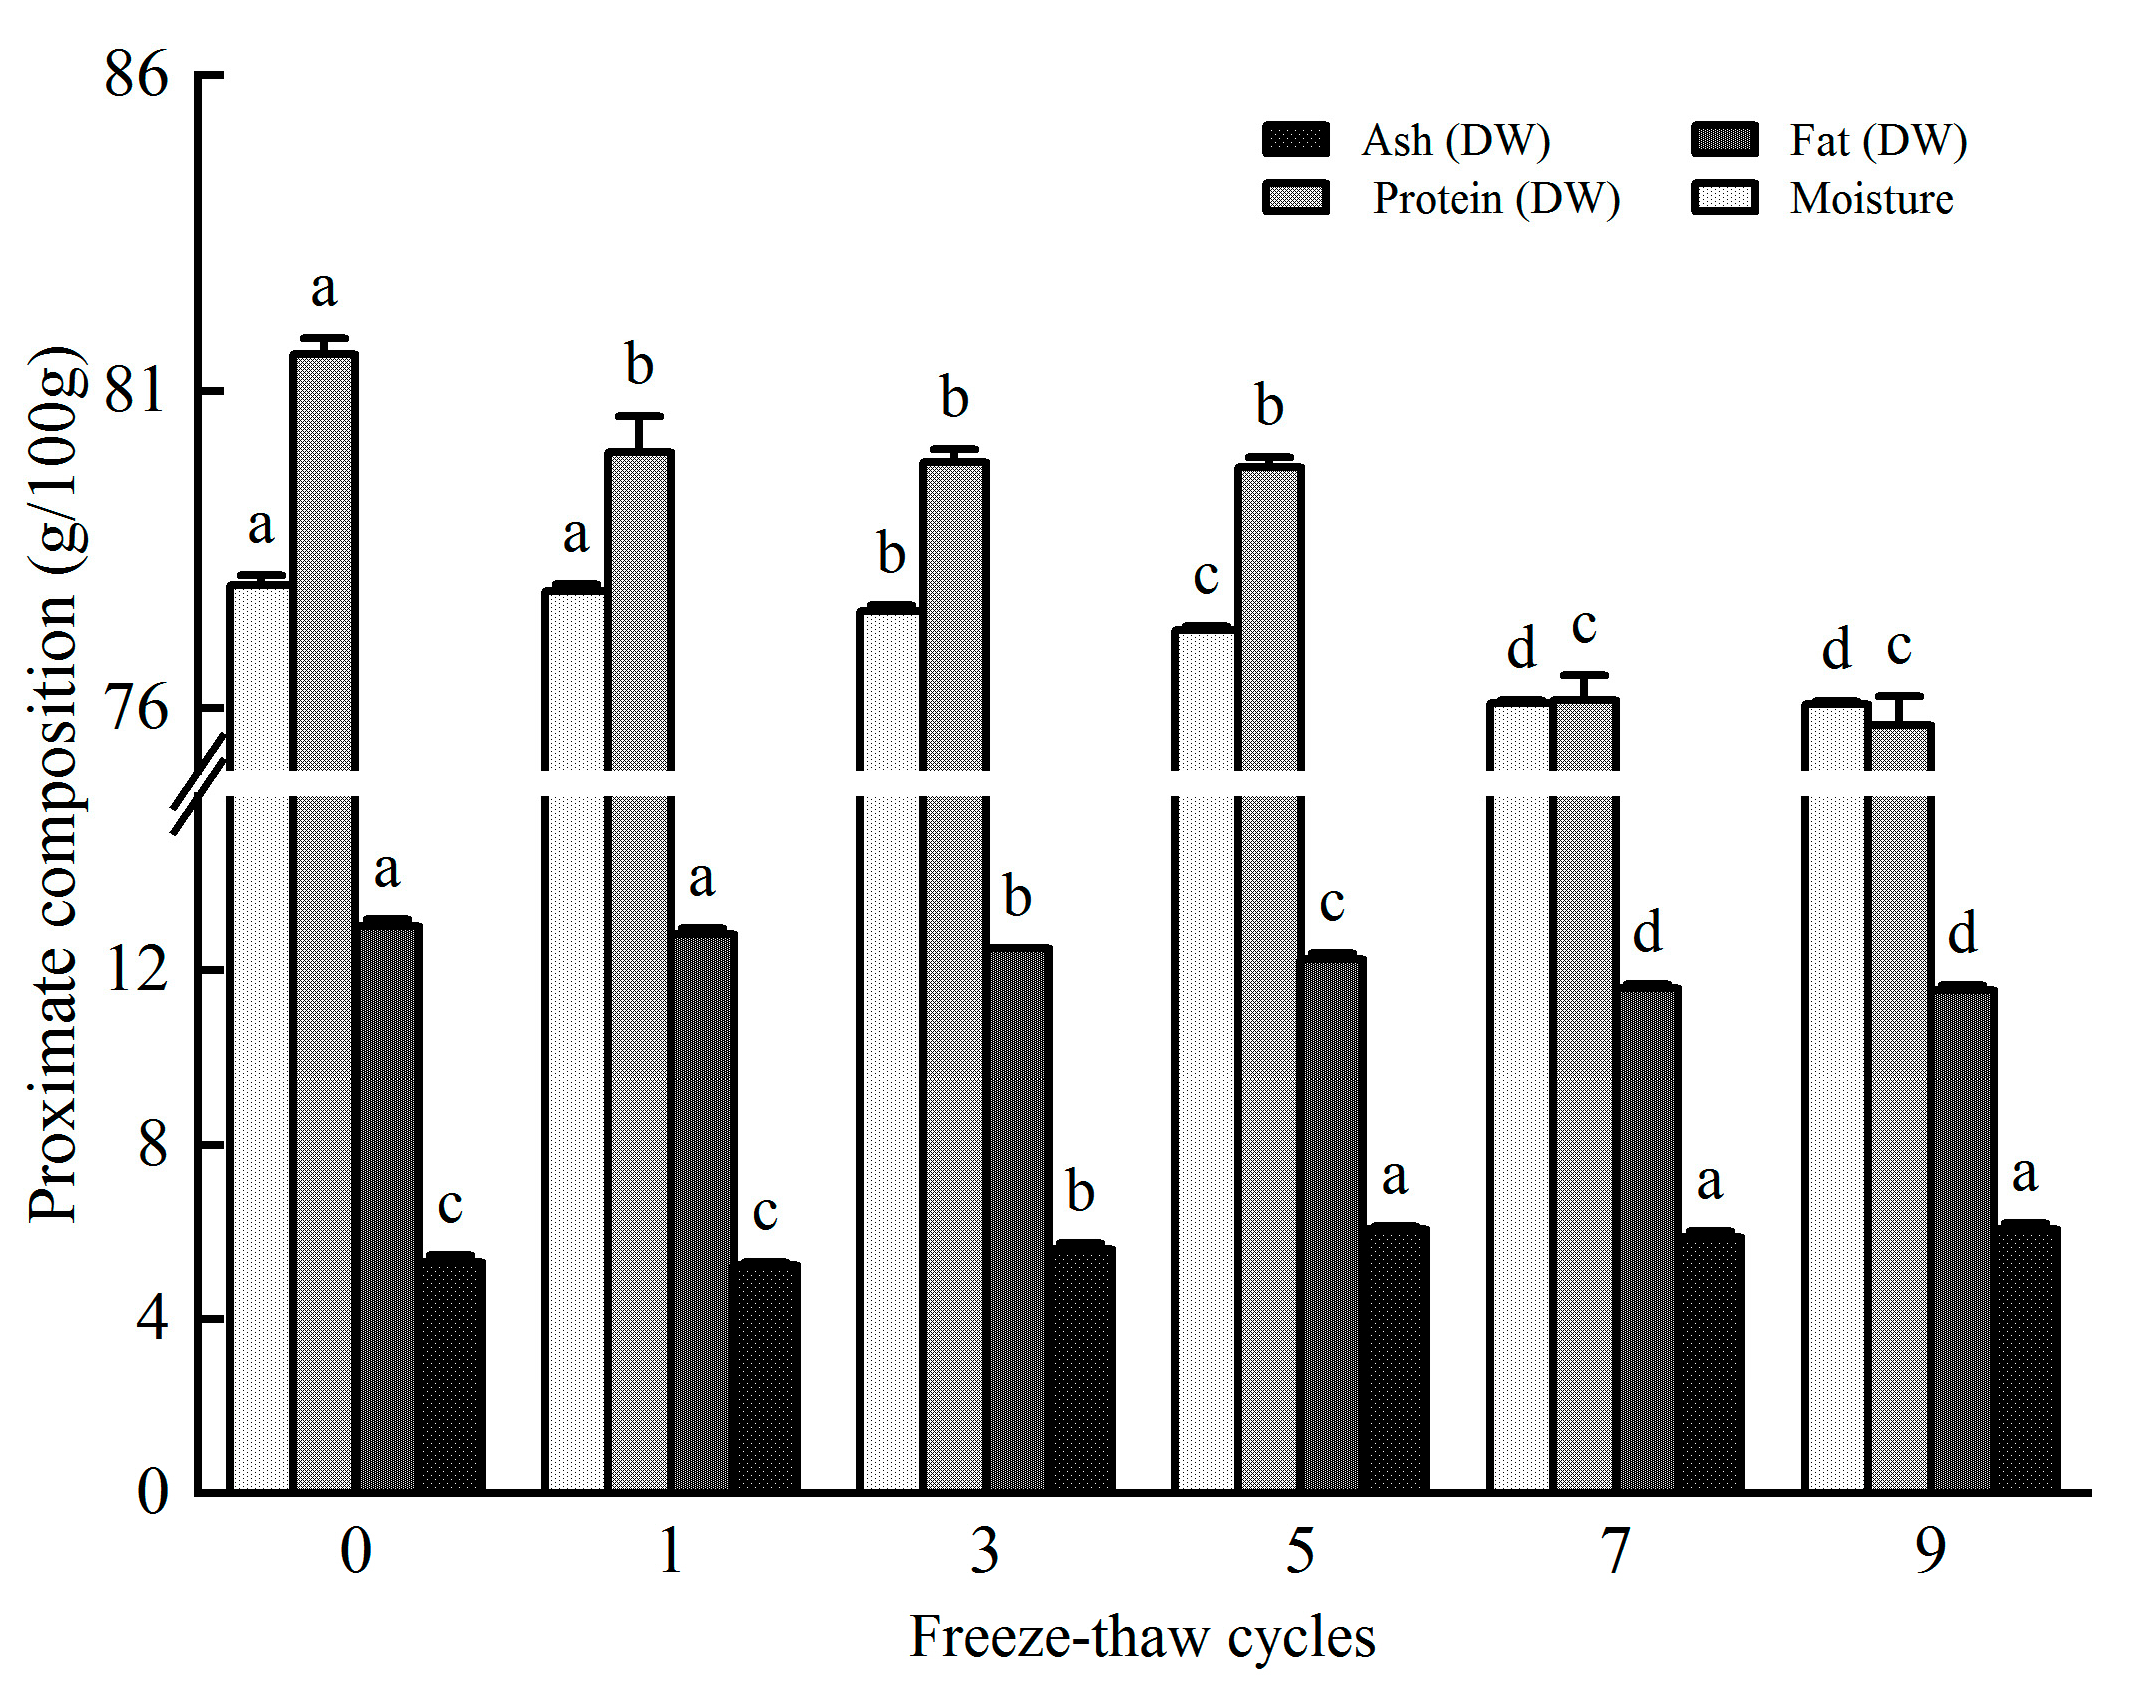
3.5. Effect of Freeze-Thaw Cycles on the Proximate Nutrition Components of Rainbow Trout

Proximate components such as protein, fat, and minerals are essential for human health. Figure 5 indicated that with the increase in F–T cycles, the moisture content showed a declining trend, which coincided with the results of Watanabe et al. (2020) [60]. The rainbow trout was juiceless due to the moisture reduction. Specifically, the moisture content in the muscle of rainbow trout decreased to 77.85% after the first cycle, it dropped significantly after the third cycle (p < 0.05) (the reduction rates were 0.53%, 0.91%, 2.39%, and 2.41%, respectively), and no significant difference was found between the seventh cycle and the ninth cycle (p > 0.05), which conformed to the thawing loss (shown in Section 3.2). This was because ice crystals aggregated due to the thawing and refreezing of intracellular and extracellular moisture during the repeated F–T cycles, and the ice crystals were reduced in quantity but enlarged in volume. Moreover, the number of extracellular ice crystals was increased, which compressed muscle tissues, destructed the tissue structure, and degraded its WHC. The juice was drained, and thus the moisture content was reduced [61]. The content of proteins presented a declining trend as the numbers of F–T cycles increased. To be specific, the content of proteins declined by 1.90% after the first cycle compared with that in the fresh sample (p < 0.05), and after the seventh and ninth cycles, it declined by 6.70% and 7.19%, respectively, which most likely attributed to the loss of water-soluble proteins. The proteins were denaturalized in the repeated F–T cycles and thus easily hydrolyzed by the proteolytic enzymes of the fish meat, which can promote the reduction of the crude protein content [62]. Similarly, the content of fats showed a declining trend with the increase in F–T cycles. Specifically, the content of fats decreased by 1.41% after the first cycle compared with that in the fresh sample; there were significant differences after the third cycle (p < 0.05); and it tended to be stable after the seventh cycle. The decrease in fat content might be caused by partial lipid oxidation and lipolysis [63], which altered the chemical composition of fish muscle. The ash content maintained an upward trend, for which the mechanism remains unclarified.

3.6. Effect of Freeze-Thaw Cycles on Amino Acid Composition

Amino acids are important structural components of all living organisms and play an indispensable role in metabolism [64]. The composition of amino acids in rainbow trout muscles during F–T cycles is shown in Table 1. A total of 17 kinds of amino acids were detected, including nine essential amino acids (EAAs) and eight non-essential amino acids (NEAAs). Glutamic acid (Glu) was the most abundant amino acid, followed by aspartic acid (Asp), lysine (Lys), and leucine (Leu); the result was consistent with other studies [65,66]. Glu is involved in the synthesis of proteins, peptides, and fatty acids and also regulates ammonia levels in the body [67]. Lys, as an essential amino acid that is the limiting amino acid in the cereal-based diets of children in developing countries [68], can promote body growth, enhance immunity, and improve functions of the central nervous system. As the second-most abundant EAA, Leu regulates the rapamycin signaling pathway and promotes protein synthesis [69]. With the increase of F–T cycles, the contents of EAAs, NEAAs, and TAAs decreased, which confirmed the variation trend in crude protein. As EAAs, the contents of threonine (Thr), isoleucine (Ile), and arginine (Arg) were slightly increased after the first F–T cycle (p > 0.05), subsequently decreased (p < 0.05). However, valine (Val), methionine (Met), phenylalanine (Phe), Lys, Leu, and histidine (His) decreased significantly with the increase numbers in F–T cycles (p < 0.05). EAAs/TAAs decreased from the fifth cycle; however, EAAs/NEAAs declined from 0.97 (fresh) to 0.84 (ninth cycle). EAAs cannot be synthesized by the body and must be obtained from the diet. Decreases in EAAs/TAAs and EAAs/NEAAs indicated a reduction in the nutrients index.
The decrease in amino acids may be caused by the formation of ice crystals during the F–T cycles. The proteins were decomposed into small molecules by enzymes and flowed out with the loss of juice, which eventually led to the decrease of amino acids. Moreover, the protein oxidation changed the distribution of amino acids and caused a net loss of specific amino acids. Thr, Arg, and Lys underwent irreversible oxidative modification in the process of carbonyl production, causing mass loss. Besides, Met, His, Leu, and Val were very sensitive to reactive oxygen species and were oxidized into sulfur compounds. In addition, amino acids may be degraded to nitrogenous substances in the late F–T periods, which led to the reduction of amino acid content.

4. Conclusions

In summary, multiple F–T cycles caused protein and lipid oxidative denaturation as well as mechanical damage to muscle tissue, which destructed the color stability, declined the hardness, springiness, and chewiness of meat, and simultaneously abated the WHC and nutrients. The results demonstrated that there were no obvious differences in rainbow trout meat after the first F–T cycle. The texture and tissue structure of fish meat changed significantly after the third F–T cycle, along with a decline in the WHC and the oxidation of proteins and lipids. After the fifth F–T cycle, the sliced meat was softened, the proteins and lipids were seriously oxidized, the color changed markedly, and the meat quality deteriorated seriously. After the seventh F–T cycle, the muscle was unaccepted due to the highest juice drain rate, serious microstructural damage, and nutritional loss. These results reinforce the suggestion that reducing the temperature fluctuation by less than three times is significant for protecting the quality of frozen fish and meat products.

Author Contributions

Conceptualization, N.D. and P.W.; methodology, all authors; software, X.H. and L.G.; validation, N.D., Y.S. and Z.C.; formal analysis, N.D.; resources, Q.H.; writing-original draft preparation, N.D.; writing-review and editing, C.L. and N.D.; project administration, P.W.; funding acquisition, Q.H.; methodology, S.B. All authors have read and agreed to the published version of the manuscript.

Funding

This research was funded by the Fundamental Research Funds for Central Public-Interest Scientific Institution Basal Research Fund, HRFRI (NO. HSY201906Q), the National Key Research and Development Program of China (2020YFD0900301), and the National Natural Science Foundation of China (32002445).

Institutional Review Board Statement

All animal procedures in this study were conducted according to the guidelines for the care and use of laboratory animals of the Heilongjiang River Fisheries Research Institute, Chinese Academy of Fishery Sciences (CAFS). The studies in animals were reviewed and approved by the Committee for the Welfare and Ethics of Laboratory Animals of the Heilongjiang River Fisheries Research Institute, CAFS (approval code: 9972).

Data Availability Statement

The datasets used and/or analyzed during the current study are available from the corresponding author on reasonable request.

Conflicts of Interest

The authors declare no conflict of interest.

References

  1. Selli, S.; Rannou, C.; Prost, C.; Robin, J.; Serot, T. Characterization of aroma-active compounds in rainbow trout (Oncorhynchus mykiss) eliciting an off-odor. J. Agric. Food Chem. 2006, 54, 9496–9502. [Google Scholar] [CrossRef]
  2. Rebolé, A.; Velasco, S.; Rodríguez, M.; Treviño, J.; Alzueta, C.; Tejedor, J.; Ortiz, L. Nutrient content in the muscle and skin of fillets from farmed rainbow trout (Oncorhynchus mykiss). Food Chem. 2015, 174, 614–620. [Google Scholar] [CrossRef]
  3. Molony, B.; Molony, B. Environmental Requirements and Tolerances of Rainbow Trout (Oncorhynchus mykiss) and Brown Trout (Salmo trutta) with Special Reference to Western Australia: A Review; Department of Fisheries, Government of Western Australia: Perth, Australia, 2001. [Google Scholar]
  4. Sampaio, F.D.; Freire, C.A. An overview of stress physiology of fish transport: Changes in water quality as a function of transport duration. Fish Fish. 2016, 17, 1055–1072. [Google Scholar] [CrossRef]
  5. Chávez-Mendoza, C.; García-Macías, J.A.; Alarcón-Rojo, A.D.; Ortega-Gutiérrez, J.Á.; Holguín-Licón, C.; Corral-Flores, G. Comparison of fatty acid content of fresh and frozen fillets of rainbow trout (Oncorhynchus mykiss) Walbaum. Braz. Arch. Biol. Technol. 2014, 57, 103–109. [Google Scholar] [CrossRef]
  6. Lisitsyn, A.B.; Chernukha, I.M.; Lunina, O.I. To the question about meat freezing. review. Theory Pract. Meat Process. 2019, 4, 27–31. [Google Scholar] [CrossRef]
  7. Nakazawa, N.; Okazaki, E. Recent research on factors influencing the quality of frozen seafood. Fish. Sci. 2020, 86, 231–244. [Google Scholar] [CrossRef]
  8. Du, X.; Chang, P.; Tian, J.; Kong, B.; Sun, F.; Xia, X. Effect of ice structuring protein on the quality, thermal stability and oxidation of mirror carp (Cyprinus carpio L.) induced by freeze-thaw cycles. LWT 2020, 124, 109140. [Google Scholar] [CrossRef]
  9. Li, F.; Wang, B.; Kong, B.; Shi, S.; Xia, X. Decreased gelling properties of protein in mirror carp (Cyprinus carpio) are due to protein aggregation and structure deterioration when subjected to freeze-thaw cycles. Food Hydrocoll. 2019, 97, 105223. [Google Scholar] [CrossRef]
  10. Yasemi, M. Prevention of denaturation of freshwater crayfish muscle subjected to different freeze-thaw cycles by gelatin hydrolysate. Food Chem. 2017, 234, 199–204. [Google Scholar] [CrossRef] [PubMed]
  11. Prior, B. Measurement of water activity in foods: A review. J. Food Prot. 1979, 42, 668–674. [Google Scholar] [CrossRef] [PubMed]
  12. Santini, A.; Novellino, E.; Armini, V.; Ritieni, A. State of the art of Ready-to-Use Therapeutic Food: A tool for nutraceuticals addition to foodstuff. Food Chem. 2013, 140, 843–849. [Google Scholar] [CrossRef] [PubMed]
  13. Vilgis, T.A. Soft matter food physics-the physics of food and cooking. Rep. Prog. Phys. 2015, 78, 124602. [Google Scholar] [CrossRef] [PubMed]
  14. Amaral, A.B.; Silva, M.V.D.; Lannes, S.C.D.S. Lipid oxidation in meat: Mechanisms and protective factors-a review. Food Sci. Technol. 2018, 38, 1–15. [Google Scholar] [CrossRef]
  15. Qian, S.; Li, X.; Wang, H.; Sun, Z.; Zhang, C.; Guan, W.; Blecker, C. Effect of sub-freezing storage (−6, −9 and −12° C) on quality and shelf life of beef. Int. J. Food Sci. Technol. 2018, 53, 2129–2140. [Google Scholar] [CrossRef]
  16. Pan, N.; Dong, C.; Du, X.; Kong, B.; Sun, J.; Xia, X. Effect of freeze-thaw cycles on the quality of quick-frozen pork patty with different fat content by consumer assessment and instrument-based detection. Meat Sci. 2021, 172, 108313. [Google Scholar] [CrossRef] [PubMed]
  17. Sabow, A.B.; Sazili, A.Q.; Aghwan, Z.A.; Zulkifli, I.; Goh, Y.M.; Ab Kadir, M.Z.A.; Nakyinsige, K.; Kaka, U.; Adeyemi, K.D. Changes of microbial spoilage, lipid-protein oxidation and physicochemical properties during post mortem refrigerated storage of goat meat. Anim. Sci. J. 2016, 87, 816–826. [Google Scholar] [CrossRef] [PubMed]
  18. Estévez, M. Protein carbonyls in meat systems: A review. Meat Sci. 2011, 89, 259–279. [Google Scholar] [CrossRef] [PubMed]
  19. Kaale, L.D.; Eikevik, T.M. Changes of proteins during superchilled storage of Atlantic salmon muscle (Salmo salar). J. Food Sci. Technol. 2016, 53, 441–450. [Google Scholar] [CrossRef] [PubMed]
  20. Lan, W.; Zhao, Y.; Hu, X.; Zhang, X.; Xie, J. Effects of carrageenan oligosaccharide on lipid, protein oxidative changes, and moisture migration of Litopenaeus vannamei during freeze-thaw cycles. J. Food Process. Preserv. 2020, 44, e14675. [Google Scholar] [CrossRef]
  21. Hu, C.; Xie, J. The effect of multiple freeze-thaw cycles on protein oxidation and quality of Trachurus murphyi. J. Food Process. Preserv. 2021, 45, e15998. [Google Scholar] [CrossRef]
  22. Sáez, M.I.; Suárez, M.D.; Cárdenas, S.; Martínez, T.F. Freezing and freezing-thawing cycles on textural and biochemical changes of meagre (Argyrosomus regius, L) fillets during further cold storage. Int. J. Food Prop. 2015, 18, 1635–1647. [Google Scholar] [CrossRef]
  23. Miyawaki, O. Water and freezing in food. Food Sci. Technol. Res. 2018, 24, 1–21. [Google Scholar] [CrossRef]
  24. Cao, Y.; He, S.; Yu, Q.; Han, L.; Zhang, W.; Zou, X. Effects of multiple freeze-thaw cycles on meat quality, nutrients, water distribution and microstructure in bovine rumen smooth muscle. Int. J. Food Sci. Technol. 2022, 57, 3001–3011. [Google Scholar] [CrossRef]
  25. Li, H.; Wang, L.; Wang, J.; Li, X.; Li, J.; Cui, F.; Yi, S.; Xu, Y.; Zhu, W.; Mi, H. Effects of ultrasound-assisted freezing on the quality of large yellow croaker (Pseudosciaena crocea) subjected to multiple freeze-thaw cycles. Food Chem. 2023, 404, 134530. [Google Scholar] [CrossRef] [PubMed]
  26. Xu, N.; Shi, W.; Wang, X.; Wang, Z. Effect of ice water pretreatment on the quality of Pacific White Shrimps (Litopenaeus vannamei). Food Sci. Nutr. 2019, 7, 645–655. [Google Scholar] [CrossRef]
  27. Jiang, Q.; Nakazawa, N.; Hu, Y.; Osako, K.; Okazaki, E. Changes in quality properties and tissue histology of lightly salted tuna meat subjected to multiple freeze-thaw cycles. Food Chem. 2019, 293, 178–186. [Google Scholar] [CrossRef]
  28. Zhang, T.; Xue, Y.; Li, Z.; Wang, Y.; Yang, W.; Xue, C. Effects of ozone on the removal of geosmin and the physicochemical properties of fish meat from bighead carp (Hypophthalmichthys nobilis). Innov. Food Sci. Emerg. Technol. 2016, 34, 16–23. [Google Scholar] [CrossRef]
  29. Soyer, A.; Özalp, B.; Dalmış, Ü.; Bilgin, V. Effects of freezing temperature and duration of frozen storage on lipid and protein oxidation in chicken meat. Food Chem. 2010, 120, 1025–1030. [Google Scholar] [CrossRef]
  30. Benjakul, S.; Seymour, T.A.; Morrissey, M.T.; An, H. Physicochemical changes in Pacific whiting muscle proteins during iced storage. J. Food Sci. 1997, 62, 729–733. [Google Scholar] [CrossRef]
  31. Qi, J.; Li, C.; Chen, Y.; Gao, F.; Xu, X.; Zhou, G. Changes in meat quality of ovine longissimus dorsi muscle in response to repeated freeze and thaw. Meat Sci. 2012, 92, 619–626. [Google Scholar] [CrossRef]
  32. Cheng, H.; Song, S.; Jung, E.-Y.; Jeong, J.-Y.; Joo, S.-T.; Kim, G.-D. Comparison of beef quality influenced by freeze-thawing among different beef cuts having different muscle fiber characteristics. Meat Sci. 2020, 169, 108206. [Google Scholar] [CrossRef]
  33. Cai, L.; Tong, F.; Tang, T.; Ao, Z.; Wei, Z.; Yang, F.; Shu, Y.; Liu, S.; Mai, K. Comparative evaluation of nutritional value and flavor quality of muscle in triploid and diploid common carp: Application of genetic improvement in fish quality. Aquaculture 2021, 541, 736780. [Google Scholar] [CrossRef]
  34. Da Silva, M.C.A.; Leite, J.S.A.F.; Barreto, B.G.; dos Anjos Neves, M.V.; Silva, A.S.; de Viveiros, K.M.; Passos, R.S.F.T.; Costa, N.P.; da Silva, R.V.; Cavalheiro, C.P. The impact of innovative gluten-free coatings on the physicochemical, microbiological, and sensory characteristics of fish nuggets. LWT 2021, 137, 110409. [Google Scholar] [CrossRef]
  35. Ma, X.; Mei, J.; Xie, J. Effects of multi-frequency ultrasound on the freezing rates, quality properties and structural characteristics of cultured large yellow croaker (Larimichthys crocea). Ultrason. Sonochemistry 2021, 76, 105657. [Google Scholar] [CrossRef] [PubMed]
  36. Lu, H.; Zhang, L.; Shi, J.; Wang, Z.; Luo, Y. Effects of frozen storage on physicochemical characteristics of bighead carp (Aristichthys nobilis) fillets. J. Food Process. Preserv. 2019, 43, e14141. [Google Scholar] [CrossRef]
  37. Jung, S.; Ghoul, M.; de Lamballerie-Anton, M. Influence of high pressure on the color and microbial quality of beef meat. LWT-Food Sci. Technol. 2003, 36, 625–631. [Google Scholar] [CrossRef]
  38. Abuelfatah, K.; Zuki, A.; Goh, Y.; Sazili, A. Effects of enriching goat meat with n-3 polyunsaturated fatty acids on meat quality and stability. Small Rumin. Res. 2016, 136, 36–42. [Google Scholar] [CrossRef]
  39. Xia, X.; Kong, B.; Liu, Q.; Liu, J. Physicochemical change and protein oxidation in porcine longissimus dorsi as influenced by different freeze-thaw cycles. Meat Sci. 2009, 83, 239–245. [Google Scholar] [CrossRef]
  40. Nishinari, K.; Fang, Y.; Rosenthal, A. Human oral processing and texture profile analysis parameters: Bridging the gap between the sensory evaluation and the instrumental measurements. J. Texture Stud. 2019, 50, 369–380. [Google Scholar] [CrossRef]
  41. Xie, J.; Wang, Z.; Wang, S.; Qian, Y.-F. Textural and quality changes of hairtail fillets (Trichiurus haumela) related with water distribution during simulated cold chain logistics. Food Sci. Technol. Int. 2020, 26, 291–299. [Google Scholar] [CrossRef]
  42. Lan, W.; Hu, X.; Sun, X.; Zhang, X.; Xie, J. Effect of the number of freeze-thaw cycles number on the quality of Pacific white shrimp (Litopenaeus vannamei): An emphasis on moisture migration and microstructure by LF-NMR and SEM. Aquac. Fish. 2020, 5, 193–200. [Google Scholar] [CrossRef]
  43. Leygonie, C.; Britz, T.J.; Hoffman, L.C. Impact of freezing and thawing on the quality of meat. Meat Sci. 2012, 91, 93–98. [Google Scholar] [CrossRef] [PubMed]
  44. Leygonie, C.; Britz, T.J.; Hoffman, L.C. Oxidative stability of previously frozen ostrich Muscularis iliofibularis packaged under different modified atmospheric conditions. Int. J. Food Sci. Technol. 2011, 46, 1171–1178. [Google Scholar] [CrossRef]
  45. Shamshad, S.; Riaz, M.; Zuberi, R.; Qadri, R. Shelf life of shrimp (Penaeus merguiensis) stored at different temperatures. J. Food Sci. 1990, 55, 1201–1205. [Google Scholar] [CrossRef]
  46. Li, D.; Jia, S.; Zhang, L.; Wang, Z.; Pan, J.; Zhu, B.; Luo, Y. Effect of using a high voltage electrostatic field on microbial communities, degradation of adenosine triphosphate, and water loss when thawing lightly-salted, frozen common carp (Cyprinus carpio). J. Food Eng. 2017, 212, 226–233. [Google Scholar] [CrossRef]
  47. Li, R.; Guo, M.; Liao, E.; Wang, Q.; Peng, L.; Jin, W.; Wang, H. Effects of repeated freezing and thawing on myofibrillar protein and quality characteristics of marinated Enshi black pork. Food Chem. 2022, 378, 131994. [Google Scholar] [CrossRef] [PubMed]
  48. Wang, H.; Luo, Y.; Shi, C.; Shen, H. Effect of different thawing methods and multiple freeze-thaw cycles on the quality of common carp (Cyprinus carpio). J. Aquat. Food Prod. Technol. 2015, 24, 153–162. [Google Scholar] [CrossRef]
  49. Dalvi-Isfahan, M.; Hamdami, N.; Le-Bail, A. Effect of freezing under electrostatic field on the quality of lamb meat. Innov. Food Sci. Emerg. Technol. 2016, 37, 68–73. [Google Scholar] [CrossRef]
  50. Benjakul, S.; Sutthipan, N. Muscle changes in hard and soft shell crabs during frozen storage. LWT-Food Sci. Technol. 2009, 42, 723–729. [Google Scholar] [CrossRef]
  51. Hematyar, N.; Rustad, T.; Sampels, S.; Kastrup Dalsgaard, T. Relationship between lipid and protein oxidation in fish. Aquac. Res. 2019, 50, 1393–1403. [Google Scholar] [CrossRef]
  52. Sante-Lhoutellier, V.; Aubry, L.; Gatellier, P. Effect of oxidation on in vitro digestibility of skeletal muscle myofibrillar proteins. J. Agric. Food Chem. 2007, 55, 5343–5348. [Google Scholar] [CrossRef]
  53. Jommark, N.; Runglerdkriangkrai, J.; Konno, K.; Ratana-arporn, P. Effect of cryoprotectants on suppression of protein structure deterioration induced by freeze-thaw cycle in Pacific white shrimp. J. Aquat. Food Prod. Technol. 2018, 27, 91–106. [Google Scholar] [CrossRef]
  54. Thanonkaew, A.; Benjakul, S.; Visessanguan, W.; Decker, E.A. The effect of antioxidants on the quality changes of cuttlefish (Sepia pharaonis) muscle during frozen storage. LWT-Food Sci. Technol. 2008, 41, 161–169. [Google Scholar] [CrossRef]
  55. Nikoo, M.; Benjakul, S.; Gavlighi, H.A.; Xu, X.; Regenstein, J.M. Hydrolysates from rainbow trout (Oncorhynchus mykiss) processing by-products: Properties when added to fish mince with different freeze-thaw cycles. Food Biosci. 2019, 30, 100418. [Google Scholar] [CrossRef]
  56. Wang, Z.; He, Z.; Gan, X.; Li, H. Interrelationship among ferrous myoglobin, lipid and protein oxidations in rabbit meat during refrigerated and superchilled storage. Meat Sci. 2018, 146, 131–139. [Google Scholar] [CrossRef] [PubMed]
  57. Baron, C.P.; KjÆrsgård, I.V.; Jessen, F.; Jacobsen, C. Protein and lipid oxidation during frozen storage of rainbow trout (Oncorhynchus mykiss). J. Agric. Food Chem. 2007, 55, 8118–8125. [Google Scholar] [CrossRef]
  58. Chaijan, M. Lipid and myoglobin oxidations in muscle foods. Songklanakarin J. Sci. Technol. 2008, 30, 47–53. [Google Scholar]
  59. Tan, M.; Lin, Z.; Zu, Y.; Zhu, B.; Cheng, S. Effect of multiple freeze-thaw cycles on the quality of instant sea cucumber: Emphatically on water status of by LF-NMR and MRI. Food Res. Int. 2018, 109, 65–71. [Google Scholar] [CrossRef]
  60. Watanabe, M.; Suzuki, T.; Ichimaida, K.; Hattori, T.; Ueda, R. Do consumers actually sense that sashimi made from frozen-thawed fish tastes worse than non-frozen one? Int. J. Refrig. 2020, 111, 94–102. [Google Scholar] [CrossRef]
  61. Zhang, B.; Hao, G.-J.; Cao, H.-J.; Tang, H.; Zhang, Y.-Y.; Deng, S.-G. The cryoprotectant effect of xylooligosaccharides on denaturation of peeled shrimp (Litopenaeus vannamei) protein during frozen storage. Food Hydrocoll. 2018, 77, 228–237. [Google Scholar] [CrossRef]
  62. Han, X.Y.; Fan, Z.Y.; Cong, J.J.; Yu, T.T.; Yu, L.Z.; Zhou, F.; Wang, X.C. Changes of Taste Substances in Frozen Tilapia (Oreochromis niloticus) Fillets during Freeze-thaw Cycles. Food Sci. 2022, 43, 269–275. [Google Scholar]
  63. Romotowska, P.E.; Karlsdóttir, M.G.; Gudjónsdóttir, M.; Kristinsson, H.G.; Arason, S. Influence of feeding state and frozen storage temperature on the lipid stability of Atlantic mackerel (Scomber scombrus). Int. J. Food Sci. Technol. 2016, 51, 1711–1720. [Google Scholar] [CrossRef]
  64. Ahmad, S.; Khan, H.; Shahab, U.; Rehman, S.; Rafi, Z.; Khan, M.Y.; Ansari, A.; Siddiqui, Z.; Ashraf, J.M.; Abdullah, S.M. Protein oxidation: An overview of metabolism of sulphur containing amino acid, cysteine. Front. Biosci. Sch. 2017, 9, 71–87. [Google Scholar] [CrossRef] [PubMed]
  65. Nurhan, U. Change in proximate, amino acid and fatty acid contents in muscle tissue of rainbow trout (Oncorhynchus mykiss) after cooking. Int. J. Food Sci. Technol. 2007, 42, 1087–1093. [Google Scholar] [CrossRef]
  66. Hang, Y.; Fu, Y.; Jin, C.; Hua, X. Effects of supplemental amino acids and bile acid in a completely replaced fish meal by enzymatically hydrolysed soybean meal diet on growth performance, liver health and fillet quality of rainbow trout (Oncorhynchus mykiss). Aquac. Res. 2022, 53, 3297–3308. [Google Scholar] [CrossRef]
  67. Wu, G. Amino acids: Metabolism, functions, and nutrition. Amino Acids 2009, 37, 1–17. [Google Scholar] [CrossRef]
  68. Zhao, F.; Zhuang, P.; Song, C.; Shi, Z.H.; Zhang, L.Z. Amino acid and fatty acid compositions and nutritional quality of muscle in the pomfret, Pampus punctatissimus. Food Chem. 2010, 118, 224–227. [Google Scholar] [CrossRef]
  69. Hu, C.; Xie, J. The Effect of Multiple Freeze-Thaw Cycles on the Microstructure and Quality of Trachurus murphyi. Foods 2021, 10, 1350. [Google Scholar] [CrossRef]
Figure 1. Impact of number of freeze-thaw cycles on color parameters (L*, a*, and b*) (a) and texture properties (b,c). Different letters indicate significant differences (p < 0.05).
Fishes 08 00108 g001
Figure 2. Impact of number of freeze-thaw cycles on pH (a), thawing loss and cooking loss (b). Different letters indicate significant differences (p < 0.05).
Fishes 08 00108 g002
Figure 3. Impact of number of F–T cycles on lipid oxidation (TBARS) (a) and protein oxidation (carbonyl content, the total sulfhydryl); (b) Different letters indicate significant differences (p < 0.05).
Fishes 08 00108 g003
Figure 4. TEM images of the rainbow trout muscles subjected to different freeze-thaw cycles ((a) fresh meat; (bf) 1st F–T cycle, 3rd F–T cycle, 5th F–T cycle, 7th F–T cycle and 9th F–T cycle). Scale bar = 500 nm.
Fishes 08 00108 g004
Figure 5. Impact of number of freeze-thaw cycles on the proximate composition. Different letters indicate significant differences (p < 0.05). DW means dry weight.
Fishes 08 00108 g005
Table 1. Amino acid composition (g/100 g dry weight) of O.mykiss in varying freeze-thaw (F–T) cycles.
Amino acidFreshF–T 1F–T 3F–T 5F–T 7F–T 9
Threonine 3.68 ± 0.03 a3.73 ± 0.11 a3.56 ± 0.06 a3.43 ± 0.16 b3.13 ± 0.09 c2.98 ± 0.12 c
Valine 4.13 ± 0.04 a3.84 ± 0.08 b3.80 ± 0.07 b3.60 ± 0.03 c3.57 ± 0.12 c3.41 ± 0.10 d
Methionine 2.33 ± 0.03 a2.31 ± 0.10 a2.13 ± 0.07 b2.01 ± 0.08 b1.51 ± 0.11 c1.44 ± 0.06 c
Isoleucine 3.18 ± 0.07 a3.20 ± 0.09 a3.15 ± 0.04 a3.00 ± 0.12 b2.93 ± 0.05 b2.89 ± 0.07 b
Phenylalanine3.35 ± 0.20 a3.31 ± 0.11 ab3.26 ± 0.11 ab3.13 ± 0.04 b3.04 ± 0.08 b2.98 ± 0.07 b
Lysine 6.87 ± 0.08 a6.70 ± 0.15 ab6.53 ± 0.11 b5.95 ± 0.07 c4.31 ± 0.13 d4.23 ± 0.09 d
Leucine 6.37 ± 0.07 a6.29 ± 0.16 a6.04 ± 0.07 b5.75 ± 0.05 c5.22 ± 0.14 d5.07 ± 0.09 d
Histidine 1.83 ± 0.03 a1.79 ± 0.08 ab1.75 ± 0.06 ab1.68 ± 0.06 b1.63 ± 0.14 b1.59 ± 0.04 b
Arginine 4.54 ± 0.07 a4.60 ± 0.13 a4.41 ± 0.10 b4.29 ± 0.07 bc4.17 ± 0.10 c3.95 ± 0.06 d
EAAs A36.28 ± 0.22 a35.77 ± 0.60 a34.63 ± 0.37 b32.75 ± 0.34 c29.51 ± 0.59 d28.54 ± 0.36 e
Aspartic acid7.78 ± 0.03 a7.82 ± 0.08 a7.75 ± 0.06 a7.64 ± 0.04 b7.58 ± 0.04 bc7.51 ± 0.03 c
Glutamic acid12.95 ± 0.23 a12.53 ± 0.11 b12.07 ± 0.34 c11.83 ± 0.21 cd11.60 ± 0.10 d11.53 ± 0.15 d
Glycine 3.73 ± 0.09 ab3.84 ± 0.04 a3.62 ± 0.08 b3.45 ± 0.07 bc3.31 ± 0.16 c3.29 ± 0.14 c
Alanine 4.49 ± 0.09 ab4.61 ± 0.09 a4.46 ± 0.09 ab4.53 ± 0.12 a4.45 ± 0.06 ab4.34 ± 0.10 b
Serine 3.40 ± 0.04 a3.41 ± 0.06 a3.39 ± 0.11 a3.37 ± 0.11 a3.33 ± 0.09 a3.32 ± 0.08 a
Cystine 0.59 ± 0.02 a0.54 ± 0.05 a0.51 ± 0.07 ab0.48 ± 0.08 ab0.40 ± 0.09 b0.37 ± 0.05 b
Tyrosine 2.94 ± 0.05 a2.79 ± 0.09 b2.70 ± 0.07 b2.57 ± 0.05 c2.39 ± 0.05 d2.21 ± 0.07 e
Proline 1.68 ± 0.09 a1.69 ± 0.03 a1.65 ± 0.09 a1.57 ± 0.13 ab1.43 ± 0.09 b1.23 ± 0.10 c
NEAAs B37.56 ± 0.45 a37.23 ± 0.23 a36.15 ± 0.52 b35.45 ± 0.31 c34.49 ± 0.32 d33.79 ± 0.19 e
TAAs C73.84 ± 0.60 a73.00 ± 0.82 a70.78 ± 0.87 b68.20 ± 0.39 c64.00 ± 0.62 d62.33 ± 0.45 e
EAAs/TAAs0.490.490.490.480.460.46
EAAs/NEAAs0.970.960.960.920.860.84
Data were expressed as mean ± SD (n = 3). A EAAs: essential amino acids. B NEAAs: non-essential amino acids. C TAAs: total amino acids. Different lowercase letters indicate significant differences (p < 0.05)
Disclaimer/Publisher’s Note: The statements, opinions and data contained in all publications are solely those of the individual author(s) and contributor(s) and not of MDPI and/or the editor(s). MDPI and/or the editor(s) disclaim responsibility for any injury to people or property resulting from any ideas, methods, instructions or products referred to in the content.

