
Effects of Increased Temperature on Brain and Sensory Development in the Port Jackson Shark (Heterodontus portusjacksoni)

 , ,
, ,  , and
, and
Abstract
1. Introduction
2. Materials and Methods
2.1. Embryonic Growth and Development
2.2. Magnetic Resonance Imaging (MRI)
2.2.1. Anatomical Imaging
2.2.2. Segmentation of MR Images
2.3. Tissue Processing
2.4. Statistics
3. Results
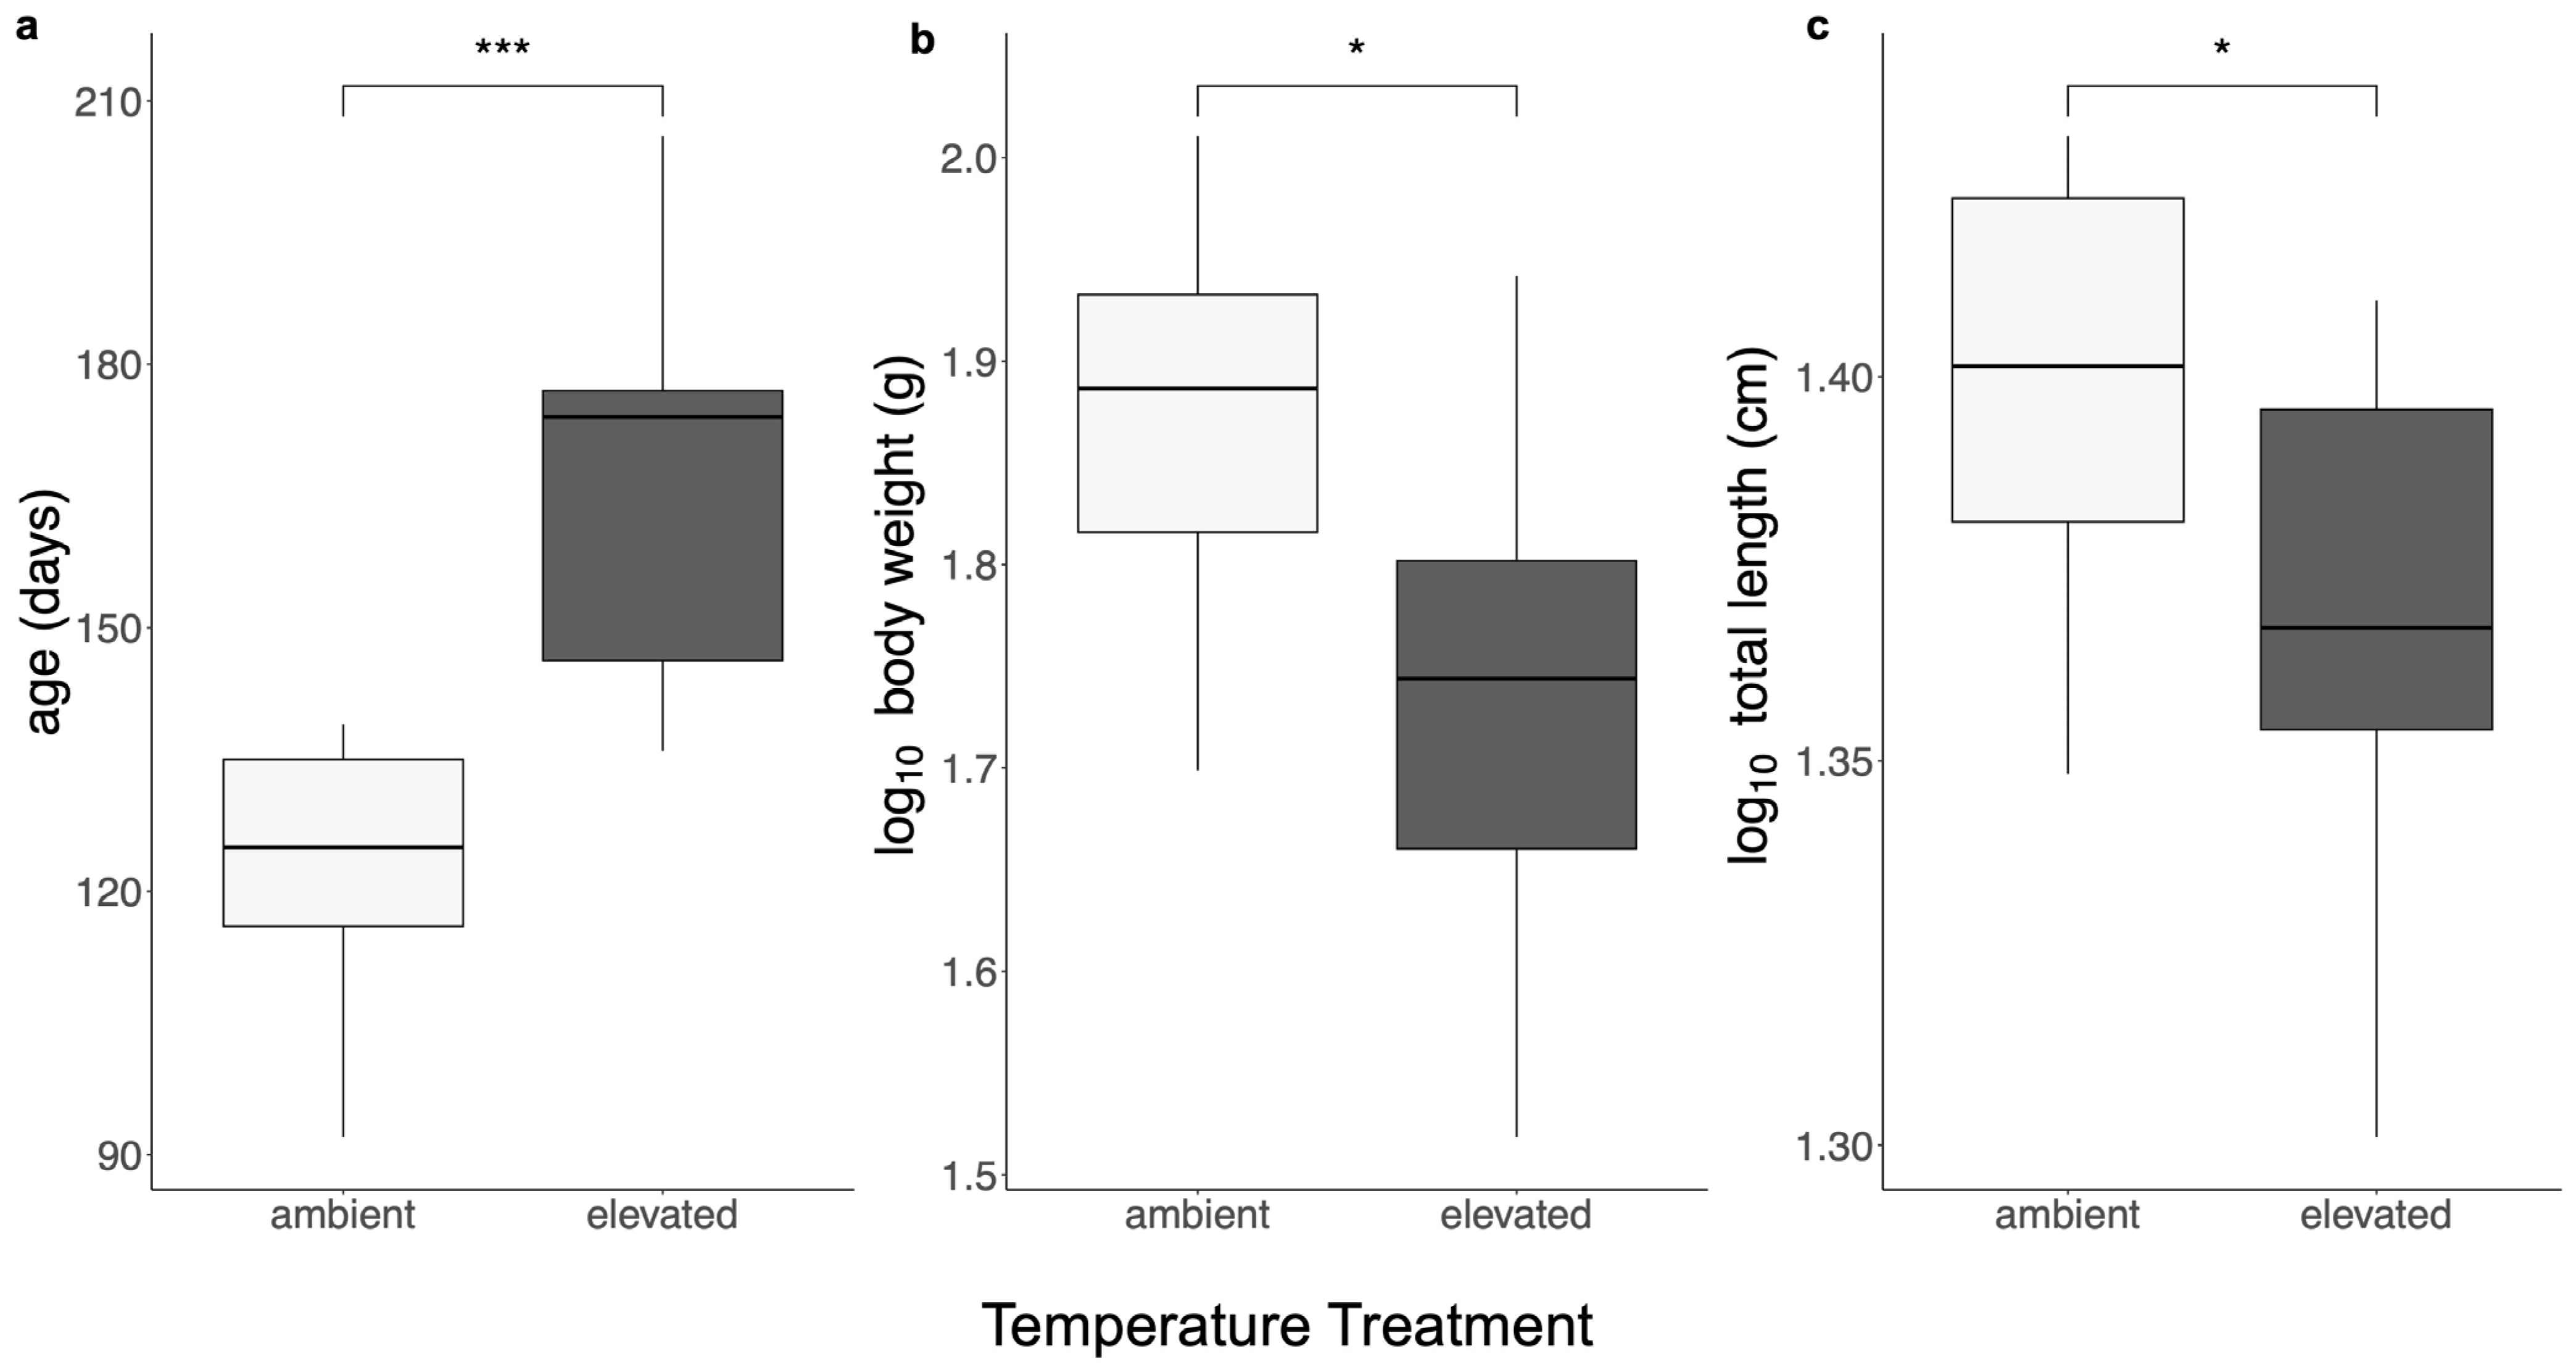
3.1. Body Size
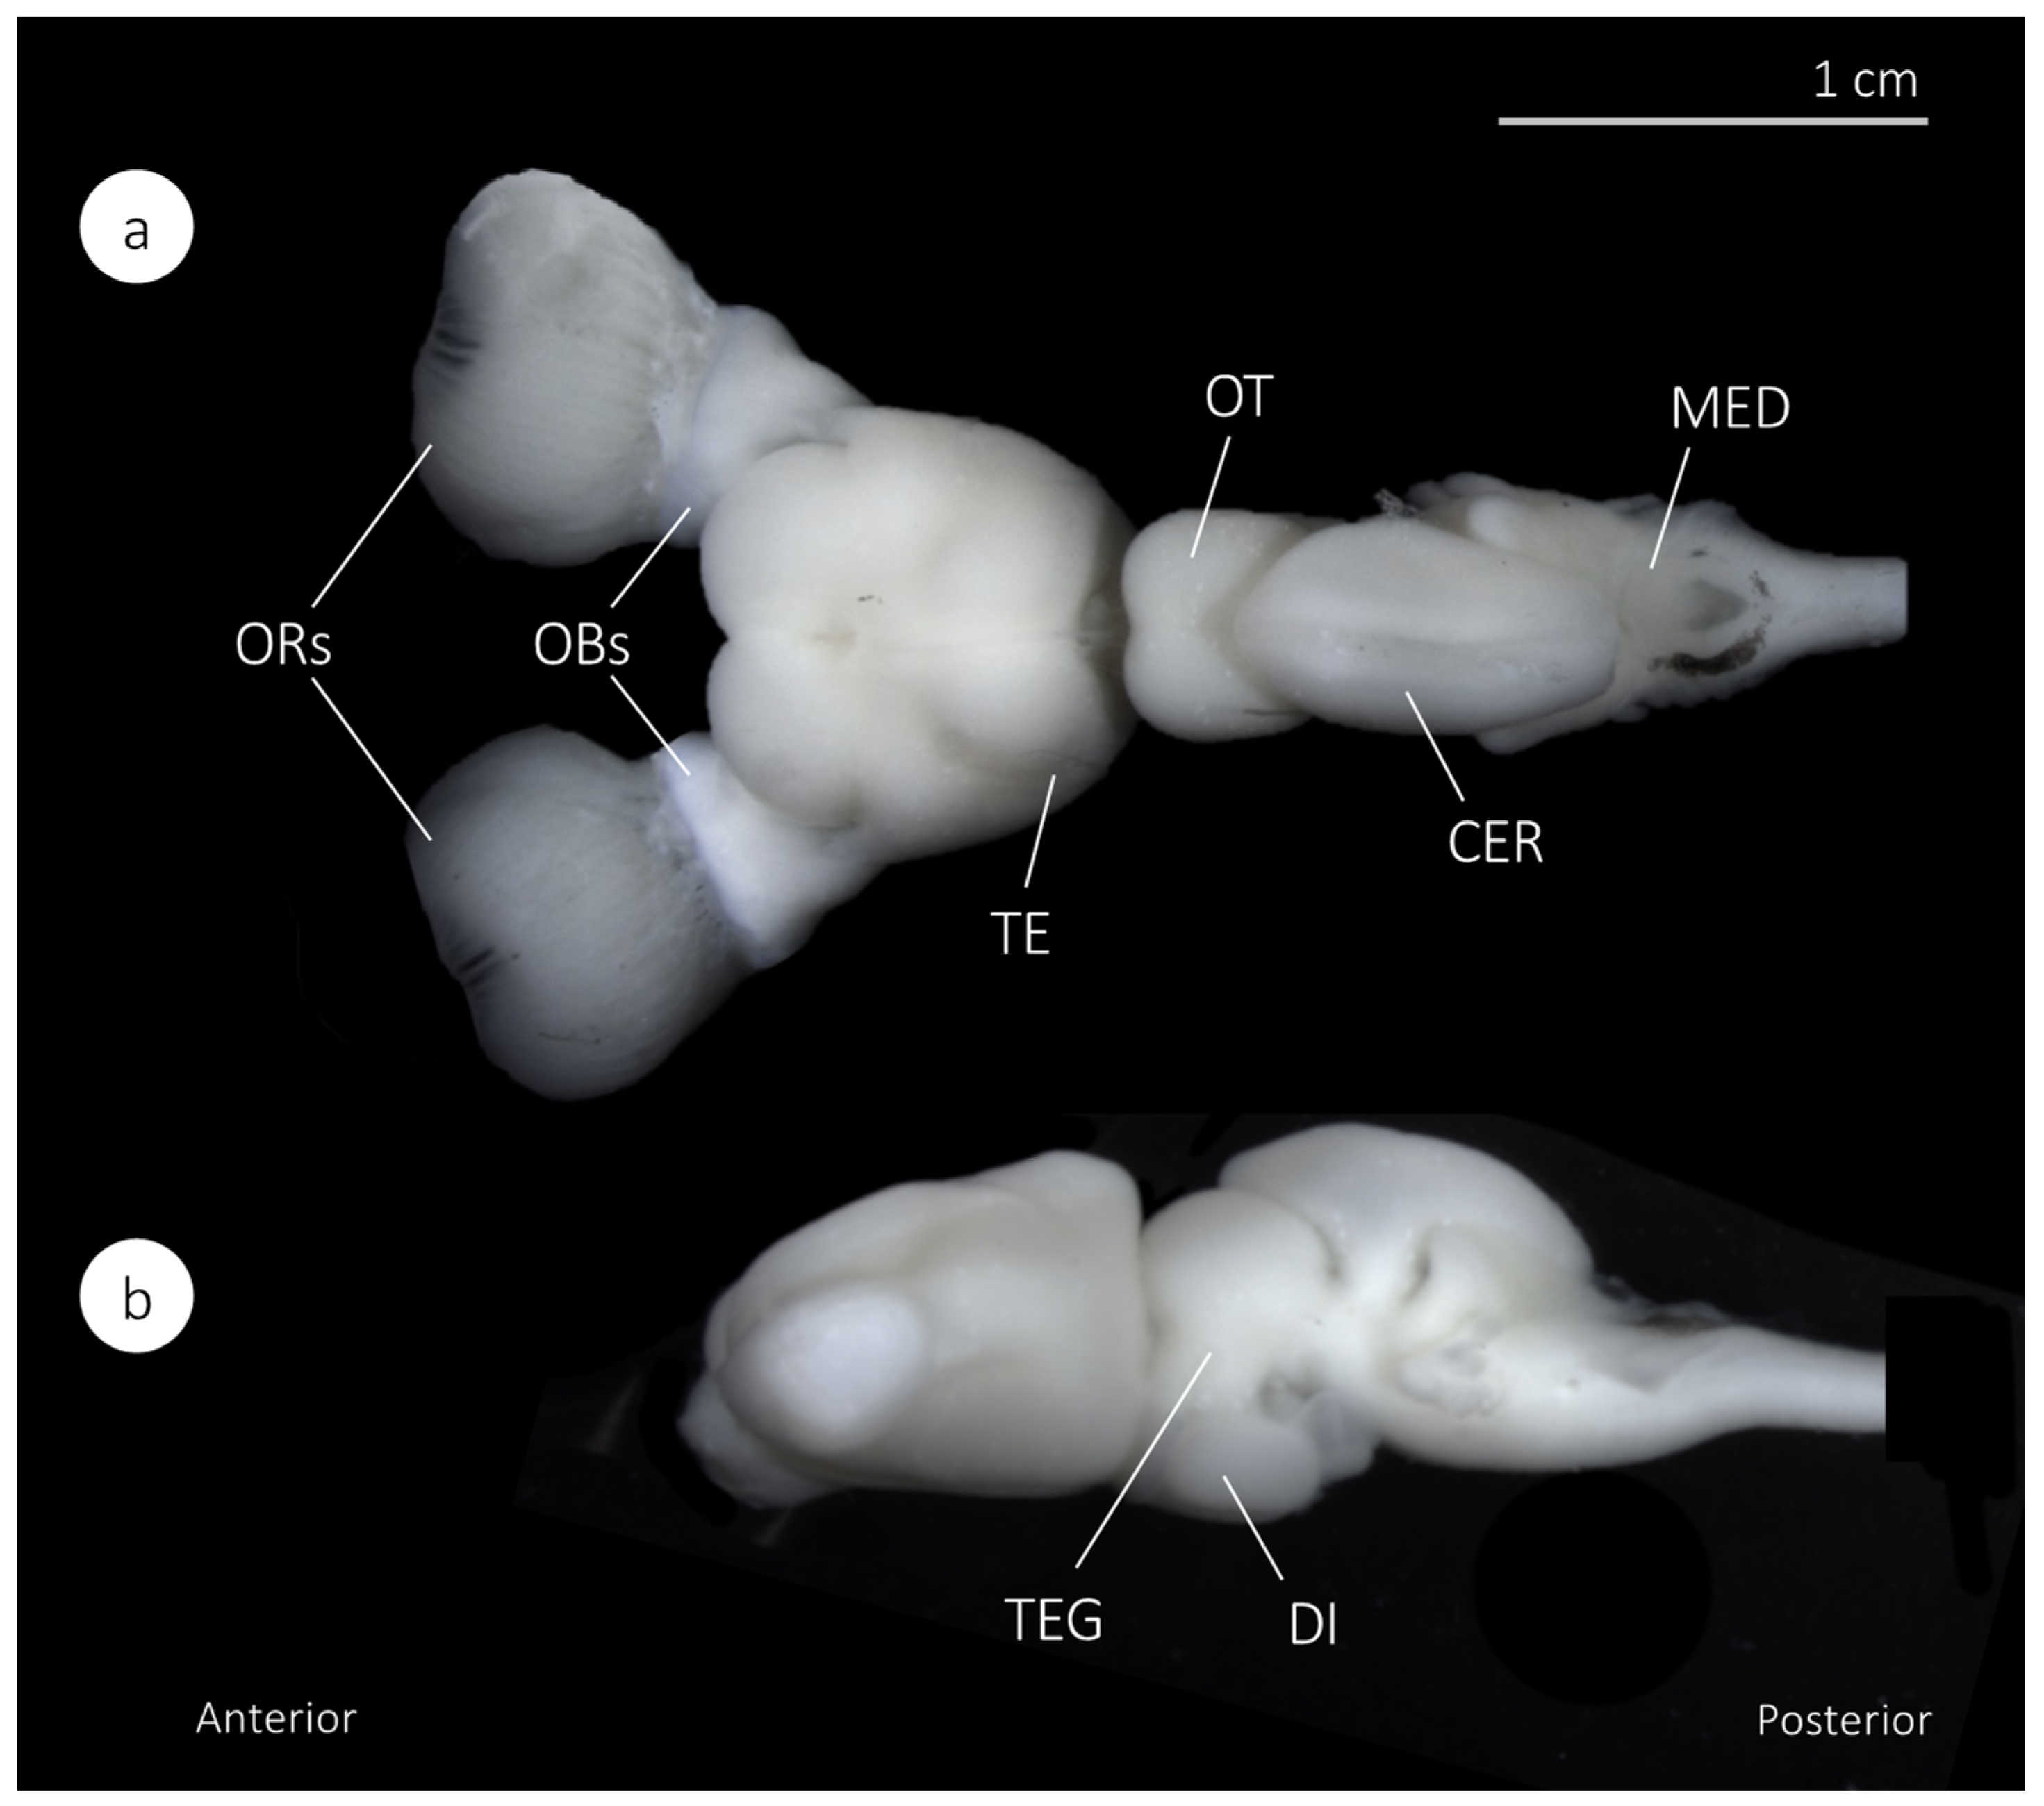
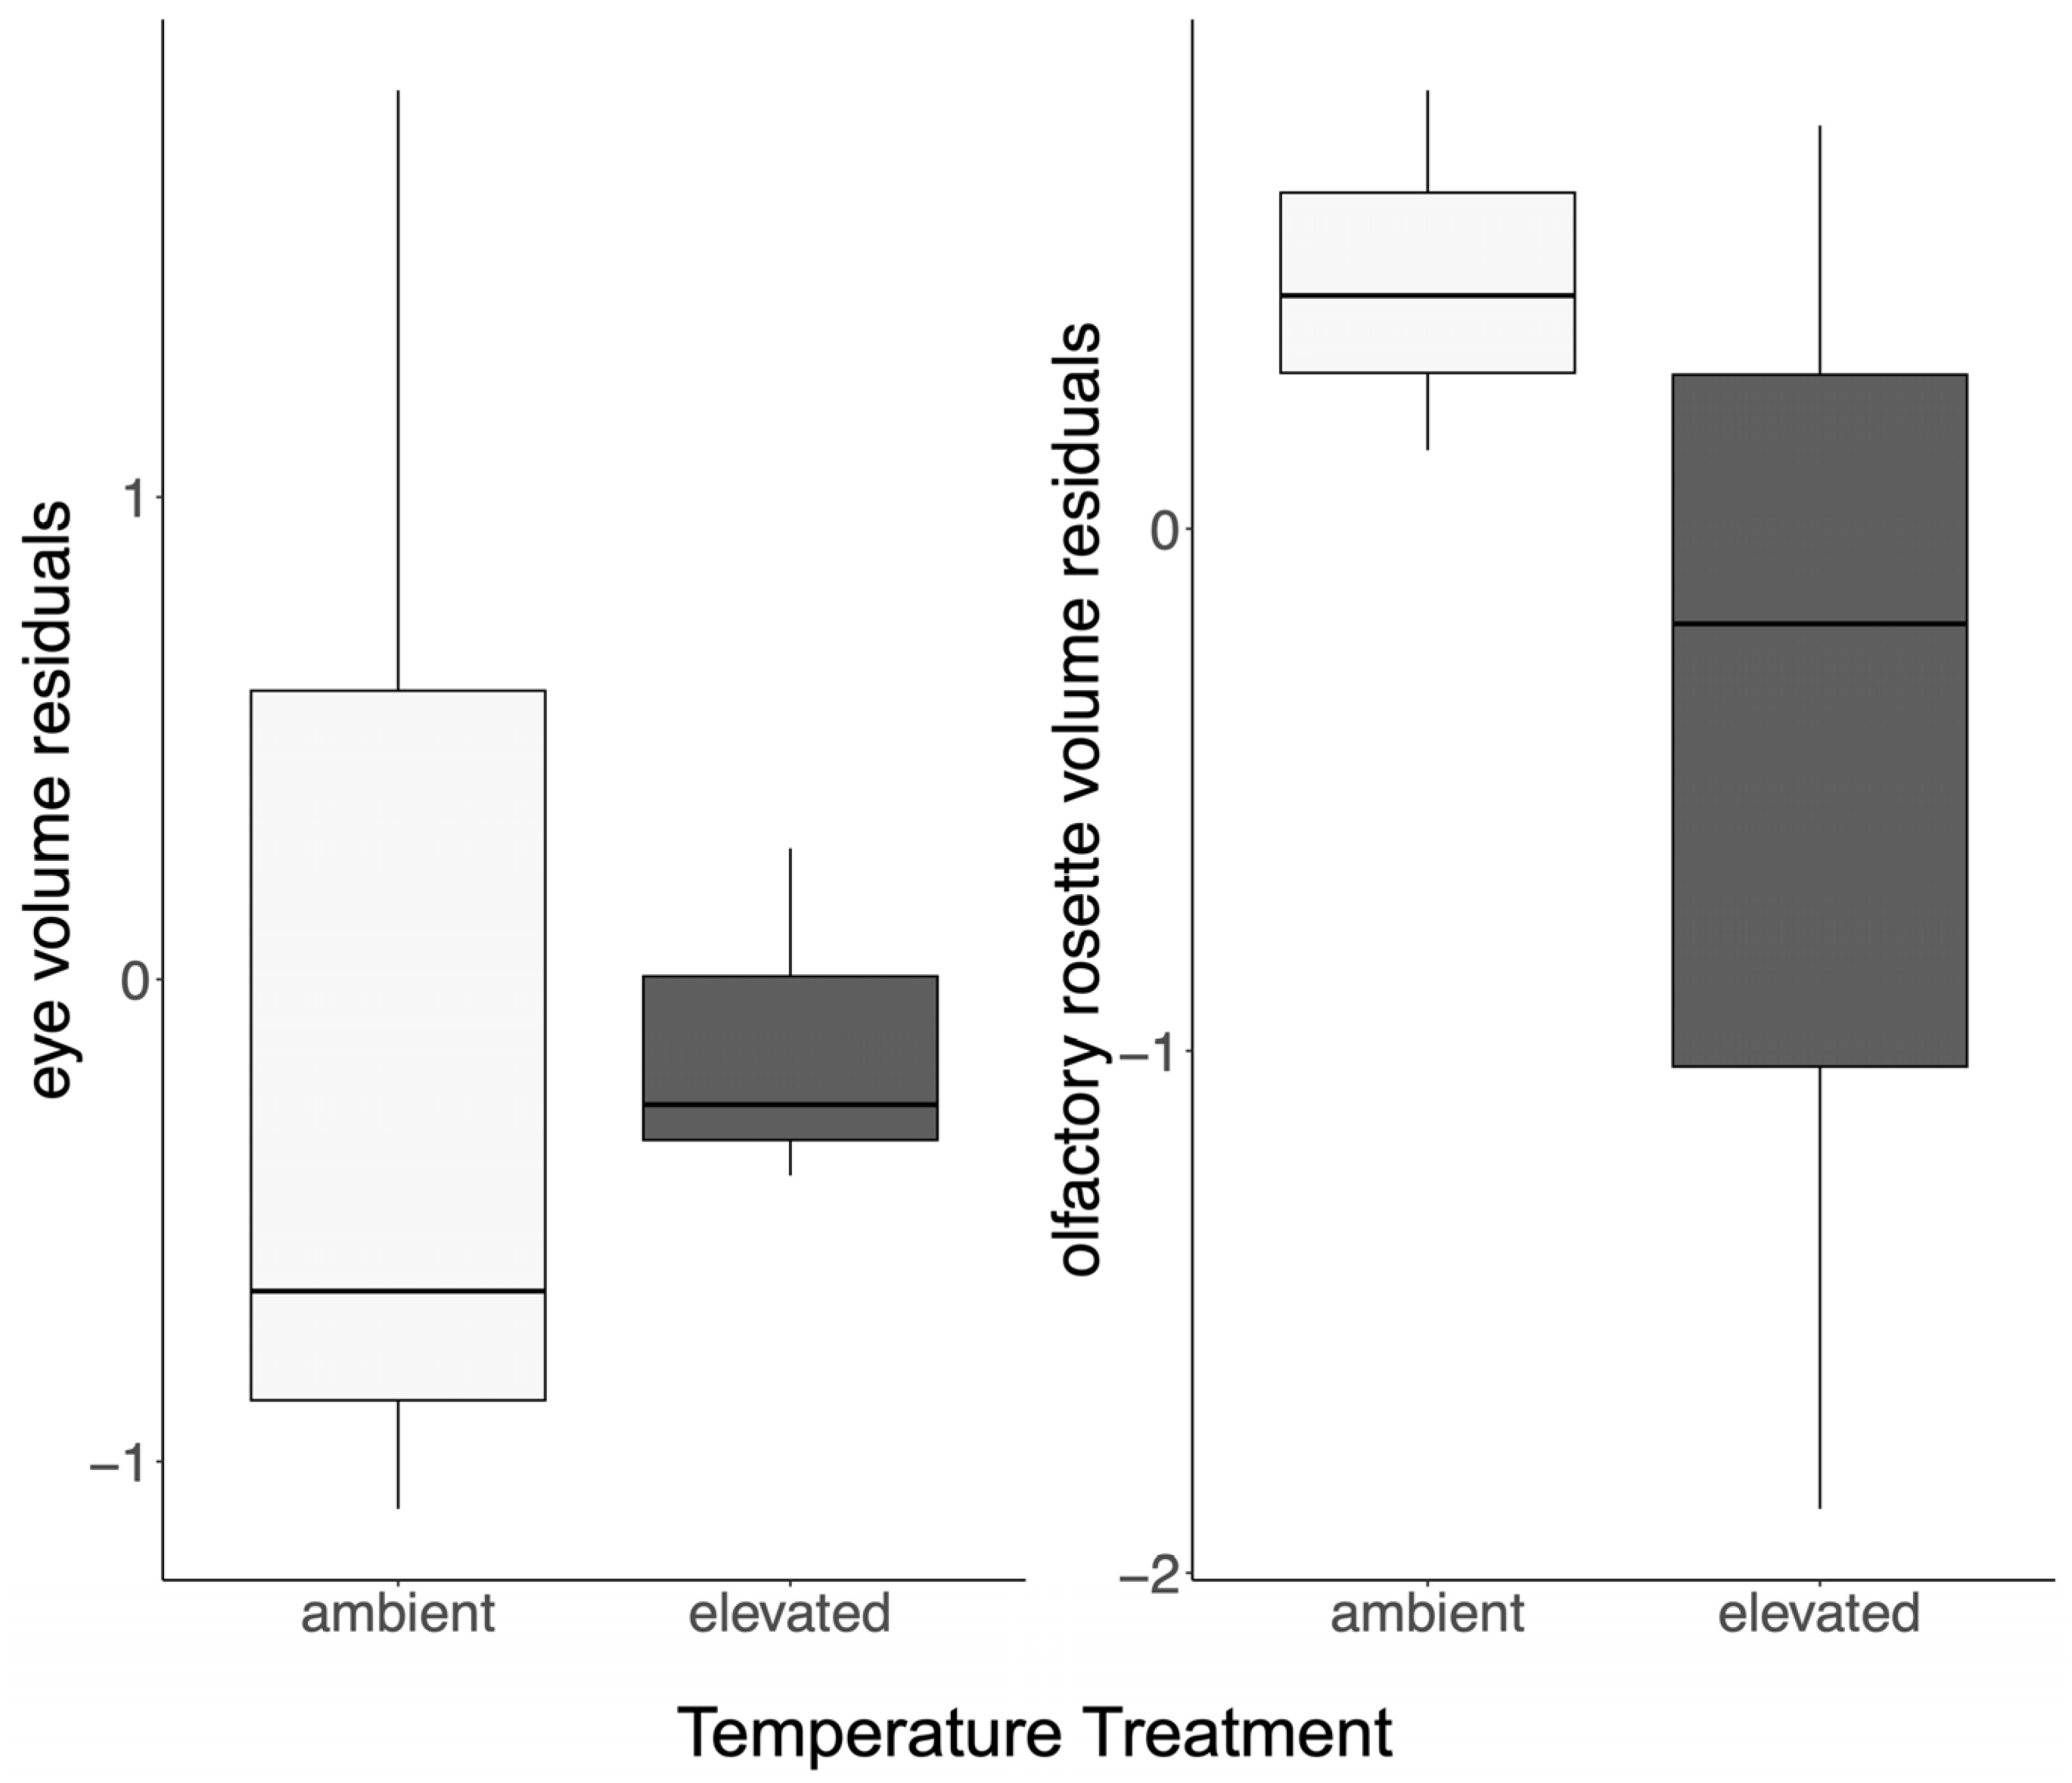
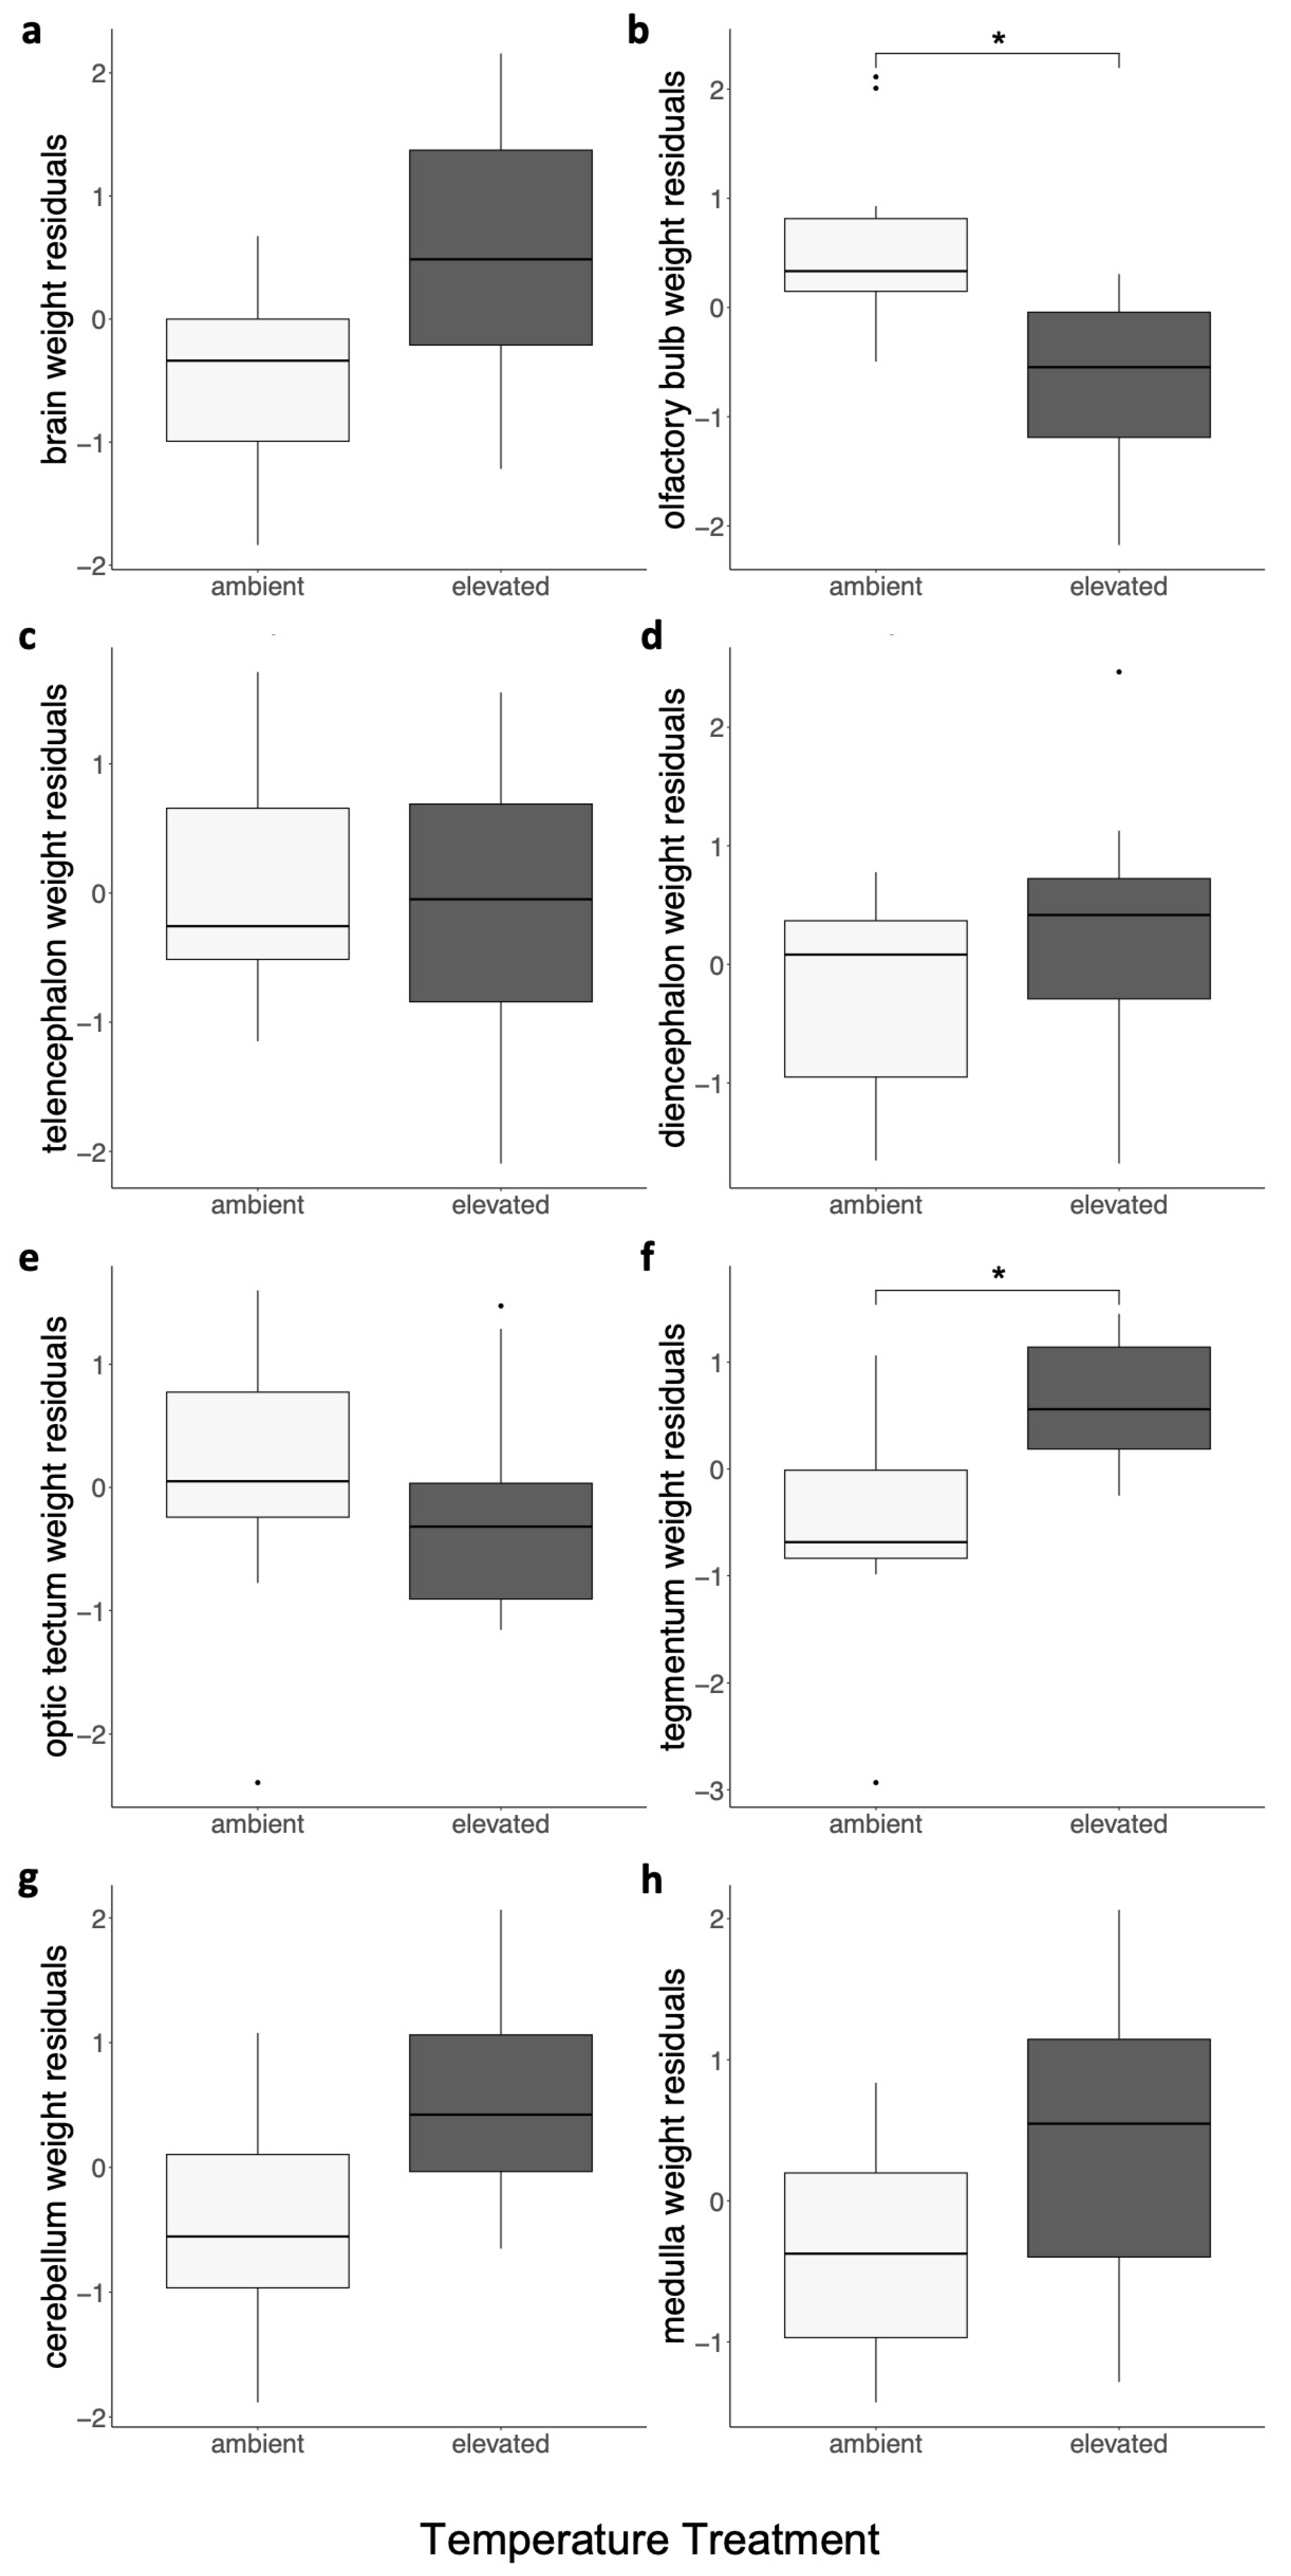
3.2. The Nervous System
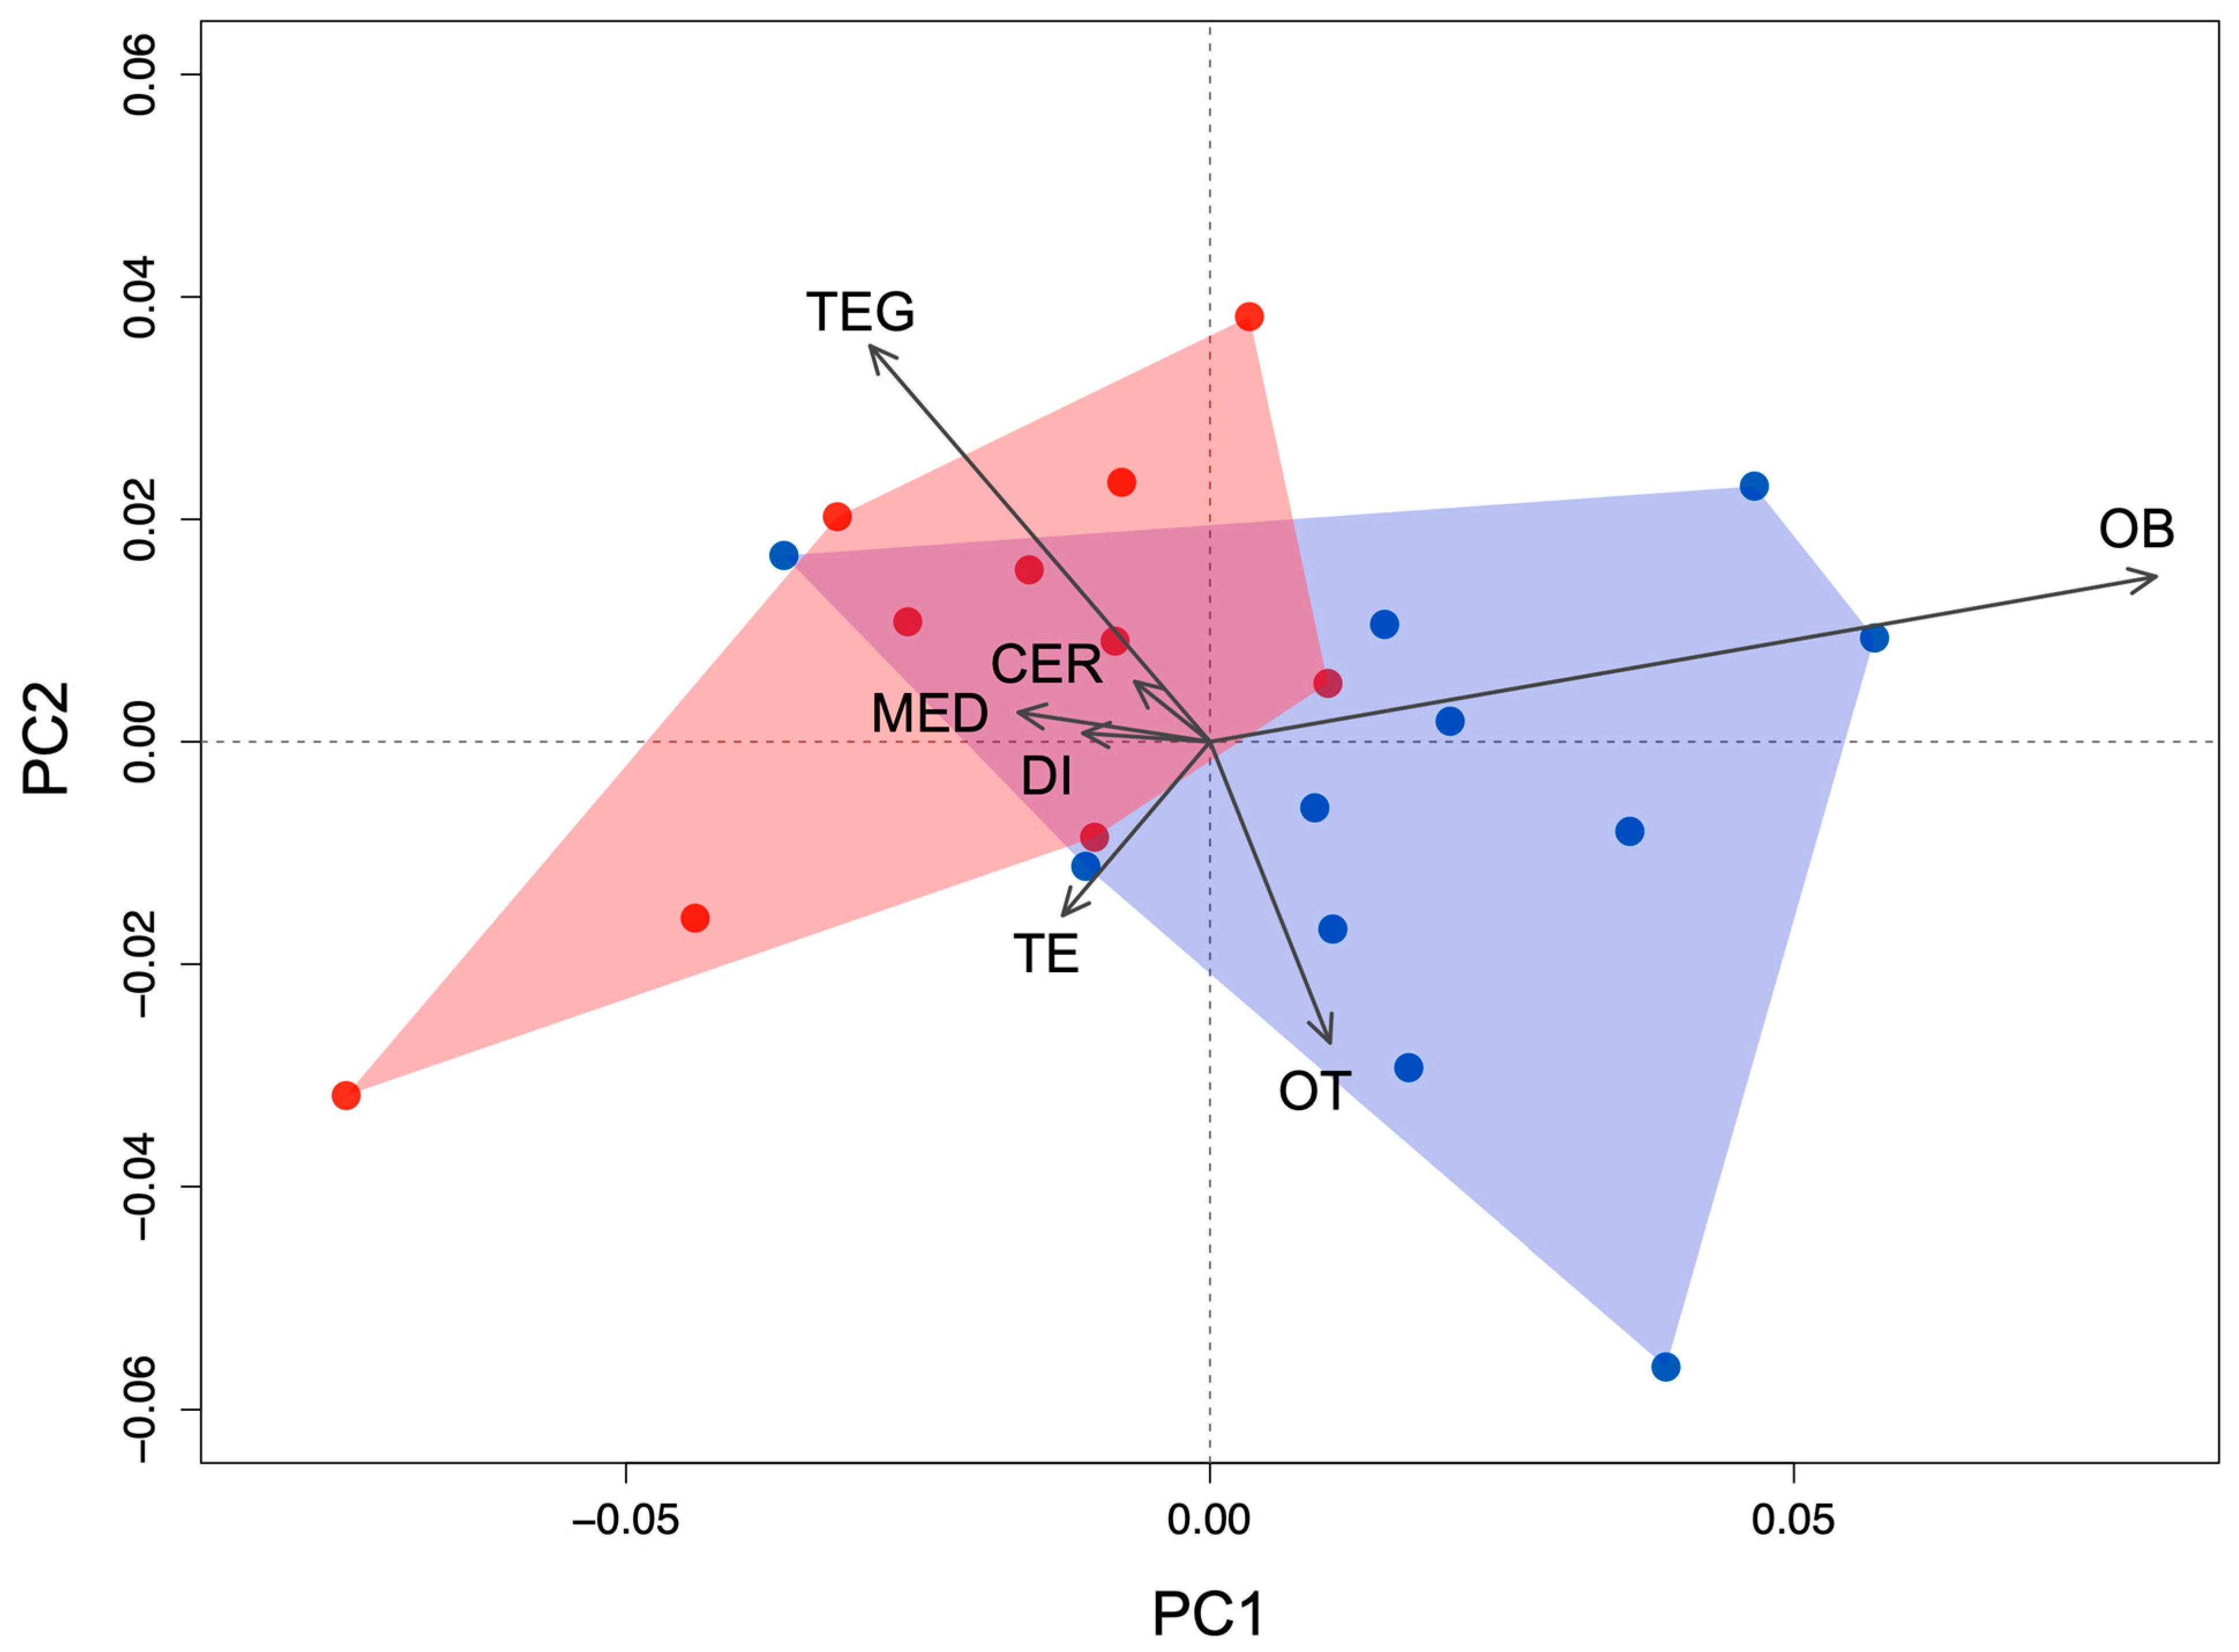
3.3. Principal Component Analysis
4. Discussion
5. Conclusions
Supplementary Materials
Author Contributions
Funding
Institutional Review Board Statement
Data Availability Statement
Acknowledgments
Conflicts of Interest
References
- Pörtner, H.-O.; Karl, D.M.; Boyd, P.W.; Cheung, W.; Lluch-Cota, S.E.; Nojiri, Y.; Schmidt, D.N.; Zavialov, P.O.; Alheit, J.; Aristegui, J. Ocean systems. In Climate Change 2014: Impacts, Adaptation, and Vulnerability. Part A: Global and Sectoral Aspects. Contribution of Working Group II to the Fifth Assessment Report of the Intergovernmental Panel on Climate Change; Cambridge University Press: Cambridge, UK, 2014; pp. 411–484. [Google Scholar]
- Stocker, T. Climate Change 2013: The Physical Science Basis: Working Group I Contribution to the Fifth Assessment Report of the Intergovernmental Panel on Climate Change; Cambridge University Press: Cambridge, UK, 2014. [Google Scholar]
- Pörtner, H.-O.; Roberts, D.C.; Poloczanska, E.; Mintenbeck, K.; Tignor, M.; Alegría, A.; Craig, M.; Langsdorf, S.; Löschke, S.; Möller, V. 2022: Summary for Policymakers; IPCC: Geneva, Switzerland, 2022. [Google Scholar]
- Pinsky, M.L.; Eikeset, A.M.; McCauley, D.J.; Payne, J.L.; Sunday, J.M. Greater vulnerability to warming of marine versus terrestrial ectotherms. Nature 2019, 569, 108–111. [Google Scholar] [CrossRef] [PubMed]
- Pörtner, H.O.; Knust, R. Climate change affects marine fishes through the oxygen limitation of thermal tolerance. Science 2007, 315, 95–97. [Google Scholar] [CrossRef] [PubMed]
- Kovach, R.P.; Gharrett, A.J.; Tallmon, D.A. Genetic change for earlier migration timing in a pink salmon population. Proc. R. Soc. B Biol. Sci. 2012, 279, 3870–3878. [Google Scholar] [CrossRef] [PubMed]
- Cheung, W.W.; Watson, R.; Pauly, D. Signature of ocean warming in global fisheries catch. Nature 2013, 497, 365–368. [Google Scholar] [CrossRef] [PubMed]
- Perry, A.L.; Low, P.J.; Ellis, J.R.; Reynolds, J.D. Climate change and distribution shifts in marine fishes. Science 2005, 308, 1912–1915. [Google Scholar] [CrossRef] [PubMed]
- Pörtner, H.-O.; Bock, C.; Knust, R.; Lannig, G.; Lucassen, M.; Mark, F.C.; Sartoris, F.J. Cod and climate in a latitudinal cline: Physiological analyses of climate effects in marine fishes. Clim. Res. 2008, 37, 253–270. [Google Scholar] [CrossRef]
- Takasuka, A.; Oozeki, Y.; Kubota, H. Multi-species regime shifts reflected in spawning temperature optima of small pelagic fish in the western North Pacific. Mar. Ecol. Prog. Ser. 2008, 360, 211–217. [Google Scholar] [CrossRef]
- Brunel, T.; Dickey-Collas, M. Effects of temperature and population density on von Bertalanffy growth parameters in Atlantic herring: A macro-ecological analysis. Mar. Ecol. Prog. Ser. 2010, 405, 15–28. [Google Scholar] [CrossRef]
- Philippart, C.J.; Anadón, R.; Danovaro, R.; Dippner, J.W.; Drinkwater, K.F.; Hawkins, S.J.; Oguz, T.; O’Sullivan, G.; Reid, P.C. Impacts of climate change on European marine ecosystems: Observations, expectations and indicators. J. Exp. Mar. Biol. Ecol. 2011, 400, 52–69. [Google Scholar] [CrossRef]
- Angilletta, M.J. Thermal Adaptation: A Theoretical and Empirical Synthesis; Oxford University Press: Oxford, UK, 2009. [Google Scholar]
- Tewksbury, J.J.; Huey, R.B.; Deutsch, C.A. Putting the heat on tropical animals. Science 2008, 320, 1296–1297. [Google Scholar] [CrossRef]
- Pörtner, H.O.; Farrell, A.P. Physiology and climate change. Science 2008, 322, 690–692. [Google Scholar] [CrossRef] [PubMed]
- Parsons, G.R. Geographic variation in reproduction between two populations of the bonnethead shark, Sphyrna tiburo. Development 1993, 38, 25–35. [Google Scholar]
- Aiello, L.C.; Wheeler, P. The expensive-tissue hypothesis: The brain and the digestive system in human and primate evolution. Curr. Anthropol. 1995, 36, 199–221. [Google Scholar] [CrossRef]
- Sol, D.; Price, T.D. Brain size and the diversification of body size in birds. Am. Nat. 2008, 172, 170–177. [Google Scholar] [CrossRef] [PubMed]
- Kotrschal, A.; Rogell, B.; Bundsen, A.; Svensson, B.; Zajitschek, S.; Brännström, I.; Immler, S.; Maklakov, A.A.; Kolm, N. Artificial selection on relative brain size in the guppy reveals costs and benefits of evolving a larger brain. Curr. Biol. 2013, 23, 168–171. [Google Scholar] [CrossRef] [PubMed]
- Roth, G.; Dicke, U. Evolution of the brain and intelligence. Trends Cogn. Sci. 2005, 9, 250–257. [Google Scholar] [CrossRef] [PubMed]
- Martin, R.D. Relative brain size and basal metabolic rate in terrestrial vertebrates. Nature 1981, 293, 57–60. [Google Scholar] [CrossRef]
- Isler, K.; van Schaik, C.P. Metabolic costs of brain size evolution. Biol. Lett. 2006, 2, 557–560. [Google Scholar] [CrossRef]
- Isler, K.; van Schaik, C.P. Why are there so few smart mammals (but so many smart birds)? Biol. Lett. 2009, 5, 125–129. [Google Scholar] [CrossRef]
- Gillooly, J.F.; McCoy, M.W. Brain size varies with temperature in vertebrates. PeerJ 2014, 2, e301. [Google Scholar] [CrossRef]
- Northcutt, R. Brain Organization in the Cartilaginous Fishes. In Sensory Biology of Sharks, Skates, and Rays; Hodgson, E.S., Mathewson, R.F., Eds.; Office of Naval Research: Arlington, VA, USA, 1978; pp. 117–194. [Google Scholar]
- Northcutt, R.G. Elasmobranch central nervous system organization and its possible evolutionary significance. Am. Zool. 1977, 17, 411–429. [Google Scholar] [CrossRef]
- Kruska, D.C.T. The brain of the basking shark (Cetorhinus maximus). Brain Behav. Evol. 1988, 32, 353–363. [Google Scholar] [CrossRef] [PubMed]
- Demski, L.S. The Brain and Cranial Nerves of the White Shark—An Evolutionary Perspective. In Great White Sharks; Karger: Basel, Switzerland, 1996; pp. 121–130. [Google Scholar] [CrossRef]
- Ari, C. Encephalization and brain organization of Mobulid rays (Myliobatiformes, Elasmobranchii) with ecological perspectives. Open Anat. J. 2011, 3, 1–13. [Google Scholar] [CrossRef]
- Puzdrowski, R.L.; Gruber, S. Morphologic features of the cerebellum of the Atlantic stingray, and their possible evolutionary significance. Integr. Zool. 2009, 4, 110–122. [Google Scholar] [CrossRef] [PubMed]
- Yopak, K.E.; Lisney, T.J. Allometric scaling of the optic tectum in cartilaginous fishes. Brain Behav. Evol. 2012, 80, 108–126. [Google Scholar] [CrossRef] [PubMed]
- Yopak, K.E.; Lisney, T.J.; Collin, S.P.; Montgomery, J.C. Variation in brain organization and cerebellar foliation in chondrichthyans: Sharks and holocephalans. Brain Behav. Evol. 2007, 69, 280–300. [Google Scholar] [CrossRef] [PubMed]
- Mull, C.G.; Yopak, K.E.; Dulvy, N.K. Does more maternal investment mean a larger brain? Evolutionary relationships between reproductive mode and brain size in chondrichthyans. Mar. Freshw. Res. 2011, 62, 567–575. [Google Scholar] [CrossRef]
- Mull, C.G.; Yopak, K.E.; Dulvy, N.K. Maternal investment, ecological lifestyle, and brain evolution in sharks and rays. Am. Nat. 2020, 195, 1056–1069. [Google Scholar] [CrossRef]
- Brandstätter, R.; Kotrschal, K. Brain growth patterns in four European cyprinid fish species (Cyprinidae, Teleostei): Roach (Rutilus rutilus), bream (Abramis brama), common carp (Cyprinus carpio) and sabre carp (Pelecus cultratus). Brain Behav. Evol. 1990, 35, 195–211. [Google Scholar] [CrossRef]
- Iwaniuk, A.N.; Hurd, P.L.; Wylie, D.R. Comparative morphology of the avian cerebellum: I. Degree of foliation. Brain Behav. Evol. 2006, 68, 45–62. [Google Scholar] [CrossRef]
- Campi, K.L.; Krubitzer, L. Comparative studies of diurnal and nocturnal rodents: Differences in lifestyle result in alterations in cortical field size and number. J. Comp. Neurol. 2010, 518, 4491–4512. [Google Scholar] [CrossRef] [PubMed]
- Macrì, S.; Savriama, Y.; Khan, I.; Di-Poï, N. Comparative analysis of squamate brains unveils multi-level variation in cerebellar architecture associated with locomotor specialization. Nat. Commun. 2019, 10, 1–16. [Google Scholar] [CrossRef] [PubMed]
- Gonda, A.; Herczeg, G.b.; Meril, J. Evolutionary ecology of intraspecific brain size variation: A review. Ecol. Evol. 2013, 3, 2751–2764. [Google Scholar] [CrossRef] [PubMed]
- Rosenzweig, M.R.; Bennett, E.L. Psychobiology of plasticity: Effects of training and experience on brain and behavior. Behav. Brain Res. 1996, 78, 57–65. [Google Scholar] [CrossRef] [PubMed]
- van Praag, H.; Kempermann, G.; Gage, F.H. Neural consequences of environmental enrichment. Nat. Rev. Neurosci. 2000, 1, 191–198. [Google Scholar] [CrossRef] [PubMed]
- Kempermann, G.; Kuhn, H.G.; Gage, F.H. More hippocampal neurons in adult mice living in an enriched environment. Nature 1997, 386, 493–495. [Google Scholar] [CrossRef] [PubMed]
- LaDage, L.D.; Roth, T.C.; Fox, R.A.; Pravosudov, V.V. Effects of captivity and memory-based experiences on the hippocampus in mountain chickadees. Behav. Neurosci. 2009, 123, 284–291. [Google Scholar] [CrossRef]
- Rosier, R.L.; Langkilde, T. Does environmental enrichment really matter? A case study using the eastern fence lizard, Sceloporus undulatus. Appl. Anim. Behav. Sci. 2011, 131, 71–76. [Google Scholar] [CrossRef]
- Kihslinger, R.L.; Nevitt, G.A. Early rearing environment impacts cerebellar growth in juvenile salmon. J. Exp. Biol. 2006, 209, 504–509. [Google Scholar] [CrossRef]
- Smulders, T.; Sasson, A.; DeVoogd, T. Seasonal variation in hippocampal volume in a food-storing bird, the black-capped chickadee. J. Neurobiol. 1995, 27, 15–25. [Google Scholar] [CrossRef]
- Yaskin, V.A. Seasonal changes in hippocampus size and spatial behavior in mammals and birds. Biol. Bull. Rev. 2011, 1, 279–288. [Google Scholar] [CrossRef]
- McCallum, E.S.; Capelle, P.M.; Balshine, S. Seasonal plasticity in telencephalon mass of a benthic fish. J. Fish Biol. 2014, 85, 1785–1792. [Google Scholar] [CrossRef] [PubMed]
- Pyter, L.M.; Reader, B.F.; Nelson, R.J. Short photoperiods impair spatial learning and alter hippocampal dendritic morphology in adult male white-footed mice (Peromyscus leucopus). J. Neurosci. 2005, 25, 4521–4526. [Google Scholar] [CrossRef] [PubMed]
- Macrini, T.E.; Rowe, T.; VandeBerg, J.L. Cranial endocasts from a growth series of Monodelphis domestica (Didelphidae, Marsupialia): A study of individual and ontogerietic variation. J. Morphol. 2007, 268, 844–865. [Google Scholar] [CrossRef] [PubMed]
- Bauchot, R.; Bauchot, M.L.; Platel, R.; Ridet, J.M. Brains of Hawaiian tropical fishes: Brain size and evolution. Copeia 1977, 1997, 42–46. [Google Scholar] [CrossRef]
- Huber, R.; Rylander, M.K. Brain morphology and turbidity preference in Notropis and related genera (Cyprinidae, Teleostei). Environ. Biol. Fish. 1992, 33, 153–165. [Google Scholar] [CrossRef]
- Huber, R.; van Staaden, M.J.; Kaufman, L.S.; Liem, K.F. Microhabitat use, trophic patterns, and the evolution of brain structure in African cichlids. Brain Behav. Evol. 1997, 50, 167–182. [Google Scholar] [CrossRef]
- Kotrschal, K.; Van Staaden, M.; Huber, R. Fish brains: Evolution and environmental relationships. Rev. Fish Biol. Fish. 1998, 8, 373–408. [Google Scholar] [CrossRef]
- Lisney, T.J.; Yopak, K.E.; Camilieri-Asch, V.; Collin, S.P. Ontogenetic shifts in brain organization in the bluespotted stingray Neotrygon kuhlii (Chondrichthyes: Dasyatidae). Brain Behav. Evol. 2017, 2017, 68–83. [Google Scholar] [CrossRef]
- Laforest, K.V.; Peele, E.E.; Yopak, K.E. Ontogenetic shifts in brain size and brain organization of the Atlantic sharpnose shark, Rhizoprionodon terraenovae. Brain Behav. Evol. 2020, 95, 162–180. [Google Scholar] [CrossRef]
- Sebens, K.P. The ecology of indeterminate growth in animals. Annu. Rev. Ecol. Syst. 1987, 18, 371–407. [Google Scholar] [CrossRef]
- Bauchot, R.; Diagne, M.; Ribet, J.M. Post-hatching growth and allometry of the teleost brain. J. Für Hirnforsch. 1979, 20, 29–34. [Google Scholar]
- Grandel, H.; Kaslin, J.; Ganz, J.; Wenzel, I.; Brand, M. Neural stem cells and neurogenesis in the adult zebrafish brain: Origin, proliferation dynamics, migration and cell fate. Dev. Biol. 2006, 295, 263–277. [Google Scholar] [CrossRef] [PubMed]
- Hinsch, K.; Zupanc, G.K.H. Generation and long-term persistence of new neurons in the adult zebrafish brain: A quantitative analysis. Neuroscience 2007, 146, 679–696. [Google Scholar] [CrossRef] [PubMed]
- Zupanc, G.K. Adult neurogenesis and neuronal regeneration in the brain of teleost fish. J. Physiol.-Paris 2008, 102, 357–373. [Google Scholar] [CrossRef] [PubMed]
- Olivera-Pasilio, V.; Lasserre, M.; Castello, M.E. Cell proliferation, migration, and neurogenesis in the adult brain of the pulse type weakly electric fish, Gymnotus omarorum. Front. Neurosci. 2017, 11, 437. [Google Scholar] [CrossRef] [PubMed]
- Packard, A. Cephalopods and fish: The limits of convergence. Biol. Rev. 1972, 47, 241–307. [Google Scholar] [CrossRef]
- Salas, C.A.; Yopak, K.E.; Warrington, R.E.; Hart, N.S.; Potter, I.C.; Collin, S.P. Ontogenetic shifts in brain scaling reflect behavioral changes in the life cycle of the pouched lamprey Geotria australis. Front. Neurosci. 2015, 9, 251. [Google Scholar] [CrossRef] [PubMed]
- Aya, F.A.; Corpuz, M.N.C.; Laron, M.A.; Garcia, L.M.B. Larval and early juvenile development of silver therapon, Leiopotherapon plumbeus. Acta Ichthyol. Piscat. 2017, 47, 347–356. [Google Scholar] [CrossRef]
- Altman, J.; Das, G.D. Autoradiographic and histological evidence of postnatal hippocampal neurogenesis in rats. J. Comp. Neurol. 1965, 124, 319–335. [Google Scholar] [CrossRef]
- Eriksson, P.S.; Perfilieva, E.; Bjork-Eriksson, T.; Alborn, A.M.; Nordborg, C.; Peterson, D.A.; Gage, F.H. Neurogenesis in the adult human hippocampus. Nat. Med. 1998, 4, 1313–1317. [Google Scholar] [CrossRef] [PubMed]
- Ernst, A.; Alkass, K.; Bernard, S.; Salehpour, M.; Perl, S.; Tisdale, J.; Possnert, G.; Druid, H.; Frisén, J. Neurogenesis in the striatum of the adult human brain. Cell 2014, 156, 1072–1083. [Google Scholar] [CrossRef] [PubMed]
- Ming, G.L.; Song, H.J. Adult neurogenesis in the mammalian central nervous system. Annu. Rev. Neurosci. 2005, 28, 223–250. [Google Scholar] [CrossRef] [PubMed]
- Gillooly, J.F.; Charnov, E.L.; West, G.B.; Savage, V.M.; Brown, J.H. Effects of size and temperature on developmental time. Nature 2002, 417, 70–73. [Google Scholar] [CrossRef] [PubMed]
- Heupel, M.R.; Knip, D.M.; Simpfendorfer, C.A.; Dulvy, N.K. Sizing up the ecological role of sharks as predators. Mar. Ecol. Prog. Ser. 2014, 495, 291–298. [Google Scholar] [CrossRef]
- Dulvy, N.K.; Pacoureau, N.; Rigby, C.L.; Pollom, R.A.; Jabado, R.W.; Ebert, D.A.; Finucci, B.; Pollock, C.M.; Cheok, J.; Derrick, D.H. Overfishing drives over one-third of all sharks and rays toward a global extinction crisis. Curr. Biol. 2021, 31, 4773–4787.e8. [Google Scholar] [CrossRef] [PubMed]
- García, V.B.; Lucifora, L.O.; Myers, R.A. The importance of habitat and life history to extinction risk in sharks, skates, rays and chimaeras. Proc. R. Soc. B-Biol. Sci. 2008, 275, 83–89. [Google Scholar] [CrossRef]
- Rosa, R.; Ricardo Paula, J.; Sampaio, E.; Pimentel, M.; Lopes, A.R.; Baptista, M.; Guerreiro, M.; Santos, C.; Campos, D.; Almeida-Val, V.M.F.; et al. Neuro-oxidative damage and aerobic potential loss of sharks under elevated CO2 and warming. Mar. Biol. 2016, 163, 119. [Google Scholar] [CrossRef]
- Santos, C.P.; Sampaio, E.; Pereira, B.P.; Pegado, M.R.; Borges, F.O.; Wheeler, C.R.; Bouyoucos, I.A.; Rummer, J.L.; Frazão Santos, C.; Rosa, R. Elasmobranch responses to experimental warming, acidification, and oxygen loss—A meta-analysis. Front. Mar. Sci. 2021, 8. [Google Scholar] [CrossRef]
- Rosa, R.; Rummer, J.L.; Munday, P.L. Biological responses of sharks to ocean acidification. Biol. Lett. 2017, 13, 20160796. [Google Scholar] [CrossRef]
- Di Santo, V. Ocean acidification exacerbates the impacts of global warming on embryonic little skate, Leucoraja erinacea (Mitchill). J. Exp. Mar. Biol. Ecol. 2015, 463, 72–78. [Google Scholar] [CrossRef]
- Rosa, R.; Baptista, M.; Lopes, V.M.; Pegado, M.R.; Paula, J.R.; Trubenbach, K.; Leal, M.C.; Calado, R.; Repolho, T. Early-life exposure to climate change impairs tropical shark survival. Proc. R. Soc. B-Biol. Sci. 2014, 281, 20141738. [Google Scholar] [CrossRef] [PubMed]
- Crear, D.P.; Brill, R.W.; Bushnell, P.G.; Latour, R.J.; Schwieterman, G.D.; Steffen, R.M.; Weng, K.C. The impacts of warming and hypoxia on the performance of an obligate ram ventilator. Conserv. Physiol. 2019, 7, coz026. [Google Scholar] [CrossRef] [PubMed]
- Powter, D.M.; Gladstone, W. The reproductive biology and ecology of the Port Jackson shark Heterodontus portusjacksoni in the coastal waters of eastern Australia. J. Fish Biol. 2008, 72, 2615–2633. [Google Scholar] [CrossRef]
- Izzo, C.; Rodda, K.R. Comparative rates of growth of the Port Jackson shark throughout its southern Australian range. Mar. Freshw. Res. 2012, 63, 687–694. [Google Scholar] [CrossRef]
- Powter, D.M.; Gladstone, W. Embryonic mortality and predation on egg capsules of the Port Jackson shark Heterodontus portusjacksoni (Meyer). J. Fish Biol. 2008, 72, 573–584. [Google Scholar] [CrossRef]
- Hobday, A.J.; Pecl, G.T. Identification of global marine hotspots: Sentinels for change and vanguards for adaptation action. Rev. Fish Biol. Fish. 2014, 24, 415–425. [Google Scholar] [CrossRef]
- Pistevos, J.C.; Nagelkerken, I.; Rossi, T.; Olmos, M.; Connell, S.D. Ocean acidification and global warming impair shark hunting behaviour and growth. Sci. Rep. 2015, 5, 16293. [Google Scholar] [CrossRef]
- Gervais, C.R.; Huveneers, C.; Rummer, J.L.; Brown, C. Population variation in the thermal response to climate change reveals differing sensitivity in a benthic shark. Glob. Chang. Biol. 2021, 27, 108–120. [Google Scholar] [CrossRef]
- Byrnes, E.E.; Brown, C. Individual personality differences in Port Jackson Sharks Heterodontus Portusjacksoni. J. Fish Biol. 2016, 89, 1142–1157. [Google Scholar] [CrossRef]
- Byrnes, E.E.; Pouca, C.V.; Brown, C. Laterality strength is linked to stress reactivity in Port Jackson sharks (Heterodontus portusjacksoni). Behav. Brain Res. 2016, 305, 239–246. [Google Scholar] [CrossRef] [PubMed]
- Vila Pouca, C.; Gervais, C.; Reed, J.; Brown, C. Incubation under climate warming affects behavioral lateralisation in Port Jackson sharks. Symmetry 2018, 10, 184. [Google Scholar] [CrossRef]
- Vila Pouca, C.; Gervais, C.; Reed, J.; Michard, J.; Brown, C. Quantity discrimination in Port Jackson sharks incubated under elevated temperatures. Behav. Ecol. Sociobiol. 2019, 73, 1–9. [Google Scholar] [CrossRef]
- Izzo, C.; Gillanders, B.M. Port Jackson shark growth is sensitive to temperature change. Front. Mar. Sci. 2020, 7, 240. [Google Scholar] [CrossRef]
- Thomas, P.A.; Peele, E.E.; Yopak, K.E.; Brown, C.; Huveneers, C.; Gervais, C.R.; Kinsey, S.T. Intraspecific variation in muscle growth of two distinct populations of Port Jackson sharks under projected end-of-century temperatures. Comp. Biochem. Physiol. Part A Mol. Integr. Physiol. 2023, 283, 111467. [Google Scholar] [CrossRef] [PubMed]
- Rodda, K.R.; Seymour, R.S. Functional morphology of embryonic development in the Port Jackson shark Heterodontus portusjacksoni (Meyer). J. Fish Biol. 2008, 72, 961–984. [Google Scholar] [CrossRef]
- Gaylard, S. Ambient Water Quality of the Gulf St Vincent Metropolitan Coastal Waters; Environmental Protection Authority: Adelaide, Australia, 2004.
- Stephan, H. Methodische Studien über den quantitativen Vergleich architektonischer Struktureinheiten des Gehirns. Z. Wiss. Zool. 1960, 164, 143–172. [Google Scholar]
- Yopak, K.E.; Frank, L.R. Brain size and brain organization of the whale shark, Rhincodon typus, using magnetic resonance imaging. Brain Behav. Evol. 2009, 74, 121–142. [Google Scholar] [CrossRef]
- Ullmann, J.F.; Cowin, G.; Kurniawan, N.D.; Collin, S.P. Magnetic resonance histology of the adult zebrafish brain: Optimization of fixation and gadolinium contrast enhancement. NMR Biomed. Int. J. Devoted Dev. Appl. Magn. Reson. In Vivo 2010, 23, 341–346. [Google Scholar] [CrossRef]
- Yopak, K.E.; McMeans, B.C.; Mull, C.G.; Feindel, K.W.; Kovacs, K.M.; Lydersen, C.; Fisk, A.T.; Collin, S.P. Comparative brain morphology of the greenland and pacific sleeper sharks and its functional implications. Sci. Rep. 2019, 9, 10022. [Google Scholar] [CrossRef]
- Yushkevich, P.A.; Piven, J.; Hazlett, H.C.; Smith, R.G.; Ho, S.; Gee, J.C.; Gerig, G. User-guided 3D active contour segmentation of anatomical structures: Significantly improved efficiency and reliability. NeuroImage 2006, 31, 1116–1128. [Google Scholar] [CrossRef] [PubMed]
- Yopak, K.E.; Montgomery, J.C. Brain organization and specialization in deep-sea chondrichthyans. Brain Behav. Evol. 2008, 71, 287–304. [Google Scholar] [CrossRef] [PubMed]
- Wagner, H.-J. Brain areas in abyssal demersal fishes. Brain Behav. Evol. 2001, 57, 301–316. [Google Scholar] [CrossRef]
- Cavanaugh, J.E. Unifying the derivations for the Akaike and corrected Akaike information criteria. Stat. Probab. Lett. 1997, 33, 201–208. [Google Scholar] [CrossRef]
- Kullback, S.; Leibler, R.A. On information and sufficiency. Ann. Math. Stat. 1951, 22, 79–86. [Google Scholar] [CrossRef]
- Burnham, K.P.; Anderson, D.R. Model Selection and Multimodel Inference: A Practical Information-Theoretic Approach; Springer: New York, NY, USA, 2003; Volume 63. [Google Scholar]
- Chen, S.Y.; Feng, Z.; Yi, X. A general introduction to adjustment for multiple comparisons. J. Thorac. Dis. 2017, 9, 1725–1729. [Google Scholar] [CrossRef] [PubMed]
- De Winter, W.; Oxnard, C.E. Evolutionary radiations and convergences in the structural organization of mammalian brains. Nature 2001, 409, 710–714. [Google Scholar] [CrossRef]
- Iwaniuk, A.N.; Hurd, P.L. The evolution of cerebrotypes in birds. Brain Behav. Evol. 2005, 65, 215–230. [Google Scholar] [CrossRef]
- Lisney, T.J.; Bennett, M.B.; Collin, S.P. Volumetric analysis of sensory brain areas indicates ontogenetic shifts in the relative importance of sensory systems in elasmobranchs. Raffles Bull. Zool. 2007, 55, 7–15. [Google Scholar]
- R Core Team. R: A Language and Environment for Statistical Computing; R Foundation for Statistical Computing: Vienna, Austria, 2023. [Google Scholar]
- Wickham, H. ggplot2: Elegant Graphics for Data Analysis; Springer: New York, NY, USA, 2016. [Google Scholar]
- Ogle, D.H.; Doll, J.C.; Wheeler, A.P.; Dinno, A. FSA: Simple Fisheries Stock Assessment Methods. 2023. Available online: https://cran.r-project.org/web/packages/FSA/index.html (accessed on 2 December 2023).
- Bartoń, K. MuMIn: Multi-Model Inference. 2023. Available online: https://cran.r-project.org/web/packages/MuMIn/index.html (accessed on 2 December 2023).
- Jerison, H.J. Evolution of the Brain and Intelligence; Academic Press: New York, NY, USA, 1973. [Google Scholar]
- Ito, H.; Ishikawa, Y.; Yoshimoto, M.; Yamamoto, N. Diversity of brain morphology in teleosts: Brain and ecological niche. Brain Behav. Evol. 2007, 69, 76–86. [Google Scholar] [CrossRef]
- Yopak, K.E. Neuroecology of cartilaginous fishes: The functional implications of brain scaling. J. Fish Biol. 2012, 80, 1968–2023. [Google Scholar] [CrossRef] [PubMed]
- Krubitzer, L.; Dooley, J.C. Cortical plasticity within and across lifetimes: How can development inform us about phenotypic transformations? Front. Hum. Neurosci. 2013, 7, 620. [Google Scholar] [CrossRef] [PubMed]
- Lefebvre, L.; Sol, D. Brains, lifestyles and cognition: Are there general trends? Brain Behav. Evol. 2008, 72, 135–144. [Google Scholar] [CrossRef] [PubMed]
- Beltrán, I.; Herculano-Houzel, S.; Sinervo, B.; Whiting, M.J. Are ectotherm brains vulnerable to global warming? Trends Ecol. Evol. 2021, 36, 691–699. [Google Scholar] [CrossRef] [PubMed]
- Donelson, J.M.; Wong, M.; Booth, D.J.; Munday, P.L. Transgenerational plasticity of reproduction depends on rate of warming across generations. Evol. Appl. 2016, 9, 1072–1081. [Google Scholar] [CrossRef]
- Collin, S.P. The neuroecology of cartilaginous fishes: Sensory strategies for survival. Brain Behav. Evol. 2012, 80, 80–96. [Google Scholar] [CrossRef]
- Evangelista, C.; Mills, M.; Siebeck, U.E.; Collin, S.P. A comparison of the external morphology of the membranous inner ear in elasmobranchs. J. Morphol. 2010, 271, 483–495. [Google Scholar] [CrossRef]
- Schluessel, V.; Bennett, M.B.; Bleckmann, H.; Blomberg, S.; Collin, S.P. Morphometric and ultrastructural comparison of the olfactory system in elasmobranchs: The significance of structure-function relationships based on phylogeny and ecology. J. Morphol. 2008, 269, 1365–1386. [Google Scholar] [CrossRef]
- Atkinson, C. The Gustatory System of Elasmobranchs: Morphology, Distribution and Development of Oral Papillae and Oral Denticles. Ph.D. Thesis, University of Queensland, Brisbane, Austrilia, 2011. [Google Scholar]
- Lisney, T.J.; Collin, S.P. Relative eye size in elasmobranchs. Brain Behav. Evol. 2007, 69, 266–279. [Google Scholar] [CrossRef]
- Theiss, S.M.; Collin, S.P.; Hart, N.S. The mechanosensory lateral line system in two species of wobbegong shark (Orectolobidae). Zoomorphology 2012, 131, 339–348. [Google Scholar] [CrossRef]
- Kajiura, S.M.; Holland, K.N. Electroreception in juvenile scalloped hammerhead and sandbar sharks. J. Exp. Biol. 2002, 205, 3609–3621. [Google Scholar] [CrossRef]
- Collin, S.P.; Kempster, R.M.; Yopak, K.E. How Elasmobranchs Sense Their Environment. In Fish Physiology; Elsevier: Amsterdam, The Netherlands, 2015; Volume 34, pp. 19–99. [Google Scholar]
- Collin, S.P.; Hart, N.S. Vision and photoentrainment in fishes: The effects of natural and anthropogenic perturbation. Integr. Zool. 2015, 10, 15–28. [Google Scholar] [CrossRef] [PubMed]
- Harahush, B.K.; Hart, N.S.; Collin, S.P. Ontogenetic changes in retinal ganglion cell distribution and spatial resolving power in the brown-banded bamboo shark Chiloscyllium punctatum (Elasmobranchii). Brain Behav. Evol. 2014, 83, 286–300. [Google Scholar] [CrossRef] [PubMed]
- Harahush, B.K.; Hart, N.S.; Green, K.; Collin, S.P. Retinal neurogenesis and ontogenetic changes in the visual system of the brown banded bamboo shark, Chiloscyllium punctatum (Hemiscyllidae, Elasmobranchii). J. Comp. Neurol. 2009, 513, 83–97. [Google Scholar] [CrossRef] [PubMed]
- Ferrando, S.; Gallus, L.; Gambardella, C.; Ghigliotti, L.; Ravera, S.; Vallarino, M.; Vacchi, M.; Tagliafierro, G. Cell proliferation and apoptosis in the olfactory epithelium of the shark Scyliorhinus canicula. J. Chem. Neuroanat. 2010, 40, 293–300. [Google Scholar] [CrossRef] [PubMed]
- Finlay, B.; Darlington, R. Linked regularities in the development and evolution of mammalian brains. Science 1995, 268, 1578–1584. [Google Scholar] [CrossRef] [PubMed]
- Nieuwenhuys, R.; Ten Donkelaar, H.; Nicholson, C. The Central Nervous System of Vertebrates; Springer: Berlin/Heidelberg, Germany, 1997. [Google Scholar]
- Závorka, L.; Koeck, B.; Armstrong, T.A.; Soğanci, M.; Crespel, A.; Killen, S.S. Reduced exploration capacity despite brain volume increase in warm-acclimated common minnow. J. Exp. Biol. 2020, 223, jeb223453. [Google Scholar] [CrossRef]
- Pörtner, H.O. Climate variations and the physiological basis of temperature dependent biogeography: Systemic to molecular hierarchy of thermal tolerance in animals. Comp. Biochem. Physiol. A Mol. Integr. Physiol. 2002, 132, 739–761. [Google Scholar] [CrossRef]
- Boord, R.L.; Northcutt, R.G. Ascending lateral line pathways to the midbrain of the clearnose skate, Raja eglanteria. J. Comp. Neurol. 1982, 207, 274–282. [Google Scholar] [CrossRef]
- Corwin, J.T.; Northcutt, R.G. Auditory centers in the elasmobranch brain stem: Deoxyglucose autoradiography and evoked potential recording. Brain Res. 1982, 236, 261–273. [Google Scholar] [CrossRef]
- Quintana-Urzainqui, I.; Rodríguez-Moldes, I.; Candal, E. Developmental, tract-tracing and immunohistochemical study of the peripheral olfactory system in a basal vertebrate: Insights on Pax6 neurons migrating along the olfactory nerve. Brain Struct. Funct. 2014, 219, 85–104. [Google Scholar] [CrossRef] [PubMed]
- Atkins, M.E.; Benfey, T.J. Effect of acclimation temperature on routine metabolic rate in triploid salmonids. Comp. Biochem. Physiol. Part A Mol. Integr. Physiol. 2008, 149, 157–161. [Google Scholar] [CrossRef] [PubMed]
- Romanoff, A.L. Avian spare yolk and its assimilation. Auk 1944, 61, 235–241. [Google Scholar] [CrossRef]
- Barri, A. Effects of Incubation Temperature and Transportation Stress on Yolk Utilization, Small Intestine Development, and Post-Hatch Performance of High-Yield Broiler Chicks. Ph.D. Thesis, Virginia Tech, Blacksburg, VA, USA, 2008. [Google Scholar]
- Kamler, E.; Keckei, H.; Bauer-Nemeschkal, E. Temperature-induced changes of survival, development and yolk partitioning in Chondrostoma nasus. J. Fish Biol. 1998, 53, 658–682. [Google Scholar] [CrossRef]
- Last, P.; Stevens, J. Sharks and Rays of Australia; CSIRO Publishing: Melbourne, Australia, 1994. [Google Scholar]
- Yopak, K.E.; Lisney, T.J.; Darlington, R.B.; Collin, S.P.; Montgomery, J.C.; Finlay, B.L. A conserved pattern of brain scaling from sharks to primates. Proc. Natl. Acad. Sci. USA 2010, 107, 12946–12951. [Google Scholar] [CrossRef] [PubMed]
- Yopak, K.E.; Lisney, T.J.; Collin, S.P. Not all sharks are “swimming noses”: Variation in olfactory bulb size in cartilaginous fishes. Brain Struct. Funct. 2015, 220, 1127–1143. [Google Scholar] [CrossRef]
- Nosal, A.P.; Chao, Y.; Farrara, J.D.; Chai, F.; Hastings, P.A. Olfaction contributes to pelagic navigation in a coastal shark. PLoS ONE 2016, 11, e0143758. [Google Scholar] [CrossRef]
- Munday, P.L.; Dixson, D.L.; Donelson, J.M.; Jones, G.P.; Pratchett, M.S.; Devitsina, G.V.; Døving, K.B. Ocean acidification impairs olfactory discrimination and homing ability of a marine fish. Proc. Natl. Acad. Sci. USA 2009, 106, 1848–1852. [Google Scholar] [CrossRef]
- Bass, N.C.; Day, J.; Guttridge, T.L.; Mourier, J.; Knott, N.A.; Vila Pouca, C.; Brown, C. Residency and movement patterns of adult Port Jackson sharks (Heterodontus portusjacksoni) at a breeding aggregation site. J. Fish Biol. 2021, 99, 1455–1466. [Google Scholar] [CrossRef]
- Kadar, J.; Ladds, M.; Mourier, J.; Day, J.; Brown, C. Acoustic accelerometry reveals diel activity patterns in premigratory Port Jackson sharks. Ecol. Evol. 2019, 9, 8933–8944. [Google Scholar] [CrossRef]
- Gervais, C.R.; Brown, C. Impact of conspecific necromones on the oxygen uptake rates of a benthic elasmobranch. Anim. Behav. 2021, 174, 1–8. [Google Scholar] [CrossRef]
- Gervais, C.R.; Nay, T.; Brown, C. Friend or foe? Development of odour detection, differentiation and antipredator response in an embryonic elasmobranch. Mar. Freshw. Res. 2021, 72, 942–949. [Google Scholar] [CrossRef]
- Qian, X.; Shen, Q.; Goderie, S.K.; He, W.; Capela, A.; Davis, A.A.; Temple, S. Timing of CNS cell generation: A programmed sequence of neuron and glial cell production from isolated murine cortical stem cells. Neuron 2000, 28, 69–80. [Google Scholar] [CrossRef] [PubMed]
- Nedergaard, M.; Ransom, B.; Goldman, S.A. New roles for astrocytes: Redefining the functional architecture of the brain. Trends Neurosci. 2003, 26, 523–530. [Google Scholar] [CrossRef]
- Finlay, B.L. The multiple contexts of brain scaling: Phenotypic integration in brain and behavioral evolution. Brain Behav. Evol. 2022, 97, 83–95. [Google Scholar] [CrossRef]
- Amiel, J.J.; Bao, S.; Shine, R. The effects of incubation temperature on the development of the cortical forebrain in a lizard. Anim. Cogn. 2017, 20, 117–125. [Google Scholar] [CrossRef]
- Myagkov, N. The brain sizes of living elasmobranchii as their organization level indicator. I. General analysis. J. Fur Hirnforsch. 1991, 32, 553–561. [Google Scholar]
- Burns, J.G.; Rodd, F.H. Hastiness, brain size and predation regime affect the performance of wild guppies in a spatial memory task. Anim. Behav. 2008, 76, 911–922. [Google Scholar] [CrossRef]
- Gonda, A.; Herczeg, G.; Merilä, J. Population variation in brain size of nine-spined sticklebacks (Pungitius pungitius)—Local adaptation or environmentally induced variation? BMC Evol. Biol. 2011, 11, 75. [Google Scholar] [CrossRef]
- Lisney, T.J.; Collin, S.P. Brain morphology in large pelagic fishes: A comparison between sharks and teleosts. J. Fish Biol. 2006, 68, 532–554. [Google Scholar] [CrossRef]
- Wagner, H.J. Volumetric analysis of brain areas indicates a shift in sensory orientation during development in the deep-sea grenadier Coryphaenoides armatus. Mar. Biol. 2003, 142, 791–797. [Google Scholar] [CrossRef]
- Pollen, A.A.; Dobberfuhl, A.P.; Scace, J.; Igulu, M.M.; Renn, S.C.P.; Shumway, C.A.; Hofmann, H.A. Environmental complexity and social organization sculpt the brain in Lake Tanganyikan cichlid fish. Brain Behav. Evol. 2007, 70, 21–39. [Google Scholar] [CrossRef] [PubMed]
- Ullmann, J.F.; Cowin, G.; Collin, S.P. Quantitative assessment of brain volumes in fish: Comparison of methodologies. Brain Behav Evol. 2011, 76, 261–270. [Google Scholar] [CrossRef] [PubMed]
- White, G.E.; Brown, C. Variation in brain morphology of intertidal gobies: A comparison of methodologies used to quantitatively assess brain volumes in fish. Brain Behav. Evol. 2015, 85, 245–256. [Google Scholar] [CrossRef] [PubMed]
- DePasquale, C.; Neuberger, T.; Hirrlinger, A.M.; Braithwaite, V.A. The influence of complex and threatening environments in early life on brain size and behaviour. Proc. R. Soc. B-Biol. Sci. 2016, 283, 20152564. [Google Scholar] [CrossRef] [PubMed]
- Ullmann, J.F.; Cowin, G.; Kurniawan, N.D.; Collin, S.P. A three-dimensional digital atlas of the zebrafish brain. NeuroImage 2010, 51, 76–82. [Google Scholar] [CrossRef]
- Harvey, B.P.; Gwynn-Jones, D.; Moore, P.J. Meta-analysis reveals complex marine biological responses to the interactive effects of ocean acidification and warming. Ecol. Evol. 2013, 3, 1016–1030. [Google Scholar] [CrossRef]
- Todgham, A.E.; Stillman, J.H. Physiological responses to shifts in multiple environmental stressors: Relevance in a changing world. Integr. Comp. Biol. 2013, 53, 539–544. [Google Scholar] [CrossRef]
- Kroeker, K.J.; Kordas, R.L.; Crim, R.; Hendriks, I.E.; Ramajo, L.; Singh, G.S.; Duarte, C.M.; Gattuso, J.P. Impacts of ocean acidification on marine organisms: Quantifying sensitivities and interaction with warming. Glob. Chang. Biol. 2013, 19, 1884–1896. [Google Scholar] [CrossRef]
- Nilsson, G.E.; Lefevre, S. Physiological challenges to fishes in a warmer and acidified future. Physiology 2016, 31, 409–417. [Google Scholar] [CrossRef]
- Jiahuan, R.; Wenhao, S.; Xiaofan, G.; Wei, S.; Shanjie, Z.; Maolong, H.; Haifeng, W.; Guangxu, L. Ocean acidification impairs foraging behavior by interfering with olfactory neural signal transduction in black sea bream, Acanthopagrus schlegelii. Front. Physiol. 2018, 9, 1592. [Google Scholar] [CrossRef] [PubMed]
- Forsgren, E.; Dupont, S.; Jutfelt, F.; Amundsen, T. Elevated CO2 affects embryonic development and larval phototaxis in a temperate marine fish. Ecol. Evol. 2013, 3, 3637–3646. [Google Scholar] [CrossRef] [PubMed]
- Bass, N.C.; Mourier, J.; Knott, N.A.; Day, J.; Guttridge, T.; Brown, C. Long-term migration patterns and bisexual philopatry in a benthic shark species. Mar. Freshw. Res. 2016, 68, 1414–1421. [Google Scholar] [CrossRef]


| ID | Treatment | Age, Days | Sex | Body Mass, g | TL, cm | Brain Mass, g | OB Mass, g | TE Mass, g | DI Mass, g | OT Mass, g | TEG Mass, g | CER Mass, g | MED Mass, g |
|---|---|---|---|---|---|---|---|---|---|---|---|---|---|
| 01A | Ambient | 125 | M | 50.0 | 23.0 | 0.688 | 0.053 | 0.376 | 0.061 | 0.034 | 0.032 | 0.078 | 0.125 |
| 02A | Ambient | 136 | M | 81.5 | 27.0 | 0.913 | 0.080 | 0.441 | 0.080 | 0.041 | 0.036 | 0.097 | 0.158 |
| 03A | Ambient | 126 | M | 90.0 | 26.5 | 0.843 | 0.080 | 0.418 | 0.076 | 0.043 | 0.034 | 0.083 | 0.130 |
| 04A | Ambient | 116 | M | 101.5 | 26.5 | 0.909 | 0.102 | 0.458 | 0.078 | 0.041 | 0.037 | 0.094 | 0.144 |
| 05A | Ambient | 125 | M | 77.0 | 25.2 | 0.821 | 0.071 | 0.408 | 0.063 | 0.035 | 0.037 | 0.091 | 0.138 |
| 06A | Ambient | 112 | M | 54.5 | 22.3 | 0.666 | 0.056 | 0.335 | 0.059 | 0.041 | 0.025 | 0.068 | 0.117 |
| 07A | Ambient | 139 | F | 68.0 | 24.0 | 0.857 | 0.074 | 0.436 | 0.069 | 0.047 | 0.020 | 0.085 | 0.132 |
| 08A | Ambient | 134 | F | 63.0 | 24.5 | 0.738 | 0.050 | 0.398 | 0.067 | 0.025 | 0.041 | 0.075 | 0.135 |
| 09A | Ambient | 116 | M | 102.5 | 26.5 | 0.816 | 0.091 | 0.422 | 0.064 | 0.037 | 0.042 | 0.088 | 0.132 |
| 10A | Ambient | 138 | M | 77.0 | 26.0 | 0.827 | 0.067 | 0.414 | 0.066 | 0.042 | 0.036 | 0.091 | 0.137 |
| 11A | Ambient | 92 | F | 75.0 | 24.1 | 0.787 | 0.063 | 0.393 | 0.065 | 0.041 | 0.032 | 0.085 | 0.125 |
| 01E | Elevated | 177 | F | 87.5 | 25.7 | 0.928 | 0.082 | 0.461 | 0.082 | 0.036 | 0.054 | 0.109 | 0.163 |
| 02E | Elevated | 171 | M | 53.0 | 22.9 | 0.771 | 0.052 | 0.386 | 0.078 | 0.032 | 0.045 | 0.084 | 0.129 |
| 03E | Elevated | 150 | M | 45.0 | 22.5 | 0.749 | 0.056 | 0.358 | 0.062 | 0.037 | 0.037 | 0.082 | 0.136 |
| 04E | Elevated | 177 | F | 62.0 | 24.5 | 0.914 | 0.061 | 0.464 | 0.083 | 0.036 | 0.048 | 0.099 | 0.145 |
| 05E | Elevated | 177 | M | 65.5 | 23.1 | 0.825 | 0.067 | 0.415 | 0.074 | 0.037 | 0.047 | 0.091 | 0.150 |
| 06E | Elevated | 139 | F | 33.0 | 20.0 | 0.658 | 0.028 | 0.357 | 0.057 | 0.032 | 0.031 | 0.072 | 0.120 |
| 07E | Elevated | 145 | F | 63.8 | 25.5 | 0.839 | 0.062 | 0.422 | 0.074 | 0.046 | 0.038 | 0.101 | 0.160 |
| 08E | Elevated | 199 | M | 58.0 | 25.0 | 0.996 | 0.074 | 0.506 | 0.083 | 0.042 | 0.053 | 0.115 | 0.175 |
| 09E | Elevated | 136 | F | 41.0 | 23.5 | 0.866 | 0.071 | 0.419 | 0.066 | 0.039 | 0.039 | 0.092 | 0.142 |
| 10E | Elevated | 206 | F | 48.0 | 21.0 | 0.895 | 0.047 | 0.434 | 0.078 | 0.047 | 0.044 | 0.095 | 0.138 |
| ID | Treatment | Eye Volume, mm3 | Olfactory Rosette Volume, mm3 |
|---|---|---|---|
| 02A | Ambient | 716.3 | 435.4 |
| 07A | Ambient | 769.6 | 407.7 |
| 10A | Ambient | 684.2 | 405.3 |
| 03E | Elevated | 591.0 | 300.9 |
| 07E | Elevated | 688.7 | 273.4 |
| 09E | Elevated | 569.2 | 254.2 |
| Brain Region | Principal Component Loadings | ||||||
|---|---|---|---|---|---|---|---|
| PC1 | PC2 | PC3 | PC4 | PC5 | PC6 | PC7 | |
| Eigenvalue | 1.024 × 10⁻³ | 4.874 × 10⁻⁴ | 2.042 × 10⁻⁴ | 1.077 × 10⁻⁴ | 6.900 × 10⁻⁵ | 3.032 × 10⁻⁵ | 3.528 × 10⁻⁷ |
| Olfactory bulbs | 0.900 | 0.297 | 0.043 | −0.010 | 0.036 | 0.059 | 0.308 |
| Telencephalon | −0.140 | −0.312 | 0.660 | −0.164 | −0.180 | 0.093 | 0.615 |
| Diencephalon | −0.121 | 0.015 | 0.036 | 0.689 | 0.585 | −0.237 | 0.332 |
| Optic tectum | 0.114 | −0.541 | −0.513 | 0.356 | −0.343 | 0.357 | 0.243 |
| Tegmentum | −0.323 | 0.712 | −0.040 | 0.242 | −0.341 | 0.396 | 0.236 |
| Cerebellum | −0.071 | 0.108 | −0.303 | −0.089 | −0.403 | −0.779 | 0.339 |
| Medulla | −0.182 | 0.053 | −0.452 | −0.552 | 0.477 | 0.203 | 0.432 |
| Cumulative proportion of variation | 0.532 | 0.786 | 0.892 | 0.948 | 0.984 | 0.999 | 1.000 |
Disclaimer/Publisher’s Note: The statements, opinions and data contained in all publications are solely those of the individual author(s) and contributor(s) and not of MDPI and/or the editor(s). MDPI and/or the editor(s) disclaim responsibility for any injury to people or property resulting from any ideas, methods, instructions or products referred to in the content. |
© 2023 by the authors. Licensee MDPI, Basel, Switzerland. This article is an open access article distributed under the terms and conditions of the Creative Commons Attribution (CC BY) license (https://creativecommons.org/licenses/by/4.0/).
Share and Cite
Peele, E.E.; Huveneers, C.; Brown, C.; Gervais, C.R.; Yopak, K.E. Effects of Increased Temperature on Brain and Sensory Development in the Port Jackson Shark (Heterodontus portusjacksoni). Fishes 2023, 8, 611. https://doi.org/10.3390/fishes8120611
Peele EE, Huveneers C, Brown C, Gervais CR, Yopak KE. Effects of Increased Temperature on Brain and Sensory Development in the Port Jackson Shark (Heterodontus portusjacksoni). Fishes. 2023; 8(12):611. https://doi.org/10.3390/fishes8120611
Chicago/Turabian StylePeele, Emily E., Charlie Huveneers, Culum Brown, Connor R. Gervais, and Kara E. Yopak. 2023. "Effects of Increased Temperature on Brain and Sensory Development in the Port Jackson Shark (Heterodontus portusjacksoni)" Fishes 8, no. 12: 611. https://doi.org/10.3390/fishes8120611
APA StylePeele, E. E., Huveneers, C., Brown, C., Gervais, C. R., & Yopak, K. E. (2023). Effects of Increased Temperature on Brain and Sensory Development in the Port Jackson Shark (Heterodontus portusjacksoni). Fishes, 8(12), 611. https://doi.org/10.3390/fishes8120611