Brief Report

Metabarcoding by Combining Environmental DNA with Environmental RNA to Monitor Fish Species in the Han River, Korea

Department of Biotechnology, Sangmyung University, Seoul 03016, Republic of Korea
*
Author to whom correspondence should be addressed.
These authors contributed equally to this work.
Fishes 2023, 8(11), 550; https://doi.org/10.3390/fishes8110550
Submission received: 10 October 2023 / Revised: 4 November 2023 / Accepted: 13 November 2023 / Published: 15 November 2023

Abstract

:
Fishes are ecologically important organisms that have long lifespans, high mobilities, and diverse trophic levels. Due to their importance, fishes are used as bioindicators for monitoring aquatic environments. One method for monitoring fishes is based on environmental DNA (eDNA), which are the deoxynucleic acids released by organisms into the environment. However, there has been a problem with false positives because eDNA is relatively stable in the environment and could even likely represent dead or non-inhabiting organisms. To address this weakness, environmental RNA (eRNA), which degrades more rapidly than eDNA in the environment, can be utilized to complement eDNA. But, to date, few studies have used eRNA for freshwater fish monitoring. In this study, to determine the relative usefulness of eDNA and eRNA metabarcoding in freshwater fishes, we performed eDNA and eRNA metabarcoding on 12S rRNA targeting fish using water samples that were collected from three locations in the Han River. We then calculated the sensitivity and positive predictivity of this approach by comparing our data to the previous specimen capture survey (PSCS) data from the last six years. The results showed that 42 species were detected by eDNA and 19 by eRNA at the three locations. At all locations, compared to the PSCS data, the average sensitivity was higher for eDNA (46.1%) than for eRNA (34.6%), and the average positive predictivity was higher for eRNA (31.7%) than for eDNA (20.7%). This confirmed that eDNA metabarcoding has the advantage of broadly determining species presence or absence (including those that are no longer present or dead), but it also generates false positives; meanwhile, eRNA metabarcoding reports living fish species, but detects fewer species than eDNA. Combining eDNA and eRNA therefore emphasizes their advantages and compensates for their disadvantages, and conducting this may therefore be useful for identifying false positives and monitoring the fish species that are actually present in the environment. This metabarcoding technique can be used in the future to provide insights into the aquatic environment and the monitoring of fisheries.
Key Contribution: This study was performed metabarcoding by combining eDNA with eRNA to monitor fish species in the Han River, Korea. The results indicated that combined eDNA and eRNA data can be effective for identifying false positives and monitoring fish species that actually live in the environment examined.

1. Introduction

Fishes are sensitive indicators of long-term environmental and habitat condition changes due to their relatively long lifespan and high mobility [1]. In addition, their communities span a range of trophic levels, from planktivores and herbivores to apex predators. Fish are also susceptible to environmental or human-induced pressures such as pollution, climate change, and habitat disturbance, and they have therefore been regarded as dependable indicators of the overall health and condition of aquatic ecosystems [2,3,4]. For these reasons, fish assessments and monitoring have been executed by governmental institutions and scientific researchers based on standard sampling methods that rely on direct capture [5,6]. However, traditional monitoring methods, such as electrofishing, fyke nets, gill nets, bait traps, visual census, and acoustic surveys, are expensive and time-consuming due to the lack of taxonomic expertise, the necessity of extensive fieldwork, low detection probabilities, and the challenges associated with gear deployment [7,8,9]. Due to these difficulties, as the ability to observe fish living in aquatic ecosystems is limited, researchers have recently harnessed the potential of DNA for detection.
One of the main methods for monitoring fish in aquatic ecosystems when using DNA is based on environmental DNA (eDNA) metabarcoding. Metabarcoding with eDNA, which is the DNA released by organisms into the environment, is a molecular technique that permits the simultaneous identification of multiple organisms via the eDNA extracted from a single environmental sample [10,11,12]. eDNA metabarcoding for monitoring fish species typically uses specific regions of marker genes, such as the mitochondrial 12S ribosomal RNA (12S rRNA) gene [13]. The decreasing time of sample preparation, the lower cost, and an increased speed of data generation by high-throughput sequencing technologies have also contributed to the increased utilization of eDNA metabarcoding for fish monitoring [14,15,16]. Moreover, while eDNA metabarcoding has the potential to be a useful tool for ecologically monitoring fish, its weakness is that false positives can occur, whereby it identifies species that are not actually present in the environment [17]. This happens when eDNA samples include DNA from organisms that are not present in the environment, such as through it being transported from upstream to downstream, being transported by humans, or it being derived from dead organisms [17,18]. These can occur because of the high stability of DNA, which can remain in the environment for a long time [19]. These factors can lead to an inaccurate representation of the fish species present at a sampling time and location [17].
To solve the false positive issue of eDNA metabarcoding, environmental RNA (eRNA) has been suggested as a potential solution [12,17]. Similar to eDNA, eRNA refers to the RNA that is detected in environmental samples of water, soil, sediment, and air [15,20]. eRNA is derived from both the coding and noncoding RNAs that are produced by living organisms, and it tends to degrade rapidly [15]. eRNA is relatively less stable than eDNA under most environmental conditions, and especially in water [15]. This is because of the ribose molecular composition, which has hydroxyl groups that are more susceptible to hydrolysis and degradation by the ribonucleases (RNase) present in the environment than the deoxyribose of eDNA [15]. However, rapid degradation reduces the possibility that organisms that are no longer present or have been transported from upstream, or are dead, will be detected by eRNA [18,21]. For these reasons, eRNA has become known as a method through which to complement the occurrence of false positives in eDNA [22].
eDNA metabarcoding, therefore, characterizes both the past and present organisms present in the environment, while eRNA metabarcoding identifies only the recently present living organisms. In previous studies, researchers using both eDNA and eRNA have focused primarily on organisms in marine environments [15]. However, the knowledge regarding the effectiveness of combining eDNA and eRNA metabarcoding for ecological studies related to fish species monitoring is limited [15,23,24]. In particular, comparative studies on the eDNA and eRNA metabarcoding of freshwater fishes remain lacking [17]. Thus, comparative analytical studies of eDNA and eRNA in fish are needed to identify the advantages and disadvantages of using eDNA and eRNA for fish monitoring and assessment.
The Han River is the largest river system in Korea, and it has many tributaries. Importantly, the downstream area of the Han River is the main water source for the half of the Korean population who reside in the Seoul metropolitan area. Due to its value and significance, the health of the Han River is very important, and it is crucial to implement effective monitoring protocols for water quality management [25]. However, ecological surveys within the Han River basin have focused on the middle and upstream regions, with limited attention given to the downstream region [25,26]. Furthermore, previous studies conducted in this region have predominantly relied on observational methods, with a notable lack of molecular investigations that used eDNA and/or eRNA metabarcoding for studying fish species in this area.
In this study, we performed a metabarcoding analysis using eDNA and eRNA to determine the presence or absence of fish in the aquatic environment of the Han River. In addition, the sensitivity and positive predictivity were calculated by comparing eDNA and eRNA metabarcoding to the data from previous specimen capture surveys; moreover, based on this, the relative usefulness of eDNA and eRNA was examined.

2. Materials and Methods

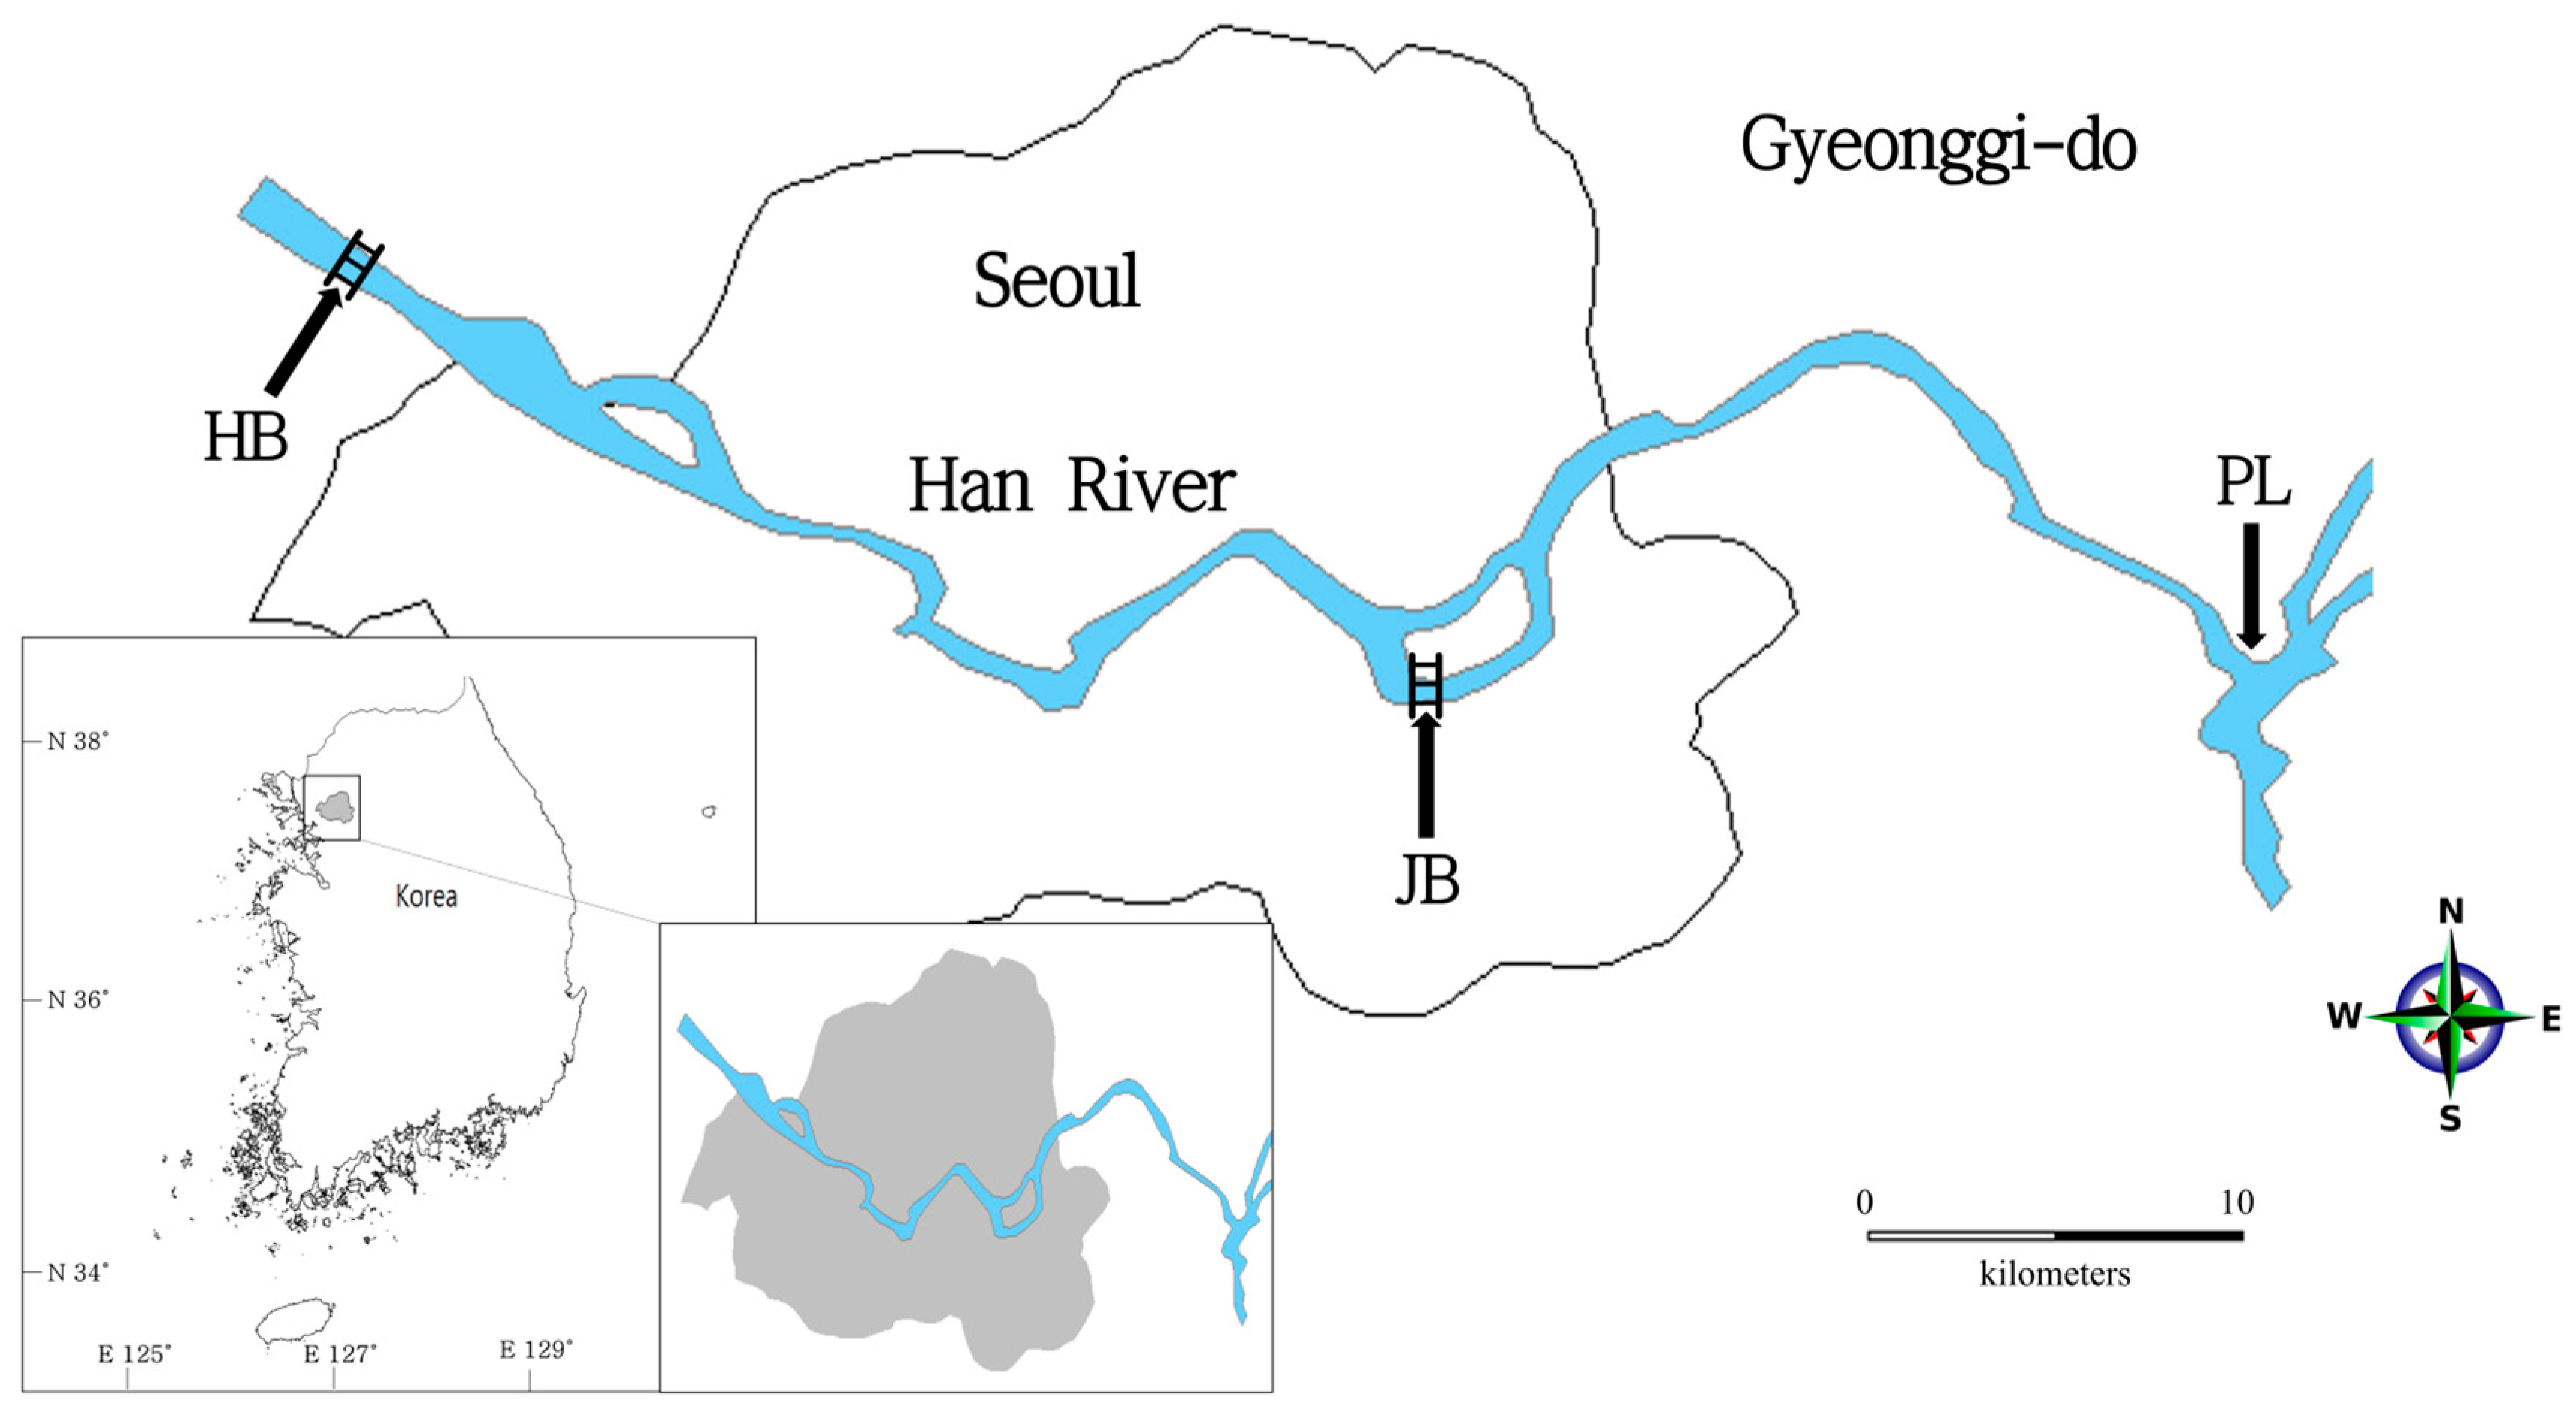
2.1. Sample Processing

Water samples were collected in April to May 2022 at three locations along the Han River in Korea: Paldang Lake (PL), Jamsil Bridge (JB), and Haengju Bridge (HB) (Figure 1, Table S1). The water samples were collected simultaneously at three locations using collection bottles: 10 L was collected for eDNA and 3 L for eRNA at each location. For the eDNA and eRNA water samples, the same amount of water sample was replicated five times at each location during collection, and the water samples from the replicates were pooled to minimize bias. All samples were refrigerated at 4 °C immediately after collection to minimize degradation, and they were then filtered within 24 h after collection [27]. Both eDNA and eRNA water samples were filtered using membrane filter units with a nominal pore size of 0.45 μm and a diameter of 47 mm (Whatman, Maidstone, UK). Before filtering, the laboratory space and tools were cleaned using DNA AWAY (Molecular BioProducts, San Diego, CA, USA) to prevent contamination by other DNA, and filtering was performed in an isolated room to prevent cross-contamination between samples. Sterilized tubes and forceps were replaced after each filtration to prevent cross-contamination. For the eRNA filters, RNAprotect tissue reagent (Qiagen, Hilden, Germany) was added immediately after filtration to prevent RNA denaturation. The eRNA filters were then kept at 4 °C overnight to allow the RNAprotect tissue reagent to sufficiently penetrate the filters. All filters were then stored at −80 °C until required for the next step.
The filters were cut into smaller than 0.5 mm pieces using sterile scissors. The eDNA filters were then each soaked in 0.9 mL of ATL buffer from a DNeasy blood and tissue kit (Qiagen, Hilden, Germany). The filters were then incubated for one hour with shaking at 60 °C for lysis. After lysis, the filters were removed and the reagent was transferred to a 2 mL conical tube containing 1 g zirconium beads (BioFactories, Daejeon, Republic of Korea). The reagent was then homogenized using a BeadBuddy (BioFactories, Daejeon, Republic of Korea), which was achieved by bead homogenization at 4000 rpm for 45 s to improve the yield [28]. This step was followed by cooling on ice for 1 min, and the homogenization and cooling processes were repeated three times. The subsequent procedures for the eDNA extraction from the filter homogenate were performed following the manufacturer’s protocols with the DNeasy blood and tissue kit (Qiagen, Hilden, Germany). The total eRNA was extracted using a RNeasy Mini Kit (Qiagen, Hilden, Germany), which was conducted following a previously published protocol [16]. During eRNA extraction, 0.6 mL of RLT buffer was preheated to 65 °C and was added for each filter. Then, the solution was vortexed for three minutes at room temperature. Next, the filters were removed, and the eRNA sample solution was transferred to a 2 mL collection tube. We then homogenized the eRNA samples via bead beating as reported above for the eDNA extraction. After homogenization, complementary DNA (cDNA) was synthesized from the eRNA using an amfiRivert cDNA Synthesis Platinum Master Mix (GenDEPOT, Katy, TX, USA), whereby all of the procedures were conducted following the manufacturer’s protocols.

2.2. PCR Amplification and Next Generation Sequencing

Next, polymerase chain reaction (PCR) was performed using the eDNA and cDNA (from eRNA) samples as a template. The partial 12S rRNA genes were amplified using MiFish-U primers, MiFish-U-F: 5′-GTC GGT AAA ACT CGT GCC AGC-3′, and MiFish-U-R: 5′-CAT AGT GGG GTA TCT AAT CCC AGT TTG-3′ [13]. The PCR reactions consisted of 1 µL DNA or cDNA (50 ng/µL), 0.2 µL HANLAB Taq (5 U/µL) (HANLAB, Cheongju, Republic of Korea), 2 µL of 10×Reaction Buffer, 2 µL of 10 mM of dNTP mix, 1 µL each of forward and reverse primers (10 pmol/µL), and 12.8 µL of distilled water. The reaction cycling conditions were as follows: initial denaturation at 95 °C for 3 min, 35 cycles of 20 s at 94 °C, 15 s at 52 °C, 15 s at 72 °C, and a final extension of 5 min at 72 °C. The PCR negative controls were included in each PCR to check for potential contamination. Amplified PCR products were then visualized by gel electrophoresis to confirm the band size before being purified with an AccuPrep® Gel Purification Kit (Bioneer, Daejeon, Republic of Korea). Libraries were then constructed using a Nextera XT DNA index kit (Illumina, San Diego, CA, USA), and the final library was measured for quality and quantity using a 2100 Bioanalyzer (Agilent Technologies, Santa Clara, CA, USA), which was sequenced using an Illumina MiSeq sequencing platform (Illumina Inc., San Diego, CA, USA) with 300 base pair (bp) paired-end reads.

2.3. Bioinformatics Analysis

Bioinformatics analyses were performed using the QIIME2 version 2022.2.1 [29] pipeline. The read quality score was confirmed with FastQC version 0.11.9 [30]. The first 13 bp of the raw reads were trimmed based on the read quality score, and all reads were truncated to 150 bp using DADA2 version 2022.2.0 [31], which were implemented in QIIME2 to produce amplicon sequence variants (ASVs). Further analyses were based on the ASVs because traditional operational taxonomic unit (OTU) calling is based on similarity and can overlook small biological variations by grouping sequences together; meanwhile, conducting analyses on ASVs can preserve biological sequence variation in output reads [32]. Sequences with low-quality base calls or chimera sequences were removed using DADA2. For the taxonomic assignment of the processed ASVs, the consensus-BLAST [33] function of QIIME2 was used. For this step, Mitohelper (September 2022) [34] was used as a reference since it was curated for the reference sequence analysis of previous fish eDNA studies. This database consists of the QIIME2-compatible datasets of fish 12S rRNA reference sequences, as well as of the taxonomic classification information that was formed based on the MitoFish database, version 3.75 [35]—which is a comprehensive and standardized fish mitochondrial genome database. Non-freshwater fish sequences were excluded from the downstream analyses, and unassigned ASVs were also removed. QIIME2 was again used to calculate the rarefaction curves of the ASVs for eDNA and eRNA metabarcoding when using 12S rRNA markers. Finally, the rarefaction curves were calculated by QIIME2 to assess the sequencing depth required to represent the species in the sample.

2.4. Comparison of eDNA and eRNA Metabarcoding Data with Previous Specimen Capture Survey Data

The data of fishes that are based on specimen capture surveys are publicly available from the Ministry of Environment of Korea—Water Environment Information System (WEI System; https://water.nier.go.kr, 12 April 2023; Ministry of Environment, 2022). According to the guidelines of the National Institute of Environmental Research by national laws and regulations, the WEI System discloses comprehensive biomonitoring information that has neem conducted twice a year since 2011 from a total of 3883 locations in rivers, estuaries, and lakes across Korea to monitor river environments and aquatic organisms. Therefore, we collected the previous specimen capture survey (PSCS) data for the six year period of 2016 to 2021 from the WEI System, and the eDNA and eRNA were also collected for the same locations. Of the PSCS data collected, we used the data from the first survey, which was conducted in April and May (i.e., the same time period that the eDNA and eRNA were collected in this study). A comparison was then made between the list of the fish species identified using eDNA and eRNA metabarcoding and the PSCS data extracted from the WEI System. The species list from the PSCS data was used to evaluate the performance of the eDNA and eRNA metabarcoding analyses. The analysis of the previous specimen capture records followed the classification scheme used by the National List of Species of Korea (National Institute of Biological Resources, 2021).
To evaluate the relative usefulness of detecting fish species by each method, the number of species detected using eDNA, eRNA, and PSCS data from the WEI System were compared using Venn diagrams. The sensitivity and positive predictivity of the eDNA and eRNA metabarcoding analyses were calculated following the previous study [17]. Here, positives in the PSCS data were defined as the actually observed species in PSCS data. Similarly, positives in the metabarcoding analysis were defined as the actually detected species when using metabarcoding analyses. Based on these, true positives were defined as species that were detected positives by both the metabarcoding analysis and the PSCS data. The sensitivity refers to the proportion of fish detected via eDNA or eRNA metabarcoding (i.e., the number of true positives) that were also among the fish reported in the PSCS, and the positive predictivity refers to the proportion of fish recorded in the PSCS among fish detected by eDNA or eRNA metabarcoding. We considered species recorded in the WEI System to be positive, while unrecorded species were not considered to be negative as the PSCS data can omit the species existing in the sampling locations; therefore, for this reason, the specificity and negative predictivity could not be assessed in this study.
S e n s i t i v i t y = n u m b e r   o f   t r u e   p o s i t i v e s n u m b e r   o f   p o s i t i v e s   i n   p r e v i o u s   s p e c i m e n   c a p t u r e   s u r v e y   d a t a
P o s i t i v e   p r e d i c t i v i t y = n u m b e r   o f   t r u e   p o s i t i v e s ( n u m b e r   o f   p o s i t i v e s   i n   m e t a b a r c o d i n g   a n a l y s i s )

3. Results

3.1. Sequencing Results

The eDNA and eRNA metabarcoding sequences were generated to determine the presence of fish species and evaluate the relative utility of eDNA and eRNA in the aquatic environment. Sequences were successfully generated for the marker from all of the locations where the eDNA and eRNA samples were collected. These sequencing efforts produced a total of 2,082,493 raw unpaired sequence reads from all samples. After stringent quality filtering, 1,078,696 eDNA and 883,674 eRNA pair-merge sequences were obtained for the 12S rRNA. Of these, 702,697 eDNA and 699,970 eRNA sequences (reflecting 65.14% and 79.21% of the filtered sequences, respectively) were subjected to denoising and merging in the 12S rRNA samples. Sequence chimeras were successfully removed, and the ASVs were successfully extracted from the remaining sequences. Summarized results of the sequence processing are shown in Table S2. The rarefaction curves showed that all of the samples reached near saturation in terms of species richness (Figure S1). The sample was therefore considered to have sufficient sequencing depth for this study. The ASVs extracted through this process were used for the purpose of further analyses with respect to comparing the eDNA and eRNA.

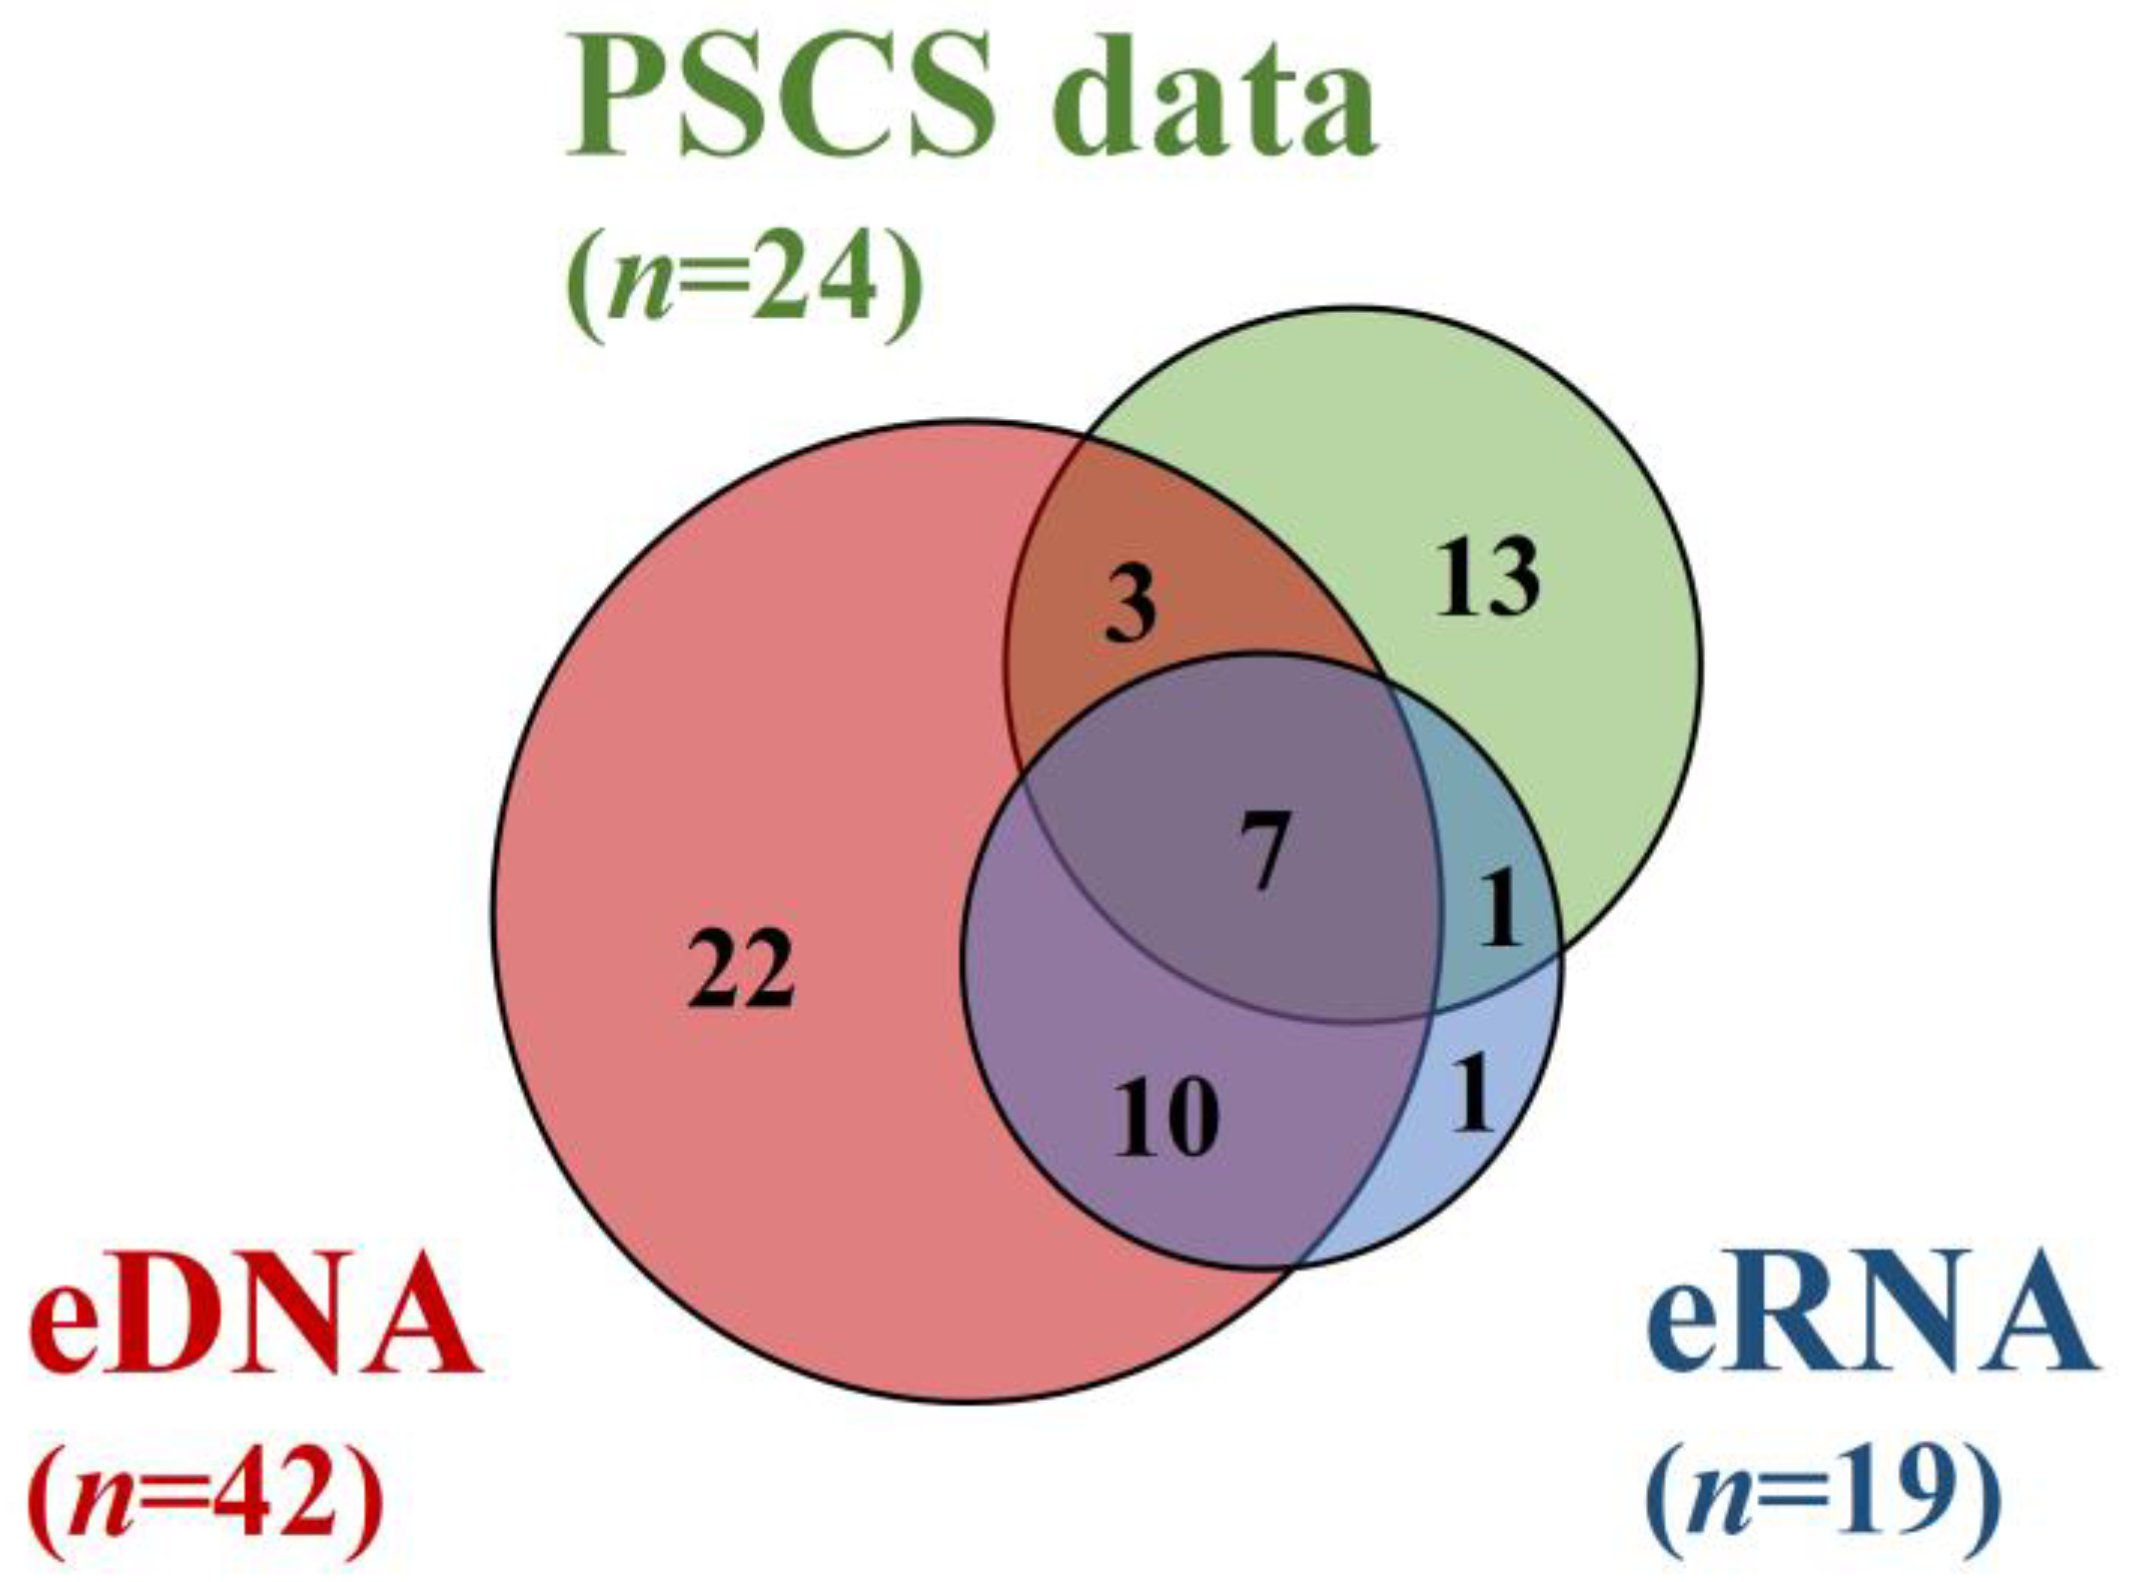
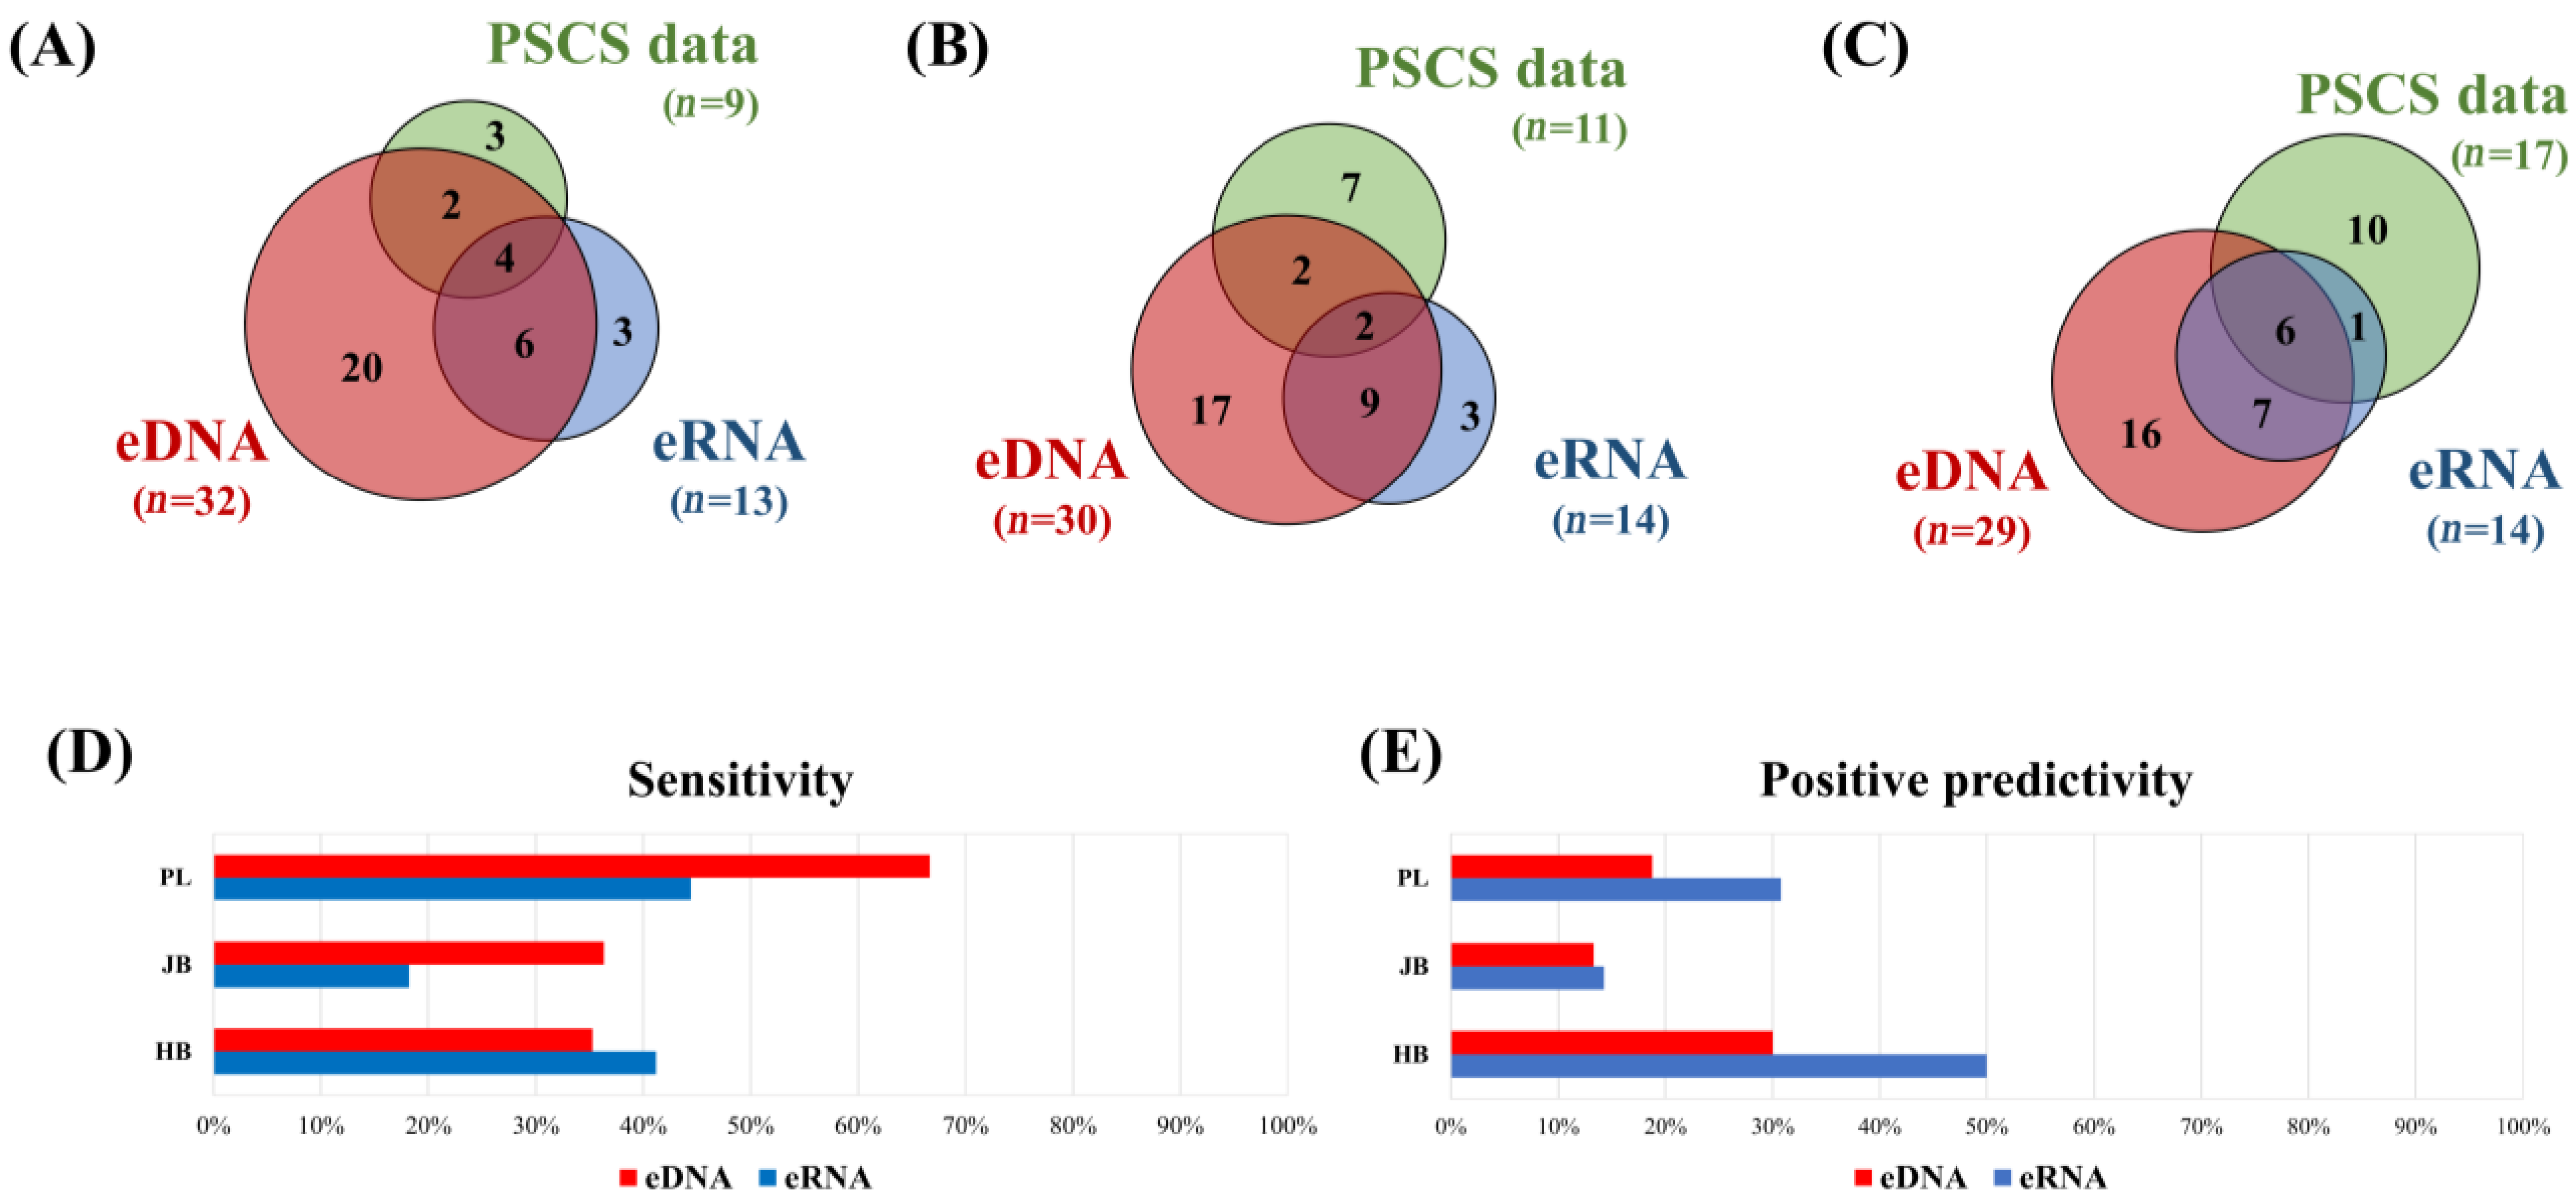
3.2. Comparison of the eDNA and eRNA Metabarcoding Positives, as well as of the Previous Specimen Capture Survey Data

Based on the ASVs obtained from the eDNA and eRNA samples, we computed the presence, or absence, of the fish species reported using each method. Then, we evaluated the relative effectiveness of the eDNA and eRNA for detecting fish species. A total of 44 freshwater fish species were identified by either eDNA or eRNA metabarcoding, of which 25 were recognized using only eDNA metabarcoding, 2 when using only eRNA metabarcoding, and 17 when using both eDNA and eRNA metabarcoding. The freshwater fish species identified at each location using eDNA and eRNA metabarcoding are listed in Table S3. Next, the eDNA and eRNA metabarcoding results were compared with the PSCS data from the freshwater environment to understand their relative usefulness (Table S3). We constructed a Venn diagram to visualize the differences between the fish species detected when using eDNA and eRNA metabarcoding and the PSCS data from all locations (Figure 2). This diagram shows that three, one, and seven species of the 24 species observed in the PSCS data were identified by only eDNA, only eRNA, or by eDNA and eRNA metabarcoding together, respectively.
A comparison between the PSCS and metabarcoding data is shown in Figure 3. The upper side of Figure 3 is a Venn diagram comparing the fish species identified when using eDNA metabarcoding, eRNA metabarcoding, and PSCS data at each location. The lower side is a bar chart that compares the sensitivity and positive predictivity of eDNA, eRNA, and PSCS data at each location. At all locations, the number of fish species observed using eDNA was higher than both eRNA metabarcoding and the PSCS data. The sensitivity and positive predictivity of the eDNA and eRNA were calculated to evaluate the level of efficacy for detecting fish that was established in previous studies [17]. The sensitivity was higher for eDNA than for eRNA in all of the locations excluding HB, while the positive predictivity was higher for eRNA than for eDNA in all locations.

4. Discussion

This was a preliminary study that was conducted to assess the presence of fish in the Han River aquatic environment when using eDNA and eRNA metabarcoding analyses. Moreover, we estimated the relative usefulness of eDNA and eRNA by comparing certain detection methods when they were applied to six years of PSCS data, which were gathered from the same locations in the Han River. This is the first study to compare the identification of fish species by eRNA and eDNA metabarcoding when using 12S rRNA genes in the Han River of Korea. Only a limited number of studies have utilized eRNA for monitoring fish through metabarcoding, and these studies have revealed variations in their results when compared to eDNA metabarcoding [17]. In this study, eDNA identified more species at all three locations than eRNA (Figure 2, Table S3). Compared to the PSCS data, a total of three species were exclusively identified at each location through only eDNA metabarcoding: Hemibarbus labeo, Zacco platypus, and Tanachia lanceolata. Furthermore, a minimum of one and a maximum of two species were found at each location (Figure 2 and Table S3). In contrast, only one species, Tanakia limbata, was identified through only eRNA metabarcoding when compared to the PSCS data, and it was detected in PL. DNA is more stable than RNA, and it is likely to be present in higher amounts in the environment. This fact may account for the detection of more species when using eDNA metabarcoding [36,37]. Similar findings have been reported in previous studies on freshwater fish, arthropods, and foraminifera [17,24,37]. Therefore, eDNA may be applicable for a variety of practical purposes, such as monitoring fisheries to detect various fish species.
However, one of the disadvantages of eDNA is that it can generate false positives for organisms that are dead or who, for other reasons, do not currently inhabit the testing environment [17]. In fact, among the species that were only identified by eDNA in this study, eight of the species were not found in the freshwater environment of the Han River, nor were they present in any previous records (Table S4). These species included the following: Clupea harengus, Scomberomorus nipponius, Paralichthys olivaceus, Lophius ritulon, Engraulis japonicus, Gadus sp., Nuchequula sp., and Scomber sp. All of these species are known to live in the ocean (Table S4). It was estimated that saltwater and brackish water do not naturally rise up to the locations that were sampled in this study since the most direct sources of saltwater and brackish water were at least 55 km away from the most downstream sampling location of HB. Moreover, previous studies have shown annual salinity measurements below 0.5 PSU at this location [38]. However, eDNA contamination may occur from several sources. Among the fishes that should not be recognized at the sampling locations included edible fishes such as cutlassfish and mackerel, as well as those used as fishing bait such as Japanese anchovy. The eDNA of marine fish (which are commonly used as food) can be extracted from wastewater that contains the remains of consumed fish, and the eDNA of marine fish used bait is also a direct source of potential DNA contamination [17]. Furthermore, in the current study, we found no eRNA from the marine fish species in the eRNA metabarcoding results. Previous studies have shown that RNA is less stable than DNA, and that degrades rapidly after cell death; as such, it is present in the environment for a shorter time [36,39]. In addition, experiments that have compared the decay rates of DNA and RNA for both nuclear and mitochondrial genes have confirmed that RNA degradation is much faster than DNA degradation [19]. This suggests that eRNA metabarcoding may be a helpful approach through which to compensate for the false positive issues arising from eDNA metabarcoding, and that eRNA can potentially increase the resolution regarding the presence or absence of fish species that are detected by eDNA metabarcoding analysis.
Despite the fact that eRNA is more effective than eDNA in identifying false positives, approaches using only eRNA and not eDNA could potentially lead to false negative issues due to the rapid degradation of eRNA [36,39]. In this study, to minimize the experimental differences between eDNA and eRNA, the eDNA and eRNA samples were collected from the same location at the same time and filtered under controlled light and refrigeration conditions in a laboratory. However, the eRNA still detected a relatively smaller number of fish species than eDNA. This may be due to the smaller amount of RNA compared to DNA or due to the lower stability of RNA compared to DNA [36]. In addition, the water samples collected in this study were transported to the laboratory and filtered. It is possible that the less stable eRNA degraded more rapidly than eDNA during transportation, thus leading to the detection of fewer fish species. It may also have contributed to the detected species due to the different volumes of collected water samples. Previous studies have shown that factors such as UV light, temperature, and the presence of RNases can affect eRNA degradation [36,39,40,41]. It has also been reported that the relationship between the relative amounts of eRNA and eDNA can vary depending on environmental factors such as temperature, water quality, and salt concentration [17,19]. To address these weaknesses, future studies should reference the methods outlined in previous studies, as well as conduct immediate field filtering and the fixation of eDNA and eRNA upon collection to minimize degradation bias [17,42]. Additionally, performing negative controls in field filtering can enhance the confirmation of contamination [17]. Furthermore, analyzing the number of fish species detected in different volumes of water samples is essential to determine the appropriate collection volume for fish monitoring, as well as to ensure reproducibility [43]. Future studies should incorporate comprehensive field sampling protocols that consider variable environmental factors, including location, temperature, pH, and salt concentration differences, as well as seek to verify reproducibility through long-term replicated monitoring. In addition, comparative analyses on the laboratory scale should be conducted to understand the differences between eDNA and eRNA. Taken together, the use of eRNA for monitoring the presence of fish requires further standardization through a variety of experiments. Based on this, when employed in conjunction with eDNA metabarcoding, eRNA metabarcoding could offer a powerful tool for monitoring fish presence.
The average sensitivity was about 34.6% for eRNA and 46.1% for eDNA, with eDNA showing a relatively higher sensitivity (Figure 3D). These results indicate a relatively higher likelihood for detecting the fishes that are present when using eDNA. In contrast, the average positive predictivity was about 31.7% for eRNA and 20.7% for eDNA, with eRNA having a relatively higher positive predictivity (Figure 3E). This meant that the probability for detecting the fish that actually inhabit the environment among all of the fish detected via metabarcoding is relatively higher when using eRNA relative to eDNA. Previous studies by Miyata et al. [17] and Littlefair et al. [44] also showed that the positive predictivity of eRNA was significantly higher than eDNA when examining the presence of freshwater fish. In addition, Miyata et al. [24] also showed that the positive predictivity of eRNA was higher than eDNA for arthropods, and that the sensitivity of eDNA was higher than that of eRNA. Taken together, these results suggest that the positive predictivity is likely to be relatively higher for eRNA than for eDNA due to the presence of the DNA from dead or dormant organisms. Conversely, it could also be due to the accumulated DNA remaining in the environment or the DNA transported from upstream. Moreover, sensitivity is likely to be relatively higher for eDNA than for eRNA because only living organisms with cellular activity at the sampling locations contribute to eRNA [44]. Thus, eDNA is a sensitive tool for understanding the environment as a whole over a long period, including the present and past rather than the only current, while eRNA is appropriate for identifying living organisms in a current collection location. Due to this complementation, combining eDNA and eRNA for fish monitoring will enhance the advantages of each, compensate for their disadvantages with respect to avoiding false positives, and enable effective detection, thus resulting in achieving a more comprehensive understanding than when using a single marker alone. Future studies are required for expanding the application of combined eDNA and eRNA for monitoring field environments. Moreover, additional experiments are required under more varied environmental conditions, including different temperatures, pH values, as well as for other environmental factors, species, and locations.

5. Conclusions

The results of this study demonstrate the potential aspects of eDNA and eRNA metabarcoding analyses, as well as their usefulness as a tool for fish monitoring when trying to avoid false positives. While eDNA detects a wider range of species than eRNA, it is prone to false positives. In contrast, eRNA provides in-depth information about living organisms in the target environment, but it also offers narrower geographical and temporal scales relative to eDNA. Therefore, using combined eDNA and eRNA data can be effective for identifying false positives and monitoring fish species that actually live in the environment examined. In the future, the combination of eDNA and eRNA metabarcoding could be applied to gain valuable insight into the aquatic environment and to improve the monitoring of fisheries.

Supplementary Materials

The following supporting information can be downloaded at the following: https://www.mdpi.com/article/10.3390/fishes8110550/s1, Table S1: Environmental variables for the three freshwater sampling locations in the Han River; Table S2: Read count information of the eDNA and eRNA sequences; Table S3: Comparison of the species identified by eDNA and eRNA metabarcoding, as well as the previous specimen capture survey (PSCS) data; Table S4: List of the saltwater and brackish water fishes detected at each location by metabarcoding; Figure S1: Rarefaction curves of the eDNA and eRNA metabarcoding when using 12S rRNA.

Author Contributions

Conceptualization, H.-E.A. and C.-B.K.; methodology, H.-E.A., M.-H.M. and C.-B.K.; software, C.-B.K.; validation, H.-E.A. and M.-H.M.; formal analysis, C.-B.K.; investigation, H.-E.A. and M.-H.M.; resources, C.-B.K.; data curation, H.-E.A. and M.-H.M.; writing—original draft, H.-E.A., M.-H.M. and C.-B.K.; writing—review and editing, H.-E.A. and C.-B.K.; visualization, M.-H.M. and C.-B.K.; supervision, H.-E.A.; funding acquisition, C.-B.K. All authors have read and agreed to the published version of the manuscript.

Funding

This research was supported by a grant from the National Institute of Biological Resources (NIBR), which was funded by the Ministry of Environment (MOE) of the Republic of Korea (NIBR202333202).

Institutional Review Board Statement

Not applicable. This study is not applicable because it was not conducted directly with living organisms.

Data Availability Statement

The sequence data that support the findings of this study are openly available in BioProject, BioSample, and the SRA of NCBI at (https://www.ncbi.nlm.nih.gov/, 29 November 2023) under accession nos. PRJNA960938, SAMN34339694 to SAMN34339696, and SRR24282892 to SRR24282903, respectively.

Acknowledgments

Sincere appreciation is expressed to Jung-Il Kim, Tae-June Choi, Jong-Won Baek, and Seung-Min Han (Department of Biotechnology, Sangmyung University) for supporting the sample collection for this study.

Conflicts of Interest

The authors declare no conflict of interest.

References

  1. Karr, J.R. Assessing Biological Integrity in Running Waters: A Method and Its Rationale; Illinois Natural History Survey Special Publication No. 05; Illinois Natural History Survey: Champaign, IL, USA, 1986. [Google Scholar]
  2. Harris, J.H. The use of fish in ecological assessments. Aust. J. Ecol. 1995, 20, 65–80. [Google Scholar] [CrossRef]
  3. Dudgeon, D. Prospects for sustaining freshwater biodiversity in the 21st century: Linking ecosystem structure and function. Curr. Opin. Environ. Sustain. 2010, 2, 422–430. [Google Scholar] [CrossRef]
  4. Stat, M.; John, J.; DiBattista, J.D.; Newman, S.J.; Bunce, M.; Harvey, E.S. Combined use of eDNA metabarcoding and video surveillance for the assessment of fish biodiversity. Conserv. Biol. 2019, 33, 196–205. [Google Scholar] [CrossRef]
  5. Bonar, S.A.; Contreras-Balderas, S.; Iles, A.C. An introduction to standardized sampling. In Standard Methods for Sampling North American Freshwater Fishes; Bonar, S., Hubert, W.A., Willis, D.W., Eds.; American Fisheries Society: Bethesda, MD, USA, 2009; pp. 1–12. [Google Scholar]
  6. Pope, K.L.; Lochmann, S.E.; Young, M.K. Methods for assessing fish populations. In Inland Fisheries Management in North America, 3rd ed.; Hubert, W.A., Quist, M.C., Eds.; American Fisheries Society: Bethesda, MD, USA, 2010; pp. 325–351. [Google Scholar]
  7. Yamamoto, S.; Minami, K.; Fukaya, K.; Takahashi, K.; Sawada, H.; Murakami, H.; Tsuji, S.; Hashizume, H.; Kubonaga, S.; Horiuchi, T. Environmental DNA as a ‘snapshot’of fish distribution: A case study of Japanese jack mackerel in Maizuru Bay, Sea of Japan. PLoS ONE 2016, 11, e0149786. [Google Scholar]
  8. Evans, N.T.; Lamberti, G.A. Freshwater fisheries assessment using environmental DNA: A primer on the method, its potential, and shortcomings as a conservation tool. Fish. Res. 2018, 197, 60–66. [Google Scholar] [CrossRef]
  9. Murakami, H.; Yoon, S.; Kasai, A.; Minamoto, T.; Yamamoto, S.; Sakata, M.K.; Horiuchi, T.; Sawada, H.; Kondoh, M.; Yamashita, Y. Dispersion and degradation of environmental DNA from caged fish in a marine environment. Fish. Sci. 2019, 85, 327–337. [Google Scholar] [CrossRef]
  10. Ruppert, K.M.; Kline, R.J.; Rahman, M.S. Past, present, and future perspectives of environmental DNA (eDNA) metabarcoding: A systematic review in methods, monitoring, and applications of global eDNA. Glob. Ecol. Conserv. 2019, 17, e00547. [Google Scholar] [CrossRef]
  11. Hallam, J.; Clare, E.L.; Jones, J.I.; Day, J.J. Biodiversity assessment across a dynamic riverine system: A comparison of eDNA metabarcoding versus traditional fish surveying methods. Environ. DNA 2021, 3, 1247–1266. [Google Scholar] [CrossRef]
  12. Vautier, M.; Chardon, C.; Goulon, C.; Guillard, J.; Domaizon, I. A quantitative eDNA-based approach to monitor fish spawning in lakes: Application to European perch and whitefish. Fish. Res. 2023, 264, 106708. [Google Scholar] [CrossRef]
  13. Miya, M.; Sato, Y.; Fukunaga, T.; Sado, T.; Poulsen, J.Y.; Sato, K.; Minamoto, T.; Yamamoto, S.; Yamanaka, H.; Araki, H. MiFish, a set of universal PCR primers for metabarcoding environmental DNA from fishes: Detection of more than 230 subtropical marine species. R. Soc. Open Sci. 2015, 2, 150088. [Google Scholar] [CrossRef]
  14. Wang, X.; Lu, G.; Zhao, L.; Du, X.; Gao, T. Assessment of fishery resources using environmental DNA: The large yellow croaker (Larimichthys crocea) in the East China Sea. Fish. Res. 2021, 235, 105813. [Google Scholar] [CrossRef]
  15. Giroux, M.S.; Reichman, J.R.; Langknecht, T.; Burgess, R.M.; Ho, K.T. Environmental RNA as a tool for marine community biodiversity assessments. Sci. Rep. 2022, 12, 17782. [Google Scholar] [CrossRef] [PubMed]
  16. Hu, W.; Su, C.; Liu, Q.; Kong, Y.; Hua, S.; Hu, Z. Comparison of fish communities using environmental DNA metabarcoding and capture methods in a freshwater lake: A new set of universal PCR primers. Fish. Res. 2022, 253, 106365. [Google Scholar] [CrossRef]
  17. Miyata, K.; Inoue, Y.; Amano, Y.; Nishioka, T.; Yamane, M.; Kawaguchi, T.; Morita, O.; Honda, H. Fish environmental RNA enables precise ecological surveys with high positive predictivity. Ecol. Ind. 2021, 128, 107796. [Google Scholar] [CrossRef]
  18. Jo, T.; Yamanaka, H. Meta-Analyses of Environmental DNA Downstream Transport and Deposition in Relation to Hydrogeography in Riverine Environments. Freshw. Biol. 2022, 67, 1333–1343. [Google Scholar] [CrossRef]
  19. Marshall, N.T.; Vanderploeg, H.A.; Chaganti, S.R. Environmental (e) RNA advances the reliability of eDNA by predicting its age. Sci. Rep. 2021, 11, 2769. [Google Scholar] [CrossRef]
  20. Cristescu, M.E. Can environmental RNA revolutionize biodiversity science? Trends Ecol. Evol. 2019, 34, 694–697. [Google Scholar] [CrossRef]
  21. Laroche, O.; Wood, S.A.; Tremblay, L.A.; Lear, G.; Ellis, J.I.; Pochon, X. Metabarcoding monitoring analysis: The pros and cons of using co-extracted environmental DNA and RNA data to assess offshore oil production impacts on benthic communities. PeerJ 2017, 5, e3347. [Google Scholar] [CrossRef]
  22. Torti, A.; Lever, M.A.; Jørgensen, B.B. Origin, dynamics, and implications of extracellular DNA pools in marine sediments. Mar. Genom. 2015, 24, 185–196. [Google Scholar] [CrossRef]
  23. Kitahashi, T.; Sugime, S.; Inomata, K.; Nishijima, M.; Kato, S.; Yamamoto, H. Meiofaunal diversity at a seamount in the pacific ocean: A comprehensive study using environmental DNA and RNA. Deep Sea Res. Part I Oceanogr. Res. Pap. 2020, 160, 103253. [Google Scholar] [CrossRef]
  24. Miyata, K.; Inoue, Y.; Amano, Y.; Nishioka, T.; Nagaike, T.; Kawaguchi, T.; Morita, O.; Yamane, M.; Honda, H. Comparative environmental RNA and DNA metabarcoding analysis of river algae and arthropods for ecological surveys and water quality assessment. Sci. Rep. 2022, 12, 19828. [Google Scholar] [CrossRef] [PubMed]
  25. Choi, T.; Malik, A.; An, H.; Kim, J.; Dinh Do, T.; Kim, C. Seasonal Diversity of Microeukaryotes in the Han River, Korea Through 18S rRNA Gene Metabarcoding. Evol. Bioinform. 2022, 18, 11769343221074688. [Google Scholar] [CrossRef]
  26. Kim, D.; Kim, B. Primary productivity in lake Paldang. Korean J. Limn. 1990, 23, 167–179. [Google Scholar]
  27. Pochon, X.; Zaiko, A.; Fletcher, L.M.; Laroche, O.; Wood, S.A. Wanted dead or alive? Using metabarcoding of environmental DNA and RNA to distinguish living assemblages for biosecurity applications. PLoS ONE 2017, 12, e0187636. [Google Scholar] [CrossRef] [PubMed]
  28. Hundermark, E.L.; Takahashi, M.K. Improving the yield of environmental DNA from filtered aquatic samples. Conserv. Genet. Resour. 2020, 12, 49–51. [Google Scholar] [CrossRef]
  29. Bolyen, E.; Rideout, J.R.; Dillon, M.R.; Bokulich, N.A.; Abnet, C.C.; Al-Ghalith, G.A.; Alexander, H.; Alm, E.J.; Arumugam, M.; Asnicar, F. Reproducible, interactive, scalable and extensible microbiome data science using QIIME 2. Nat. Biotechnol. 2019, 37, 852–857. [Google Scholar] [CrossRef]
  30. Andrews, S. FastQC: A Quality Control Tool for High Throughput Sequence Data. 2010. Available online: http://www.bioinformatics.babraham.ac.uk/projects/fastqc (accessed on 3 May 2020).
  31. Callahan, B.J.; McMurdie, P.J.; Rosen, M.J.; Han, A.W.; Johnson, A.J.A.; Holmes, S.P. DADA2. High-resolution sample inference from Illumina amplicon data. Nat. Methods 2016, 13, 581–583. [Google Scholar] [CrossRef]
  32. Joos, L.; Beirinckx, S.; Haegeman, A.; Debode, J.; Vandecasteele, B.; Baeyen, S.; Goormachtig, S.; Clement, L.; De Tender, C. Daring to be differential: Metabarcoding analysis of soil and plant-related microbial communities using amplicon sequence variants and operational taxonomical units. BMC Genom. 2020, 21, 733. [Google Scholar] [CrossRef]
  33. Camacho, C.; Coulouris, G.; Avagyan, V.; Ma, N.; Papadopoulos, J.; Bealer, K.; Madden, T.L. BLAST: Architecture and applications. BMC Bioinform. 2009, 10, 421. [Google Scholar] [CrossRef]
  34. Lim, S.J.; Thompson, L.R. Mitohelper: A mitochondrial reference sequence analysis tool for fish eDNA studies. Environ. DNA 2021, 3, 706–715. [Google Scholar] [CrossRef]
  35. Iwasaki, W.; Fukunaga, T.; Isagozawa, R.; Yamada, K.; Maeda, Y.; Satoh, T.P.; Sado, T.; Mabuchi, K.; Takeshima, H.; Miya, M. MitoFish and MitoAnnotator: A mitochondrial genome database of fish with an accurate and automatic annotation pipeline. Mol. Biol. Evol. 2013, 30, 2531–2540. [Google Scholar] [CrossRef]
  36. Wood, S.A.; Biessy, L.; Latchford, J.L.; Zaiko, A.; von Ammon, U.; Audrezet, F.; Cristescu, M.E.; Pochon, X. Release and degradation of environmental DNA and RNA in a marine system. Sci. Total Environ. 2020, 704, 135314. [Google Scholar] [CrossRef]
  37. Greco, M.; Lejzerowicz, F.; Reo, E.; Caruso, A.; Maccotta, A.; Coccioni, R.; Pawlowski, J.; Frontalini, F. Environmental RNA outperforms eDNA metabarcoding in assessing impact of marine pollution: A chromium-spiked mesocosm test. Chemosphere 2022, 298, 134239. [Google Scholar] [CrossRef]
  38. Park, G.S. Salinity distribution and ecological environment of Han river estuary. J. Wetl. Res. 2004, 6, 149–166. [Google Scholar]
  39. Qian, T.; Shan, X.; Wang, W.; Jin, X. Effects of Temperature on the Timeliness of eDNA/eRNA: A Case Study of Fenneropenaeus chinensis. Water 2022, 14, 1155. [Google Scholar] [CrossRef]
  40. Jo, T.; Takao, K.; Minamoto, T. Linking the state of environmental DNA to its application for biomonitoring and stock assessment: Targeting mitochondrial/nuclear genes, and different DNA fragment lengths and particle sizes. Environ. DNA 2022, 4, 271–283. [Google Scholar] [CrossRef]
  41. Kagzi, K.; Hechler, R.M.; Fussmann, G.F.; Cristescu, M.E. Environmental RNA degrades more rapidly than environmental DNA across a broad range of pH conditions. Mol. Ecol. Resour. 2022, 22, 2640–2650. [Google Scholar] [CrossRef]
  42. Parsley, M.B.; Goldberg, C.S. Environmental RNA can distinguish life stages in amphibian populations. In Molecular Ecology Resources; Wiley: Hoboken, NJ, USA, 2023. [Google Scholar]
  43. Sakata, M.K.; Watanabe, T.; Maki, N.; Ikeda, K.; Kosuge, T.; Okada, H.; Yamanaka, H.; Sado, T.; Miya, M.; Minamoto, T. Determining an effective sampling method for eDNA metabarcoding: A case study for fish biodiversity monitoring in a small, natural river. Limnology 2021, 22, 221–235. [Google Scholar] [CrossRef]
  44. Littlefair, J.E.; Rennie, M.D.; Cristescu, M.E. Environmental nucleic acids: A field-based comparison for monitoring freshwater habitats using eDNA and eRNA. Mol. Ecol. Resour. 2022, 22, 2928–2940. [Google Scholar] [CrossRef] [PubMed]
Figure 1. The three freshwater sampling sites (PL, JB, and HB) in the Han River, Korea—PL: Paldang Lake; JB: Jamsil Bridge; and HB: Haengju Bridge.
Fishes 08 00550 g001
Figure 2. Venn diagrams indicating the number of detected species detected based on the fish species identified by environmental DNA (eDNA) and environmental RNA (eRNA) metabarcoding, as well as by the previous specimen capture survey (PSCS) data at each sampling location. n = number of species.
Fishes 08 00550 g002
Figure 3. Venn diagrams indicating the number of detected species, as well as bar charts indicating the sensitivity and positive predictivity of the eDNA and eRNA metabarcoding analyses. The data show the fish species that were detected by environmental DNA (eDNA) and environmental RNA (eRNA) metabarcoding, as well as those by the previous specimen capture survey (PSCS) data at each sampling location. (A) Venn diagram of Paldang Lake, (B) Venn diagram of Jamsil Bridge, (C) Venn diagram of Haengju Bridge, (D) the sensitivity of each sampling location, and (E) the positive predictivity of each sampling location. n = number of species.
Fishes 08 00550 g003
Disclaimer/Publisher’s Note: The statements, opinions and data contained in all publications are solely those of the individual author(s) and contributor(s) and not of MDPI and/or the editor(s). MDPI and/or the editor(s) disclaim responsibility for any injury to people or property resulting from any ideas, methods, instructions or products referred to in the content.

