
Genetic Diversity and Genetic Structure among Four Selected Strains of Whiteleg Shrimp (Litopenaeus vannamei) Using SSR Markers

Abstract
:1. Introduction
2. Materials and Methods
2.1. Sample Collection
2.2. DNA Extraction
2.3. Microsatellite Loci Amplification and Genotyping
2.4. Data Analysis
3. Results
3.1. Genetic Diversity Analysis
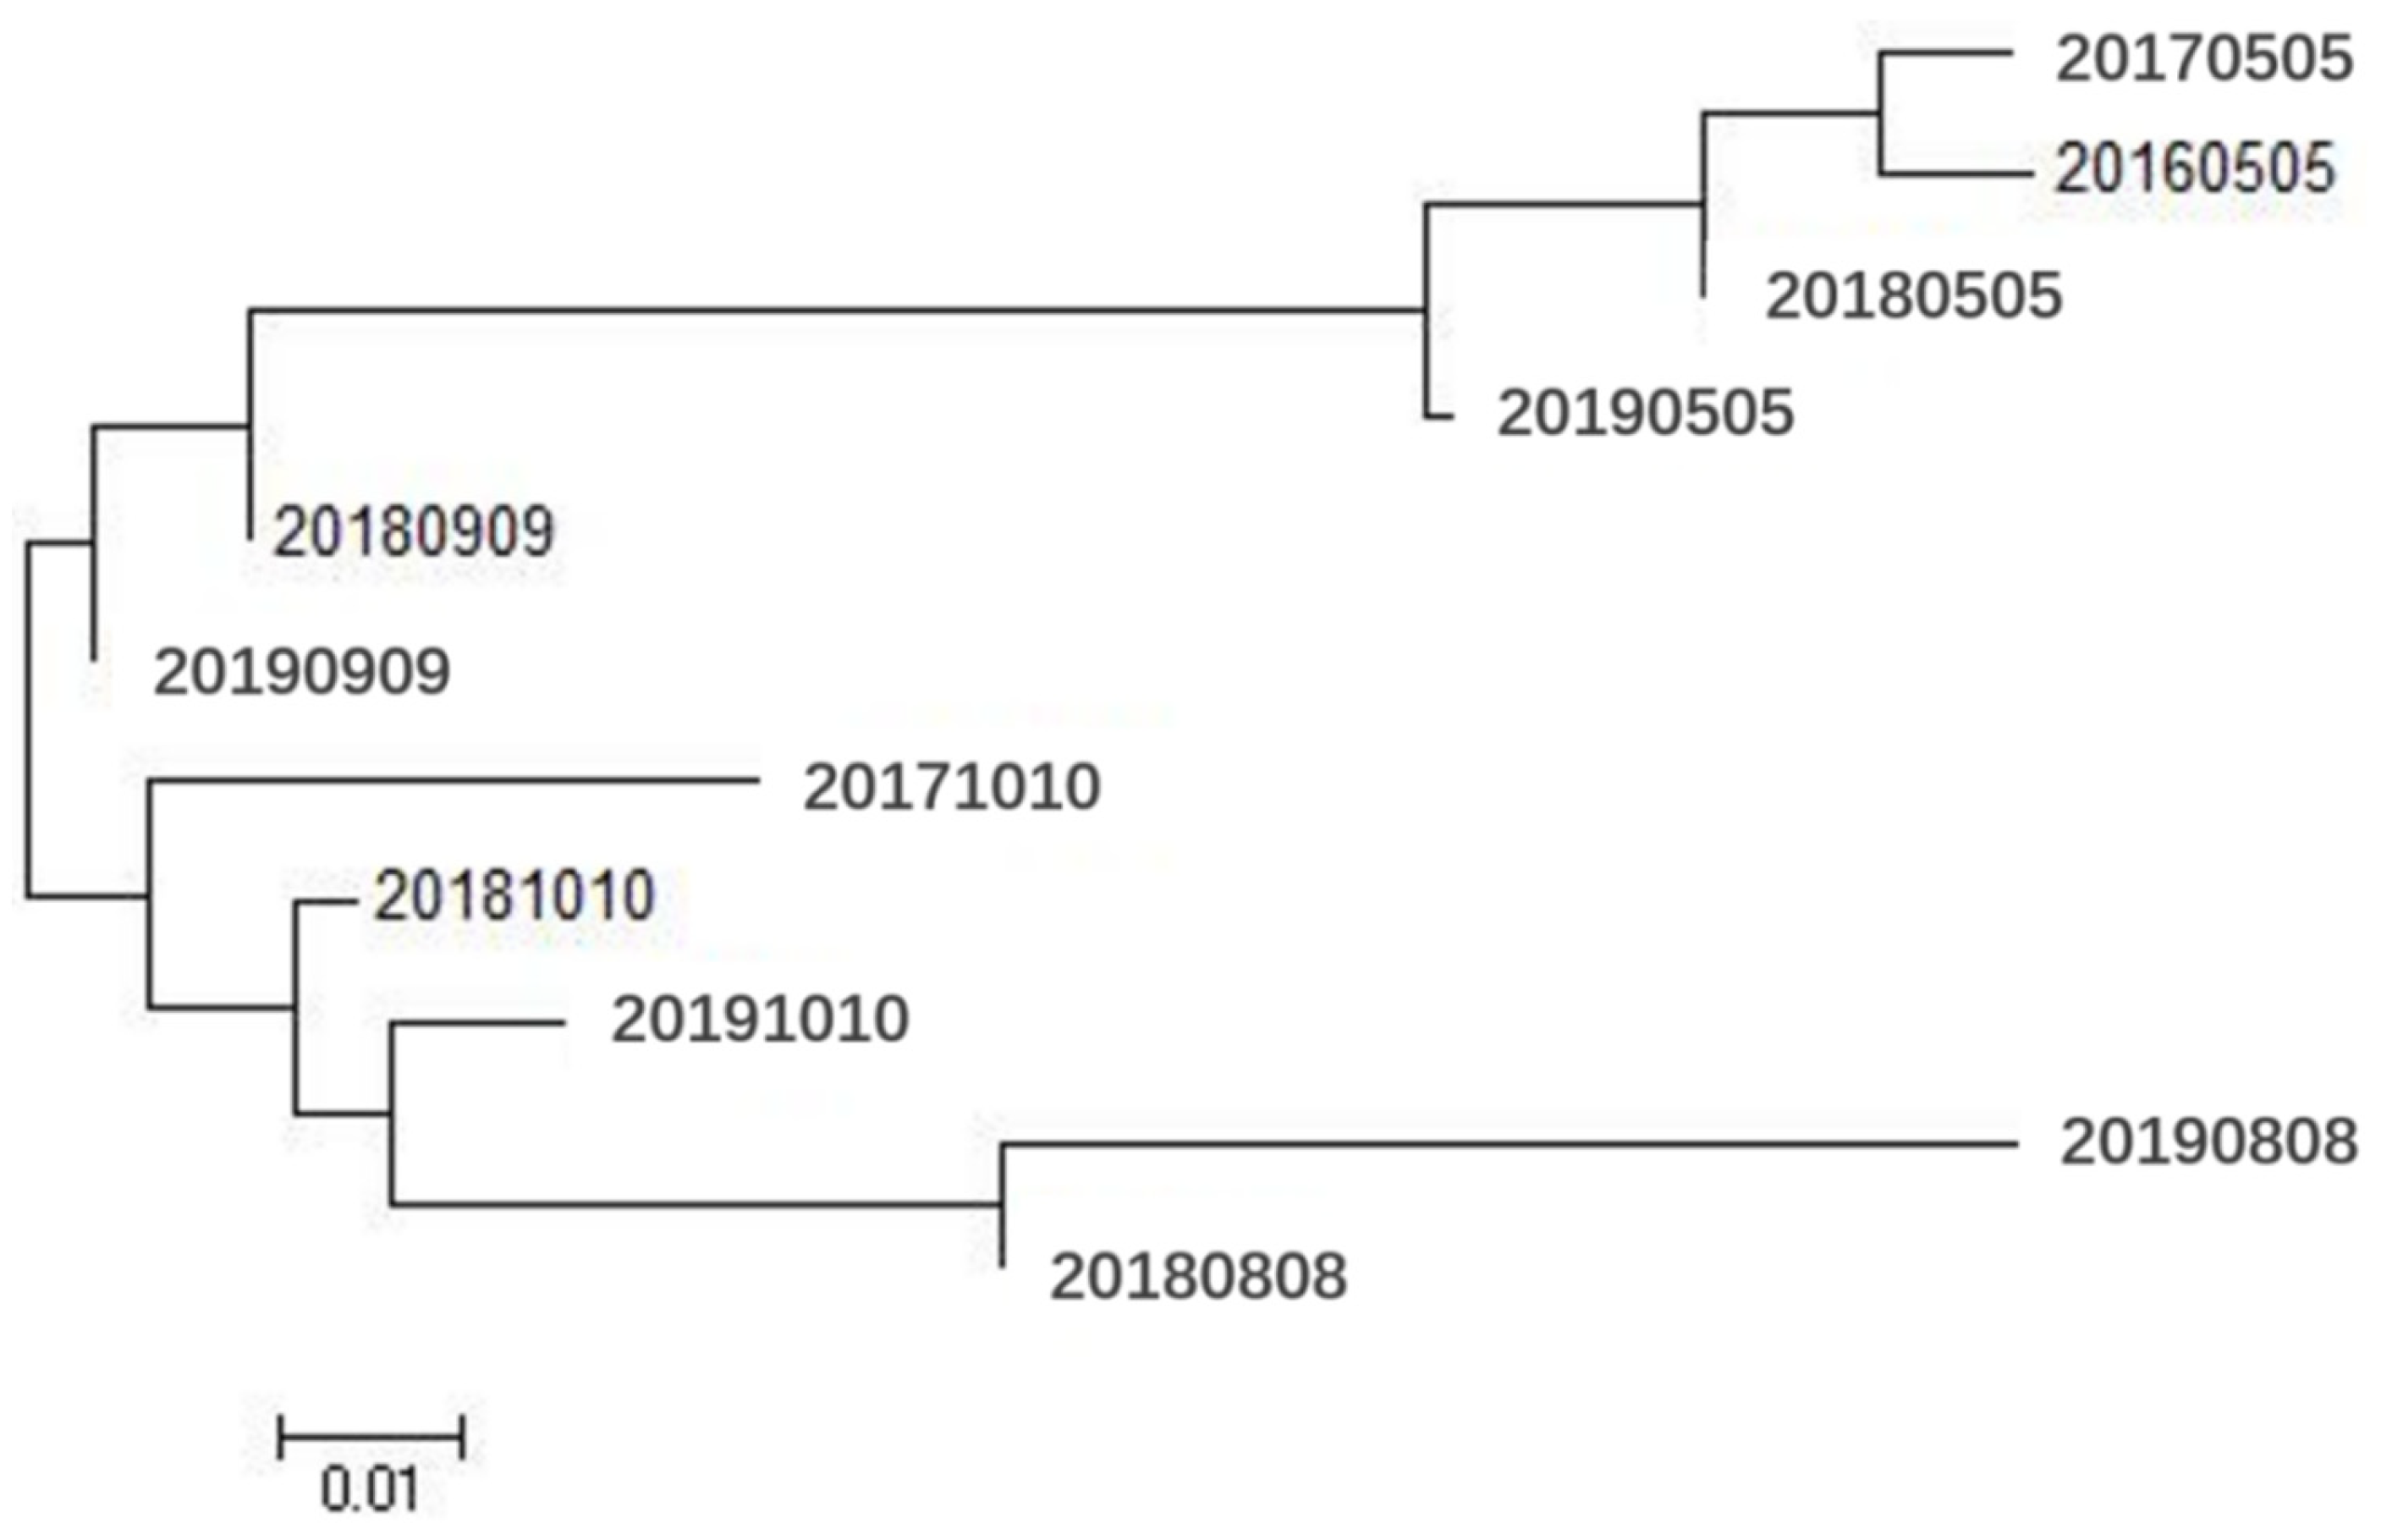
3.2. Genetic Relationships among Populations
4. Discussion
5. Conclusions
Author Contributions
Funding
Institutional Review Board Statement
Data Availability Statement
Acknowledgments
Conflicts of Interest
References
- Chen, X.; Xiong, J. Development of the Culture of the White-Legged Shrimp, Penaeus vannamei. In Aquaculture in China: Success Stories and Modern Trends; Gui, J.-F., Tang, Q., Li, Z., Liu, J., De Silva, S.S., Eds.; Wiley: New York, NY, USA, 2018; pp. 378–392. [Google Scholar]
- Lind, C.E.; Evans, B.S.; Knauer, J.; Taylor, J.J.U.; Jerry, D.R. Decreased genetic diversity and a reduced effective population size in cultured silver-lipped pearl oysters (Pinctada maxima). Aquaculture 2009, 286, 12–19. [Google Scholar] [CrossRef]
- Holland, B.S. Invasion without a bottleneck: Microsatellite variation in natural and invasive populations of the brown mussel Perna perna (L). Mar. Biotechnol. 2001, 3, 407–415. [Google Scholar] [CrossRef]
- Zane, L.; Bargelloni, L.; Patarnello, T. Strategies for microsatellite isolation: A review. Mol. Ecol. 2002, 11, 1–16. [Google Scholar] [CrossRef]
- O’Connell, M.; Wright, J.M. Microsatellite DNA in fishes. Rev. Fish Biol. Fish. 1997, 7, 331–363. [Google Scholar] [CrossRef]
- Yang, X.; Xu, Y.; Shah, T.; Li, H.; Han, Z.; Li, J.; Yan, J. Comparison of SSRs and SNPs in assessment of genetic relatedness in maize. Genetica 2011, 139, 1045–1054. [Google Scholar] [CrossRef]
- Gallagher, J.; Lordan, C.; Hughes, G.M.; Jonasson, J.P.; Carlsson, J. Microsatellites obtained using high throughput sequencing and a novel microsatellite genotyping method reveals population genetic structure in Norway Lobster, Nephrops norvegicus. J. Sea Res. 2022, 179, 102139. [Google Scholar] [CrossRef]
- Chen, Y.; Xu, C.; Li, Q. Genetic diversity in a genetically improved line of the Pacific oyster Crassostrea gigas with orange shell based on microsatellites and mtDNA data. Aquaculture 2022, 549, 737791. [Google Scholar] [CrossRef]
- Amane, Z.; Tazi, L.; Ouagajjou, Y.; Ouazzani, K.C.; Nabich, A.; Chlaida, M. Genetic structuring in the grooved carpet shell clam Ruditapes decussatus along the Moroccan coasts revealed by microsatellites. Reg. Stud. Mar. Sci. 2021, 46, 101888. [Google Scholar] [CrossRef]
- Diyie, R.L.; Agyarkwa, S.K.; Armah, E.; Amonoo, N.A.; Owusu-Frimpong, I.; Osei-Atweneboana, M.Y. Genetic variations among different generations and cultured populations of Nile Tilapia (Oreochromis niloticus) in Ghana: Application of microsatellite markers. Aquaculture 2021, 544, 737070. [Google Scholar] [CrossRef]
- Wirgin, I.; Maceda, L.; Stabile, J.; Waldman, J. Genetic Population Structure of Summer Flounder Paralichthys dentatus using Microsatellite DNA Analysis. Fish Res. 2022, 250, 106270. [Google Scholar] [CrossRef]
- Lu, C.; Sun, Z.; Xu, P.; Na, R.; Lv, W.; Cao, D.; Liu, T.; Zheng, X. Novel microsatellites reveal wild populations genetic variance in pike-perch (Sander lucioperca) in China. Aquac. Rep. 2022, 23, 101031. [Google Scholar] [CrossRef]
- Liu, Q.; Li, C.; Li, W.; Gao, R.; Liu, B.; Liu, W.; Yi, G.; Zhang, L.; Li, M.; Su, J. Genetic identification of Chinese shrimp Fenneropenaeus chinensis post-release in Jinzhou Bay: Implications for management of stock enhancement. Reg. Stud. Mar. Sci. 2022, 53, 102425. [Google Scholar] [CrossRef]
- Sajeela, K.A.; Gopalakrishnan, A.; Basheer, V.S.; Mandal, A.; Bineesh, K.K.; Grinson, G.; Gopakumar, S.D. New insights from nuclear and mitochondrial markers on the genetic diversity and structure of the Indian white shrimp Fenneropenaeus indicus among the marginal seas in the Indian Ocean. Mol. Phylogenet. Evol. 2019, 136, 53–64. [Google Scholar] [CrossRef]
- Du, J.; Hou, C.; Chen, X.; Xiao, J.; Gul, Y.; Wang, H. Morphometric analysis and fluorescent microsatellite markers to evaluate the genetic diversity of five populations of Penaeus japonicus in China. Aquac. Fish. 2022, 7, 321–327. [Google Scholar] [CrossRef]
- Wong, L.L.; Chun, L.C.; Deris, Z.M.; Zainudin, A.A.; Ikhwanuddin, M.; Iehata, S.; Rahman, M.M.; Asaduzzaman, M. Genetic diversity and population structure of wild and domesticated black tiger shrimp (Penaeus monodon) broodstocks in the Indo-Pacific regions using consolidated mtDNA and microsatellite markers. Gene Rep. 2021, 23, 101047. [Google Scholar] [CrossRef]
- Atencia-Galindo, M.A.; Narvaéz, J.C.; Ramírez, A.; Paramo, J.; Aguire-Pabón, J.C. Genetic structure of the pink shrimp Penaeus (Farfantepenaeus) notialis (Pérez-Farfante, 1967) (Decapoda: Penaeidae) in the Colombian Caribbean. Fish. Res. 2021, 243, 106052. [Google Scholar] [CrossRef]
- Ren, S.; Mather, P.B.; Tang, B.; Hurwood, D.A. Levels of genetic diversity and inferred origins of Penaeus vannamei culture resources in China: Implications for the production of a broad synthetic base population for genetic improvement. Aquaculture 2018, 491, 221–231. [Google Scholar] [CrossRef]
- Zhang, T.; Kong, J.; Wang, W.; Wang, Q. Genetic variability assessed by microsatellites in the breeding populations of the shrimp Penaeus (Fenneropenaeus) chinensis in China. Aquaculture 2010, 310, 229–233. [Google Scholar] [CrossRef]
- Li, X.; Luan, S.; Cao, B.; Luo, K.; Tan, J.; Kong, Z.; Meng, X.; Kong, J. Genetic Background Analysis of Six Groups of White Shrimp Litopenaeus vannamei in China Using SSR Markers. Prog. Fish. Sci. 2020, 41, 103–110. [Google Scholar]
- Huang, X.; Xu, Y.; Hu, X.; Xu, W.; Su, H.; Wen, G.; Yang, K.; Cao, Y. Genetic diversity analysis of first filial generation of seven introduced Litopenaeus vannamei populations using microsatellite DNA markers. South China Fish. Sci. 2019, 15, 54–62. [Google Scholar]
- Rezaee, S.; Farahmand, H.; Nematollahi, M.A. Genetic diversity status of Pacific white shrimp (Litopenaeus vannamei) using SSR markers in Iran. Aquac. Int. 2016, 24, 479–489. [Google Scholar] [CrossRef]
- Meehan, D.; Xu, Z.; Zuniga, G.; Alcivar-Warren, A. High Frequency and Large Number of Polymorphic Microsatellites in Cultured Shrimp, Penaeus (Litopenaeus) vannamei [Crustacea: Decapoda]. Mar. Biotechnol. 2003, 5, 311–330. [Google Scholar] [CrossRef] [PubMed]
- Van Oosterhout, C.; Hutchinson, W.F.; Wills, D.P.M.; Shipley, P. MICRO-CHECKER: Software for identifying and correcting genotyping errors in microsatellite data. Mol. Ecol. Notes 2004, 4, 535–538. [Google Scholar] [CrossRef]
- Excoffier, L.; Lischer, H.E. Arlequin suite ver 3.5: A new series of programs to perform population genetics analyses under Linux and Windows. Mol. Ecol. Resour. 2010, 10, 564–567. [Google Scholar] [CrossRef] [PubMed]
- Peakall, R.; Smouse, P.E. GENALEX 6: Genetic analysis in Excel. Population genetic software for teaching and research. Mol. Ecol. Notes 2006, 6, 288–295. [Google Scholar] [CrossRef]
- Goudet, J. FSTAT (Version 1.2): A computer program to calculate F-statistics. J. Hered. 1995, 86, 485–486. [Google Scholar] [CrossRef]
- Piry, S.; Luikart, G.; Cornuet, J.M. BOTTLENECK: A computer program for detecting recent reductions in the effective population size using allele frequency data. J. Hered. 1999, 90, 502–503. [Google Scholar] [CrossRef]
- Sbordoni, V.; De Matthaeis, E.; Sbordoni, M.C.; La Rosa, G.; Mattoccia, M. Bottleneck effects and the depression of genetic variability in hatchery stocks of Penaeus japonicus (Crustacea, Decapoda). Aquaculture 1986, 57, 239–251. [Google Scholar] [CrossRef]
- Xie, L.; Chen, G.-L.; Ye, F.-L.; Li, Z.-M. Genetic Diversity of Four Selected Stocks of Litopenaeus vannamei as Revealed by SSR Marker. J. Guangdong Ocean Univ. 2009, 29, 5–9. [Google Scholar]
- Tang, F.; Wen, B.-N.; Liu, H. Microsatellite genetic diversity in different Litopenaeus vannamei breeding populations. J. South. Agric. 2021, 52, 1108–1115. [Google Scholar]
- Lima, A.P.S.; Silva, S.M.B.C.; Oliveira, K.K.C.; Maggioni, R.; Coimbra, M.R.M. Genetics of two marine shrimp hatcheries of the Pacific white shrimp Litopenaeus vannamei (Boone, 1931) in Pernambuco, Brazil. Ciência Rural 2010, 40, 295–301. [Google Scholar] [CrossRef]
- Zhang, K.; Wang, W.; Li, W.; Zhang, Q.; Kong, J. Analysis of genetic diversity and differentiation of seven stocks of Litopenaeus vannamei using microsatellite markers. J. Ocean Univ. China 2014, 13, 647–656. [Google Scholar] [CrossRef]
- Dixon, T.J.; Coman, G.J.; Arnold, S.J.; Sellars, M.J.; Lyons, R.E.; Dierens, L.; Preston, N.P.; Li, Y. Shifts in genetic diversity during domestication of Black Tiger shrimp, Penaeus monodon, monitored using two multiplexed microsatellite systems. Aquaculture 2008, 283, 1–6. [Google Scholar] [CrossRef]
- Dong, D.-J.; Dai, X.-L. SSR analysis on genetic diversity in different populations and generations of Macrobrachium rosenbergii. J. South. Agric. 2020, 51, 421–428. [Google Scholar]
- Valles-Jimenez, R.; Cruz, P.; Perez-Enriquez, R. Population genetic structure of Pacific white shrimp (Litopenaeus vannamei) from Mexico to Panama: Microsatellite DNA variation. Mar. Biotechnol. 2004, 6, 475–484. [Google Scholar] [CrossRef]
- Tong, X.; Gong, S.; Yu, D.; Du, B.; Huang, G.; Li, L.; Guo, Y.; Li, S. Variation of growth traits at different generations of Pacific white shrimp (Litopenaeus vannamei). South China Fish. Sci. 2007, 3, 30–33. [Google Scholar]
- Tong, X.; Gong, S.; Yu, D.; Huang, G.; Du, B.; Li, S. Genetic Diversity of Cultured Pacific white shrimp (Litopenaeus vannamei)Stocks of Different Generations in China. Oceanol. Limnol. Sin. 2009, 40, 215–220. [Google Scholar]
- Xu, L.; Li, Q.; Xu, C.; Yu, H.; Kong, L. Genetic diversity and effective population size in successive mass selected generations of black shell strain Pacific oyster (Crassostrea gigas) based on microsatellites and mtDNA data. Aquaculture 2019, 500, 338–346. [Google Scholar] [CrossRef]
- Kobayashi, T.; Kijima, A. Effects of Inbreeding Depression in Pacific Abalone Haliotis Discus Hannai. J. Shellfish Res. 2010, 3, 643–649. [Google Scholar] [CrossRef]
- Winans, G.A. Genetic variability in Chinook salmon stocks from the Columbia river basin. N. Am. J. Fish. Manag. 1989, 1, 47–52. [Google Scholar] [CrossRef]
- Eknath, A.E.; Doyle, R.W. Indirect Selection for Growth And Life-History Traits In Indian Carp Aquaculture. 1. Effects of Broodstock Management. Aquaculture 1985, 49, 73–84. [Google Scholar] [CrossRef]
- Mjolnerod, I.B.; Refseth, U.H.; Karlsen, E.; Balstad, T.; Jakobsen, K.S.; Hindar, K. Genetic differences between two wild and one farmed population of Atlantic salmon (Salmo salar) revealed by three classes of genetic markers. Hereditas 1997, 127, 239–248. [Google Scholar] [CrossRef]
- Carlsson, J.; Morrison, C.L.; Reece, K.S. Wild and aquaculture populations of the eastern oyster compared using microsatellites. J. Hered. 2006, 97, 595–598. [Google Scholar] [CrossRef] [PubMed]
- Yu, Z.; Guo, X. Genetic analysis of selected strains of eastern oyster (Crassostrea virginica Gmelin) using AFLP and microsatellite markers. Mar. Biotechnol. 2004, 6, 575–586. [Google Scholar] [CrossRef] [PubMed]
- Appleyard, S.A.; Ward, R.D. Genetic diversity and effective population size in mass selection lines of Pacific oyster (Crassostrea gigas). Aquaculture 2006, 254, 148–159. [Google Scholar] [CrossRef]
- An, H.S.; Lee, J.H.; Dong, C.M.; Noh, J.K.; Kim, H.C.; Park, C.J.; Park, K.D.; Min, B.H.; Park, J.W.; Myeong, J.I. New polymorphic microsatellite markers in Pacific abalone Haliotis discus hannai and their application to genetic characterization of wild and aquaculture populations. Genes Genom. 2010, 32, 413–418. [Google Scholar] [CrossRef]
- Evans, B.; Bartlett, J.; Sweijd, N.; Cook, P.; Elliott, N.G. Loss of genetic variation at microsatellite loci in hatchery produced abalone in Australia (Haliotis rubra) and South Africa (Haliotis midae). Aquaculture 2004, 233, 109–127. [Google Scholar] [CrossRef]
- Li, Q.; Park, C.; Endo, T.; Kijima, A. Loss of genetic variation at microsatellite loci in hatchery strains of the Pacific abalone (Haliotis discus hannai). Aquaculture 2004, 235, 207–222. [Google Scholar] [CrossRef]
- Wahlund, S. Zusammensetzung von Populationen and Korrelationserscheinungen von Standpunkt der Vererbungslehre aus betrachtet. Hereditas 1928, 11, 65–106. [Google Scholar] [CrossRef]
- Dharmarajan, G.; Beatty, W.S.; Rhodes, O.E. Heterozygote deficiencies caused by a Wahlund effect: Dispelling unfounded expectations. J. Wildl. Manag. 2013, 77, 226–234. [Google Scholar] [CrossRef]
- Li, G.; Hedgecock, D. Genetic heterogeneity, detected by PCR-SSCP, among samples of larval Pacific oysters (Crassostrea gigas) supports the hypothesis of large variance in reproductive success. Can. J. Fish. Aquat. Sci. 1998, 55, 1025–1033. [Google Scholar] [CrossRef]
- Liu, J.X.; Ely, B. Sibship reconstruction demonstrates the extremely low effective population size of striped bass Morone saxatilis in the Santee-Cooper system, South Carolina, USA. Mol. Ecol. 2009, 18, 4112–4120. [Google Scholar] [CrossRef] [PubMed]
- Evans, F.; Matson, S.; Brake, J.; Langdon, C. The effects of inbreeding on performance traits of adult Pacific oysters (Crassostrea gigas). Aquaculture 2004, 230, 89–98. [Google Scholar] [CrossRef]
- In, V.-V.; O’Connor, W.; Dove, M.; Knibb, W. Can genetic diversity be maintained across multiple mass selection lines of Sydney rock oyster, Saccostrea glomerata despite loss within each? Aquaculture 2016, 454, 210–216. [Google Scholar] [CrossRef]
- Knibb, W.; Whatmore, P.; Lamont, R.; Quinn, J.; Powell, D.; Elizur, A.; Anderson, T.; Remilton, C.; Nguyen, N.H. Can genetic diversity be maintained in long term mass selected populations without pedigree information?—A case study using banana shrimp Fenneropenaeus merguiensis. Aquaculture 2014, 428–429, 71–78. [Google Scholar] [CrossRef]
- Lu, X.; Wang, H.; Li, Y.; Liu, B. The impact of selection on population genetic structure in the clam Meretrix petechialis revealed by microsatellite markers. Genetica 2016, 144, 1–8. [Google Scholar] [CrossRef]
- Lu, X.; Wang, H.; Liu, B.; Xiang, J. Three EST-SSR markers associated with QTL for the growth of the clam Meretrix meretrix revealed by selective genotyping. Mar. Biotechnol. 2013, 15, 16–25. [Google Scholar] [CrossRef]


| Locus | Forward Primer Fluorescent Label | Primer Sequence (5′→3′) | Ta/°C | Expected Size (bp) | GenBank Accession No. |
|---|---|---|---|---|---|
| TUMXLv10.200 | FAM | F:GCAACAGACATAATGTAGGC R:AATGCTCGTGCCCTCATC | 54 | 105 | AF359958 |
| TUMXLv7.97 | HEX | F:TGTCGTTAGTGCAGCTCATTC R:GGGGAGGAATAAGAGGAAAGG | 52 | 176 | AF360057 |
| TUMXLv7.74 | ROX | F:CCTGCGCAATACTGGATATG R:CGAGGTGTAGTTGTGCTTTGG | 54 | 214 | AF360056 |
| TUMXLv10.207 | FAM | F:GATCACTAGCCATATTTCATCC R:ATCGCATAATGAGCAAACTGG | 56 | 97 | AF359963 |
| Pvan1815 | HEX | F:GATCATTCGCCCCTCTTTTT R:ATCTACGGTTCGAGAGCAGA | 56 | 126–141 | AY062925 |
| TUMXLv7.121 | ROX | F:GGCACACTGTTTAGTCCTCG R:CGAACAGAATGGCAGAGGAG | 56 | 242 | AF360043 |
| TUMXLv10.311 | FAM | F:CATCCACTTCTTCTCGTACCATC R:TCTCCATCCAGGTTCTGGG | 58 | 105 | AF359988 |
| TUMXLv10.312 | HEX | F:ATACGAAACACCCCATCCC R:GTGGTCTTACCTCGTGGCTC | 58 | 179 | AF359989 |
| TUMXLv10.284 | ROX | F:TCTTTAAAGGTCAGGTAAAGG R:CGGCCAGACTCCACAACTAC | 58 | 205 | AF359983 |
| TUMXLv10.291 | FAM | F:CCCTCAAACAGTCGCAGTG R:GTTGGGTGAGTCTTTAGGCG | 58 | 140 | AF359983 |
| TUMXLv10.255 | HEX | F:CTAAATAAATCACGGGTTGGG R:CCTTCTGGTTTACTGTTGAGGC | 58 | 213 | AF359977 |
| TUMXLv10.364 | ROX | F:TGAAAGCATTCTGGTAAGGC R:GAATAAAACAAGGGGTGAGGG | 58 | 299 | AF360000 |
| Strain | Locus | N | Na | Ne | Ho | He | Fis | PIC |
|---|---|---|---|---|---|---|---|---|
| 20160505 | TUMXLv10.207 | 32 | 3 | 1.408 | 0.281 | 0.294 | 0.029 | 0.256 |
| Pvan1815 | 32 | 10 | 4.154 | 0.656 | 0.771 | 0.136 | 0.725 | |
| TUMXLv7.121 | 32 | 5 | 2.441 | 0.594 | 0.600 | −0.006 | 0.548 | |
| TUMXLv10.312 | 32 | 4 | 2.926 | 0.656 | 0.669 | 0.003 | 0.600 | |
| TUMXLv10.284 | 32 | 5 | 2.723 | 0.500 | 0.643 | 0.210 | 0.581 | |
| TUMXLv10.291 | 32 | 1 | 1.000 | 0.000 | 0.000 | N/A | N/A | |
| TUMXLv10.255 | 32 | 2 | 1.992 | 0.938 | 0.506 | −0.882 | 0.374 | |
| TUMXLv10.364 | 32 | 3 | 1.547 | 0.188 | 0.359 | 0.470 | 0.309 | |
| TUMXLv10.200 | 32 | 5 | 1.865 | 0.594 | 0.471 | −0.280 | 0.423 | |
| TUMXLv7.97 | 32 | 2 | 1.853 | 0.344 | 0.468 | 0.253 | 0.354 | |
| TUMXLv7.74 | 32 | 2 | 1.438 | 0.313 | 0.310 | −0.026 | 0.258 | |
| Mean | 32.000 | 3.818 | 2.123 | 0.460 | 0.463 | −0.009 | 0.443 | |
| 20170505 | TUMXLv10.207 | 32 | 2 | 1.753 | 0.313 | 0.437 | 0.273 | 0.338 |
| Pvan1815 | 32 | 8 | 4.501 | 0.656 | 0.790 | 0.156 | 0.745 | |
| TUMXLv7.121 | 32 | 5 | 2.656 | 0.563 | 0.633 | 0.098 | 0.584 | |
| TUMXLv10.312 | 31 | 4 | 3.654 | 0.806 | 0.738 | −0.110 | 0.676 | |
| TUMXLv10.284 | 31 | 4 | 2.619 | 0.645 | 0.628 | −0.044 | 0.566 | |
| TUMXLv10.291 | 32 | 1 | 1.000 | 0.000 | 0.000 | N/A | N/A | |
| TUMXLv10.255 | 32 | 2 | 2.000 | 1.000 | 0.508 | −1.000 | 0.375 | |
| TUMXLv10.364 | 32 | 3 | 1.979 | 0.344 | 0.502 | 0.305 | 0.444 | |
| TUMXLv10.200 | 32 | 4 | 1.870 | 0.594 | 0.473 | −0.276 | 0.425 | |
| TUMXLv7.97 | 32 | 3 | 2.169 | 0.344 | 0.548 | 0.362 | 0.447 | |
| TUMXLv7.74 | 32 | 2 | 1.600 | 0.250 | 0.381 | 0.333 | 0.305 | |
| Mean | 31.818 | 3.455 | 2.346 | 0.501 | 0.513 | 0.010 | 0.490 | |
| 20180505 | TUMXLv10.207 | 32 | 4 | 2.538 | 0.469 | 0.616 | 0.226 | 0.547 |
| Pvan1815 | 32 | 7 | 3.568 | 0.625 | 0.731 | 0.132 | 0.686 | |
| TUMXLv7.121 | 32 | 4 | 3.442 | 0.625 | 0.721 | 0.119 | 0.659 | |
| TUMXLv10.312 | 32 | 4 | 3.537 | 0.750 | 0.729 | −0.046 | 0.666 | |
| TUMXLv10.284 | 32 | 4 | 2.335 | 0.563 | 0.581 | 0.016 | 0.516 | |
| TUMXLv10.291 | 32 | 5 | 1.380 | 0.094 | 0.280 | 0.660 | 0.259 | |
| TUMXLv10.255 | 32 | 5 | 2.183 | 0.938 | 0.551 | −0.730 | 0.441 | |
| TUMXLv10.364 | 32 | 2 | 1.438 | 0.375 | 0.310 | −0.231 | 0.258 | |
| TUMXLv10.200 | 32 | 3 | 1.331 | 0.281 | 0.252 | −0.132 | 0.230 | |
| TUMXLv7.97 | 32 | 3 | 1.743 | 0.469 | 0.433 | −0.100 | 0.348 | |
| TUMXLv7.74 | 32 | 2 | 1.398 | 0.281 | 0.289 | 0.012 | 0.244 | |
| Mean | 32.000 | 3.909 | 2.263 | 0.497 | 0.499 | −0.007 | 0.441 | |
| 20190505 | TUMXLv10.207 | 32 | 3 | 1.809 | 0.500 | 0.454 | −0.118 | 0.371 |
| Pvan1815 | 32 | 8 | 4.223 | 0.313 | 0.775 | 0.591 | 0.736 | |
| TUMXLv7.121 | 32 | 3 | 1.208 | 0.125 | 0.175 | 0.275 | 0.162 | |
| TUMXLv10.312 | 32 | 4 | 3.396 | 0.656 | 0.717 | 0.070 | 0.651 | |
| TUMXLv10.284 | 32 | 6 | 2.994 | 0.938 | 0.677 | −0.408 | 0.617 | |
| TUMXLv10.291 | 32 | 4 | 1.136 | 0.063 | 0.122 | 0.478 | 0.118 | |
| TUMXLv10.255 | 32 | 3 | 2.071 | 0.781 | 0.525 | −0.511 | 0.434 | |
| TUMXLv10.364 | 32 | 1 | 1.000 | 0.000 | 0.000 | N/A | N/A | |
| TUMXLv10.200 | 32 | 4 | 1.581 | 0.438 | 0.374 | −0.190 | 0.341 | |
| TUMXLv7.97 | 32 | 5 | 2.622 | 0.594 | 0.628 | 0.040 | 0.586 | |
| TUMXLv7.74 | 32 | 2 | 1.983 | 0.594 | 0.503 | −0.198 | 0.373 | |
| Mean | 32.000 | 3.909 | 2.184 | 0.455 | 0.450 | 0.003 | 0.439 | |
| 20180808 | TUMXLv10.207 | 32 | 5 | 2.698 | 0.469 | 0.639 | 0.255 | 0.560 |
| Pvan1815 | 32 | 7 | 4.491 | 0.594 | 0.790 | 0.236 | 0.746 | |
| TUMXLv7.121 | 32 | 3 | 1.629 | 0.406 | 0.392 | −0.052 | 0.353 | |
| TUMXLv10.312 | 32 | 3 | 2.848 | 0.813 | 0.659 | −0.252 | 0.574 | |
| TUMXLv10.284 | 32 | 6 | 4.452 | 0.781 | 0.788 | −0.008 | 0.740 | |
| TUMXLv10.291 | 32 | 2 | 1.032 | 0.031 | 0.031 | −0.016 | 0.031 | |
| TUMXLv10.255 | 32 | 3 | 2.186 | 0.906 | 0.551 | −0.671 | 0.438 | |
| TUMXLv10.364 | 32 | 3 | 1.627 | 0.219 | 0.391 | 0.432 | 0.352 | |
| TUMXLv10.200 | 32 | 3 | 1.135 | 0.125 | 0.121 | −0.053 | 0.115 | |
| TUMXLv7.97 | 32 | 6 | 1.853 | 0.313 | 0.468 | 0.321 | 0.436 | |
| TUMXLv7.74 | 32 | 2 | 1.932 | 0.500 | 0.490 | −0.036 | 0.366 | |
| Mean | 32.000 | 3.909 | 2.353 | 0.469 | 0.484 | 0.014 | 0.428 | |
| 20190808 | TUMXLv10.207 | 32 | 6 | 2.424 | 0.406 | 0.597 | 0.308 | 0.556 |
| Pvan1815 | 32 | 14 | 7.557 | 0.469 | 0.881 | 0.460 | 0.856 | |
| TUMXLv7.121 | 32 | 8 | 2.525 | 0.563 | 0.614 | 0.069 | 0.572 | |
| TUMXLv10.312 | 32 | 4 | 2.786 | 0.719 | 0.651 | −0.121 | 0.572 | |
| TUMXLv10.284 | 32 | 7 | 3.690 | 0.813 | 0.741 | −0.115 | 0.685 | |
| TUMXLv10.291 | 32 | 1 | 1.000 | 0.000 | 0.000 | N/A | N/A | |
| TUMXLv10.255 | 32 | 4 | 2.395 | 0.906 | 0.592 | −0.556 | 0.495 | |
| TUMXLv10.364 | 32 | 3 | 1.415 | 0.281 | 0.298 | 0.042 | 0.265 | |
| TUMXLv10.200 | 32 | 3 | 1.099 | 0.094 | 0.092 | −0.038 | 0.088 | |
| TUMXLv7.97 | 32 | 6 | 2.498 | 0.438 | 0.609 | 0.270 | 0.554 | |
| TUMXLv7.74 | 32 | 2 | 1.822 | 0.563 | 0.458 | −0.247 | 0.349 | |
| Mean | 32.000 | 5.273 | 2.656 | 0.477 | 0.503 | 0.007 | 0.499 | |
| 20180909 | TUMXLv10.207 | 32.000 | 4.000 | 2.727 | 0.406 | 0.643 | 0.359 | 0.561 |
| Pvan1815 | 32 | 7 | 4.719 | 0.563 | 0.801 | 0.286 | 0.758 | |
| TUMXLv7.121 | 32 | 4 | 1.801 | 0.406 | 0.452 | 0.087 | 0.404 | |
| TUMXLv10.312 | 32 | 3 | 2.817 | 0.625 | 0.655 | 0.031 | 0.570 | |
| TUMXLv10.284 | 32 | 6 | 4.911 | 0.625 | 0.809 | 0.215 | 0.765 | |
| TUMXLv10.291 | 32 | 2 | 1.064 | 0.000 | 0.062 | 1.000 | 0.058 | |
| TUMXLv10.255 | 32 | 3 | 2.176 | 0.875 | 0.549 | −0.619 | 0.437 | |
| TUMXLv10.364 | 32 | 3 | 1.331 | 0.094 | 0.252 | 0.623 | 0.230 | |
| TUMXLv10.200 | 32 | 4 | 1.595 | 0.438 | 0.379 | −0.173 | 0.353 | |
| TUMXLv7.97 | 32 | 6 | 1.858 | 0.406 | 0.469 | 0.121 | 0.439 | |
| TUMXLv7.74 | 32 | 2 | 1.853 | 0.469 | 0.468 | −0.018 | 0.354 | |
| Mean | 32.000 | 4.000 | 2.441 | 0.446 | 0.504 | 0.174 | 0.448 | |
| 20190909 | TUMXLv10.207 | 32 | 4 | 2.407 | 0.594 | 0.594 | −0.016 | 0.519 |
| Pvan1815 | 32 | 11 | 6.380 | 0.344 | 0.857 | 0.592 | 0.825 | |
| TUMXLv7.121 | 32 | 6 | 2.158 | 0.469 | 0.545 | 0.126 | 0.508 | |
| TUMXLv10.312 | 32 | 5 | 3.098 | 0.656 | 0.688 | 0.031 | 0.618 | |
| TUMXLv10.284 | 32 | 6 | 3.969 | 0.844 | 0.760 | −0.128 | 0.706 | |
| TUMXLv10.291 | 32 | 2 | 1.032 | 0.031 | 0.031 | −0.016 | 0.031 | |
| TUMXLv10.255 | 32 | 4 | 2.844 | 0.906 | 0.659 | −0.398 | 0.581 | |
| TUMXLv10.364 | 32 | 2 | 1.205 | 0.188 | 0.173 | −0.103 | 0.156 | |
| TUMXLv10.200 | 32 | 4 | 1.339 | 0.281 | 0.257 | −0.110 | 0.242 | |
| TUMXLv7.97 | 32 | 6 | 2.876 | 0.375 | 0.663 | 0.425 | 0.601 | |
| TUMXLv7.74 | 32 | 3 | 2.050 | 0.500 | 0.520 | 0.024 | 0.397 | |
| Mean | 32.000 | 4.818 | 2.669 | 0.472 | 0.522 | 0.039 | 0.471 | |
| 20171010 | TUMXLv10.207 | 32 | 4 | 1.830 | 0.313 | 0.461 | 0.311 | 0.422 |
| Pvan1815 | 32 | 12 | 7.447 | 0.563 | 0.879 | 0.350 | 0.851 | |
| TUMXLv7.121 | 32 | 6 | 2.606 | 0.594 | 0.626 | 0.036 | 0.563 | |
| TUMXLv10.312 | 32 | 5 | 3.215 | 0.750 | 0.700 | −0.089 | 0.633 | |
| TUMXLv10.284 | 32 | 6 | 4.008 | 0.719 | 0.762 | 0.042 | 0.710 | |
| TUMXLv10.291 | 32 | 3 | 1.919 | 0.188 | 0.487 | 0.609 | 0.401 | |
| TUMXLv10.255 | 32 | 3 | 2.817 | 0.719 | 0.655 | −0.114 | 0.570 | |
| TUMXLv10.364 | 32 | 3 | 1.210 | 0.188 | 0.177 | −0.079 | 0.166 | |
| TUMXLv10.200 | 31 | 5 | 1.453 | 0.290 | 0.317 | 0.068 | 0.295 | |
| TUMXLv7.97 | 32 | 8 | 2.619 | 0.406 | 0.628 | 0.343 | 0.597 | |
| TUMXLv7.74 | 32 | 3 | 2.022 | 0.344 | 0.513 | 0.320 | 0.393 | |
| Mean | 31.909 | 5.273 | 2.831 | 0.461 | 0.564 | 0.163 | 0.509 | |
| 20181010 | TUMXLv10.207 | 32 | 3 | 2.293 | 0.438 | 0.573 | 0.224 | 0.485 |
| Pvan1815 | 32 | 10 | 4.655 | 0.531 | 0.798 | 0.323 | 0.756 | |
| TUMXLv7.121 | 32 | 9 | 1.960 | 0.531 | 0.498 | −0.085 | 0.474 | |
| TUMXLv10.312 | 32 | 4 | 2.738 | 0.750 | 0.645 | −0.182 | 0.571 | |
| TUMXLv10.284 | 32 | 7 | 4.267 | 0.813 | 0.778 | −0.061 | 0.728 | |
| TUMXLv10.291 | 32 | 2 | 1.280 | 0.000 | 0.222 | 1.000 | 0.195 | |
| TUMXLv10.255 | 32 | 2 | 1.998 | 0.969 | 0.507 | −0.939 | 0.375 | |
| TUMXLv10.364 | 32 | 3 | 1.697 | 0.156 | 0.417 | 0.620 | 0.357 | |
| TUMXLv10.200 | 32 | 4 | 1.339 | 0.219 | 0.257 | 0.135 | 0.241 | |
| TUMXLv7.97 | 32 | 7 | 1.845 | 0.344 | 0.465 | 0.249 | 0.431 | |
| TUMXLv7.74 | 32 | 3 | 2.163 | 0.563 | 0.546 | −0.046 | 0.435 | |
| Mean | 32.000 | 4.909 | 2.385 | 0.483 | 0.519 | 0.113 | 0.459 | |
| 20191010 | TUMXLv10.207 | 32 | 3 | 2.107 | 0.313 | 0.534 | 0.405 | 0.416 |
| Pvan1815 | 32 | 8 | 2.926 | 0.375 | 0.669 | 0.430 | 0.616 | |
| TUMXLv7.121 | 32 | 4 | 1.958 | 0.656 | 0.497 | −0.341 | 0.435 | |
| TUMXLv10.312 | 32 | 4 | 3.465 | 0.906 | 0.723 | −0.274 | 0.660 | |
| TUMXLv10.284 | 32 | 5 | 3.543 | 0.875 | 0.729 | −0.219 | 0.668 | |
| TUMXLv10.291 | 32 | 2 | 1.438 | 0.000 | 0.310 | 1.000 | 0.258 | |
| TUMXLv10.255 | 32 | 2 | 1.969 | 0.875 | 0.500 | −0.778 | 0.371 | |
| TUMXLv10.364 | 32 | 3 | 2.169 | 0.500 | 0.548 | 0.072 | 0.446 | |
| TUMXLv10.200 | 32 | 4 | 1.514 | 0.406 | 0.345 | −0.197 | 0.307 | |
| TUMXLv7.97 | 32 | 4 | 2.258 | 0.781 | 0.566 | −0.402 | 0.470 | |
| TUMXLv7.74 | 32 | 3 | 1.820 | 0.625 | 0.458 | −0.387 | 0.363 | |
| Mean | 32.000 | 3.818 | 2.288 | 0.574 | 0.534 | −0.063 | 0.455 |
Disclaimer/Publisher’s Note: The statements, opinions and data contained in all publications are solely those of the individual author(s) and contributor(s) and not of MDPI and/or the editor(s). MDPI and/or the editor(s) disclaim responsibility for any injury to people or property resulting from any ideas, methods, instructions or products referred to in the content. |
© 2023 by the authors. Licensee MDPI, Basel, Switzerland. This article is an open access article distributed under the terms and conditions of the Creative Commons Attribution (CC BY) license (https://creativecommons.org/licenses/by/4.0/).
Share and Cite
Zhang, Z.; Lu, C.; Lin, K.; You, W.; Yang, Z. Genetic Diversity and Genetic Structure among Four Selected Strains of Whiteleg Shrimp (Litopenaeus vannamei) Using SSR Markers. Fishes 2023, 8, 544. https://doi.org/10.3390/fishes8110544
Zhang Z, Lu C, Lin K, You W, Yang Z. Genetic Diversity and Genetic Structure among Four Selected Strains of Whiteleg Shrimp (Litopenaeus vannamei) Using SSR Markers. Fishes. 2023; 8(11):544. https://doi.org/10.3390/fishes8110544
Chicago/Turabian StyleZhang, Zhe, Chengkuan Lu, Kebing Lin, Weiwei You, and Zhangwu Yang. 2023. "Genetic Diversity and Genetic Structure among Four Selected Strains of Whiteleg Shrimp (Litopenaeus vannamei) Using SSR Markers" Fishes 8, no. 11: 544. https://doi.org/10.3390/fishes8110544
APA StyleZhang, Z., Lu, C., Lin, K., You, W., & Yang, Z. (2023). Genetic Diversity and Genetic Structure among Four Selected Strains of Whiteleg Shrimp (Litopenaeus vannamei) Using SSR Markers. Fishes, 8(11), 544. https://doi.org/10.3390/fishes8110544