
Phenethylamine Is a Potential Density Stress Pheromone in Turbot (Scophthalmus maximus)

 ,
,
Abstract
:
1. Introduction
2. Materials and Methods
2.1. Experimental System and Experimental Design
2.2. Sample Preparation
2.3. Determination of Biochemical Parameters
2.4. RNA Extraction and qPCR
2.5. Metabolite Extraction and UHPLC-MS/MS Analysis
2.6. Data Processing and Metabolite Identification
2.7. Statistical Analysis and Pathway Analysis
3. Result
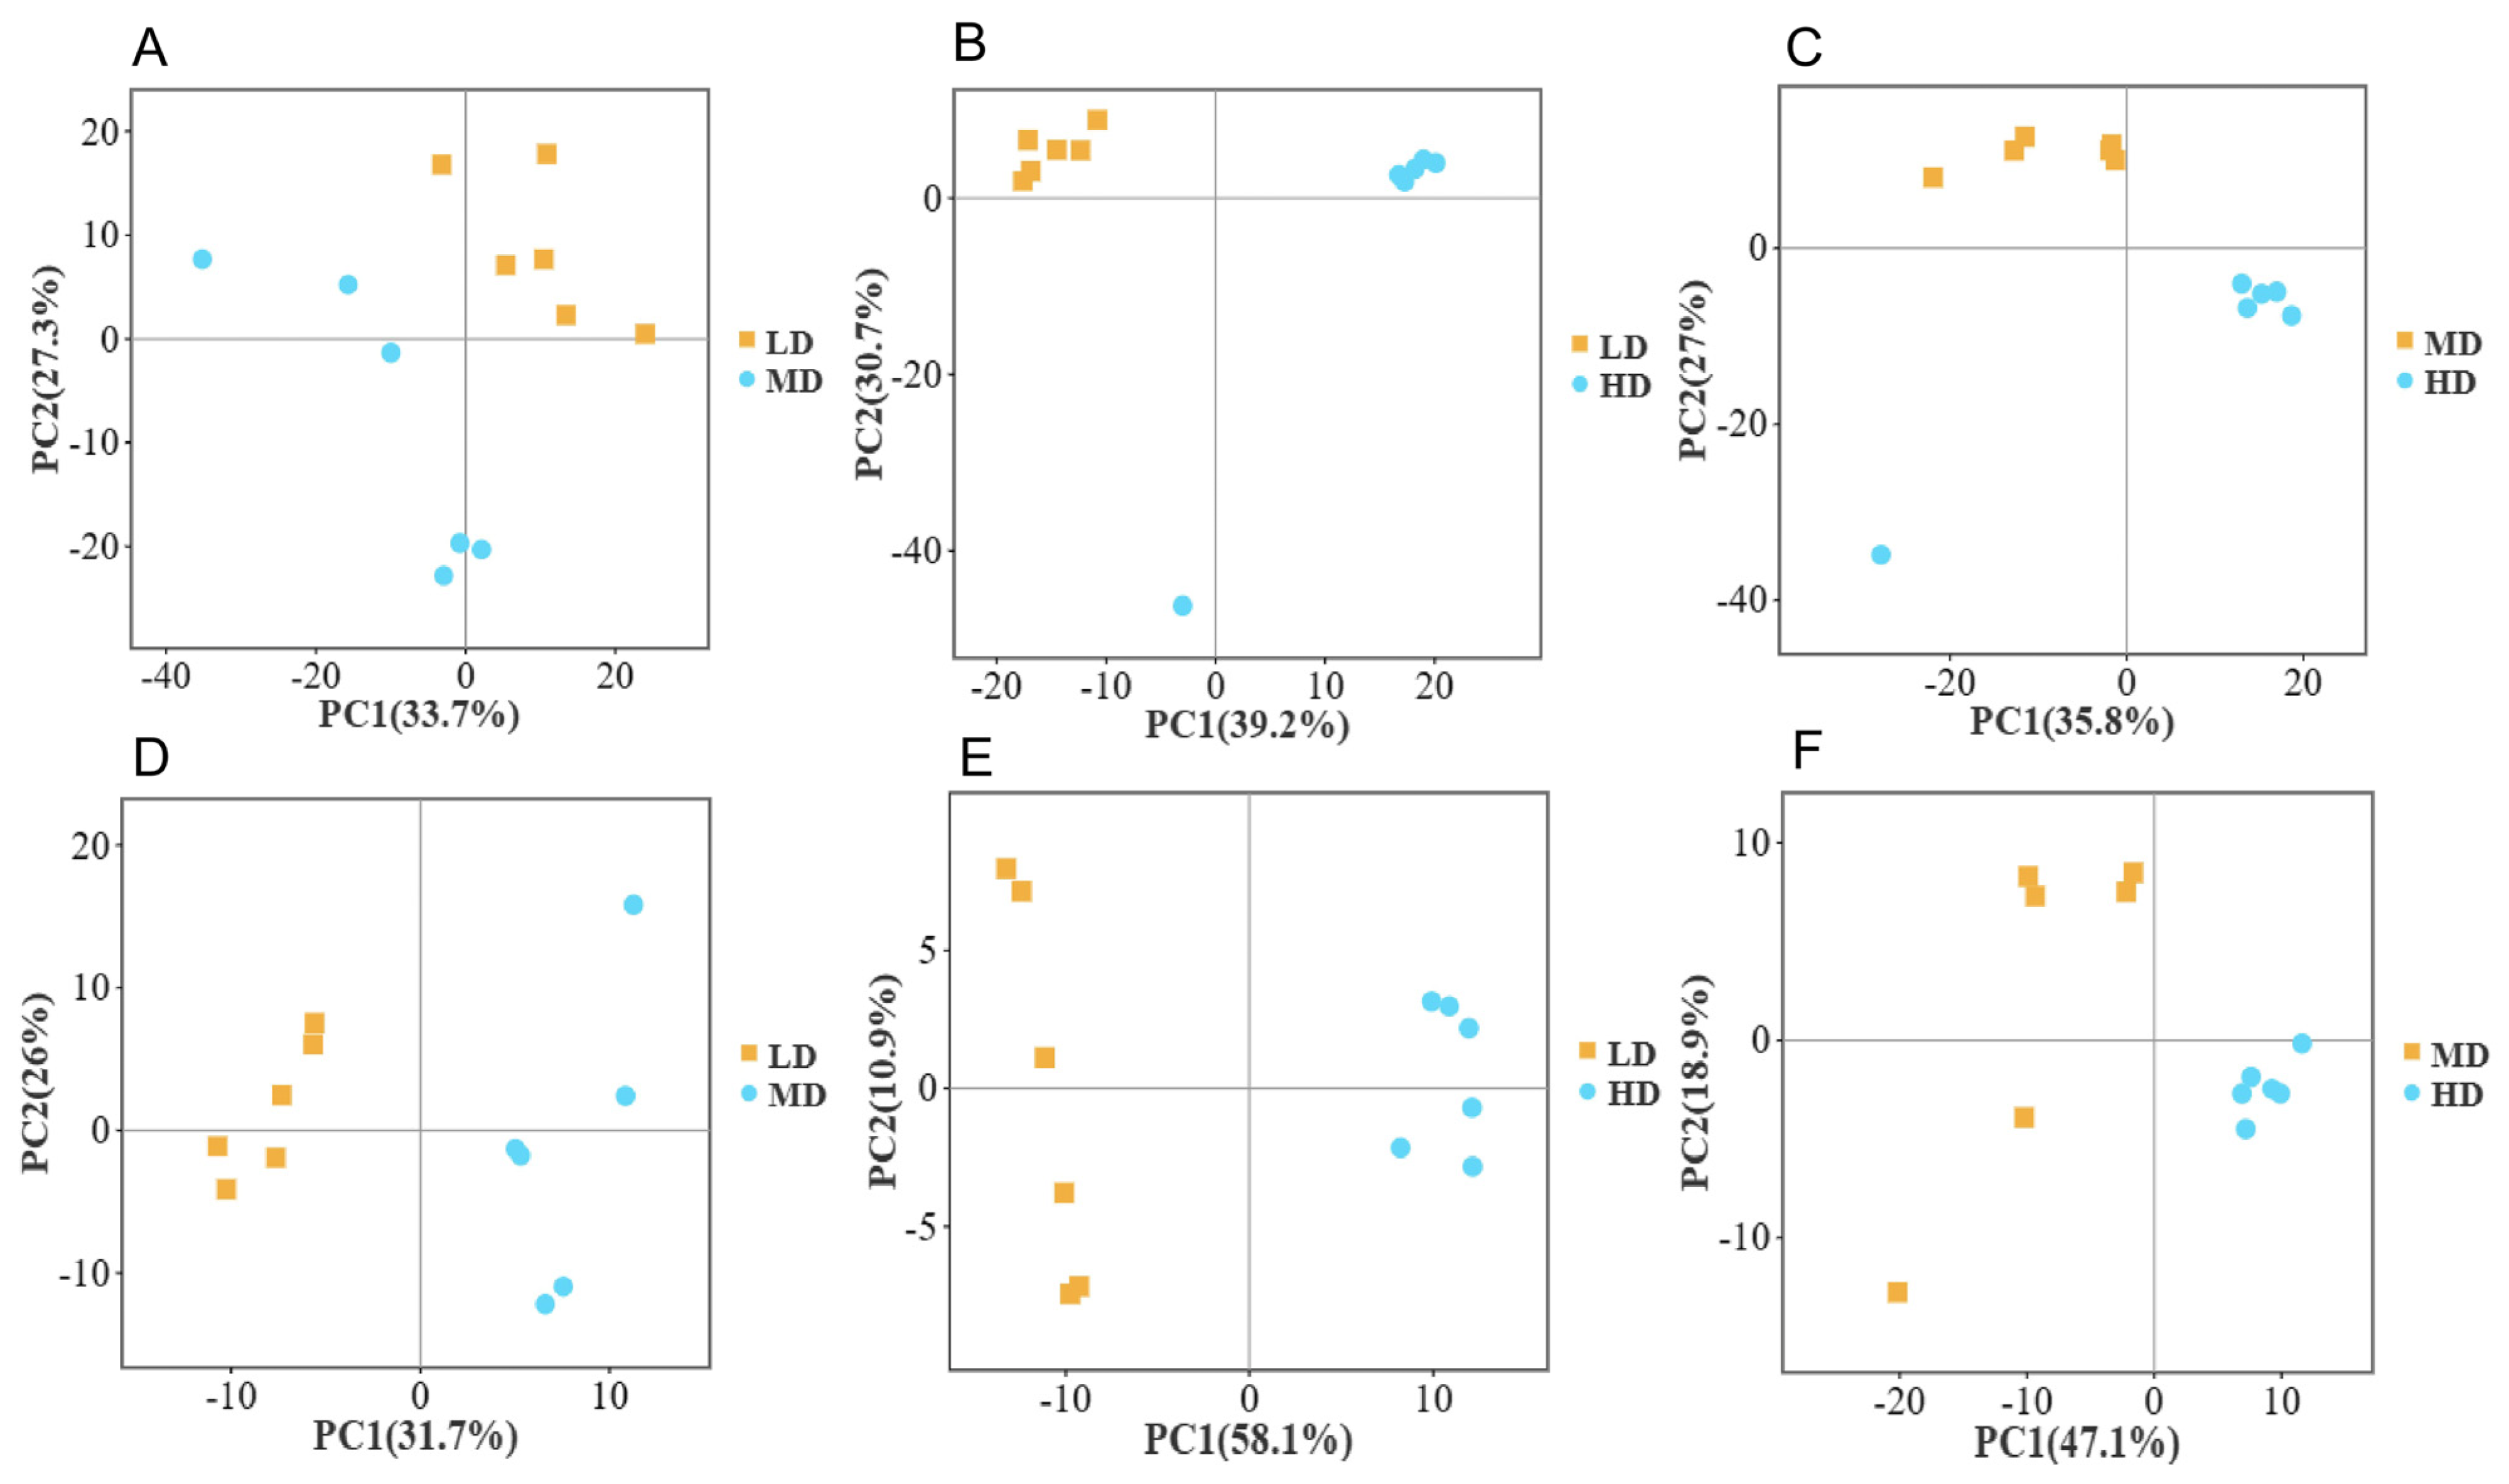
3.1. Metabolomics Principal Component Analysis (PCA) at Different Densities
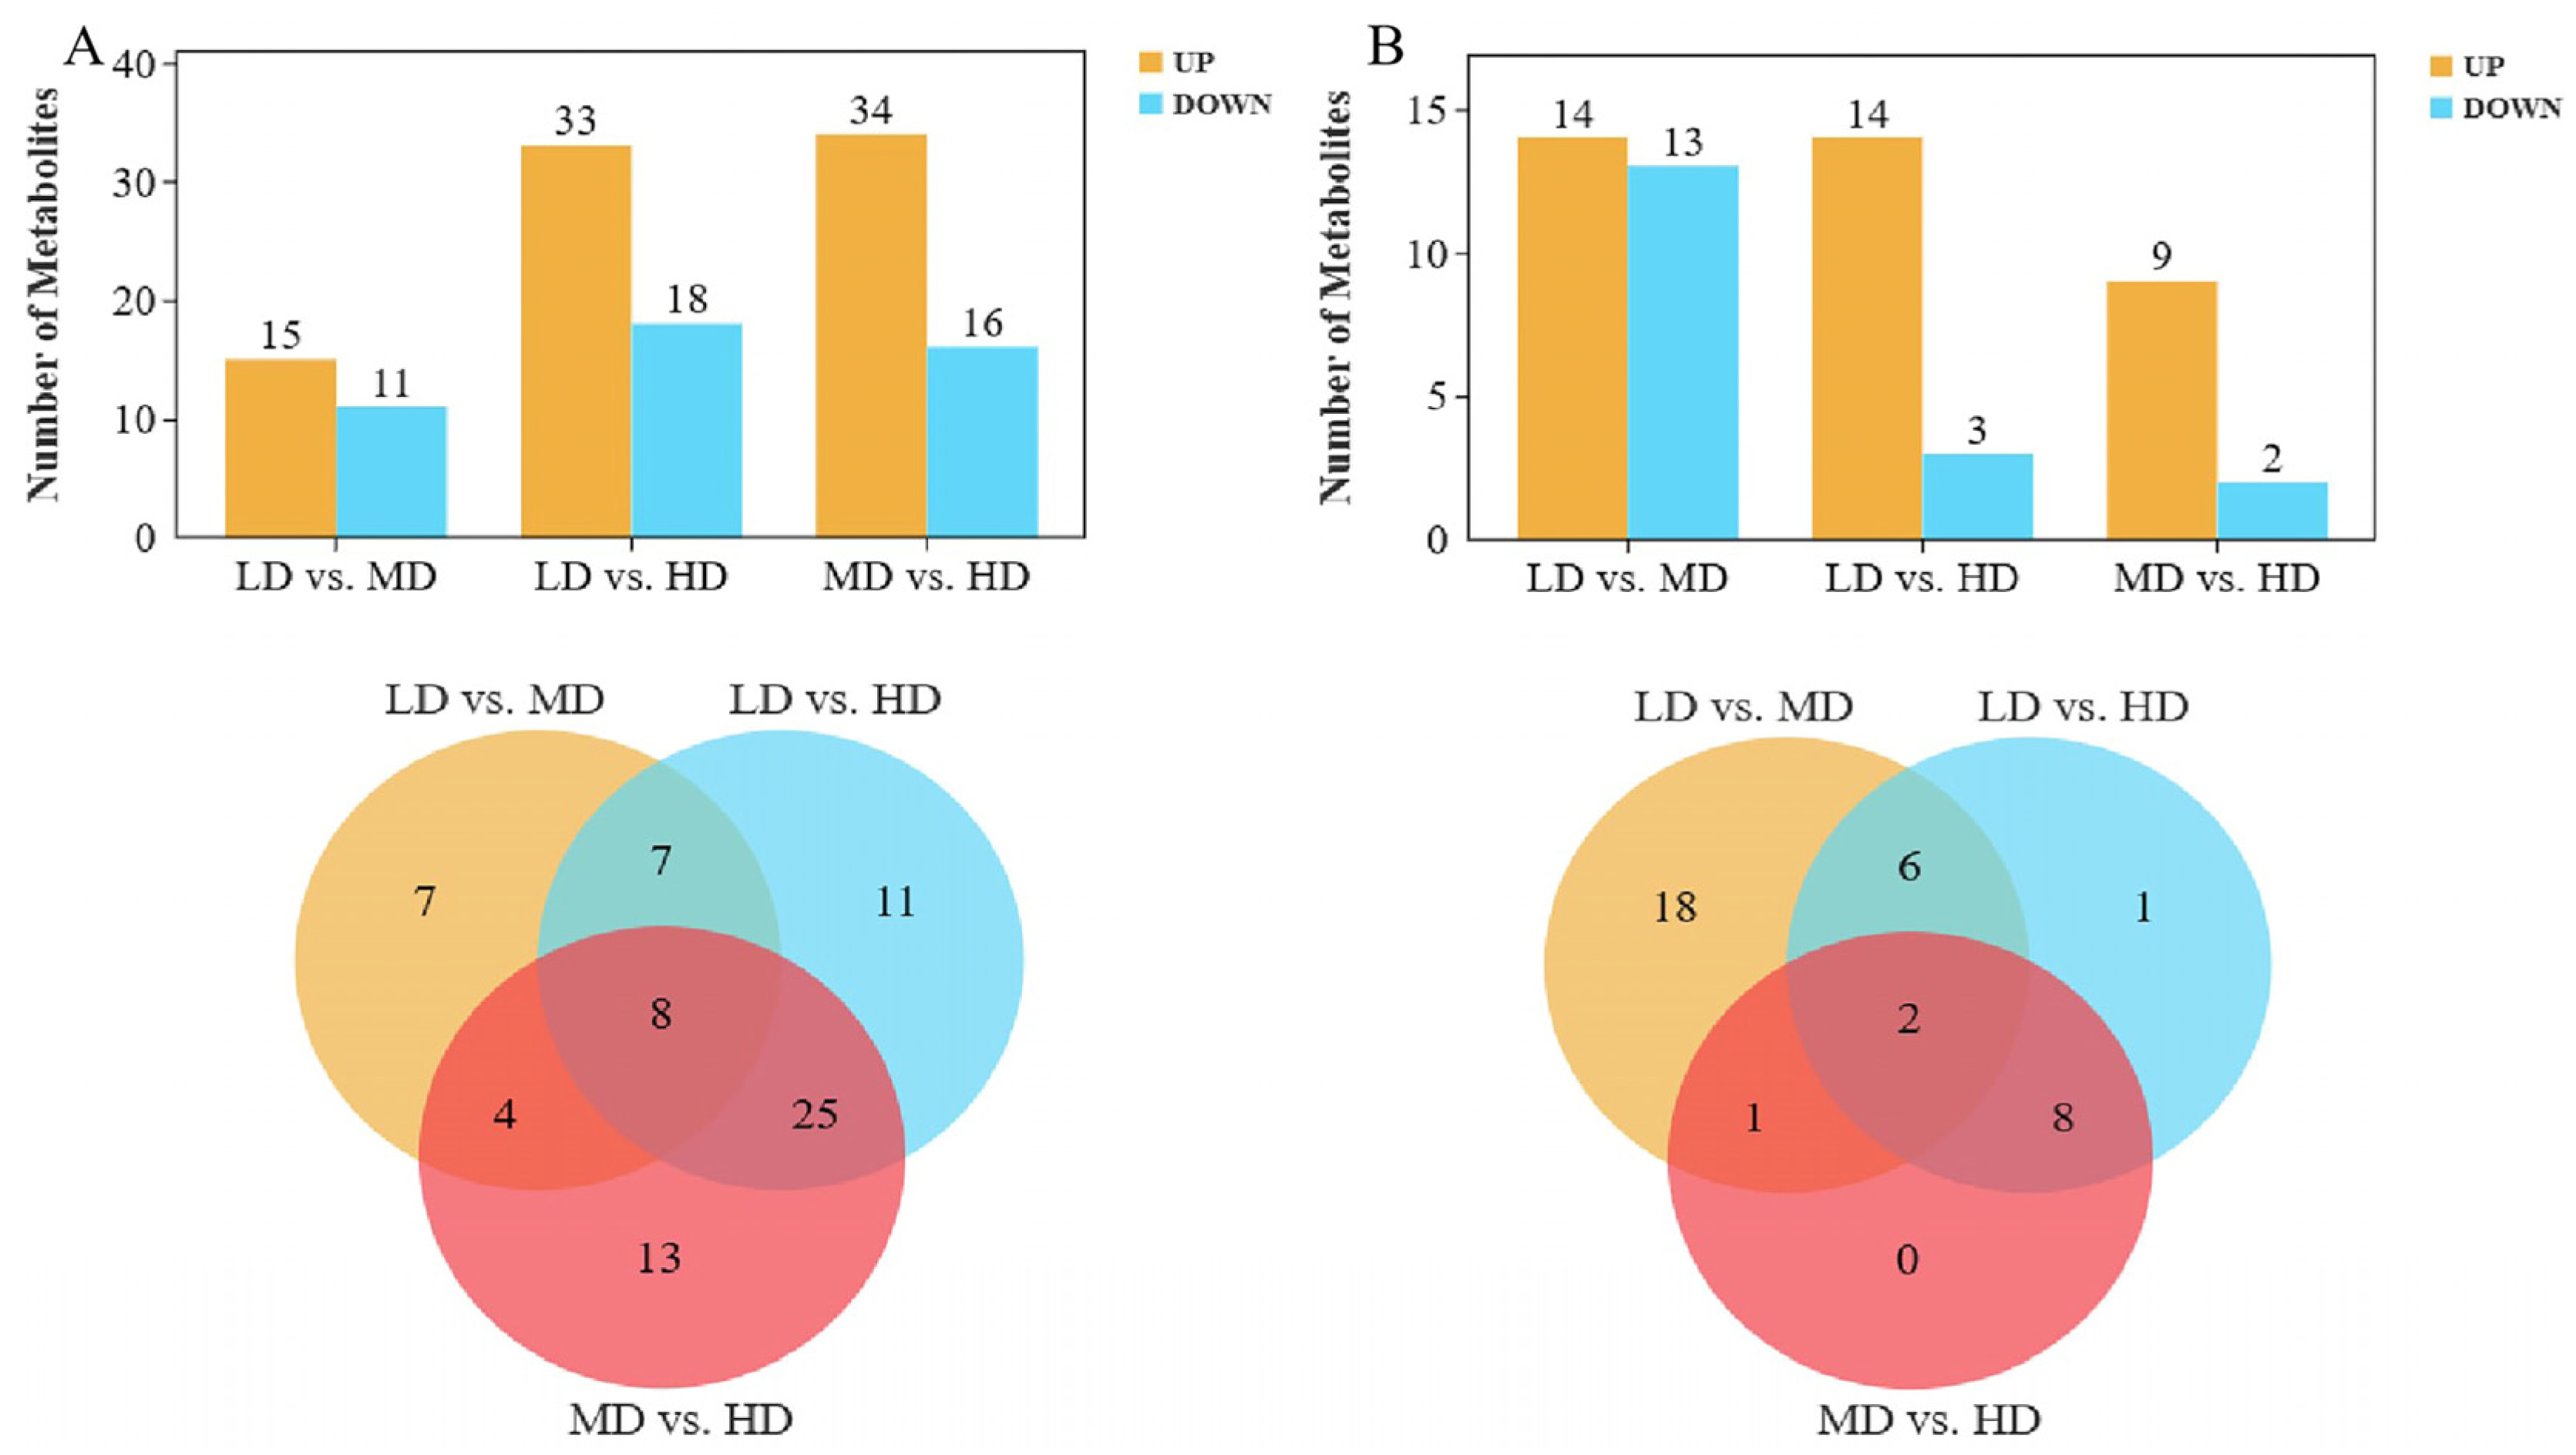
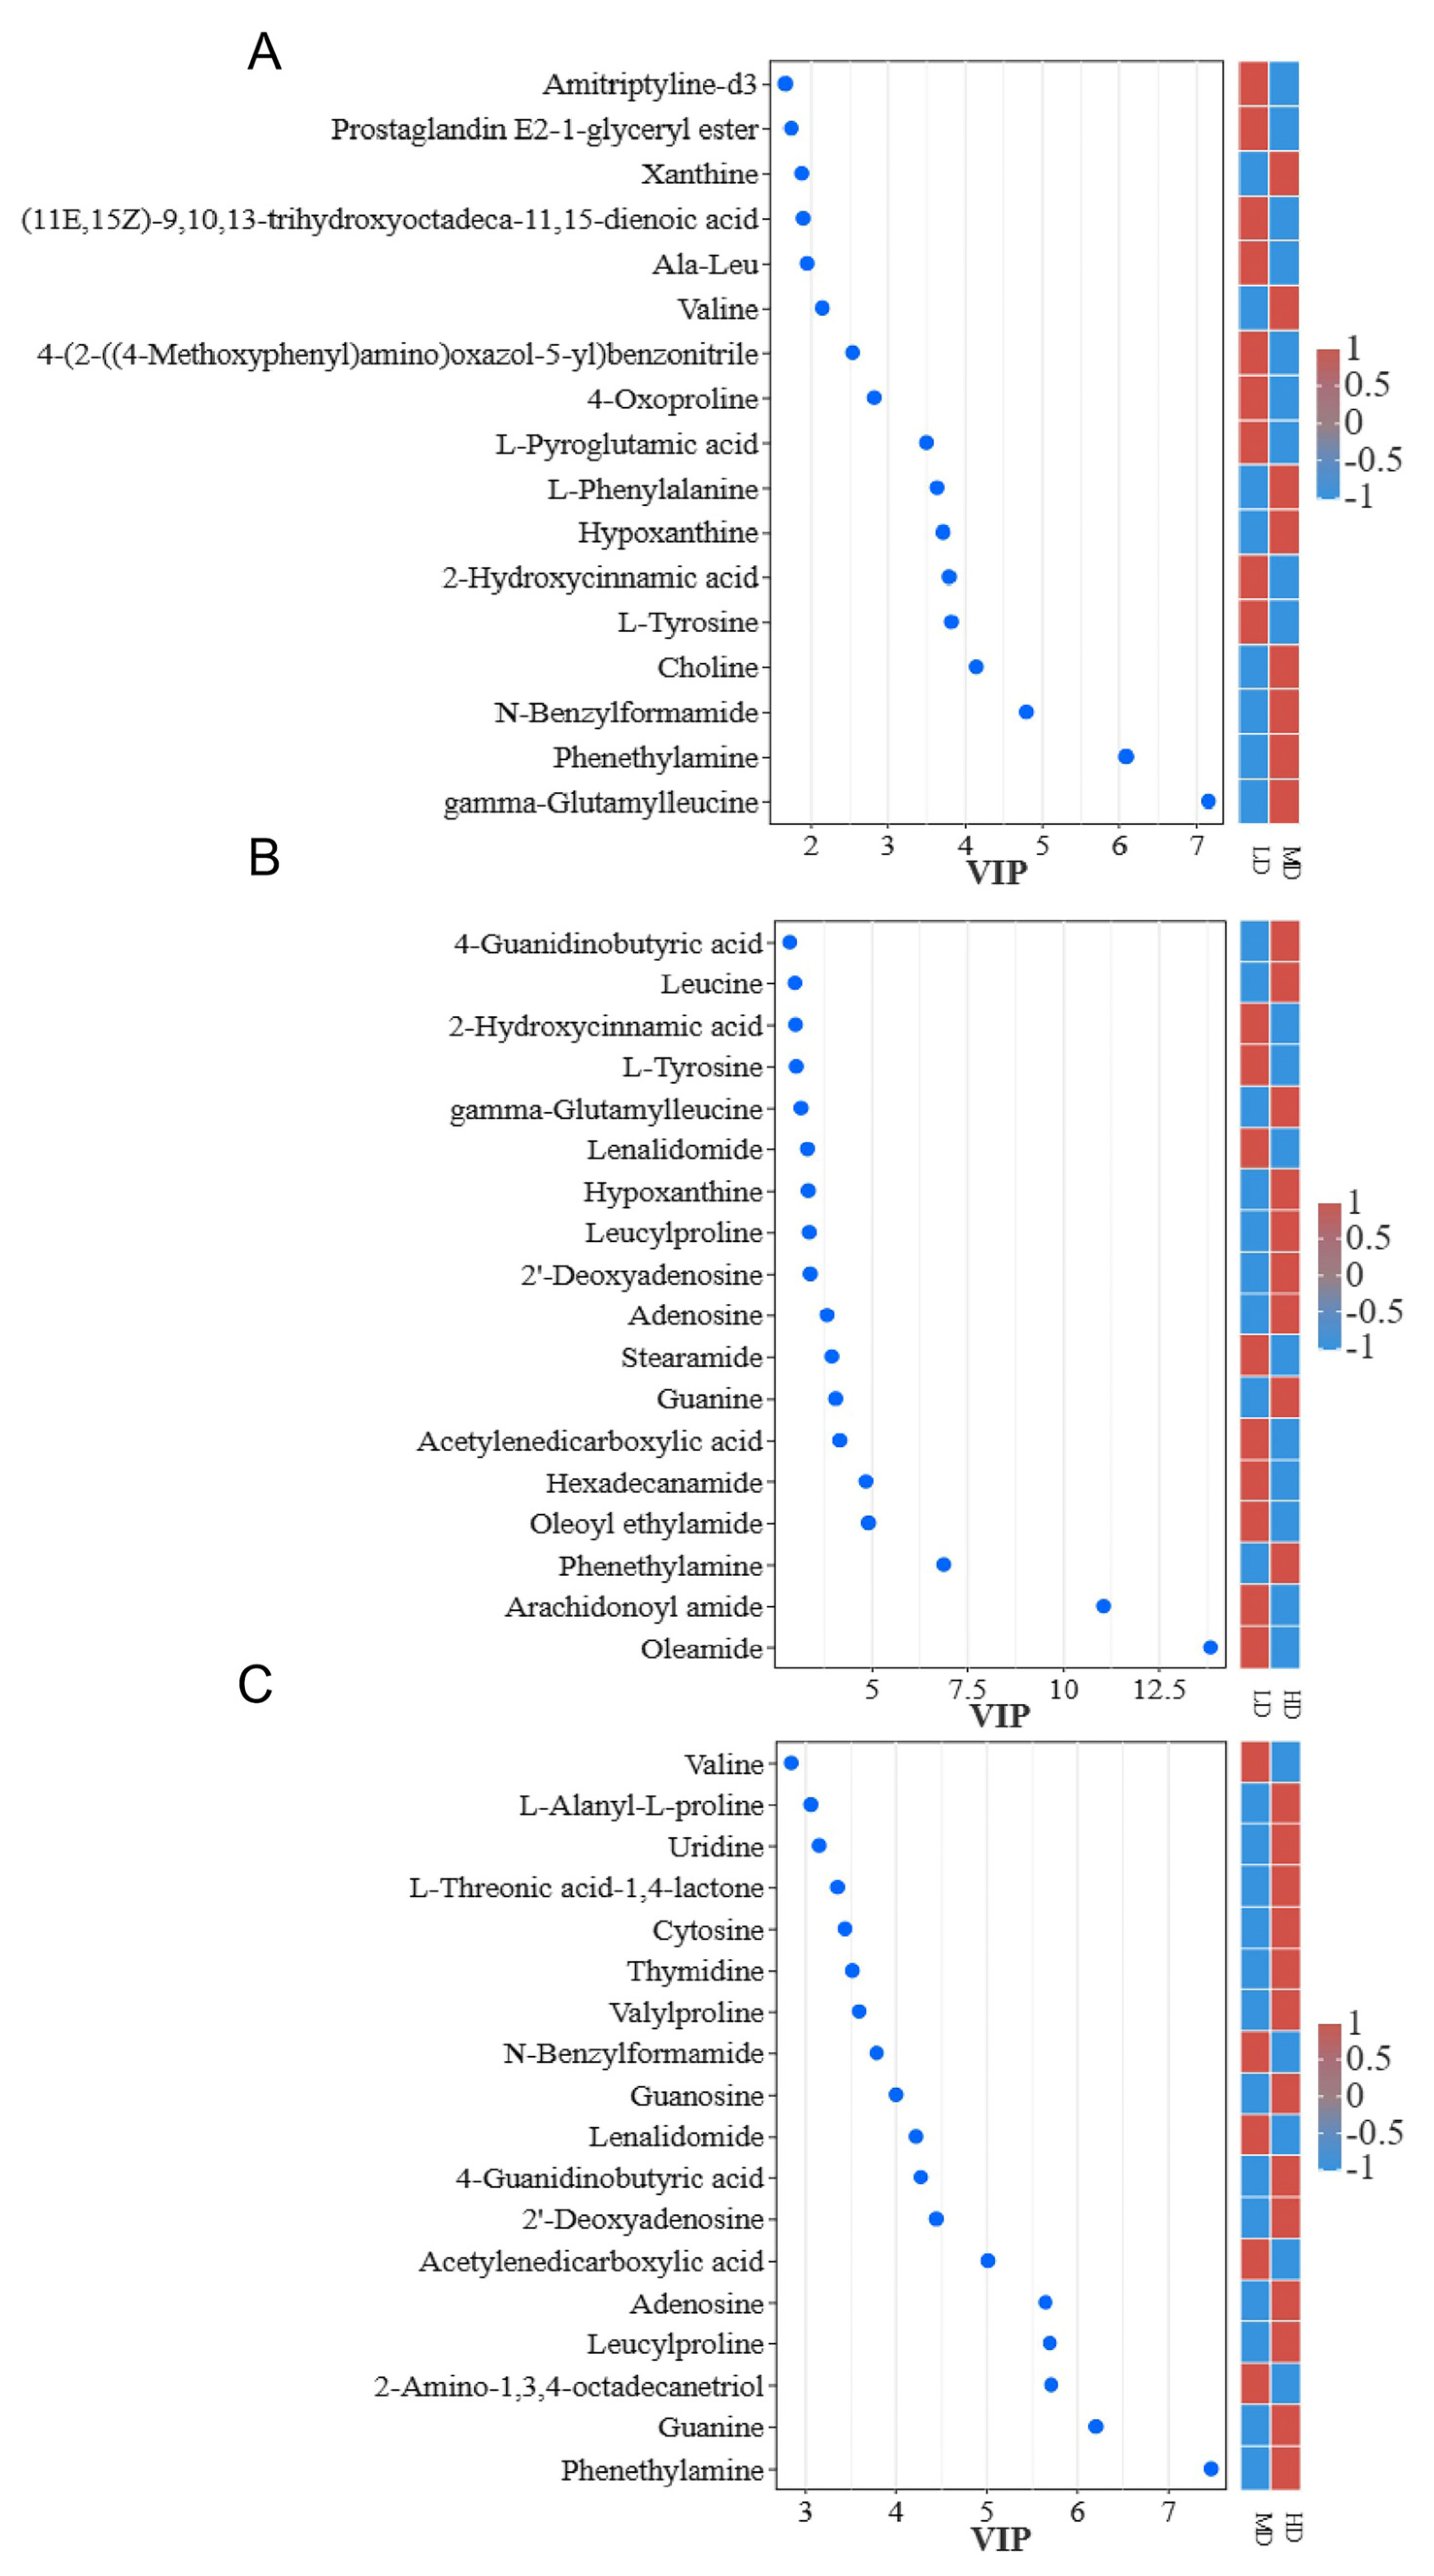
3.2. Differential Metabolites at Different Densities
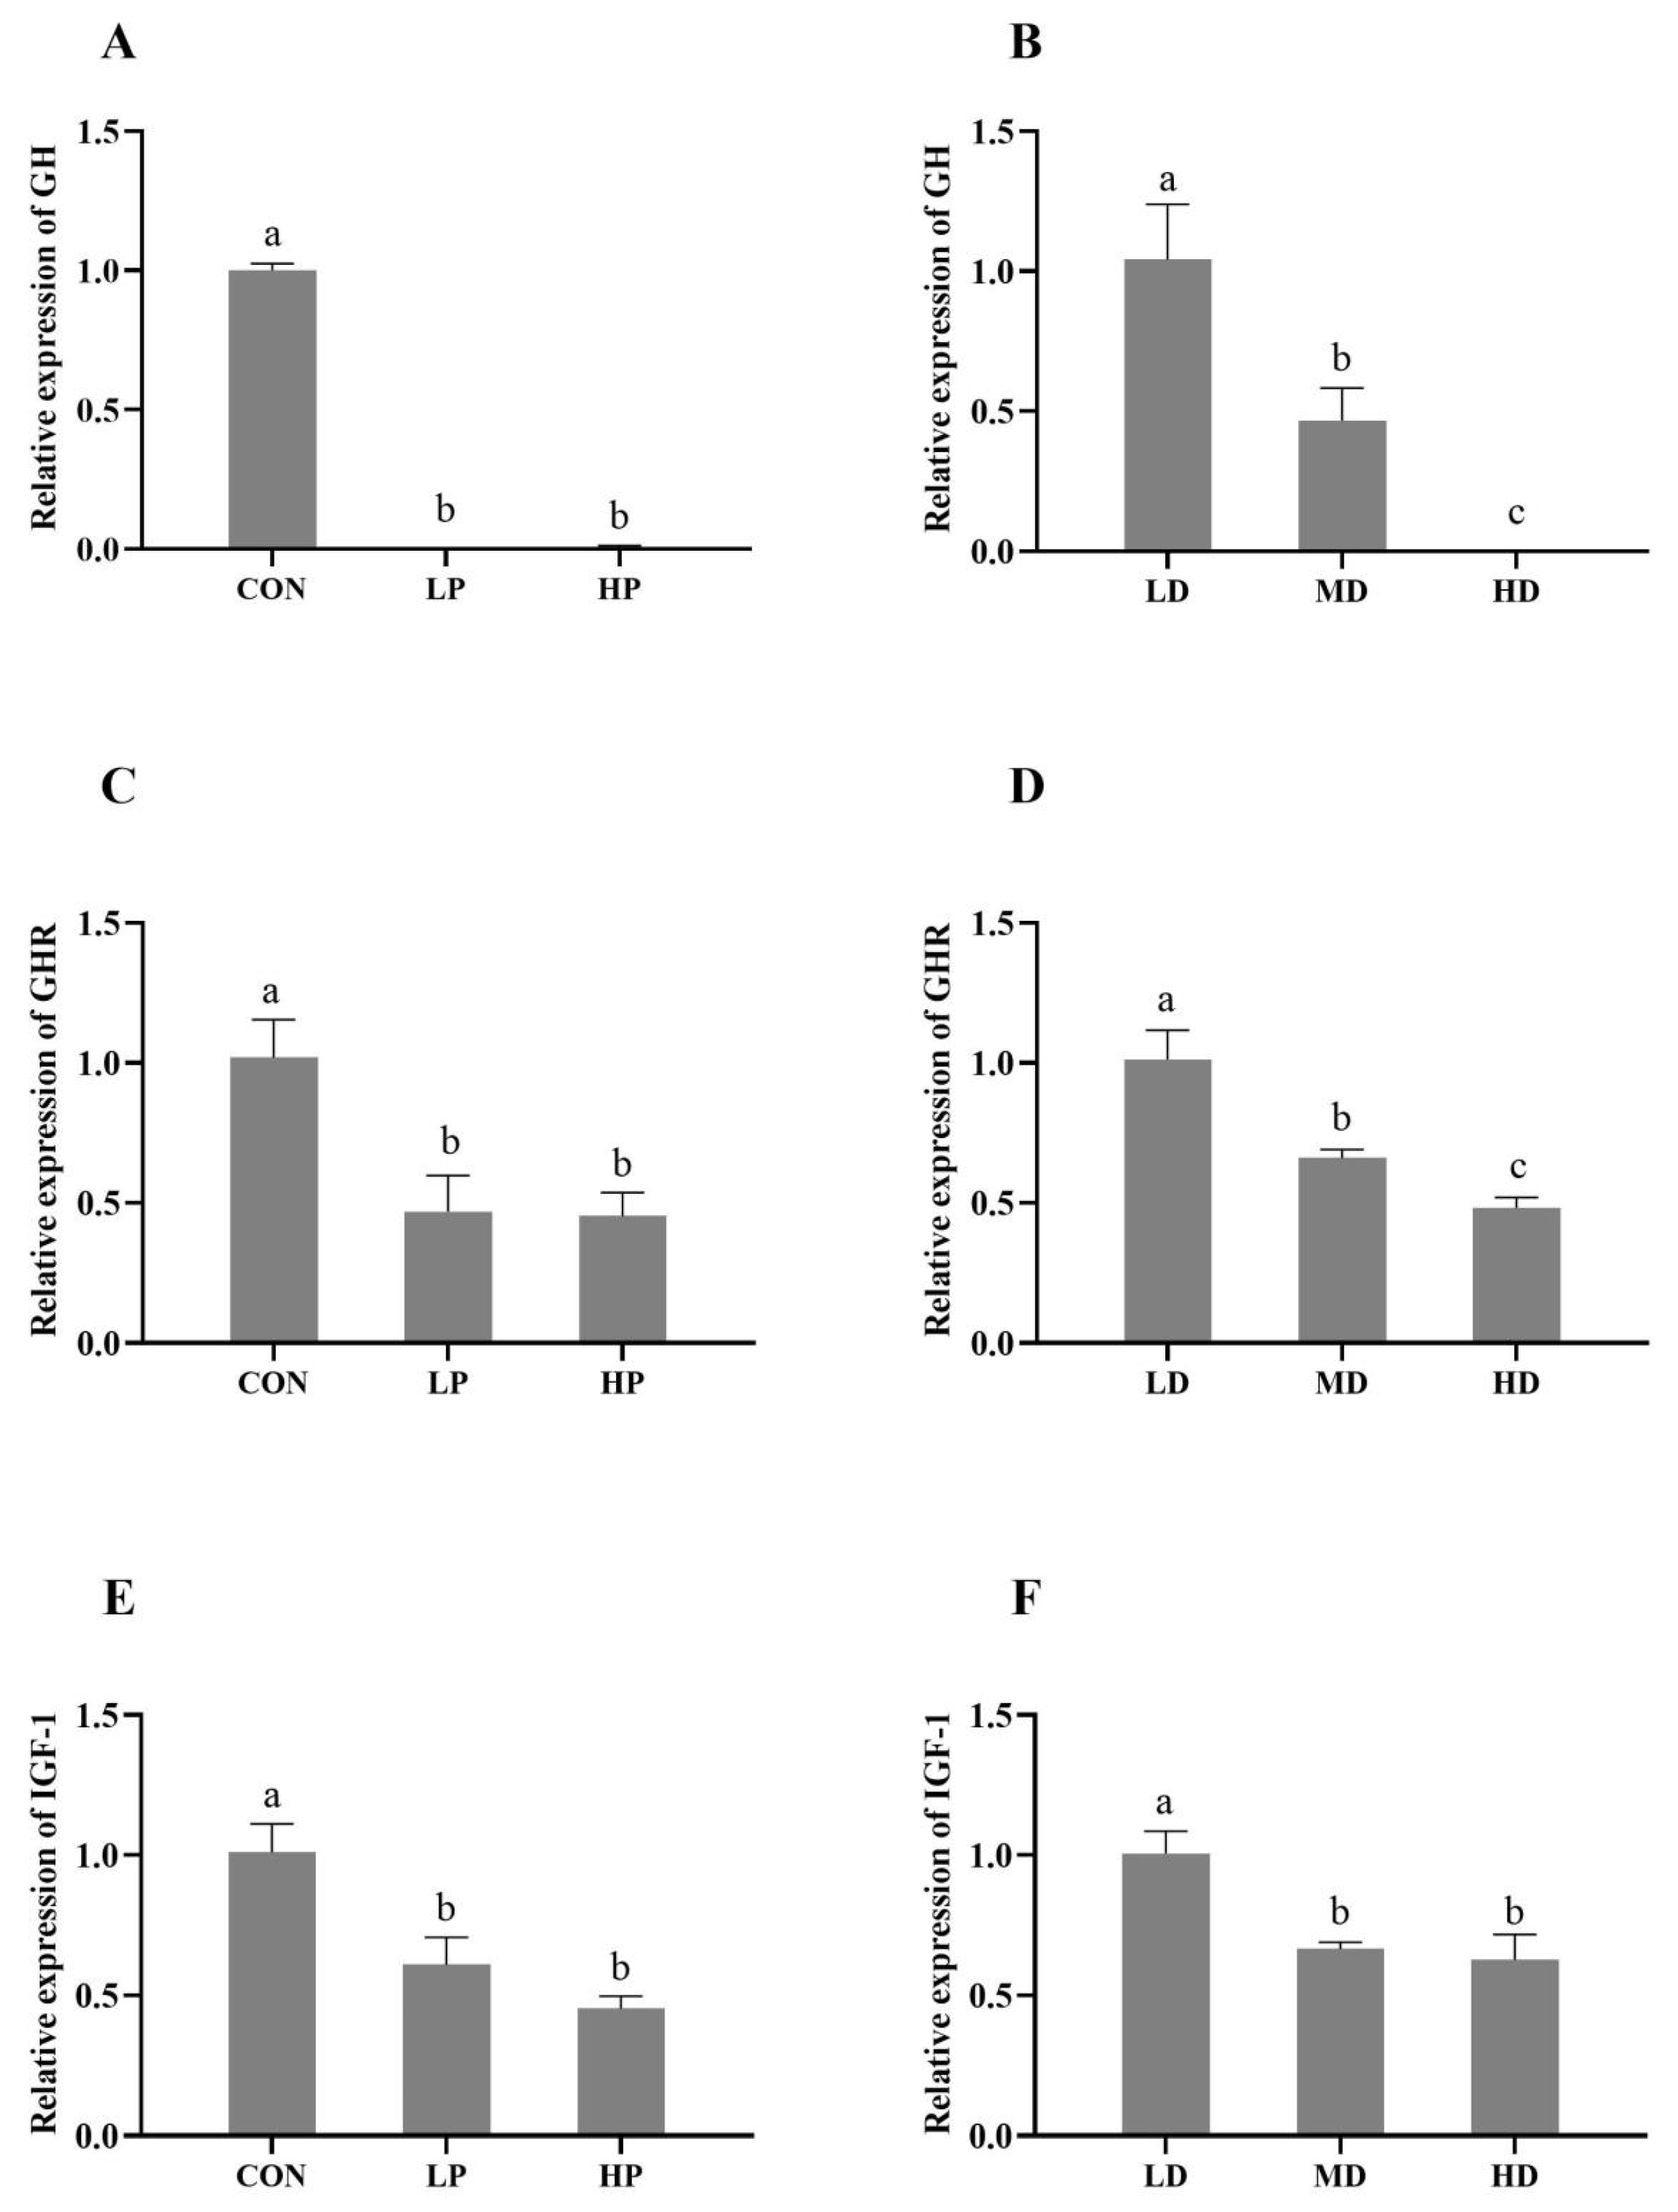
3.3. GH/IGF-1 Signaling Pathway
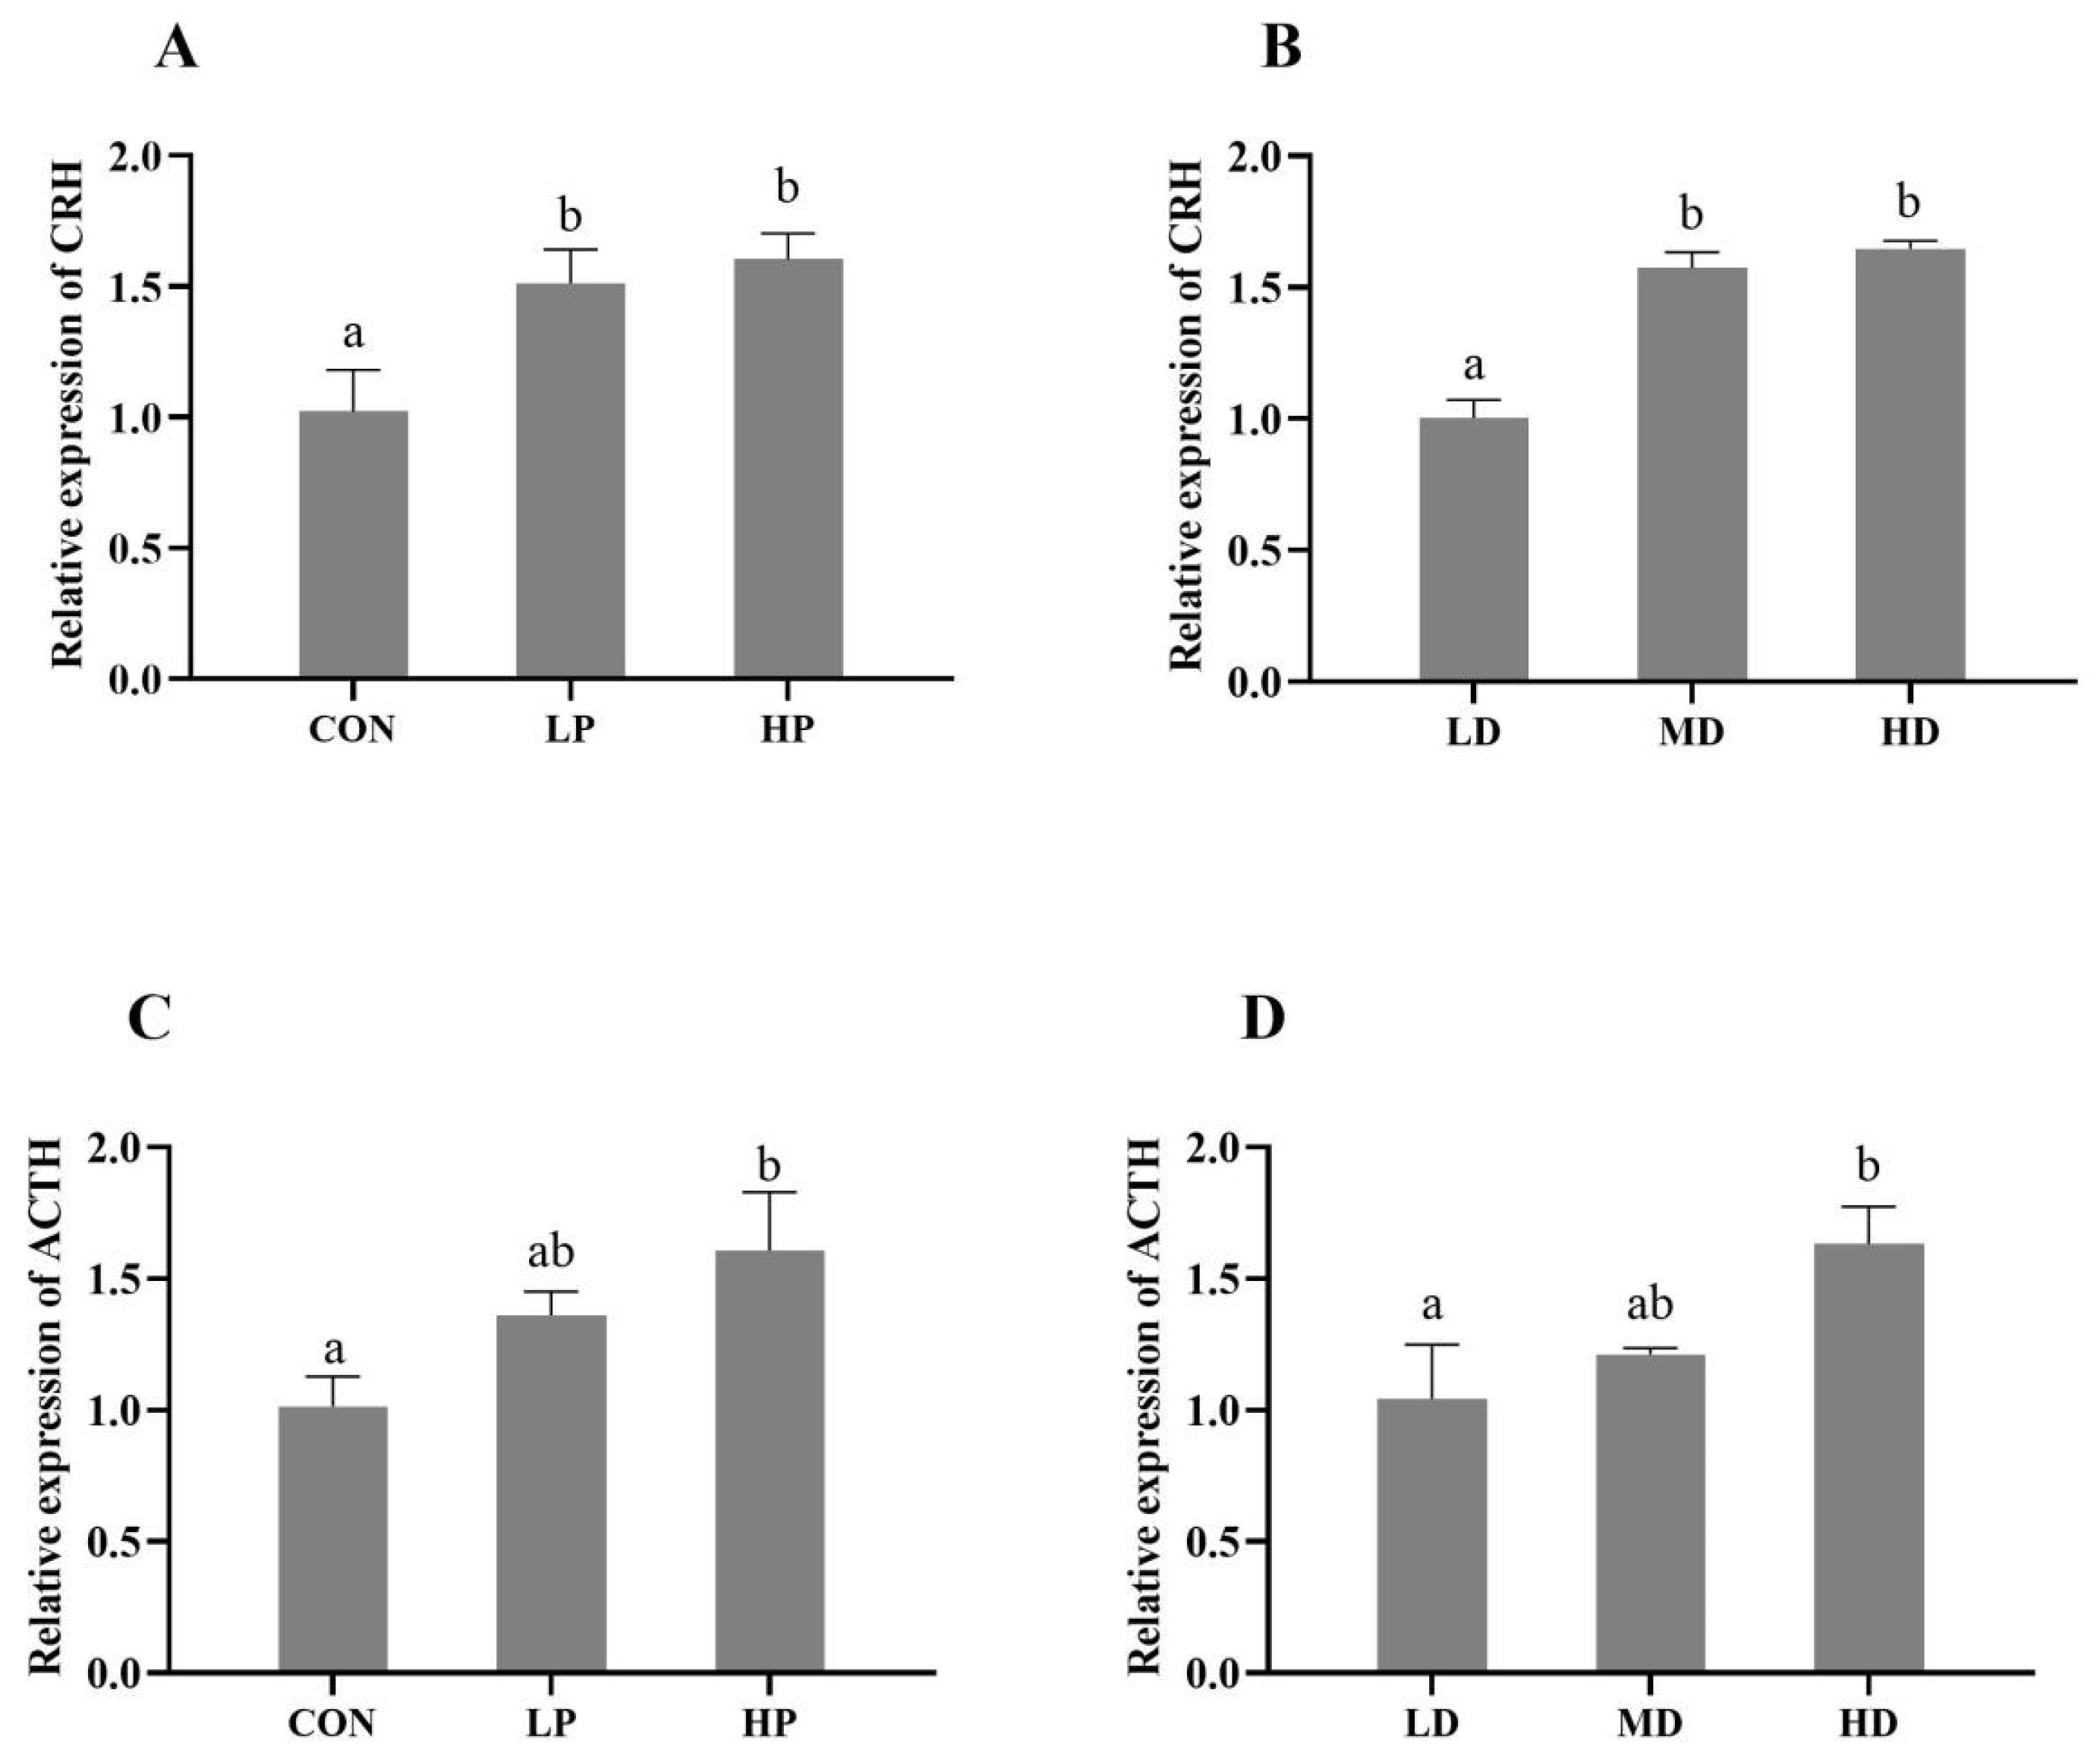
3.4. HPI Axis
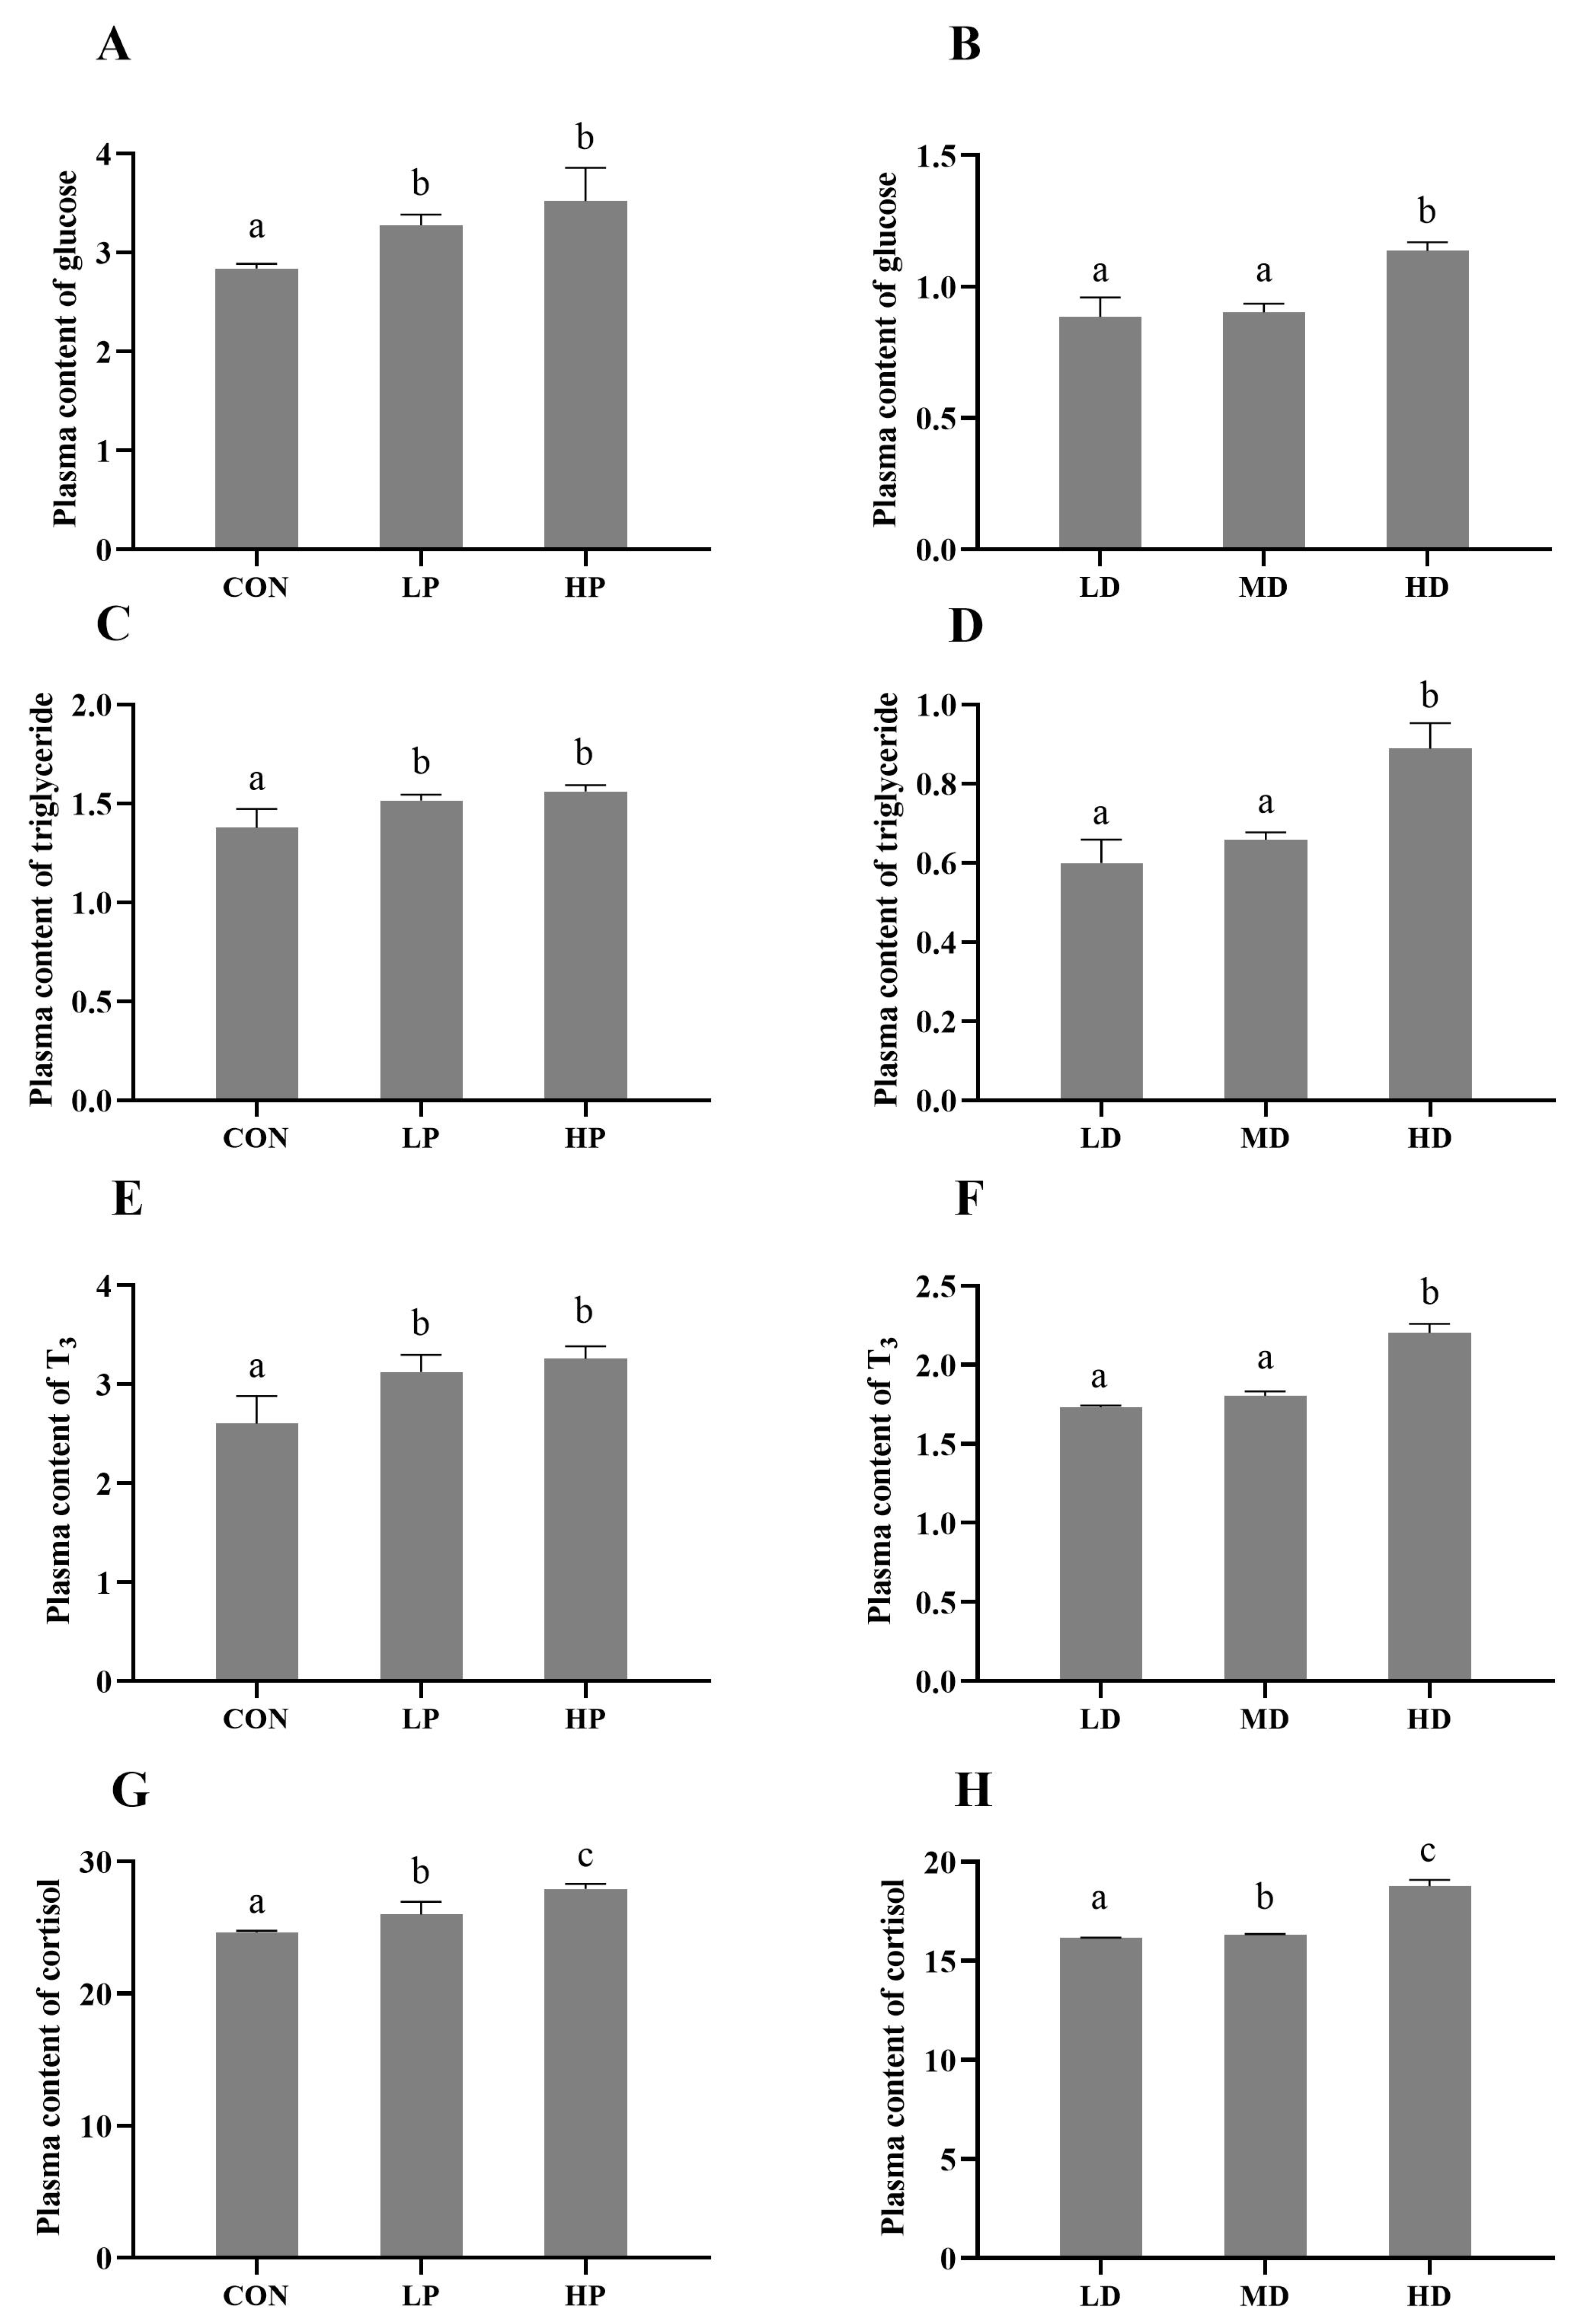
3.5. Physiological Response of Turbot Plasma
4. Discussion
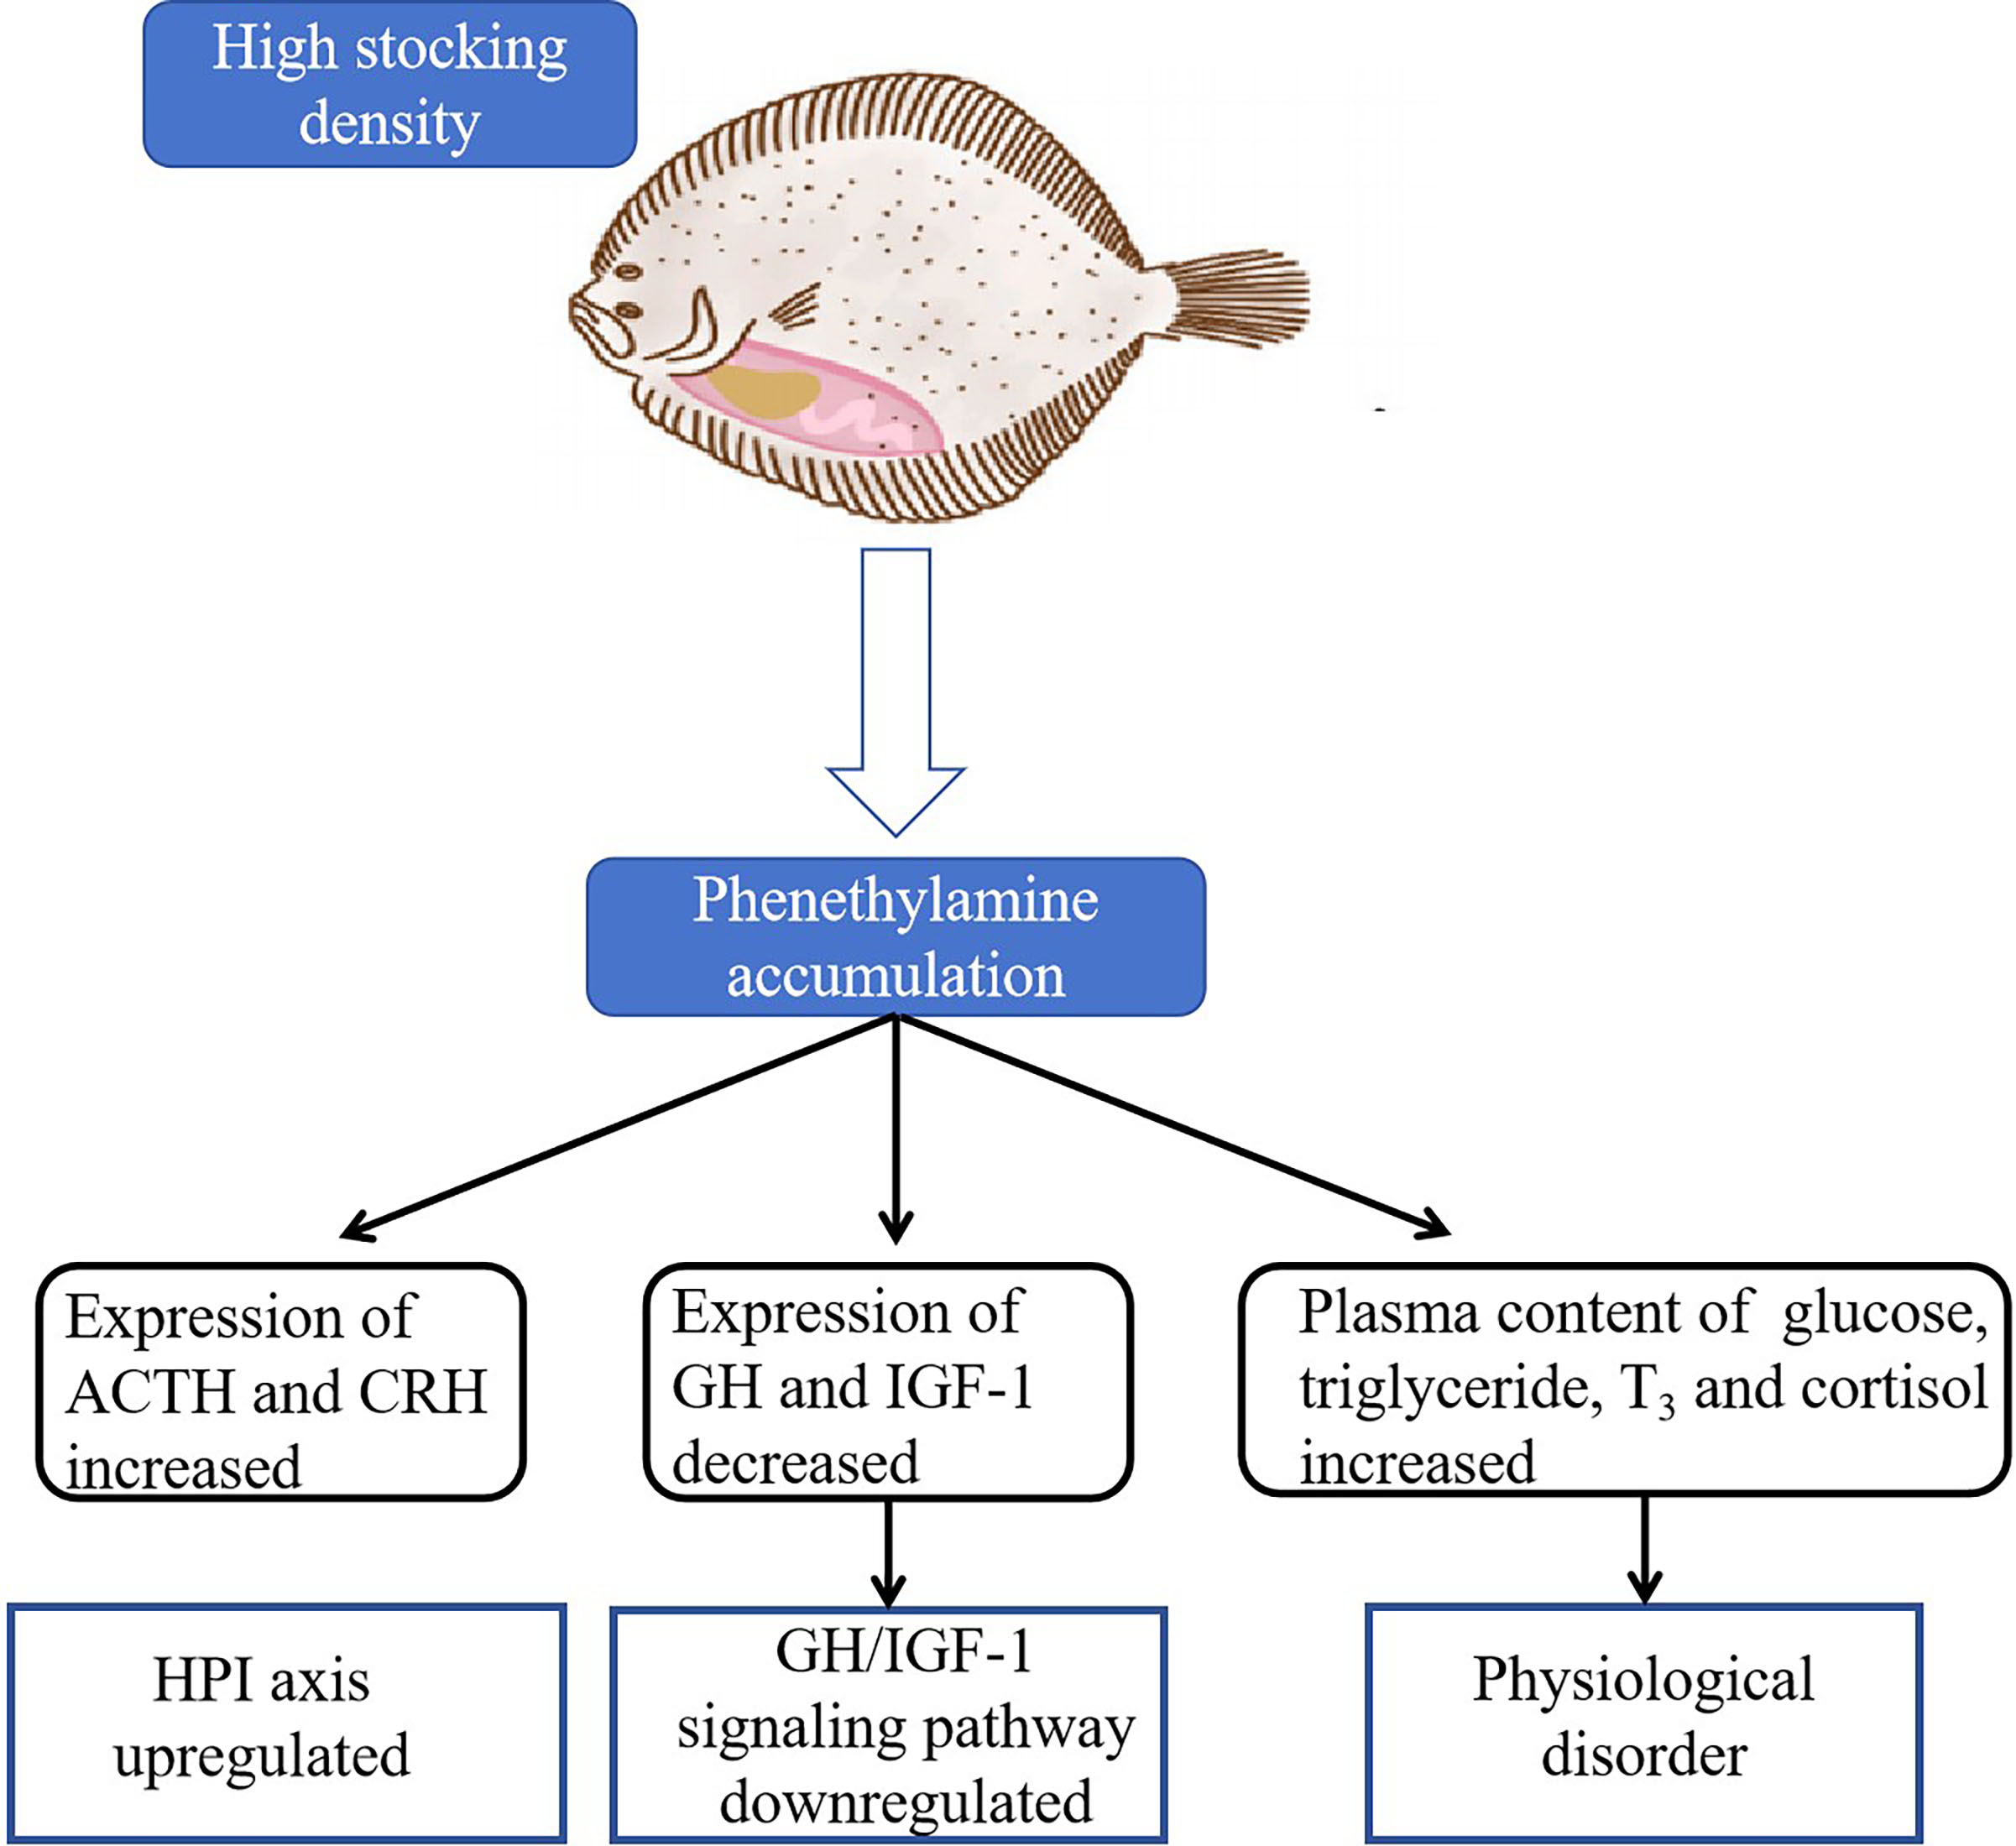
5. Conclusions
Author Contributions
Funding
Institutional Review Board Statement
Data Availability Statement
Acknowledgments
Conflicts of Interest
References
- Li, H.; Cui, Z.; Cui, H.; Bai, Y.; Yin, Z.; Qu, K. A review of influencing factors on a recirculating aquaculture system: Environmental conditions, feeding strategies, and disinfection methods. J. World Aquac. Soc. 2023, 54, 566–602. [Google Scholar]
- Carroll, P.M.; Watanabe, W.O.; Alam, M.S. Growth performance, feed utilization, and resistance to acute crowding of post-metamorphic stage black sea bass Centropristis striata reared at high stocking densities in a pilot recirculating nursery. J. World Aquac. Soc. 2023, 54, 1–17. [Google Scholar] [CrossRef]
- Seo, J.; Park, J. Does Stocking Density Affect Growth Performance and Hematological Parameters of Juvenile Olive Flounder Paralichthys olivaceus in a Recirculating Aquaculture System? Animals 2022, 13, 44. [Google Scholar] [CrossRef]
- Liu, B.; Fei, F.; Li, X.; Wang, X.; Huang, B. Effects of stocking density on stress response, innate immune parameters, and welfare of turbot (Scophthalmus maximus). Aquac. Int. 2019, 27, 1599–1612. [Google Scholar] [CrossRef]
- Liu, B.; Jia, R.; Han, C.; Huang, B.; Lei, J.-L. Effects of stocking density on antioxidant status, metabolism and immune response in juvenile turbot (Scophthalmus maximus). Comp. Biochem. Physiol. C-Toxicol. Pharmacol. 2016, 190, 1–8. [Google Scholar] [CrossRef]
- Liu, B.; Jia, R.; Zhao, K.; Wang, G.; Lei, J.; Huang, B. Stocking density effects on growth and stress response of juvenile turbot (Scophthalmus maximus) reared in land-based recirculating aquaculture system. Acta Oceanol. Sin. 2017, 36, 31–38. [Google Scholar] [CrossRef]
- Jia, R.; Liu, B.-L.; Han, C.; Huang, B.; Lei, J.-L. Influence of Stocking Density on Growth Performance, Antioxidant Status, and Physiological Response of Juvenile Turbot, Scophthalmus maximu, Reared in Land-based Recirculating Aquaculture System. J. World Aquac. Soc. 2016, 47, 587–599. [Google Scholar] [CrossRef]
- Zaki, M.A.; Alabssawy, A.N.; Nour, A.E.-A.M.; El Basuini, M.F.; Dawood, M.A.; Alkahtani, S.; Abdel-Daim, M.M. The impact of stocking density and dietary carbon sources on the growth, oxidative status and stress markers of Nile tilapia (Oreochromis niloticus) reared under biofloc conditions. Aquac. Rep. 2020, 16, 100282. [Google Scholar] [CrossRef]
- Qiang, J.; Zhang, Z.; Yu, J.; Xu, J.; Liu, H.; Zhang, Z.; Xu, P. Water quality and physiological response of F1 hybrid seabream (Pagrus major♀ × Acanthopagrus schlegelii♂) to transport stress at different densities. Aquac. Res. 2018, 49, 767–775. [Google Scholar] [CrossRef]
- Burnard, D.; Gozlan, R.; Griffiths, S.W. The role of pheromones in freshwater fishes. J. Fish Biol. 2008, 73, 1–16. [Google Scholar] [CrossRef]
- Fujimoto, Y.; Yambe, H.; Takahashi, K.; Sato, S. Bile from reproductively mature male largemouth bass Micropterus salmoides attracts conspecific females and offers a practical application to control populations. Manag. Biol. Invasions 2020, 11, 415–427. [Google Scholar] [CrossRef]
- Kamio, M.; Schmidt, M.; Germann, M.W.; Kubanek, J.; Derby, C.D. The smell of moulting: N-acetylglucosamino-1,5-lactone is a premoult biomarker and candidate component of the courtship pheromone in the urine of the blue crab, Callinectes sapidus. J. Exp. Biol. 2014, 217, 1286–1296. [Google Scholar] [PubMed]
- Mathuru, A.S.; Kibat, C.; Cheong, W.F.; Shui, G.; Wenk, M.R.; Friedrich, R.W.; Jesuthasan, S. Chondroitin Fragments Are Odorants that Trigger Fear Behavior in Fish. Curr. Biol. 2012, 22, 538–544. [Google Scholar] [CrossRef] [PubMed]
- Pfuderer, P.; Williams, P.; Francis, A.A. Partial-Purification of crowding factor from Carassius-auratus and Cyprinus-carpio. J. Exp. Zool. 1974, 187, 375–382. [Google Scholar] [CrossRef]
- Roales, R.R. The effect of growth inhibiting factors on the total lipid-content of the Zebrafish, Brachydanio-Rerio (Hamilton-Buchanan). J. Fish Biol. 1981, 18, 723–728. [Google Scholar] [CrossRef]
- Kamio, M.; Derby, C.D. Finding food: How marine invertebrates use chemical cues to track and select food. Nat. Prod. Rep. 2017, 34, 514–528. [Google Scholar]
- van de Nieuwegiessen, P.G.; Zhao, H.; Verreth, J.A.; Schrama, J.W. Chemical alarm cues in juvenile African catfish, Clarias gariepinus Burchell: A potential stressor in aquaculture? Aquaculture 2009, 286, 95–99. [Google Scholar] [CrossRef]
- Ruane, N.M.; Komen, H. Measuring cortisol in the water as an indicator of stress caused by increased loading density in common carp (Cyprinus carpio). Aquaculture 2003, 218, 685–693. [Google Scholar] [CrossRef]
- Li, K.; Buchinger, T.J.; Li, W. Discovery and characterization of natural products that act as pheromones in fish. Nat. Prod. Rep. 2018, 35, 501–513. [Google Scholar]
- Canuto, G.A.B.; da Costa, J.L.; da Cruz, P.L.R.; de Souza, A.R.L.; Faccio, A.T.; Klassen, A.; Rodrigues, K.T.; Tavares, M.F.M. Metabolomics: Definitions, state-of-the-art and Representative Applications. Quim. Nova 2018, 41, 75–91. [Google Scholar]
- Young, T.; Alfaro, A.C. Metabolomic strategies for aquaculture research: A primer. Rev. Aquac. 2018, 10, 26–56. [Google Scholar] [CrossRef]
- Izrayelit, Y.; Srinivasan, J.; Campbell, S.L.; Jo, Y.; von Reuss, S.H.; Genoff, M.C.; Sternberg, P.W.; Schroeder, F.C. Targeted metabolomics reveals a male pheromone and sex-specific ascaroside biosynthesis in Caenorhabditis elegans. ACS Chem. Biol. 2012, 7, 1321–1325. [Google Scholar] [CrossRef]
- Lacalle-Bergeron, L.; Goterris-Cerisuelo, R.; Portolés, T.; Beltran, J.; Sancho, J.V.; Navarro-Moreno, C.; Martinez-Garcia, F. Novel sampling strategy for alive animal volatolome extraction combined with GC-MS based untargeted metabolomics: Identifying mouse pup pheromones. Talanta 2021, 235, 122786. [Google Scholar] [CrossRef] [PubMed]
- Kuhlisch, C.; Pohnert, G. Metabolomics in chemical ecology. Nat. Prod. Rep. 2015, 32, 937–955. [Google Scholar] [PubMed]
- Wu, H.Z.; Cao, A. Preparation and adding methods of Nessler’s reagent having effects on determination of water quality ammonia nitrogen. Adv. Mater. Res. 2013, 726, 1362–1366. [Google Scholar] [CrossRef]
- Lin, Y.; Miao, L.-H.; Pan, W.-J.; Huang, X.; Dengu, J.M.; Zhang, W.-X.; Ge, X.-P.; Liu, B.; Ren, M.-C.; Zhou, Q.-L.; et al. Effect of nitrite exposure on the antioxidant enzymes and glutathione system in the liver of bighead carp, Aristichthys nobilis. Fish Shellfish. Immunol. 2018, 76, 126–132. [Google Scholar] [CrossRef] [PubMed]
- Pfaffl, M.W. A new mathematical model for relative quantification in real-time RT-PCR. Nucleic Acids Res. 2001, 29, e45. [Google Scholar] [CrossRef]
- Gao, B.; Lu, Y.; Sheng, Y.; Chen, P.; Yu, L. Differentiating organic and conventional sage by chromatographic and mass spectrometry flow injection fingerprints combined with principal component analysis. J. Agric. Food Chem. 2013, 61, 2957–2963. [Google Scholar] [CrossRef]
- He, J.; Dai, Q.; Qi, Y.; Wu, Z.; Fang, Q.; Su, P.; Huang, M.; Burgess, J.G.; Ke, C.; Feng, D. Aggregation Pheromone for an Invasive Mussel Consists of a Precise Combination of Three Common Purines. Iscience 2019, 19, 691–702. [Google Scholar] [CrossRef]
- Dissanayake, A.A.; Wagner, C.M.; Nair, M.G. Nitrogenous compounds characterized in the deterrent skin extract of migratory adult sea lamprey from the Great Lakes region. PLoS ONE 2019, 14, e0217417. [Google Scholar]
- Yu, H.; Wang, X.; Kong, F.; Song, X.; Tan, Q. The attractive effects of amino acids and some classical substances on grass carp (Ctenopharyngodon idellus). Fish Physiol. Biochem. 2021, 47, 1489–1505. [Google Scholar] [CrossRef]
- Hamase, K. Sensitive two-dimensional determination of small amounts of D-amino acids in mammals and the study on their functions. Chem. Pharm. Bull. 2007, 55, 503–510. [Google Scholar] [CrossRef] [PubMed]
- Hamase, K.; Morikawa, A.; Zaitsu, K. D-Amino acids in mammals and their diagnostic value. J. Chromatogr. B Anal. Technol. Biomed. Life Sci. 2002, 781, 73–91. [Google Scholar]
- Liu, M.; Li, M.; He, J.; He, Y.; Yang, J.; Sun, Z. Chiral Amino Acid Profiling in Serum Reveals Potential Biomarkers for Alzheimer’s Disease. J. Alzheimers Dis. 2023, 94, 291–301. [Google Scholar] [CrossRef] [PubMed]
- Doleski, P.H.; Leal, D.B.R.; Machado, V.S.; Bottari, N.B.; Casali, E.A.; Moritz, C.E.J.; Camillo, G.; Vogel, F.F.; Stefani, L.M.; da Silva, A.S. Hepatic xanthine oxidase activity and purine nucleosides levels as physiological mediators to analyze a subcutaneous treatment with (PhSe)(2) in mice infected by Toxoplasma gondii. Microb. Pathog. 2017, 104, 180–183. [Google Scholar] [CrossRef] [PubMed]
- Baldissera, M.D.; Souza, C.F.; Doleski, P.H.; Moreira, K.L.S.; da Rocha, M.I.U.M.; da Veiga, M.L.; Santos, R.C.V.; Baldisserotto, B. Xanthine oxidase activity exerts a pro-oxidant and pro-inflammatory profile in gills of experimentally infected silver catfish with Streptococcus agalactiae. Aquaculture 2017, 477, 71–75. [Google Scholar] [CrossRef]
- Wu, Y.; Zhao, M.; Xiong, G.; Sun, W.; Wu, W.; Ding, A.; Chen, S.; Wang, L.; Shi, L. Effects of hypoxia on meat qualities and muscle metabolism in rainbow trout (Oncorhynchus mykiss) during short-time transportation and its relief by reoxygenation. Aquaculture 2023, 570, 739404. [Google Scholar] [CrossRef]
- Pundir, C.S.; Devi, R. Biosensing methods for xanthine determination: A review. Enzym. Microb. Technol. 2014, 57, 55–62. [Google Scholar] [CrossRef]
- Nieto, C.T.; Manchado, A.; Belda, L.; Diez, D.; Garrido, N.M. 2-Phenethylamines in Medicinal Chemistry: A Review. Molecules 2023, 28, 855. [Google Scholar]
- Nara, A.; Nakajima, R.; Yamada, C.; Suyama, M.; Kozakai, Y.; Yoshida, M.; Iwahara, K.; Takagi, T. Temperature and time after urine collection affect the detection of phenethylamine, a substance prohibited in sports. Drug Test. Anal. 2023, 15, 701–705. [Google Scholar] [CrossRef]
- Edwards, D.J.; Blau, K. Phenethylamines in brain and liver of rats with experimentally induced phenylketonuria-like characteristics. Biochem. J. 1973, 132, 95–100. [Google Scholar] [CrossRef] [PubMed]
- Mosnaim, A.D.; Hudzik, T.; Wolf, M.E. Behavioral Effects of beta-Phenylethylamine and Various Monomethylated and Monohalogenated Analogs in Mice Are Mediated by Catecholaminergic Mechanisms. Am. J. Ther. 2015, 22, 412–422. [Google Scholar] [CrossRef] [PubMed]
- Snoddy, A.M.; Heckathorn, D.; Tessel, R.E. Cold-restraint stress and urinary endogenous α-phenylethylamine excretion in rats. Pharmacol. Biochem. Behav. 1985, 22, 497–500. [Google Scholar] [CrossRef] [PubMed]
- Paulos, M.A.; Tessel, R.E. Excretion of Beta-phenethylamine is elevated in humans after profound stress. Science 1982, 215, 1127–1129. [Google Scholar] [CrossRef] [PubMed]
- Best, C.; Faught, E.; Vijayan, M.M.; Gilmour, K.M. Negative feedback regulation in the hypothalamic-pituitary-interrenal axis of rainbow trout subjected to chronic social stress. Gen. Comp. Endocrinol. 2023, 341, 114332. [Google Scholar] [CrossRef]
- Yusishen, M.E.; Yoon, G.R.; Bugg, W.; Jeffries, K.M.; Currie, S.; Anderson, W.G. Love thy neighbor: Social buffering following exposure to an acute thermal stressor in a gregarious fish, the lake sturgeon (Acipenser fulvescens). Comp. Biochem. Physiol. Part A Mol. Integr. Physiol. 2020, 243, 110686. [Google Scholar] [CrossRef]
- Zaki, M.A.A.; Khalil, H.S.; Allam, B.W.; Khalil, R.H.; Basuini, M.F.E.; Nour, A.E.-A.M.; Labib, E.M.H.; Elkholy, I.S.E.; Verdegem, M.; Abdel-Latif, H.M.R. Assessment of zootechnical parameters, intestinal digestive enzymes, haemato-immune responses, and hepatic antioxidant status of Pangasianodon hypophthalmus fingerlings reared under different stocking densities. Aquac. Int. 2023, 31, 1–24. [Google Scholar]
- Bi, B.; Yuan, Y.; Zhao, Y.; He, M.; Song, H.; Kong, L.; Gao, Y. Effect of crowding stress on growth performance, the antioxidant system and humoral immunity in hybrid sturgeon. Aquac. Rep. 2023, 28, 101468. [Google Scholar] [CrossRef]
- Yu, J.; Wang, Y.; Xiao, Y.; Li, X.; Zhou, L.; Wang, Y.; Du, T.; Ma, X.; Li, J. Investigating the effect of nitrate on juvenile turbot (Scophthalmus maximus) growth performance, health status, and endocrine function in marine recirculation aquaculture systems. Ecotoxicol. Environ. Saf. 2021, 208, 111617. [Google Scholar]
- Jia, R.; Liu, B.L.; Han, C.; Huang, B.; Lei, J.L. Effects of ammonia exposure on stress and immune response in juvenile turbot (Scophthalmus maximus). Aquac. Res. 2017, 48, 3149–3162. [Google Scholar]
- Madison, B.N.; Woo, P.T.; Bernier, N.J. Duress without stress: Cryptobia infection results in HPI axis dysfunction in rainbow trout. J. Endocrinol. 2013, 218, 287–297. [Google Scholar] [CrossRef]
- Flik, G.; Klaren, P.H.M.; Van den Burg, E.H.; Metz, J.R.; Huising, M.O. CRF and stress in fish. Gen. Comp. Endocrinol. 2006, 146, 36–44. [Google Scholar] [CrossRef] [PubMed]
- Shepherd, B.S.; Spear, A.R.; Philip, A.M.; Leaman, D.W.; Stepien, C.A.; Sepulveda-Villet, O.J.; Palmquist, D.E.; Vijayan, M.M. Effects of cortisol and lipopolysaccharide on expression of select growth-, stress- and immune-related genes in rainbow trout liver. Fish Shellfish. Immunol. 2018, 74, 410–418. [Google Scholar] [CrossRef] [PubMed]
- Blanco, A.M. Hypothalamic-and pituitary-derived growth and reproductive hormones and the control of energy balance in fish. Gen. Comp. Endocrinol. 2020, 287, 113322. [Google Scholar]
- Canosa, L.F.; Bertucci, J.I. The effect of environmental stressors on growth in fish and its endocrine control. Front. Endocrinol. 2023, 14, 801. [Google Scholar]
- Pérez-Sánchez, J.; Simó-Mirabet, P.; Naya-Català, F.; Martos-Sitcha, J.A.; Perera, E.; Bermejo-Nogales, A.; Benedito-Palos, L.; Calduch-Giner, J.A. Somatotropic axis regulation unravels the differential effects of nutritional and environmental factors in growth performance of marine farmed fishes. Front. Endocrinol. 2018, 9, 687. [Google Scholar]
- Deane, E.E.; Kelly, S.P.; Luk, J.C.; Woo, N.Y. Chronic salinity adaptation modulates hepatic heat shock protein and insulin-like growth factor I expression in black sea bream. Mar. Biotechnol. 2002, 4, 193–205. [Google Scholar] [CrossRef] [PubMed]
- Davis, K.B.; Peterson, B.C. The effect of temperature, stress, and cortisol on plasma IGF-I and IGFBPs in sunshine bass. Gen. Comp. Endocrinol. 2006, 149, 219–225. [Google Scholar] [CrossRef]
- Xie, L.; Yan, W.; Li, J.; Yu, L.; Wang, J.; Li, G.; Chen, N.; Steinman, A.D. Microcystin-RR exposure results in growth impairment by disrupting thyroid endocrine in zebrafish larvae. Aquat. Toxicol. 2015, 164, 16–22. [Google Scholar] [CrossRef]
- Power, D.M.; Llewellyn, L.; Faustino, M.; Nowell, M.A.; Björnsson, B.T.; Einarsdóttir, I.E.; Canario, A.V.; Sweeney, G.E. Thyroid hormones in growth and development of fish. Comp. Biochem. Physiol. Part C Toxicol. Pharmacol. 2001, 130, 447–459. [Google Scholar]
- Yamano, K. The role of thyroid hormone in fish development with reference to aquaculture. Jarq-Jpn. Agric. Res. Q. 2005, 39, 161–168. [Google Scholar] [CrossRef]
- Ardiansyah; Fotedar, R. Water quality, growth and stress responses of juvenile barramundi (Lates calcarifer Bloch), reared at four different densities in integrated recirculating aquaculture systems. Aquaculture 2016, 458, 113–120. [Google Scholar] [CrossRef]
- Robson, H.; Siebler, T.; Shalet, S.M.; Williams, G.R. Interactions between GH, IGF-I, glucocorticoids, and thyroid hormones during skeletal growth. Pediatr. Res. 2002, 52, 137–147. [Google Scholar] [PubMed]
- Pepene, C.E.; Kasperk, C.H.; Pfeilschifter, J.; Borcsok, I.; Gozariu, L.; Ziegler, R.; Seck, T. Effects of triiodothyronine on the insulin-like growth factor system in primary human osteoblastic cells in vitro. Bone 2001, 29, 540–546. [Google Scholar] [CrossRef] [PubMed]
- Bredy, T.W.; Barad, M. Social modulation of associative fear learning by pheromone communication. Learn. Mem. 2009, 16, 12–18. [Google Scholar] [CrossRef] [PubMed]
- Ferrero, D.M.; Lemon, J.K.; Fluegge, D.; Pashkovski, S.L.; Korzan, W.J.; Datta, S.R.; Spehr, M.; Fendt, M.; Liberles, S.D. Detection and avoidance of a carnivore odor by prey. Proc. Natl. Acad. Sci. USA 2011, 108, 11235–11240. [Google Scholar] [CrossRef]
- Imre, I.; Di Rocco, R.T.; Belanger, C.F.; Brown, G.E.; Johnson, N.S. The behavioural response of adult Petromyzon marinus to damage-released alarm and predator cues. J. Fish Biol. 2014, 84, 1490–1502. [Google Scholar] [CrossRef]


| Gene Name | Primer Sequence (5′–3′) | Annealing Temperature (°C) | Amplic on Size (bp) |
|---|---|---|---|
| IGF-1 | F: TCGTGGACGAGTGCTGCTT R: CCGCCTTGCTAGTCTTGG | 58 | 81 |
| ACTH | F: TGTGGCTATTAGTGGCTGTGG R: CCTGGCAGTTCGGATTCTC | 60 | 81 |
| GH | F: AATAACCACGAGACACAACGCA R: GAGAACTCCCAAGACTCAACCAA | 58 | 80 |
| CRH | F: CCTCCTCTAACGATTGAAGATTCC R: AGGGCTGTCAATAGCTCGAC | 58 | 123 |
| GHR | F: ACACGTCCATTTGGATCCCC R: GCTCCCAGTTGACCATGACA | 58 | 183 |
| β-actin | F: TGAACCCCAAAGCCAACAGG R: GAGGCATACAGGGACAGCAC | 107 |
| Comparison Group Name | R2X | R2Y | Q2 |
|---|---|---|---|
| LD vs. MD.POS | 0.762 | 0.893 | 0.768 |
| LD vs. MD.NEG | 0.709 | 0.924 | 0.769 |
| LD vs. HD.POS | 0.758 | 0.955 | 0.635 |
| LD vs. HD.NEG | 0.94 | 0.984 | 0.967 |
| MD vs. HD.POS | 0.552 | 0.983 | 0.705 |
| MD vs. HD.NEG | 0.872 | 0.983 | 0.902 |
Disclaimer/Publisher’s Note: The statements, opinions and data contained in all publications are solely those of the individual author(s) and contributor(s) and not of MDPI and/or the editor(s). MDPI and/or the editor(s) disclaim responsibility for any injury to people or property resulting from any ideas, methods, instructions or products referred to in the content. |
© 2023 by the authors. Licensee MDPI, Basel, Switzerland. This article is an open access article distributed under the terms and conditions of the Creative Commons Attribution (CC BY) license (https://creativecommons.org/licenses/by/4.0/).
Share and Cite
Li, J.; Wang, Y.; Guo, T.; Xu, S.; Gao, G.; Liu, F.; Guo, X.; Wu, Y.; Zhao, H.; Li, J. Phenethylamine Is a Potential Density Stress Pheromone in Turbot (Scophthalmus maximus). Fishes 2023, 8, 506. https://doi.org/10.3390/fishes8100506
Li J, Wang Y, Guo T, Xu S, Gao G, Liu F, Guo X, Wu Y, Zhao H, Li J. Phenethylamine Is a Potential Density Stress Pheromone in Turbot (Scophthalmus maximus). Fishes. 2023; 8(10):506. https://doi.org/10.3390/fishes8100506
Chicago/Turabian StyleLi, Jiyuan, Yanfeng Wang, Teng Guo, Shihong Xu, Guang Gao, Feng Liu, Xiaoyang Guo, Yanduo Wu, Haixia Zhao, and Jun Li. 2023. "Phenethylamine Is a Potential Density Stress Pheromone in Turbot (Scophthalmus maximus)" Fishes 8, no. 10: 506. https://doi.org/10.3390/fishes8100506
APA StyleLi, J., Wang, Y., Guo, T., Xu, S., Gao, G., Liu, F., Guo, X., Wu, Y., Zhao, H., & Li, J. (2023). Phenethylamine Is a Potential Density Stress Pheromone in Turbot (Scophthalmus maximus). Fishes, 8(10), 506. https://doi.org/10.3390/fishes8100506