
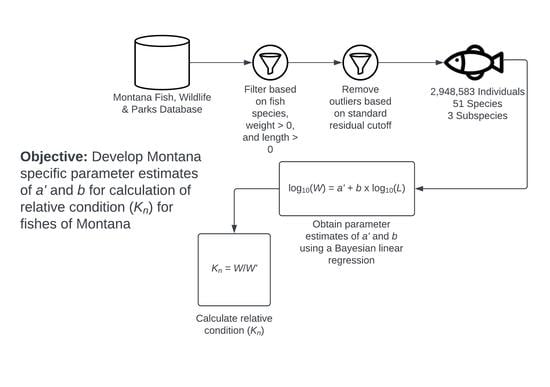
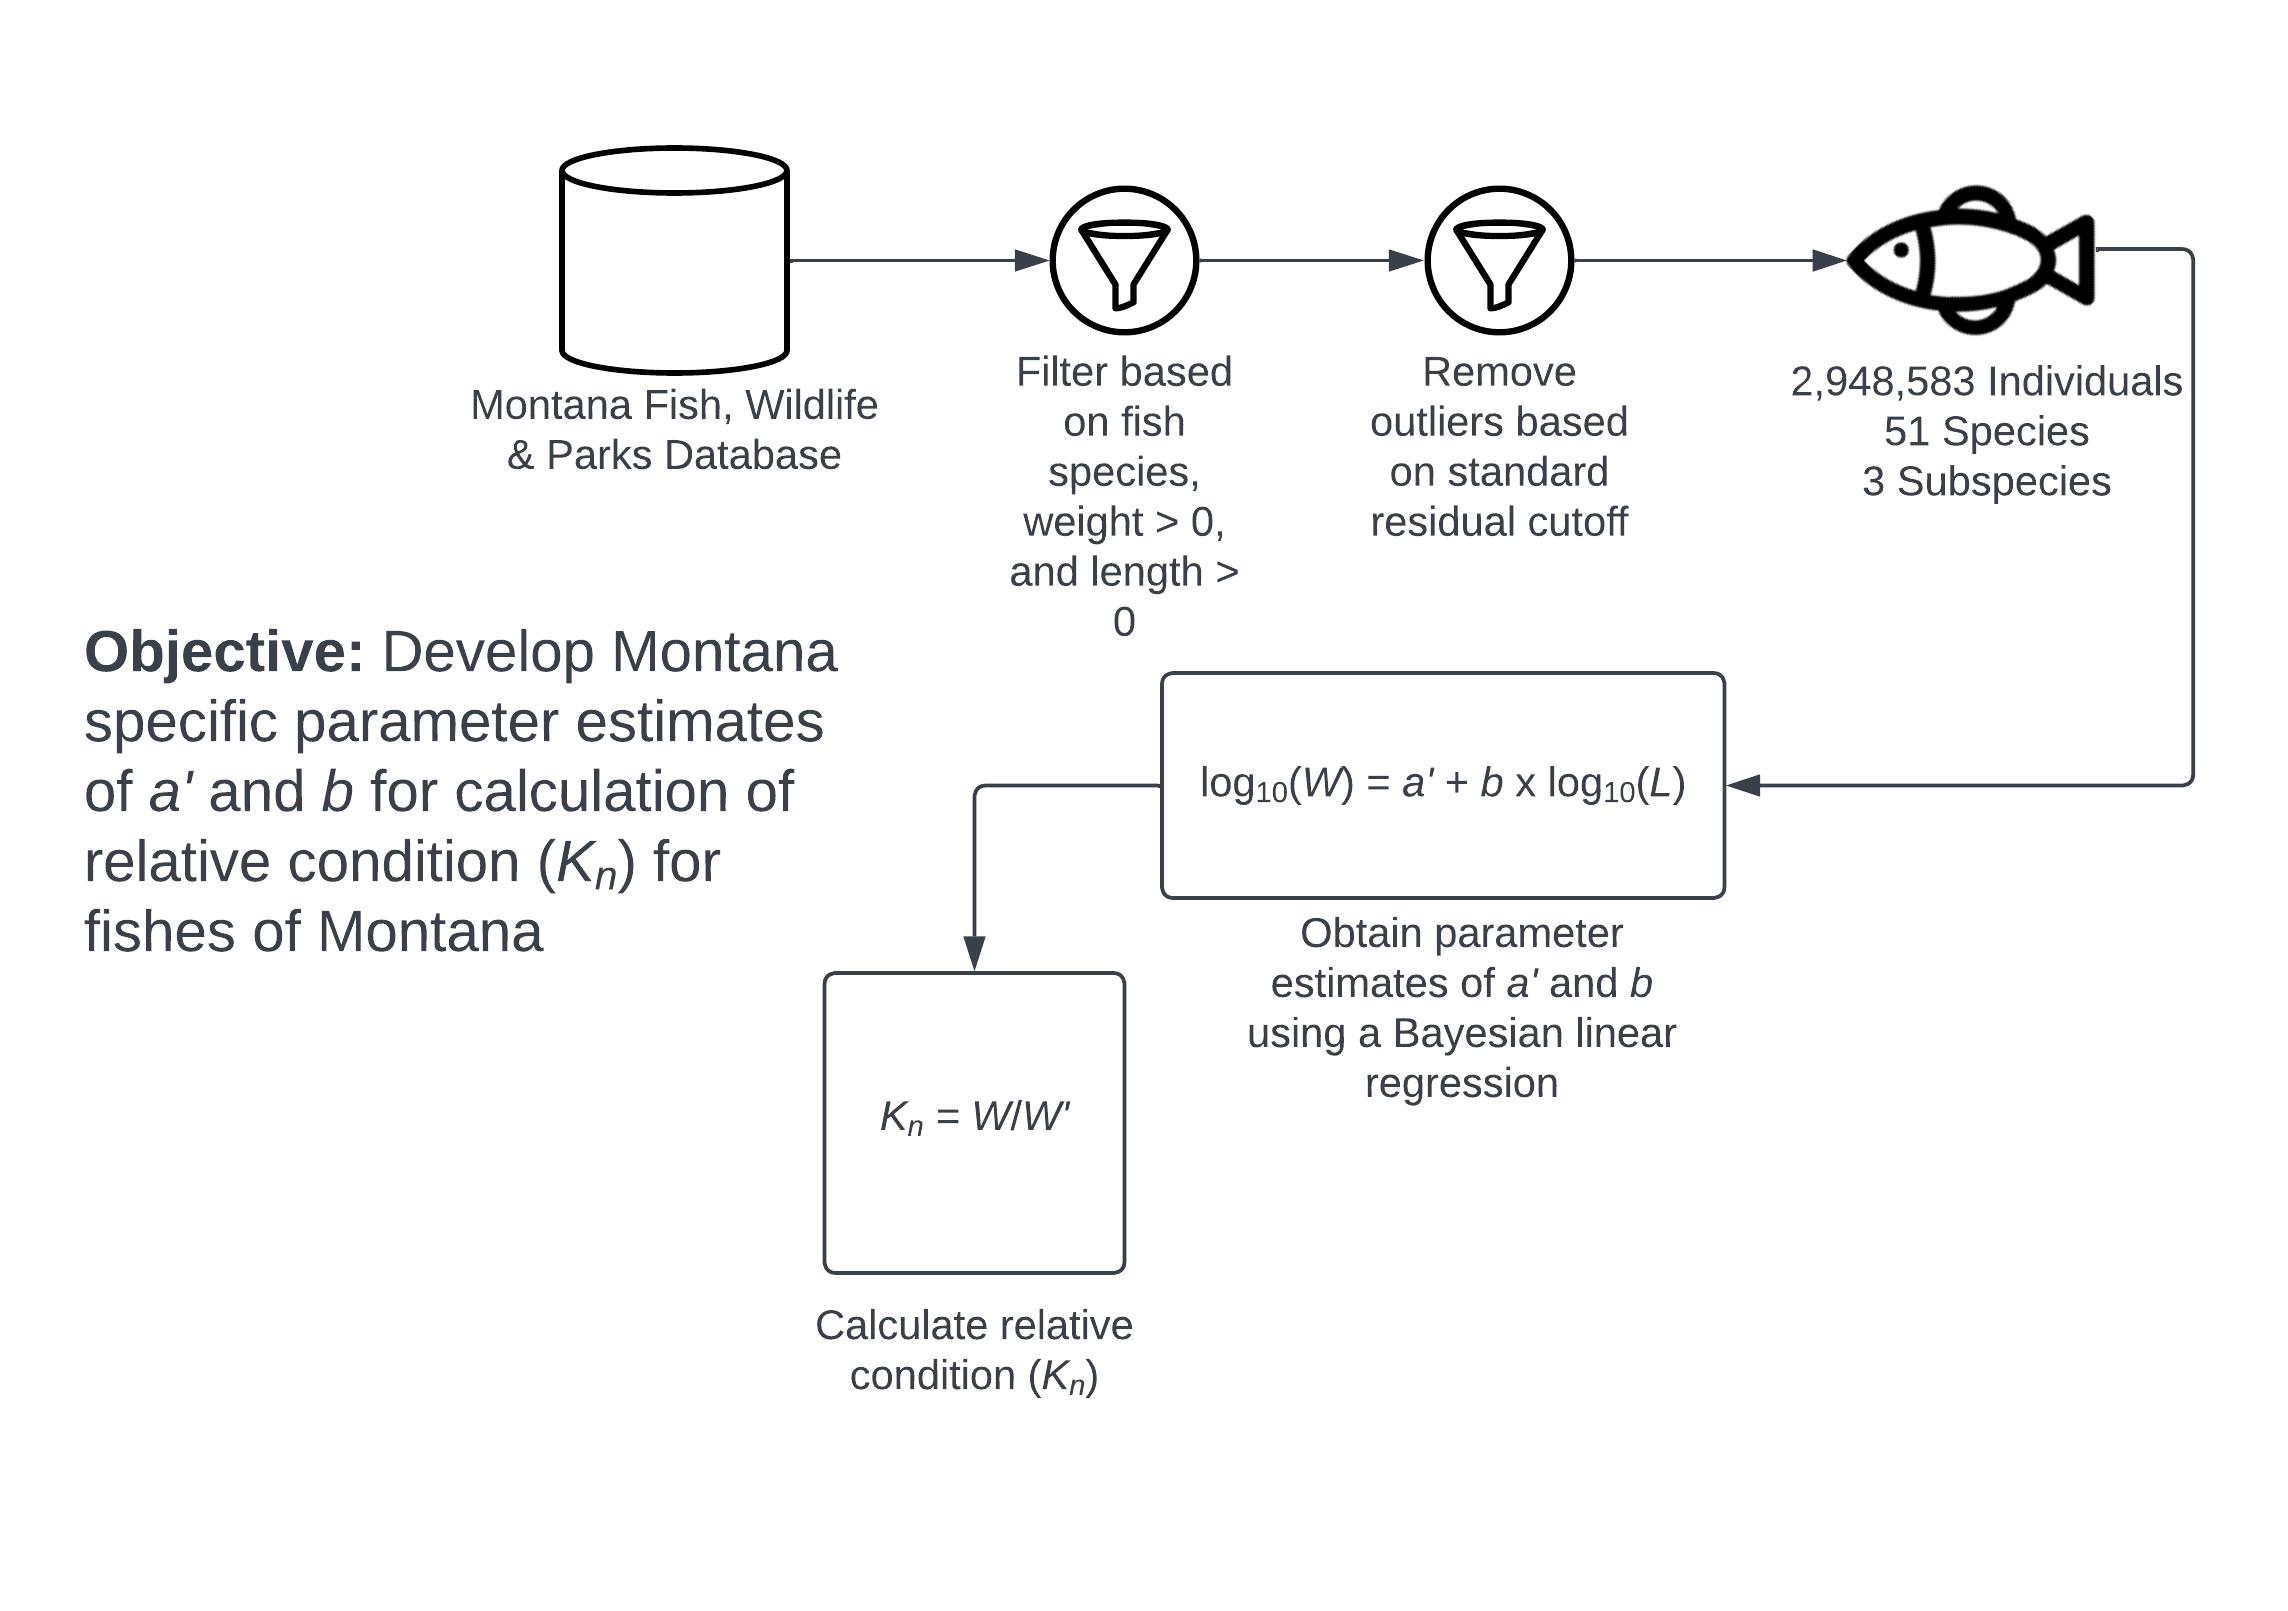
Relative Condition Parameters for Fishes of Montana, USA

 , , and
Abstract
1. Introduction
2. Materials and Methods
3. Results
4. Discussion
Supplementary Materials
Author Contributions
Funding
Institutional Review Board Statement
Data Availability Statement
Acknowledgments
Conflicts of Interest
References
- Blackwell, B.G.; Brown, M.L.; Willis, D.W. Relative Weight (Wr) Status and Current Use in Fisheries Assessment and Management. Rev. Fish. Sci. 2000, 8, 1–44. [Google Scholar] [CrossRef]
- Neumann, R.M.; Guy, C.S.; Willis, D.W. Length, Weight, and Associated Indices. In Fisheries Techniques, 3rd ed.; Zale, A.V., Parrish, D.L., Sutton, T.M., Eds.; American Fisheries Society: Bethesda, MD, USA, 2012; pp. 637–676. [Google Scholar]
- Le Cren, E.D. The length-weight relationship and seasonal cycle in gonad weight and condition in the perch Perca fluviatilis. J. Anim. Ecol. 1951, 20, 201–219. [Google Scholar] [CrossRef]
- Bolger, T.; Connolly, P.L. The selection of suitable indices for the measurement and analysis of fish condition. J. Fish Biol. 1988, 34, 171–182. [Google Scholar] [CrossRef]
- Murphy, B.R.; Willis, D.W.; Springer, T.A. The relative weight index in fisheries management: Status and needs. Fisheries 1991, 16, 30–38. [Google Scholar] [CrossRef]
- Swingle, W.E.; Shell, E.W. Tables for Computing Relative Conditions of Some Common Freshwater Fishes; Circular 183; Auburn University, Agricultural Experiment Station: Auburn, AL, USA, 1971. [Google Scholar]
- Dadzie, S.; Wangila, B.C.C. Reproductive biology, length-weight relationship and relative condition of pond raised Tilapia zillii (Gervais). J. Fish Biol. 1980, 17, 243–253. [Google Scholar] [CrossRef]
- Koushlesh, S.K.; Sinha, A.; Kumari, K.; Borah, S.; Chanu, T.N.; Baitha, R.; Das, S.K.; Gogoi, P.; Sharma, S.K.; Ramteke, M.H.; et al. Length-weight relationship and relative condition factor of five indigenous fish species from Torsa River, West Bengal, India. J. Appl. Ichthyol. 2018, 34, 169–171. [Google Scholar] [CrossRef]
- Craig, J.M.; Thomas, M.V.; Nichols, S.J. Length-weight relationship and a relative condition factor equation for lake sturgeon (Acipenser fulvescens) from the St Clair River system (Michigan, USA). J. Appl. Ichthyol. 2005, 21, 81–85. [Google Scholar] [CrossRef]
- Colombelli, A.; Bonanomi, S. Length-weight relationships for six elasmobranch species from the Adriatic Sea. J. Appl. Ichthyol. 2022, 38, 328–332. [Google Scholar] [CrossRef]
- Osborne, J.W.; Overbay, A. The power of outliers (and why researchers should always check for them). Pract. Assess. Res. Eval. 2004, 9, 6. [Google Scholar] [CrossRef]
- Neely, B.C.; Hamel, M.J.; Steffensen, K.D. A proposed standard weight equation for Blue Suckers. N. Am. J. Fish. Manag. 2008, 28, 1450–1452. [Google Scholar] [CrossRef]
- Rennie, M.D.; Verdon, R. Development and evaluation of condition indices for the Lake Whitefish. N. Am. J. Fish. Manag. 2008, 28, 1270–1293. [Google Scholar] [CrossRef]
- Black, A.R.; Beard, Z.S.; Flinders, J.M.; Quist, M.C. Proposed standard weight (Ws) equation and length categories for Utah Chub. N. Am. J. Fish. Manag. 2021, 41, 1299–1308. [Google Scholar] [CrossRef]
- Gilham, A.T.; Brown, M.L.; Jordan, G.R. Proposed standard weight (Ws) equations for arctic grayling. N. Am. J. Fish. Manag. 2021, 41, 739–745. [Google Scholar] [CrossRef]
- Willis, D.W.; Guy, C.S.; Murphy, B.R. Development and evaluation of a standard weight (Ws) equation for yellow perch. N. Am. J. Fish. Manag. 1991, 11, 374–380. [Google Scholar] [CrossRef]
- Bister, T.J.; Willis, D.W.; Brown, M.L. Proposed Standard Weight (Ws) equations and standard length categories for 18 warmwater nongame and riverine fish species. N. Am. J. Fish. Manag. 2000, 20, 570–574. [Google Scholar] [CrossRef]
- Pope, K.L.; Kruse, C.G. Condition. In Analysis and Interpretation of Freshwater Fisheries Data; Guy, C.S., Brown, M.L., Eds.; American Fisheries Society: Bethesda, MD, USA, 2007; pp. 423–472. [Google Scholar]
- Martin, A.D.; Quinn, K.M.; Park, J.H. MCMCpack: Markov Chain Moneta Carlo in R. J. Stat. Softw. 2011, 42, 22. [Google Scholar] [CrossRef]
- R Core Team. R: A Language and Environment for Statistical Computing; R Foundation for Statistical Computing: Vienna, Austria, 2019; Available online: https://www.R-project.org/ (accessed on 9 February 2022).
- Fishes of Montana. A Field Guide to the Fishes Found in the Waters of Montana; Montana State University & Mountain Works, in Cooperation with Montana Fish, Wildlife & Parks: Bozeman, MT, USA, 2019. [Google Scholar]
- Brown, M.L.; Murphy, B.R. Management evaluation of body condition and population size structure for paddlefish: A unique case. Prairie Nat. 1993, 25, 93–108. [Google Scholar]
- Milewski, C.L.; Brown, M.L. Proposed standard weight (Ws) equation and length category standards for stream-dwelling brown trout. J. Freshw. Ecol. 1994, 9, 111–116. [Google Scholar] [CrossRef]
- Simpkins, D.G.; Hubert, W.A. Proposed revision of the standard weight equation for rainbow trout. J. Freshw. Ecol. 1996, 11, 319–326. [Google Scholar] [CrossRef]
- Kruse, C.G.; Hubert, W.A. Proposed standard weight (Ws) equation for interior cutthroat trout. N. Am. J. Fish. Manag. 1997, 17, 784–790. [Google Scholar] [CrossRef]
- Hyatt, M.H.; Hubert, W.A. Proposed standard-weight (Ws) equation and length-categorization standards for brown trout (Salmo trutta) in lenthic habitats. J. Freshw. Ecol. 2001, 16, 53–56. [Google Scholar] [CrossRef]
- Froese, R. Cube law, condition factor and weight-length relationships: History, meta-analysis and recommendations. J. Appl. Ichthyol. 2006, 22, 241–253. [Google Scholar] [CrossRef]
- Ricker, W.E. Handbook of computations for biological statistics of fish populations. Can. Fish Res. Board Bull. 1958, 119, 1–300. [Google Scholar]
- Tribuzy-Neto, A.; Conceicão, K.G.; Siqueira-Souza, F.K.; Hurd, L.E.; Freitas, C.E.C. Condition factor variations over time and trophic position among four species of Characidae from Amazonian floodplain lakes: Effects of an anomalous drought. Braz. J. Biol. 2016, 78, 337–344. [Google Scholar] [CrossRef] [PubMed]
- Rocha, B.S.; García-Berthou, E.; Novaes, J.L.C.; Bini, L.M.; Cianciaruso, M.V. Interspecific synchrony is related to body-length similarity in a fish community under prolonged drought conditions. Sci. Total Environ. 2021, 781, 146721. [Google Scholar] [CrossRef] [PubMed]
- Brown, M.L.; Murphy, B.R. Management: Briefs selection of a minimum sample size for application of the regression-line-percentile technique. N. Am. J. Fish. Manag. 1966, 16, 427–432. [Google Scholar] [CrossRef]

| Length (mm) | Weight (g) | Kn | |||||
|---|---|---|---|---|---|---|---|
| Species | Scientific Name | Min | Max | Min | Max | Min | Max |
| Acipenseridae | |||||||
| Pallid sturgeon | Scaphirhynchus albus | 325 | 1472 | 94 | 15,876 | 0.64 | 1.40 |
| White sturgeon | Acipenser transmontanus | 701 | 1460 | 1160 | 17,222 | 0.76 | 1.39 |
| Catostomidae | |||||||
| Bigmouth buffalo | Ictiobus cyprinellus | 163 | 905 | 73 | 13,450 | 0.76 | 1.29 |
| Blue sucker | Cycleptus elongatus | 437 | 884 | 680 | 7100 | 0.68 | 1.45 |
| Largescale sucker | Catostomus macrocheilus | 110 | 647 | 10 | 2774 | 0.66 | 1.55 |
| Longnose sucker | Catostomus catostomus | 90 | 597 | 6 | 2767 | 0.66 | 1.53 |
| Mountain sucker | Catostomus platyrhynchus | 100 | 246 | 9 | 181 | 0.45 | 2.30 |
| River carpsucker | Carpiodes carpio | 130 | 762 | 27 | 7711 | 0.70 | 1.43 |
| Shorthead redhorse | Moxostoma macrolepidotum | 100 | 581 | 9 | 2675 | 0.69 | 1.47 |
| Smallmouth buffalo | Ictiobus bubalus | 201 | 870 | 150 | 11,067 | 0.68 | 1.45 |
| White sucker | Catostomus commersonii | 100 | 564 | 8 | 2259 | 0.69 | 1.44 |
| Centrarchidae | |||||||
| Black crappie | Pomoxis nigromaculatus | 100 | 396 | 9 | 960 | 0.59 | 1.72 |
| Bluegill | Lepomis macrochirus | 80 | 254 | 5 | 572 | 0.50 | 2.02 |
| Green sunfish | Lepomis cyanellus | 61 | 226 | 5 | 260 | 0.40 | 2.40 |
| Largemouth bass | Micropterus salmoides | 150 | 520 | 40 | 2630 | 0.67 | 1.50 |
| Pumpkinseed | Lepomis gibbosus | 53 | 260 | 3 | 317 | 0.53 | 1.93 |
| Smallmouth bass | Micropterus dolomieu | 151 | 561 | 27 | 3500 | 0.60 | 1.67 |
| Cottidae | |||||||
| Columbia slimy sculpin | Uranidea sp. cf. cognata ‡ | 90 | 138 | 6 | 43 | 0.54 | 1.63 |
| Rocky mountain sculpin | Uranidea sp. cf. bairdii ‡ | 90 | 597 | 6 | 2767 | 0.66 | 1.53 |
| Cyprinidae | |||||||
| Common carp | Cyprinus carpio | 200 | 851 | 90 | 10,610 | 0.69 | 1.45 |
| Esocidae | |||||||
| Northern Pike | Esox lucius | 102 | 1118 | 5 | 13,617 | 0.62 | 1.61 |
| Tiger muskellunge | Esox masquinongy x lucius | 254 | 1270 | 68 | 14,515 | 0.71 | 1.45 |
| Hiodontidae | |||||||
| Goldeye | Hiodon alosoides | 100 | 505 | 9 | 1501 | 0.68 | 1.48 |
| Ictaluridae | |||||||
| Black bullhead | Ameiurus melas | 130 | 353 | 20 | 850 | 0.60 | 1.66 |
| Stonecat | Noturus flavus | 90 | 269 | 5 | 272 | 0.56 | 1.78 |
| Yellow bullhead | Ameiurus natalis | 124 | 360 | 20 | 750 | 0.71 | 1.41 |
| Leuciscidae | |||||||
| Flathead chub | Platygobio gracilis | 100 | 272 | 9 | 213 | 0.40 | 2.37 |
| Golden shiner | Notemigonus crysoleucas | 71 | 452 | 5 | 1021 | 0.52 | 1.91 |
| Lake chub | Couesius plumbeus | 50 | 183 | 2 | 73 | 0.41 | 2.63 |
| Longnose dace | Rhinichthys cataractae | 110 | 168 | 10 | 54 | 0.54 | 2.22 |
| Northern pikeminnow | Ptychocheilus oregonensis | 250 | 642 | 92 | 2988 | 0.67 | 1.48 |
| Peamouth | Mylocheilus caurinus | 102 | 414 | 7 | 778 | 0.68 | 1.47 |
| Redside shiner | Richardsonius balteatus | 90 | 193 | 4 | 70 | 0.54 | 2.01 |
| Utah chub | Gila atraria | 109 | 462 | 14 | 1061 | 0.63 | 1.61 |
| Lotidae | |||||||
| Burbot | Lota lota | 200 | 914 | 36 | 4649 | 0.57 | 1.77 |
| Percidae | |||||||
| Sauger | Sander canadensis | 84 | 676 | 5 | 3400 | 0.64 | 1.62 |
| Walleye | Sander vitreus | 150 | 856 | 18 | 7475 | 0.70 | 1.44 |
| Yellow perch | Perca flavescens | 101 | 569 | 9 | 3470 | 0.59 | 1.68 |
| Polyodontidae | |||||||
| Paddlefish † | Polyodon spathula | ||||||
| Overall | 711 | 1473 | 4990 | 56,246 | 0.68 | 1.46 | |
| Female | 914 | 1473 | 12,247 | 56,246 | 0.72 | 1.37 | |
| Male | 711 | 1143 | 4990 | 25,855 | 0.73 | 1.39 | |
| Salmonidae | |||||||
| Arctic grayling | Thymallus arcticus | 150 | 477 | 23 | 1139 | 0.56 | 1.82 |
| Brook trout | Salvelinus fontinalis | 120 | 562 | 11 | 1846 | 0.59 | 1.69 |
| Brown trout | Salmo trutta | ||||||
| Lentic | 140 | 777 | 27 | 6056 | 0.63 | 1.59 | |
| Lotic | 140 | 820 | 20 | 6000 | 0.68 | 1.46 | |
| Bull trout | Salvelinus confluentus | 120 | 900 | 10 | 7306 | 0.66 | 1.53 |
| Cisco | Coregonus artedi | 102 | 463 | 9 | 918 | 0.63 | 1.57 |
| Golden trout | O. mykiss aguabonita | 124 | 566 | 23 | 1724 | 0.51 | 1.94 |
| Kokanee | Oncorhynchus nerka | 121 | 676 | 14 | 2957 | 0.69 | 1.46 |
| Lake trout | Salvelinus namaycush | 280 | 1110 | 145 | 11,225 | 0.67 | 1.49 |
| Lake whitefish | Coregonus clupeaformis | 100 | 650 | 5 | 3098 | 0.65 | 1.57 |
| Mountain whitefish | Prosopium williamsoni | 140 | 577 | 16 | 2014 | 0.65 | 1.55 |
| Pygmy whitefish | Prosopium coulterii | 90 | 235 | 4 | 116 | 0.70 | 1.41 |
| Rainbow trout | Oncorhynchus mykiss | ||||||
| Lentic | 122 | 808 | 18 | 6144 | 0.63 | 1.60 | |
| Lotic | 120 | 829 | 13 | 7469 | 0.67 | 1.50 | |
| Westslope cutthroat trout | O. clarkii lewisi | ||||||
| Lentic | 130 | 597 | 15 | 2400 | 0.67 | 1.50 | |
| Lotic | 130 | 546 | 14 | 1735 | 0.64 | 1.56 | |
| Yellowstone cutthroat trout | O. clarkii bouvieri | ||||||
| Lentic | 132 | 632 | 14 | 2500 | 0.55 | 1.82 | |
| Lotic | 131 | 608 | 16 | 2415 | 0.67 | 1.48 | |
| Sciaenidae | |||||||
| Freshwater drum | Aplodinotus grunniens | 114 | 680 | 20 | 4800 | 0.67 | 1.53 |
| Intercept (a′) | Minimal Total Length | |||||
|---|---|---|---|---|---|---|
| Species | Scientific Name | Metric | English | Slope (b) | (mm) | n |
| Acipenseridae | ||||||
| Pallid sturgeon | Scaphirhynchus albus | −6.397 (−6.501, −6.292) | −4.377 (−4.428, −4.327) | 3.329 (3.290, 3.367) | 320 | 464 |
| White sturgeon | Acipenser transmontanus | −6.692 (−6.895, −6.487) | −4.497 (−4.604, −4.390) | 3.454 (3.384, 3.522) | 700 * | 328 |
| Catostomidae | ||||||
| Bigmouth buffalo | Ictiobus cyprinellus | −5.130 (−5.229, −5.031) | −3.401 (−3.450, −3.352) | 3.122 (3.086, 3.157) | 150 * | 312 |
| Blue sucker | Cycleptus elongatus | −5.850 (−6.068, −5.631) | −3.903 (−4.014, −3.792) | 3.277 (3.200, 3.353) | 240 * | 807 |
| Largescale sucker | Catostomus macrocheilus | −5.134 (−5.146, −5.122) | −3.509 (−3.514, −3.504) | 3.048 (3.043, 3.053) | 110 | 26,035 |
| Longnose sucker | Catostomus catostomus | −5.012 (−5.020, −5.004) | −3.433 (−3.437, −3.430) | 3.015 (3.012, 3.018) | 90 | 43,717 |
| Mountain sucker | Catostomus platyrhynchus | −4.633 (−4.748, −4.517) | −3.267 (−3.307, −3.226) | 2.864 (2.810, 2.917) | 100 | 2030 |
| River carpsucker | Carpiodes carpio | −5.134 (−5.159, −5.109) | −3.434 (−3.445, −3.422) | 3.102 (3.092, 3.111) | 130 * | 14,017 |
| Shorthead redhorse | Moxostoma macrolepidotum | −4.964 (−4.976, −4.952) | −3.407 (−3.413, −3.402) | 2.999 (2.994, 3.004) | 100 * | 26,877 |
| Smallmouth buffalo | Ictiobus bubalus | −4.621 (−4.675, −4.567) | −3.157 (−3.184, −3.130) | 2.933 (2.914, 2.953) | 200 * | 2945 |
| White sucker | Catostomus commersonii | −5.243 (−5.248, −5.237) | −3.512 (−3.514, −3.510) | 3.123 (3.121, 3.125) | 100 * | 134,086 |
| Centrarchidae | ||||||
| Black crappie | Pomoxis nigromaculatus | −5.150 (−5.173, −5.128) | −3.387 (−3.396, −3.378) | 3.147 (3.137, 3.157) | 100 * | 16,650 |
| Bluegill | Lepomis macrochirus | −5.435 (−5.502, −5.368) | −3.388 (−3.410, −3.365) | 3.349 (3.317, 3.380) | 80 * | 4770 |
| Green sunfish | Lepomis cyanellus | −4.702 (−4.820, −4.584) | −3.155 (−3.194, −3.117) | 2.993 (2.936, 3.049) | 60 * | 1613 |
| Largemouth bass | Micropterus salmoides | −5.178 (−5.217, −5.140) | −3.407 (−3.423, −3.391) | 3.152 (3.136, 3.168) | 150 * | 4448 |
| Pumpkinseed | Lepomis gibbosus | −4.998 (−5.050, −4.946) | −3.220 (−3.237, −3.203) | 3.157 (3.132, 3.182) | 50 * | 5164 |
| Smallmouth bass | Micropterus dolomieu | −5.302 (−5.321, −5.282) | −3.474 (−3.482, −3.466) | 3.192 (3.184, 3.200) | 150 * | 19,325 |
| Cottidae | ||||||
| Columbia slimy sculpin | Uranidea sp. cf. cognata ‡ | −5.488 (−6.065, −4.907) | −3.529 (−3.701, −3.356) | 3.286 (2.994, 3.574) | 90 | 260 |
| Rocky mountain sculpin | Uranidea sp. cf. bairdii ‡ | −5.012 (−5.020, −5.004) | −3.433 (−3.437, −3.430) | 3.015 (3.012, 3.018) | 80 | 43,717 |
| Cyprinidae | ||||||
| Common carp | Cyprinus carpio | −4.787 (−4.800, −4.773) | −3.280 (−3.287, −3.273) | 2.964 (2.959, 2.969) | 200 * | 33,650 |
| Esocidae | ||||||
| Northern pike | Esox lucius | −5.618 (−5.636, −5.600) | −3.839 (−3.848, −3.830) | 3.158 (3.151, 3.164) | 100 * | 17,788 |
| Tiger muskellunge | Esox masquinongy x lucius | −6.009 (−6.107, −5.911) | −4.041 (−4.090, −3.993) | 3.292 (3.257, 3.327) | 240 * | 365 |
| Hiodontidae | ||||||
| Goldeye | Hiodon alosoides | −4.834 (−4.857, −4.810) | −3.399 (−3.409, −3.388) | 2.913 (2.903, 2.922) | 100 | 26,257 |
| Ictaluridae | ||||||
| Black bullhead | Ameiurus melas | −5.174 (−5.233, −5.115) | −3.401 (−3.424, −3.378) | 3.154 (3.128, 3.179) | 130 * | 3157 |
| Stonecat | Noturus flavus | −5.038 (−5.126, −4.948) | −3.467 (−3.501, −3.433) | 3.009 (2.970, 3.049) | 90 | 2609 |
| Yellow bullhead | Ameiurus natalis | −5.442 (−5.531, −5.353) | −3.528 (−3.564, −3.491) | 3.254 (3.217, 3.291) | 60 * | 1462 |
| Leuciscidae | ||||||
| Flathead chub | Platygobio gracilis | −4.453 (−4.561, −4.345) | −3.257 (−3.294, −3.219) | 2.743 (2.693, 2.793) | 100 | 3146 |
| Golden shiner | Notemigonus crysoleucas | −4.261 (−4.398, −4.123) | −3.117 (−3.166, −3.067) | 2.706 (2.642, 2.768) | 50 * | 454 |
| Lake chub | Couesius plumbeus | −4.760 (−5.002, 4.517) | −3.331 (−3.402, −3.260) | 2.908 (2.785, 3.031) | 50 | 275 |
| Longnose dace | Rhinichthys cataractae | −4.703 (−5.207, 4.197) | −3.338 (−3.506, −3.169) | 2.863 (2.623, 3.102) | 110 | 303 |
| Northern pikeminnow | Ptychocheilus oregonensis | −5.630 (−5.655, 5.604) | −3.753 (−3.765, −3.742) | 3.227 (3.217, 3.237) | 250 * | 10,663 |
| Peamouth | Mylocheilus caurinus | −5.552 (−5.569, 5.536) | −3.718 (−3.725, −3.711) | 3.197 (3.190, 3.204) | 100 | 45,476 |
| Redside shiner | Richardsonius balteatus | −5.864 (−5.997, 5.730) | −3.723 (−3.768, −3.677) | 3.416 (3.353, 3.478) | 90 | 1463 |
| Utah chub | Gila atraria | −5.155 (−5.176, 5.133) | −3.444 (−3.453, −3.436) | 3.109 (3.100, 3.118) | 90 * | 15,394 |
| Lotidae | ||||||
| Burbot | Lota lota | −4.944 (−4.968, 4.920) | −3.540 (−3.551, −3.528) | 2.891 (2.882, 2.900) | 200 * | 14,913 |
| Percidae | ||||||
| Sauger | Sander canadensis | −5.606 (−5.628, 5.583) | −3.774 (−3.785, −3.764) | 3.195 (3.186, 3.204) | 70 * | 15,293 |
| Walleye | Sander vitreus | −5.688 (−5.695, 5.681) | −3.780 (−3.784, −3.777) | 3.249 (3.247, 3.252) | 150 * | 73,814 |
| Yellow perch | Perca flavescens | −5.507 (−5.518, 5.496) | −3.573 (−3.578, −3.569) | 3.268 (3.263, 3.273) | 100 * | 94,512 |
| Polyodontidae | ||||||
| Paddlefish † | Polyodon spathula | |||||
| Overall | −7.010 (−7.090, 6.929) | −4.424 (−4.467, −4.381) | 3.732 (3.705, 3.758) | 280 * | 7200 | |
| Female | −5.274 (−5.481, 5.066) | −3.480 (−3.592, −3.367) | 3.169 (3.101, 3.236) | 280 * | 3785 | |
| Male | −4.530 (−4.692, 4.366) | −3.119 (−3.205, −3.032) | 2.896 (2.841, 2.950) | 280 * | 3,379 | |
| Salmonidae | ||||||
| Arctic grayling | Thymallus arcticus | −5.696 (−5.721, 5.671) | −3.781 (−3.792, −3.770) | 3.254 (3.244, 3.265) | 150 * | 14,668 |
| Brook trout | Salvelinus fontinalis | −5.248 (−5.256, 5.240) | −3.527 (−3.530, −3.524) | 3.117 (3.113, 3.120) | 120 * | 84,064 |
| Brown trout | Salmo trutta | |||||
| Lentic | −5.133 (−5.161, 5.105) | −3.510 (−3.523, −3.498) | 3.046 (3.035, 3.057) | 140 * | 6381 | |
| Lotic | −4.783 (−4.786, 4.781) | −3.353 (−3.354, −3.352) | 2.910 (2.909, 2.911) | 140 * | 841,787 | |
| Bull trout | Salvelinus confluentus | −5.125 (−5.133, 5.117) | −3.525 (−3.528, −3.522) | 3.030 (3.027, 3.034) | 120 * | 26,930 |
| Cisco | Coregonus artedi | −5.513 (−5.529, −5.498) | −3.677 (−3.684, −3.671) | 3.198 (3.192, 3.205) | 100 * | 31,244 |
| Golden trout | O. mykiss aguabonita | −4.713 (−4.834, −4.591) | −3.326 (−3.377, −3.274) | 2.879 (2.829, 2.928) | 120 * | 972 |
| Kokanee | Oncorhynchus nerka | −5.206 (−5.217, −5.195) | −3.549 (−3.554, −3.544) | 3.071 (3.067, 3.075) | 120 * | 56,706 |
| Lake trout | Salvelinus namaycush | −5.301 (−5.326, −5.276) | −3.635 (−3.647, −3.622) | 3.078 (3.068, 3.087) | 280 * | 9714 |
| Lake whitefish | Coregonus clupeaformis | −5.834 (−5.847, −5.820) | −3.858 (−3.864, −3.853) | 3.297 (3.292, 3.302) | 100 * | 17,893 |
| Mountain whitefish | Prosopium williamsoni | −5.226 (−5.234, −5.219) | −3.559 (−3.562, −3.556) | 3.079 (3.076, 3.081) | 140 * | 170,721 |
| Pygmy whitefish | Prosopium coulterii | −6.044 (−6.098, −5.990) | −3.916 (−3.934, −3.898) | 3.406 (3.380, 3.432) | 90 | 2965 |
| Rainbow trout | Oncorhynchus mykiss | |||||
| Lentic | −4.906 (−4.926, −4.886) | −3.398 (−3.407, −3.389) | 2.965 (2.957, 2.973) | 120 * | 18,967 | |
| Lotic | −4.841 (−4.844, −4.839) | −3.370 (−3.371, −3.369) | 2.939 (2.938, 2.940) | 120 * | 780,901 | |
| Westslope cutthroat trout | O. clarkii lewisi | |||||
| Lentic | −5.322 (−5.344, −5.301) | −3.578 (−3.587, −3.569) | 3.133 (3.124, 3.142) | 130 * | 12,006 | |
| Lotic | −5.086 (−5.092, −5.080) | −3.480 (−3.483, −3.478) | 3.034 (3.032, 3.037) | 130 * | 94,520 | |
| Yellowstone cutthroat trout | O. clarkii bouvieri | |||||
| Lentic | −5.260 (−5.292, −5.227) | −3.577 (−3.591, −3.562) | 3.089 (3.076, 3.102) | 130 * | 11,308 | |
| Lotic | −4.958 (−4.967, −4.949) | −3.421 (−3.425, −3.417) | 2.985 (2.981, 2.989) | 130 * | 44,958 | |
| Sciaenidae | ||||||
| Freshwater drum | Aplodinotus grunniens | −5.161 (−5.193, −5.130) | −3.454 (−3.468, −3.439) | 3.107 (3.094, 3.119) | 100 * | 6155 |
Disclaimer/Publisher’s Note: The statements, opinions and data contained in all publications are solely those of the individual author(s) and contributor(s) and not of MDPI and/or the editor(s). MDPI and/or the editor(s) disclaim responsibility for any injury to people or property resulting from any ideas, methods, instructions or products referred to in the content. |
© 2022 by the authors. Licensee MDPI, Basel, Switzerland. This article is an open access article distributed under the terms and conditions of the Creative Commons Attribution (CC BY) license (https://creativecommons.org/licenses/by/4.0/).
Share and Cite
Eckelbecker, R.W.; Heili, N.M.; Guy, C.S.; Schmetterling, D.A. Relative Condition Parameters for Fishes of Montana, USA. Fishes 2023, 8, 28. https://doi.org/10.3390/fishes8010028
Eckelbecker RW, Heili NM, Guy CS, Schmetterling DA. Relative Condition Parameters for Fishes of Montana, USA. Fishes. 2023; 8(1):28. https://doi.org/10.3390/fishes8010028
Chicago/Turabian StyleEckelbecker, Robert W., Nathaniel M. Heili, Christopher S. Guy, and David A. Schmetterling. 2023. "Relative Condition Parameters for Fishes of Montana, USA" Fishes 8, no. 1: 28. https://doi.org/10.3390/fishes8010028
APA StyleEckelbecker, R. W., Heili, N. M., Guy, C. S., & Schmetterling, D. A. (2023). Relative Condition Parameters for Fishes of Montana, USA. Fishes, 8(1), 28. https://doi.org/10.3390/fishes8010028