Abstract
Tannic acid (TA) has great potential as a new feed additive. In this study, we investigated the effects of dietary TA on growth, digestion, nonspecific immunity, and resistance to ammonia stress and intestinal microbiota in Litopenaeus vannamei. The shrimp were fed diets containing different levels of TA: 0 mg/kg (TA-0), 200 mg/kg (TA-200), 400 mg/kg (TA-400), and 800 mg/kg (TA-800) for 56 days, followed by acute ammonia stress for 48 h. The results showed that dietary TA increased the survival rate of the TA-800 group. Dietary TA could improve the morphology of the hepatopancreas and intestinal tissues. After feeding different levels of TA for 56 days, the activities of amylase (AMS) and trypsin (Tryp) were increased, but the activity of lipase (LPS) was decreased. The activities of T-AOC, SOD, and PPO were higher in the hepatopancreas of the three TA treatment groups (p < 0.05). When shrimp were exposed to ammonia stress for 48 h, the activity of immune enzymes (LZM, T-AOC and SOD) and the expression levels of immune genes (LZM, proPO and Cu/Zn-SOD) were higher in the three TA treatment groups (p < 0.05). Furthermore, dietary TA also changed the composition of intestinal microflora by increasing the abundance of Planctomycetes, but decreasing the abundance of Bacteroides and Proteobacteria. The abundance of Rhodopirellula, Ruegeria, and Rhodobacter were higher, but that of Paracoccus, Algoriphagus, Cellvibrio, Flavobacteriaceae, and Bacteroides were lower in response to dietary TA. These results revealed that dietary TA had a positive effect on growth and intestinal microbial composition and enhanced the immune response to ammonia stress in shrimp. Therefore, TA can be a potential natural alternative antibiotic substitute for feed additives in shrimp, and the appropriate supplemental dosage is 400–800 mg/kg in the diet.
1. Introduction
The Pacific white shrimp Litopenaeus vannamei is one of the most economically important shrimp species, the production of which was 5.81 million tons in 2020, contributing to 51.7% of all mariculture shrimp in the world [1]. In order to produce large quantities in a short time, intensive aquaculture techniques and substances that stimulate growth are required [2]. However, dense growing environment is characterized by high density of individuals, which can easily lead to disease outbreaks, which can be stressful for organisms [3]. Shrimps spend all their growth stages in an aquatic environment and are inevitably affected by environmental changes [4]. Ammonia is an important environmental factor affecting the health of aquatic species, and its elevated concentration is due to the accumulation of organic sundries such as feces and unused feed in cultured water. Ammonia induces an anti-stress response in shrimp, thus alleviating oxidative stress, immune disorders, and susceptible disease, which leads to high mortality [5,6]. Therefore, the development of ecofriendly disease preventative approaches is important for health management in shrimp aquaculture.
Under the background of “antibiotic prohibition” in feed, research on antibiotic substitutes has become one of the research hotspots in animal nutrition. Natural plant extracts have been widely studied as new feed additives for their positive effects on growth promotion and antioxidant and immune regulation of aquatic animals. Tannic acid (TA) is a polyphenolic compound that is ubiquitous in nature. Tannins represent a highly heterogeneous group of water-soluble polyphenolic compounds, divided into condensed tannins, which are C–C bound oligomers of catechin or leucoanthocyanidin, and hydrolyzable tannins, esters of monosaccharides with gallic acid or oligomers of gallic acid [7,8]. It has been reported that low-dose TA has beneficial effects on animal growth performance, immunity, intestinal health, and antioxidative stress ability [8,9]. Previous studies have indicated that the increased bacterial diversity in the intestines of organisms may play an important role in promoting nutrient digestion and absorption after a period of feeding condensed tannin-containing fish diets [10]. Similarly, sorghum TA up to 5.7 g/kg in diets has no adverse effects on Nile tilapia (Oreochromis niloticus) [11]. For example, TA in chestnut shells can improve the intestinal health of fish [12,13]. Zhu et al. found supplementation of a shrimp diet with 0.15% hydrolysable tannins to promote growth performance and digestive activity, improve antioxidant capacity, and optimally adjust intestinal bacterial structure [14]. Findings in livestock suggest that low concentrations of TA can improve the health status, nutrient digestion, and growth performance of chickens and pigs [15,16]. Therefore, TA has great potential as an alternative to feed nutrition addition.
The intestine is an important organ for digestion and absorption in aquatic animals, as well as an important barrier against infectious agents and toxins. The cultivation of a healthy digestive tract has a vital impact on the health and growth of aquatic animals [17]. In addition, intestinal microecology contains not only intestinal microbiota, but also a large number of intestinal microbiota metabolites [18]. Together, they affect host immune function and are important for the maintenance of intestinal homeostasis [19]. A multitude of agents can induce intestinal oxidative stress [20], barrier dysfunction [21], and morphological impairment [22,23], resulting in decreased absorptive function of nutrients and an increase in the incidence of disease [24]. Moreover, inflammation in the intestines of organisms further causes the proliferation of some potentially pathogenic bacteria, which may damage the barrier tissue and trigger intestinal inflammation [25,26,27]. Some studies have highlighted that chestnut shells rich in tannins may act as a prebiotic on fish intestinal microbiota, and chestnut shells can optimize intestinal microbiota health by regulating intestinal microbiota and immune levels to combat intestinal inflammation [10,12,28]. Tannins can regulate the abundance of beneficial or harmful bacteria in the intestine, thus altering the intestinal environment and its bacterial composition [13,29].
Therefore, the present study aimed to investigate the effects of dietary TA extracted from gallnut on (1) growth and feed utilization; (2) hepatopancreas and intestinal tissue structure; (3) intestinal digestive capacity and microbial community; and (4) hepatopancreas immune response of L. vannamei cultured under normal conditions and exposed to ammonia stress. These results will be essential for a better understanding of the roles of TA in the health regulation of L. vannamei.
2. Materials and Methods
2.1. Diet Preparation
Experimental diets were formulated according to the guidelines and nutritional requirements of the shrimp following NRC (2011). The basal diet (Hengxing Group Co., Ltd., Jiaxing, China) was used as the control diet. The TA used in this study belonged to the hydrolyzable tannins, which was extracted from gallnut and provided by Qingdao RBT Biotechnology Co., Ltd. (Qingdao, China). The gallnut was broken, screened, and then immersed in water. The impregnated water was clarified, pre-heated, and then spray-dried, and the resulting dry powder was sieved in order to obtain the final product. Four kinds of experimental diets with different TA content were prepared: 0 mg/kg (TA-0), 200 mg/kg (TA-200), 400 mg/kg (TA-400), and 800 mg/kg (TA-800). TA was completely dissolved in water prior to being added to the diets. All ingredients were smashed to pass through a 320 μm sieve, mixed thoroughly, and then extruded into 2 mm pellets, dried at 55 °C for 12 h, and stored at −20 °C until use. The formulation and proximate composition of the experimental feed are shown in Table 1.

Table 1.
The composition of the experimental diets.
2.2. Shrimp, Culture Conditions and Feeding Trial
Healthy L. vannamei with an average body weight of 0.3 ± 0.03 g were randomly selected from a local farming pond at Haifeng Aquaculture Co., Ltd. (Changyi, China). The shrimp were acclimatized for 7 days before the start of the feeding experiment and fed with control feed (Hengxing Group Co., Ltd., Jiaxing, China). The water quality parameters were dissolved oxygen (DO) > 6 mg/L; salinity 32 ± 0.5; temperature 28 ± 0.5 °C and pH 7.8–8.2.
After acclimation, only shrimp in the molting stage were used for the experiments. A total of 6000 healthy shrimp were randomly distributed into four groups: TA-0, TA-200, TA-400, and TA-800. Each group had three replicate 5000 L plastic tanks, and each tank housed 500 shrimp. Each group was fed their corresponding experimental feed, and all experimental shrimp were fed to apparent satiation three times per day at 6:00, 12:00, and 18:00. The feeding trial lasted for 56 days, and the feeding quantity was adjusted according to the growth of the shrimp. About 30% of the water in each water tank was replaced every day, and the shrimp feces and uneaten feed were cleaned out each time. During the breeding period, the light–dark cycle was maintained in the natural environment.
At the end of the 56-day feeding trial, the hepatopancreas of the six shrimps from each tank was randomly sampled for biochemical and gene expression analyses, and the corresponding intestines were sampled for digestive enzyme activity and microbial community analysis. All experimental samples were frozen and stored in liquid nitrogen for further analysis.
2.3. Ammonia Stress Experiment
After the feeding trial, 50 shrimp were randomly selected from each tank for ammonia stress experiment. Based on the 48 h 50% lethal concentration (LC50) in L. vannamei under ammonia stress [30], the ammonia concentration in this study was set as 30.0 mg/L. The ammonia concentration of each tank was maintained at 30.0 mg/L by adding NH4Cl solution to the fresh seawater, which was adjusted in time to ensure its stability. The concentration of ammonia in water was detected by indophenol blue spectrophotometry (GB 17378.4-2007). The ammonia stress lasted for 48 h, and the mortality of the shrimp in each group was recorded every 8 h. After ammonia stress for 48 h, the hepatopancreas of the six shrimp from each tank was randomly sampled for biochemical and gene expression analyses. All samples were frozen and stored in liquid nitrogen until analysis.
2.4. Growth Performance Analysis
At the end of the 56-day feeding trial, all shrimp were starved for 24 h and then counted and weighed in order to determine their growth performance. The average value of each 50 shrimp was considered as a valid value for each replicate (n = 3). The growth performance and feed utilization of the shrimp for all the groups were calculated using the following equations:
- WGR = [(Final body weight − Initial body weight)/ (Initial body weight)] × 100.
- SR (%) = (Shrimp number final/Shrimp number initial) × 100.
- FCR = Feed consumed (dried)/WG.
- WGR = weight gain rate, SR = survival rate, and FCR = feed conversion ratio.
2.5. Histological Analysis
The hepatopancreas and intestines of three shrimp from each treatment group were randomly sampled after a feeding trial at 56 d and ammonia stress at 48 h, respectively. They were kept in 10% formalin for 24 h, and then dehydrated in a series of alcohol solutions (75–95%). After the samples were washed in toluene, they were embedded in paraffin to produce a dense wax block. Segments (4 µm) were cut with a rotary microtome and stained with hematoxylin and eosin (H&E). The tissue samples were further observed with a Nikon Eclipse E100 microscope (Tokyo, Japan) and analyzed with Image-Pro Plus 6.3 software (Media Cybernetics, Inc., Rockville, MD, USA) following the method of previous research [31].
2.6. Biochemical Analysis
Hepatopancreas and intestinal samples of the collected shrimp were homogenized and centrifuged to collect the supernatant for biochemical analysis. The hepatopancreas samples were used for the determination of superoxide dismutase (SOD), total antioxidant capacity (T-AOC), polyphenol oxidase (PPO), and lysozyme (LZM) activity. The intestinal samples were used to detect amylase (AMS), trypsin (Tryp), and lipase (LPS) activity. They were determined by the related commercial test kits (Jiancheng, Ltd., Nanjing, China).
2.7. Gene Expression Analysis
Total RNA from the hepatopancreas of six shrimp from each tank was extracted using TRIzol Reagent (Invitrogen, Waltham, MA, USA). The total RNA (1 μg) was reverse transcribed to cDNA using a PrimeScript™ RT Reagent Kit (Takara, Shiga, Japan), and the cDNA was diluted to 20 ng/μL with diethylpyrocarbonate (DEPC) solution and then stored at −20 °C for further analysis. The β-actin gene of L. vannamei was chosen as an internal control. The primer sequences for β-actin, Cu/Zn superoxide dismutase (Cu/Zn-SOD), lysozyme (LZM), and prophenoloxidase (proPO) were obtained from previous studies [32], and are shown in Table S1. Real-time RT-qPCR was conducted in an ABI PRISM 7500 Sequence Detection System (Applied Biosystems, Thermo Fisher Scientific, Waltham, MA, USA) using a SYBR® Premix Ex TaqTM II Kit (TaKaRa, Japan). The reactions were carried out in a total volume of 20 μL. The PCR program was 95 °C for 30 s, then 40 cycles of 95 °C for 5 s and 60 °C for 30 s, followed by 1 cycle of 95 °C for 5 s, 60 °C for 1 min and 95 °C for 15 s. DEPC-treated water for the replacement of template was used as the negative control. The relative gene expression level was shown as the fold change in expression relative to the TA-0 group, calculated by the 2−ΔΔCT comparative CT method.
2.8. Intestinal Microbiota Analysis
Total genomic DNA of intestinal microbes of six shrimp from each tank was extracted using the CTAB/SDS method, and then primers were used to amplify the V4 region of the bacterial 16S rDNA gene (Table S1). PCR was carried out using Phusion® High-Fidelity PCR Master Mix (New England Biolabs, Ipswich, MA, USA). The PCR products were mixed in equidensity ratios and purified. Then, the sequencing libraries were constructed using the NEBNext® Ultra™ DNA Library Prep Kit for Illumina (NEB, Ipswich, MA, USA) and sequenced on an Illumina MiSeq platform.
Sequence analysis was performed by UPARSE software, and the operational taxonomic units (OTUs) were defined with ≥97% similarity [33]. Chimeric sequences were determined by UCHIME [34]. Alpha diversity was calculated using three metrics, including the Chao1, Simpson, and Shannon indices, using Mothur software (version v.1.30.1) [35]. A Venn diagram was used to count the number of unique and shared OTUs in multiple samples. Beta diversity was evaluated by principal coordinates analysis (PCoA) plots based on weighted and unweighted UniFrac metrics, using the package Ape. Microbial composition was analyzed at the phylum, class, and genus levels. Linear discriminant analysis (LDA) and effect size (LEfSe) analysis was performed using the Python LEfSe package to identify differential bacterial taxa within different groups [36]. Random forest analyses were performed based on the Kyoto Encyclopedia of Genes and Genomes (KEGG) level 3 using the R random forest package. A Cytoscape network was constructed to analyze the correlations and differences between microbial communities based on OTU abundance using Cytoscape software.
2.9. Statistical Analysis
All the data were presented as the mean values ± standard deviation (SD). The one-way analysis of variance (ANOVA; SPSS v22.0) was used to determine the significance of differences between the control and treatment groups, if the values were distributed normally and the variances were homogeneous. If there was only an overall difference, multiple comparisons were made by the Duncan test. A value of p < 0.05 was regarded as statistically significant. Percentage data of the weight gain and survival were transformed before the ANOVA.
3. Results
3.1. Growth Performance and Survival of the Shrimp
The shrimp fed the TA diet had a lower FCR and higher weight gain than those fed the TA-0 diet (Table 2). The TA-400 group had the highest growth performance and feed utilization. After a 56-day feeding trial, the survival rate of the shrimp in the three TA groups was significantly higher than that in the TA-0 group (p < 0.05), and the TN-800 group’s survival rate was significantly higher than that of the TN-200 group (p < 0.05) (Figure 1A). Additionally, after ammonia stress for 48 h, the survival rate of the TA-0 group was approximately 15.67%, and that of the TA-800 group was approximately 30.67%. The TA-800 group’s survival rate was significantly higher than that of the TA-0 group (p < 0.05) (Figure 1B).
Table 2.
Growth performance and feed utilization of L. vannamei that were fed the control and TA diets for 56 days.

Figure 1.
Effects of dietary TA on the survival of L. vannamei at the feeding trial 56 days and ammonia stress for 48 h. (A) The survival of shrimp fed the four experimental diets 56 days; (B) the survival of shrimp after ammonia stress for 48 h. Vertical bars represented the mean values ± SD (n = 3). Data marked with different letters were significantly different (p < 0.05) among groups.
3.2. Histological Structure of the Hepatopancreas and Intestines
After the shrimp were fed TA-supplemented diets for 56 days, the hepatopancreas of four group individuals presented a normal functional structure, with the differentiation of the storage cells (R-cell), secretory cells (B-cell). The control group showed a gap between the bile canaliculus, cell lysis, and cell necrosis with dissolution of some areas of the basement membrane. However, in the TA-800 treatment group, the structure of hepatopancreatic tubules was relatively normal, the structure of hepatocytes was clear, and a few vacuoles appeared in hepatopancreatic tubules. After ammonia stress, compared with the TA-800 group, the hepatopancreas in the TA-0, TA-200, and TA-400 groups exhibited obvious histological damage under ammonia stress for 48 h. The nucleus fell off, and the gap between hepatic tubules was obvious. There was obvious cell lysis and cell necrosis, and the cell morphology was damaged. However, the damage gradually weakened with increasing TA concentration (Figure 2).
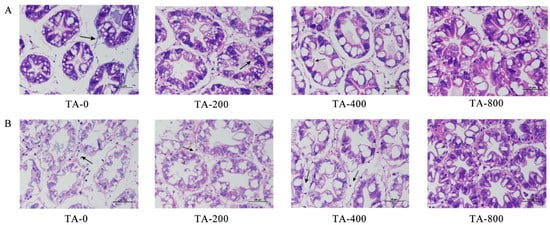
Figure 2.
Hepatopancreas histology of L. vannamei in the feeding trial after 56 days and ammonia stress after 48 h. (A) The feeding trial lasted 56 days; (B) ammonia stress lasted for 48 h. Whole segments were marked with H&E. Scale bar: 50 µm. The arrows in the figure indicate the differences between the treatment groups.
After the shrimp were fed TA-supplemented diets for 56 days, TA could make the intestinal epithelial cells tightly connected, and the microvilli on the free surface of the cells were arranged neatly and densely. TA could promote the benign growth of intestinal tissue. After ammonia stress for 48 h, varying degrees of damage were observed inside the hepatopancreatic tissue of the TA-0, TA-200, and TA-400 groups. The intestinal epithelial cells of the TA-0 group fell off, and the intestinal wall was damaged. However, the intestinal epithelial cells were relatively intact in the TA-800 group. TA could effectively prevent the intestinal tract from being damaged by ammonia stress (Figure 3).
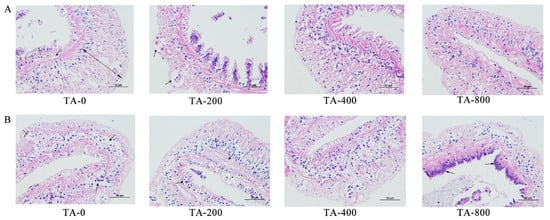
Figure 3.
Intestine histology of L. vannamei at the feeding trial after 56 days and ammonia stress after 48 h. (A) The feeding trial lasted 56 days; (B) ammonia stress lasted for 48 h. Whole segments were marked with H&E. Scale bar: 50 µm. The arrows in the figure indicate the differences between the treatment groups.
3.3. Intestinal Digestive Enzyme Activity
After shrimp were fed TA-supplemented diets for 56 days, compared with the TA-0 group, the AMS and TryP activities were highest in the TA-800 group (p < 0.05). The TryP activity increased with the addition of TA to the diet. The LPS activity was lower in the TA-400 and TA-800 groups (p < 0.05), and higher in the TA-200 group (Figure 4).
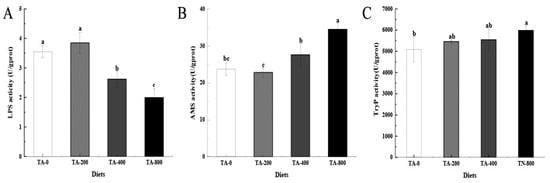
Figure 4.
Effects of dietary TA on digestive enzyme activities in the intestines of L. vannamei. (A) LPS activity; (B) AMS activity; (C) Tryp activity. Vertical bars represented the mean values ± SD (n = 3). Data marked with different letters were significantly different (p < 0.05) among groups.
3.4. Hepatopancreas Immune Enzyme Activity
After shrimp were fed TA-supplemented diets for 56 days, compared with the TA-0 group, the activities of T-AOC and PPO were higher in the three TA treatment groups (p < 0.05). LZM activity was higher in the TA-800 group (p < 0.05) but lower in the TA-200 and TA-400 groups (p < 0.05). SOD activity was higher in the three TA treatment groups, while there was no significant difference with the TA-0 group (Figure 5).
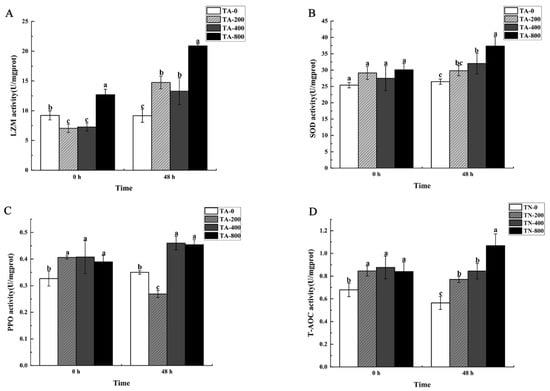
Figure 5.
Immune enzymes activity in the hepatopancreas of L. vannamei that were fed the control and TA diets for 56 days (0 h) before being exposed to ammonia stress for 48 h. (A) LZM activity; (B) SOD activity; (C) PPO activity; (D) T-AOC activity. Vertical bars represented the mean values ± SD (n = 3). Data marked with different letters were significantly different (p < 0.05) among groups.
When the shrimp were exposed to ammonia stress for 48 h, PPO activity was higher in the TA-400 and TA-800 groups compared with the TA-0 group (p < 0.05), but lower in the TA-200 group (p < 0.05). LZM and T-AOC activities were higher in the three TA treatment groups (p < 0.05). SOD activity was significantly higher in the TA-400 and TA-800 groups (p < 0.05) (Figure 5).
3.5. Hepatopancreas Immune Gene Expression Levels
After shrimp were fed TA-supplemented diets for 56 days, compared with the TA-0 group, the relative expression of the LZM and Cu/Zn-SOD genes all increased in the TA groups after shrimp were fed TA-supplemented diets for 56 days (p < 0.05, Figure 6). The relative expression of proPO was higher in the TA-400 and TA-800 groups (Figure 6).
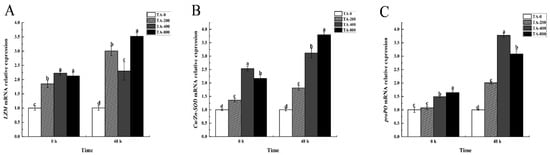
Figure 6.
Immune gene expression levels in the hepatopancreas of L. vannamei that were fed the control and TA diets for 56 days (0 h) before being exposed to ammonia stress for 48 h. (A) LZM mRNA expression; (B) Cu/Zn-SOD mRNA expression; (C) proPO mRNA expression. Vertical bars represent the mean values ± SD (n = 3). Data marked with different letters were significantly different (p < 0.05) among groups.
When the shrimp were exposed to ammonia stress for 48 h, the variation in the relative expression of the LZM, Cu/Zn-SOD, and proPO genes was obvious compared with that in the TA-0 group, and they were all higher than that in the TA-0 group (p < 0.05). The relative expression of the Cu/Zn-SOD gene increased with the addition of TA (p < 0.05) (Figure 6).
3.6. Intestinal Microbial Richness and Diversity
A total of 249,037 high-quality clean reads were obtained from all intestinal microbial samples, and the average number of clean reads per sample was 62,259. Rarefaction curves of the observed species per sample were sufficient (Figure S1). The alpha richness and diversity of the intestinal microbiota were assessed using the Chao1, Shannon, and Simpson indices (Table 3). Compared with the TA-0 group, the Simpson index was lower in the TA-400 group (p < 0.05), while there was no significant change in the TA-200 and TA-800 groups. The Shannon index in the TA-800 groups was higher than that in the TA-0 and TA-200 groups (p < 0.05). The Chao1 index was higher in the three TA treatment groups, and the highest value was in the TA-800 group (p < 0.05). A total of 488 OTUs coexisted in the four groups; the number of unique OTUs was lower in the three TA treatment groups, and the lowest number was in the TA-800 group (Figure 7A). According to PCoA, based on weighted and unweighted UniFrac distances, the intestinal microbial samples of the TA-400 and TA-800 groups were clearly separated from the TA-0 group, while those of the TA-200 group could not be distinguished from the TA-0 group (Figure 7B,C).
Table 3.
Alpha diversity of intestinal microbial of L. vannamei that were fed the control and TA diets for 56 days.
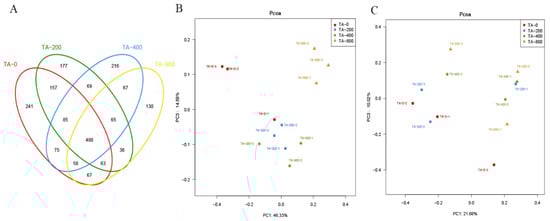
Figure 7.
Intestinal microbial diversity and composition of L. vannamei that were fed the control and TA diets for 56 days. (A) The number of unique and shared OTUs between different treatments indicated by the Venn diagram. (B) PCoA plots based on weighted Unifrac metrics. (C) PCoA plots based on unweighted UniFrac metrics.
3.7. Intestinal Bacterial Composition
The dominant flora species of the four treatment groups were basically the same, but the abundance changed. At the phylum level, the dominant bacteria were Proteobacteria, Bacteroidetes, Planctomycetes, and Actinobacteria. Compared with the TA-0 group, the relative abundances of Proteobacteria and Bacteroidetes were lower in the three TA treatment groups, while the relative abundance of Planctomycetes was higher. The relative abundance of Actinobacteria was lower in the TA-200 group but higher in the TA-400 and TA-800 groups (Figure 8A).
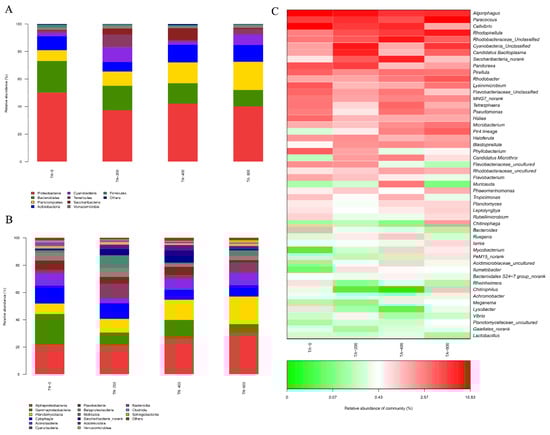
Figure 8.
Average relative abundances of dominant bacterial in the intestines of shrimp under different treatments. (A) Phyla level, (B) classes level, and (C) genera level.
At the class level, the relative abundance of Cytophagia, Gammaproteobacteria, Flavobacteria, and Betaproteobacteria decreased, but the abundance of Alphaproteobacteria, Planctomycetacia, and Mollicutes increased with the addition of TA to the diet (Figure 8B). Differences in microbiota abundance were also observed at the genus level. Certain genera, such as Rhodopirellula, Ruegeria, and Rhodobacter, were higher in the three TA experimental groups, but Paracoccus, Algoriphagus, Cellvibrio, Flavobacteriaceae, and Bacteroides were lower. In addition, Vibrio was lower in the TA-400 and TA-800 groups (Figure 8C).
3.8. Differential Analysis of Intestinal Bacterial Community
The specific bacterial taxa were identified from the four groups based on LEfSe analysis. According to the LEfSe cladogram, nine families were enriched in the TA-0 group, including Cryptosporangiaceae, Demequinaceae, Rikenellaceae, Flavobacteriaceae, Comamonadaceae, Aeromonadaceae, Cellvibrionaceae, Chromatiaceae, and Xanthomonadaceae; three families were enriched in the TA-200 group, including Burkholderiaceae, Legionellaceae, and T9d; seven families were enriched in the TA-400 group, including Intrasporangiaceae, Desulfomicrobiaceae, Mycobacteriaceae, Gemmatimonadaceae, Marinilabiaceae, Elev_16S_1332, and Caldilineaceae; and four families were enriched in the TA-800 group, including Rhodobacteraceae, Microbacteriaceae, Neisseriaceae, and TM146 (Figure 9A). Among the bacteria with an LDA score >4.0 were, Gammaproteobacteria, Cellvibrionales (from order to genus), Flavobacteriia (from class to family), Demequinaceae, and Lysinimicrobium were in the TN-0 group; Cyanobacteria (from phylum to family), Burkholderiaceae (from family to class), Pandoraea, Collinsella, and Oceanirhabdus were in the TN-200 group; Saccharibacteria, Actinobacteria, Muricauda, Tetrasphaera, and Intrasporangiaceae were in the TN-400 group; and Rhodobacteraceae (from order to family), Alphaproteobacteria, Pir4_lineage, and Rhodobacter were in the TN-800 group (Figure 9B).
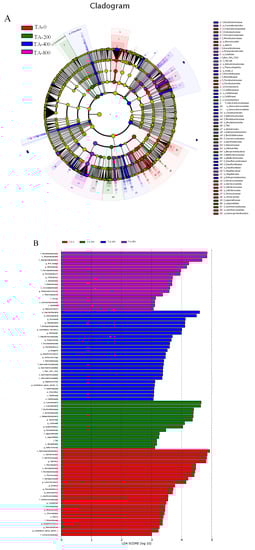
Figure 9.
Intergroup variation analyses of the intestinal microbes of L. vannamei in different treatments. (A) LEfSe cladogram. (B) LDA score of LEfSe-PICRUSt.
3.9. Network and Functional Analyses of Intestinal Bacterial Community
Network analyses further confirmed the correlation and differences of the microbiota. Based on the correlation network analysis of the bacterial phylum, the top abundance OTU2 and OTU3 belonged to Proteobacteria, and the OTUs of Bacteroidetes had the highest correlation with those of Actinobacteria (Figure 10A). In the network branching diagrams of the microbes among different groups, the genera Cellvibrio, Lysinimicrobium, Rubellimicrobium, and Flavobacterium were dominant in the TA-0 group; the class Cyanobacteria and genus Pandoraea were dominant in the TA-200 group; the genera Muricauda, Candidatus Microthrix, Tetrasphaera, Tropicimonas, and Ruegeria were dominant in the TA-400 group; and the genera Phaeomarinomonas, Rhodobacter, Pir4 lineage, and Microbacterium were significant in the TA-800 group (Figure 10B).
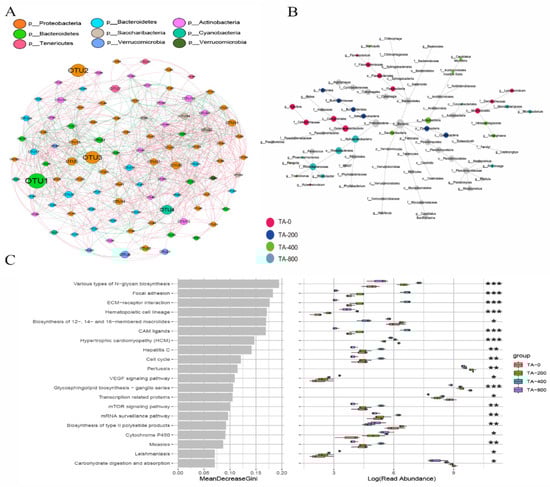
Figure 10.
Network and metabolism analyses of the intestinal microbes of L. vannamei in different treatments. (A) Relevance network analyses based on the bacterial phylum level. The nodes represent the phylum classification of the OTUs, and the node size indicates the relative abundance of each taxon. The nodes representing the same phylum are shown in the same colour. Lines between two OTUs represent the correlation. (B) Differential network analyses: the nodes represent the species classification, and the node size indicates the relative abundance. The node colour provides information about the difference; black indicates no significant difference, and the remaining colours indicate significant differences in the corresponding group. The names of taxa with an abundance above 1% are provided. (C) Microbial metabolism prediction based on KEGG pathway analysis. * Indicates a significant difference (p < 0.05) among groups. ** Indicates a highly significant difference (p < 0.01) among groups. *** Indicates a extremely significant difference (p < 0.001) among groups.
The predicted function of the intestinal microbiota was analyzed. Based on KEGG classification, compared with the TA-0 group, “VEGF signaling pathway”, “various types of N-glycan biosynthesis”, “cytochrome P450”, and “hematopoietic cell lineage” were higher in the three TA treatment groups, but “carbohydrate digestion and absorption” and “glycosphingolipid biosynthesis-ganglio series” were lower (Figure 10C).
4. Discussion
4.1. Effects of Dietary TA on the Growth Performance and Histological Structure of the Shrimp
TA is widely present in most plant species used for nutrition addition, and has been applied to aquaculture activity with positive effects on aquatic animal nutrition absorption and health [37,38,39,40]. For example, adding hydrolysable tannins to feed can improve the feed conversion ratio of shrimp [14]. Adding 0.05–0.15% hydrolyzed tannins to feed can improve the growth performance of pearl gentian grouper [41]. Adding TA to the diet can increase the intestinal surface area, promote the absorption of nutrients, and make better use of them [42]. In the present study, B and R cells were observed in the hepatopancreas of all experimental groups. They can help with nutrient absorption and the synthesis of digestive enzymes, and the increase in R cells in the dietary TA supplement group may be due to tannins, which give them easier access to nutrients and better liver protein status, thus improving the growth of shrimp [43,44,45]. In this study, supplementation with 400–800 mg/kg TA in diets promoted growth, reduced the feed conversion ratio, and improved the survival rate of L. vannamei after ammonia stress.
4.2. Effects of Dietary TA on the Digestive Enzyme Activity of the Shrimp
The activity of digestive enzymes is directly related to the digestion and absorption of nutritional material and to the growth of the animals [46]. It has been reported that a low dosage of TA has positive effects on the digestion and absorption function of organisms [47]. The addition of 1.0% chestnut tannin to the diet of meat rabbits could significantly increase the activities of amylase and trypsin [48]. Dietary supplementation with 0.15% hydrolyzable tannic acid could promote the growth performance and digestive activity of shrimp [14]. Previous studies have shown that dietary tannins stimulate the organism’s neural pathways as well as epinephrine, which promotes the expression of amylase [49]. In this study, dietary TA increased the activity of AMS in the intestine of L. vannamei, indicating that TA could enhance nutrient digestibility and contribute to improving growth performance. Tannins inhibit the absorption of amino acids in vitro mainly by combining with Tryp and dietary protein [50]. However, in the present study, the activity of Tryp was higher in the TA groups than in the other treatments. Previous research has shown that tannins affect protein digestion primarily by forming less digestible complexes with dietary protein, rather than inhibiting digestive enzymes [51]. LPS activity was lower in the TA-400 and TA-800 groups. In a study, hydrolysable tannin decreased the activity of lipase, and the central reason was the high binding strength between tannin and lipase [52]. Therefore, this suggests that TA can reduce lipid deposition by inhibiting the uptake of dietary lipids by the organism. The differences in the activities of digestive enzymes indicate the complexity of the digestion and degradation of different nutrients by tannins, which may be related to the structure of TA, types of digestive enzymes, experimental subjects, and complex and changeable environments in organisms.
4.3. Effects of Dietary TA on the Immune Enzyme Activity and Gene Expression of the Shrimp
Environmental stress can accelerate oxygen uptake and produce excessive reactive oxygen species in shrimp, and lead to oxidative stress in crustaceans. Suboptimal environmental conditions can induce the production of excessive ROS, which are harmful to organisms [53]. Organisms rely on antioxidant enzyme systems, including antioxidant enzymes and proteins, to resist oxidative stress and maintain physiological homeostasis. Aquatic animals adapt to their environment by using antioxidant systems to remove excess ROS. T-AOC activity reflects the total status of antioxidant enzymes, while SOD provides the first line of ROS elimination from cells [54]. It has been reported that tannins have a positive effect by stimulating antioxidant defense functions [55,56,57,58]. In this study, T-AOC and SOD activity were higher in the hepatopancreas of L. vannamei, as indicated by higher transcript levels of Cu/Zn-SOD. The Cu/Zn-SOD multigene family is known to elicit oxidant defense and cytokine network through the action of phagocytes (macrophages) and humoral factors. This reveals that TA might enhance the antioxidant capabilities and non-specific immunity of shrimp to defend against ammonia stress.
Nonspecific immunity plays an important role in shrimp when the organism suffers environmental stress [59]. The main role of LZM is to hydrolyze the cell wall of bacteria, while PPO is the product of the proPO activation pathway, which is closely related to the activation of cellular defense and the emergence of phagocytosis factors [60]. The LZM and proPO systems have important effects on immune defense in crustaceans [61,62]. The addition of tannic acid produces immune protection or positive effects in aquaculture [63]. In this study, the activities of PPO were higher in the three TA treatment groups, and the activities of LZM were highest in the TA-800 group. Additionally, the expression levels of the LZM and proPO genes were upregulated in the three TA treatment groups. This indicates that exposure to ammonia stress and TA can better activate the immune system of shrimp and stimulate the release of LZM from lysosomes to resist immune stress.
4.4. Effects of Dietary TA on the Intestinal Microbiota of the Shrimp
The intestinal microbiota is closely associated with host health [64,65]. In this study, after shrimp were fed the TA diets for 56 days, TA supplementation increased the diversity and altered the composition of the intestinal microbiota in L. vannamei. It has been reported that Proteobacteria, Bacteroidetes, and Planctomycetes are the dominant phyla in the intestine of L. vannamei [66]. Proteobacteria participate in carbon complexes and nitrogen degradation [67,68]. Bacteroidetes can promote energy metabolism by increasing carbohydrate metabolism [69]. Planctomycetes contains anaerobic ammonia-oxidizing bacteria, which play important roles in reducing ammonia nitrogen in aquatic systems and contributing to the global nitrogen cycle [70]. In this study, the increased abundance of Planctomycetes and the decreased abundance of Bacteroides and Proteobacteria indicated that dietary TA might affect the ability of L. vannamei intestinal bacteria to metabolize nutrients.
In our experimental results, several major bacterial genera also showed obvious differences among the experimental groups. Among them, we focus on bacteria that are relevant to host health. Rhodobacteracea can contribute to the global carbon and nitrogen cycle by breaking down large amounts of organic material, such as “marine snow”. According to previous study [71], it plays an important role in maintaining the health and promoting the growth of aquatic animals [72,73]. The present study shows that the highest relative abundance of Rhodobacteracea was observed in the TA-800 group, which was consistent with the best growth performance of L. vannamei. These results suggest that dietary TA can promote the growth of shrimp by regulating the intestinal flora abundance. Paracoccus, belonging to Proteobacteria, is a denitrifying bacterium that can help to reduce nitrate to molecular nitrogen [74]. In our study, the abundance of Paracoccus increased in some TA groups, and TA increased the abundance of beneficial bacteria in the intestine.
Various opportunistic pathogens exist in the intestine of shrimp, such as Flavobacteriaceae [75]. In this study, the decreased abundance of Flavobacteriaceae indicated that dietary TA might reduce the pathogen abundance in the intestine of shrimp. Vibrio is a common pathogen in aquatic animals [76], and Scalbert et al. found that TA achieved antibacterial activity by reducing the content of iron ions [77]. In this study, the reduced levels of this bacterium indicated that TA reduced the risk of putative opportunistic pathogens in the L. vannamei intestine. Algoriphagus was used as a model strain for classification and identification. There have been few studies on Candidatus Bacilloplasma, which is classified as Tenericutes, in the intestine, and its role in the intestine is not clear [78], but it is often enriched in the intestines of diseased shrimp [79]. Pandoraea has the ability to degrade lignin [80]. Cellvibrio can utilize glucose in an oxidative manner and hydrolyze cellulose and other polysaccharide complexes [81]. In this study, the change in the abundances of Algoriphagus, Cellvibrio, Candidatus Bacilloplasma, and Pandoraea indicated that TA could potentially affect the abundance of harmful or beneficial bacteria in the intestine and the metabolic capacity of shrimp. Furthermore, a large number of KEGG metabolic pathways fluctuated, such as “carbohydrate digestion and absorption”, “glycosphingolipid biosynthesis-ganglio series”, “cytochrome P450”, “hematopoietic cell lineage” and “various types of N-glycan biosynthesis”. This phenomenon revealed that dietary TA could regulate the intestinal microbiota metabolic function of L. vannamei. Therefore, dietary TA supplementation could cause intestinal microbiotic variations in L. vannamei, and the increased microbial diversity might contribute to counteracting the adverse effects of ammonia exposure.
5. Conclusions
The present study revealed that dietary TA improved growth, digestion, nonspecific immunity, resistance to ammonia stress, and the intestinal microbial community. TA did not have any negative effects or severe changes in the intestine and hepatopancreas morphological structure in L. vannamei. Furthermore, TA not only enhanced the relative abundances of beneficial bacteria, but also lowered the relative abundance of opportunistic pathogenic bacteria in shrimp. The results showed that 400–800 mg/kg TA showed the most application value in shrimp aquaculture. The interactions among growth performance, antioxidant capability, and the composition of intestinal microbiota in L. vannamei deserve further exploration.
Supplementary Materials
The following supporting information can be downloaded at: https://www.mdpi.com/article/10.3390/fishes7060327/s1, Table S1. Primer sequences used for quantitative real-time PCR in this study. Figure S1. Rarefaction curves of intestine microbial samples with OTUs of L. vannamei.
Author Contributions
Conceptualization, P.C.; methodology, P.C. and J.L. (Jitao Li); formal analysis, H.G. and Z.Q.; investigation, Z.C. (Zhao Chen) and Z.C. (Zhiqiang Chang); data curation, H.G. and P.C.; writing—original draft preparation, H.G.; writing—review and editing, H.G., P.C. and J.L. (Jitao Li); Supervision, J.L. (Jian Li); funding acquisition, J.L. (Jitao Li), P.C. and J.L. (Jian Li). All authors have read and agreed to the published version of the manuscript.
Funding
This project was financially supported by the National Key R & D Program of China (2019YFD0900505), the earmarked fund for CARS-48, and the Central Public-interest Scientific Institution Basal Research Fund of CAFS (2020TD46, 2021XT06).
Institutional Review Board Statement
No human subjects were included in this study. The collection and handling of all shrimps used in this study were approved by the Experimental Animal Ethics Committee, Yellow Sea Fisheries Research Institute, Chinese Academy of Fishery Sciences (Approval code: YSFRI-2022031, and date: 29 October 2022).
Data Availability Statement
The datasets generated and analyzed during the current study are available from the corresponding author on reasonable request.
Conflicts of Interest
The authors declare that they have no known competing financial interest or personal relationships that could have appeared to influence the work reported in this paper.
References
- FAO. The State of World Fisheries and Aquaculture 2022: Towards Blue Transformation; United Nations: New York, NY, USA, 2022. [Google Scholar]
- Van, T.P.T.H.; Rhodes, M.A.; Zhou, Y.; Davis, D.A. Feed management for Pacific white shrimp Litopenaeus vannamei under semi-intensive conditions in tanks and ponds. Aquac. Res. 2017, 48, 5346–5355. [Google Scholar] [CrossRef]
- Bergqvist, J.; Gunnarsson, S. Finfish Aquaculture: Animal Welfare, the Environment, and Ethical Implications. 2011, 26, 75–99. J. Agric. Environ. Ethics 2011, 26, 75–99. [Google Scholar] [CrossRef]
- Liu, C.H.; Chen, J.C. Effect of ammonia on the immune response of white shrimp Litopenaeus vannamei and its susceptibility to Vibrio alginolyticus. Fish Shellfish Immunol. 2004, 16, 321–334. [Google Scholar] [CrossRef]
- Yang, S.D.; Liou, C.H.; Liu, F.G. Effects of dietary protein level on growth performance, carcass composition and ammonia excretion in juvenile silver perch (Bidyanus bidyanus). Aquaculture 2002, 213, 363–372. [Google Scholar] [CrossRef]
- Zhang, M.; Wang, S.; Sun, Z.; Jiang, H.; Qian, Y.; Wang, R.; Li, M. The effects of acute and chronic ammonia exposure on growth, survival, and free amino acid abundance in juvenile Japanese sea perch Lateolabrax japonicus. Aquaculture 2022, 560, 738512. [Google Scholar] [CrossRef]
- Haslam, E. Plant Polyphenols—Vegetable Tannins Revisited. In Chemistry and Pharmacology of Natural Products; Philipson, J.D., Ayres, D.C., Baxter, H., Eds.; Cambridge University Press: Cambridge, UK, 1988; pp. 167–195. [Google Scholar]
- Labieniec, M.; Gabryelak, T.; Falcioni, G. Antioxidant and pro-oxidant effects of tannins in digestive cells of the freshwater mussel Unio tumidus. Mutat. Res. Toxicol. Environ. Mutagen. 2003, 539, 19–28. [Google Scholar] [CrossRef]
- Lu, R.H.; Qin, C.B.; Yang, F.; Zhang, W.Y.; Zhang, Y.R.; Yang, G.K.; Yang, L.P.; Meng, X.L.; Yan, X.; Nie, G.X. Grape seed proanthocyanidin extract ameliorates hepatic lipid accumulation and inflammation in grass carp (Ctenopharyngodon idella). Fish Physiol. Biochem. 2020, 46, 1665–1677. [Google Scholar] [CrossRef]
- Peng, K.; Zhao, H.; Wang, G.; Chen, B.; Mo, W.; Huang, Y. Effect of condensed tannins on growth performance, intestinal immune capacity and bacterial microbiomes of Lateolabrax japonicus. Aquac. Res. 2021, 52, 5321–5331. [Google Scholar] [CrossRef]
- Felipe, S.A.; Maria, R.B.D.C. Body lipid deposition in Nile tilapia fed on rations containing tannin. Pesqui. Agropecu. Bras. 2007, 42, 50–56. [Google Scholar]
- Yao, J.; Chen, P.; Ringø, E.; Zhang, G.; Huang, Z.; Hua, X. Effect of diet supplemented with rapeseed meal or hydrolysable tannins on the growth, nutrition, and intestinal microbiota in grass carp (Ctenopharyngodon idellus). Front. Nutr. 2019, 6, 154. [Google Scholar] [CrossRef]
- Orso, G.; Solovyev, M.; Facchiano, S.; Tyrikova, E.; Sateriale, D.; Kashinskaya, E.; Pagliarulo, C.; Hoseinifar, H.; Simonov, E.; Varricchio, E.; et al. Chestnut Shell Tannins: Effects on Intestinal Inflammation and Dysbiosis in Zebrafish. Animals 2021, 11, 1538. [Google Scholar] [CrossRef] [PubMed]
- Zhu, X.F.; Guo, H.; Li, G.L.; Zhu, C.H. Effects of dietary hydrolyzable tannins on growth performance, antioxidant capacity, intestinal microflora and resistance against Vibrio parahaemolyticus of juvenile Pacific white shrimp, Litopenaeus vannamei (Boone, 1931). Aquac. Rep. 2021, 19, 100604. [Google Scholar] [CrossRef]
- Starčević, K.; Krstulović, L.; Brozić, D.; Maurić, M.; Stojević, Z.; Mikulec, Z.; Bajić, M.; Mašek, T. Production performance, meat composition and oxidative susceptibility in broiler chicken fed with different phenolic compounds. J. Sci. Food Agric. 2014, 95, 1172–1178. [Google Scholar] [CrossRef] [PubMed]
- Biagia, G.; Cipollini, I.; Paulicks, B.R.; Roth, F.X. Effect of tannins on growth performance and intestinal ecosystem in weaned Piglets. Arch. Anim. Nutr. 2010, 64, 121–135. [Google Scholar] [CrossRef] [PubMed]
- Vancamelbeke, M.; Vermeire, S. The intestinal barrier: A fundamental role in health and disease. Expert Rev. Gastroenterol. Hepatol. 2017, 11, 821–834. [Google Scholar] [CrossRef]
- Farré, R.; Fiorani, M.; Rahiman, S.A.; Matteoli, G. Intestinal Permeability, Inflammation and the Role of Nutrients. Nutrients 2020, 12, 1185. [Google Scholar] [CrossRef]
- Tap, J.; Furet, J.; Bensaada, M.; Philippe, C.; Roth, H.; Rabot, S.; Lakhdari, O.; Lombard, V.; Henrissat, B.; Corthier, G.; et al. Gut microbiota richness promotes its stability upon increased dietary fibre intake in healthy adults. Environ. Microbiol. 2015, 17, 4954–4964. [Google Scholar] [CrossRef]
- Bates, J.M.; Mittge, E.; Kuhlman, J.; Baden, K.N.; Cheesman, S.E.; Guillemin, K. Distinct signals from the microbiota promote different aspects of zebrafish gut differentiation. Dev. Biol. 2006, 297, 374–386. [Google Scholar] [CrossRef]
- Gu, X.; Hao, Y.; Wang, X. Overexpression of heat shock protein 70 and its relationship to intestine under acute heat stress in broilers: 2. Intestinal oxidative stress. Poult. Sci. 2012, 91, 790–799. [Google Scholar] [CrossRef]
- Santos, R.R.; Awati, A.; Roubos-van den Hil, P.J.; Tersteeg-Zijderveld, M.H.G.; Koolmees, P.A.; Fink-Gremmels, J. Quantitative histo-morphometric analysis of heat-stress-related damage in the small intestines of broiler chickens. Avian Pathol. 2015, 44, 19–22. [Google Scholar] [CrossRef]
- Barreau, F.; Hugot, J. Intestinal barrier dysfunction triggered by invasive bacteria. Curr. Opin. Microbiol. 2014, 17, 91–98. [Google Scholar] [CrossRef] [PubMed]
- Chelakkot, C.; Ghim, J.; Ryu, S.H. Mechanisms regulating intestinal barrier integrity and its pathological implications. Exp. Mol. Med. 2018, 50, e450. [Google Scholar] [CrossRef] [PubMed]
- Quinteiro-Filho, W.M.; Gomes, A.V.S.; Pinheiro, M.L.; Ribeiro, A.; Ferraz-De-Paula, V.; Astolfi-Ferreira, C.S.; Ferreira, A.J.P.; Palermo-Neto, J. Heat stress impairs performance and induces intestinal inflammation in broiler chickens infected with Salmonella Enteritidis. Avian Pathol. 2012, 41, 421–427. [Google Scholar] [CrossRef]
- Burkholder, K.M.; Thompson, K.L.; Einstein, M.E.; Applegate, T.J.; Patterson, J.A. Influence of Stressors on Normal Intestinal Microbiota, Intestinal Morphology, and Susceptibility to Salmonella enteritidis Colonization in Broilers. Poult. Sci. 2008, 87, 1734–1741. [Google Scholar] [CrossRef]
- Quinteiro-Filho, W.M.; Ribeiro, A.; Ferraz-De-Paula, V.; Pinheiro, M.L.; Sakai, M.; Sá, L.R.M.; Ferreira, A.J.P.; Palermo-Neto, J. Heat stress impairs performance parameters, induces intestinal injury, and decreases macrophage activity in broiler chickens. Poult. Sci. 2010, 89, 1905–1914. [Google Scholar] [CrossRef] [PubMed]
- Amoroso, C.; Perillo, F.; Strati, F.; Fantini, M.; Caprioli, F.; Facciotti, F. The Role of Gut Microbiota Biomodulators on Mucosal Immunity and Intestinal Inflammation. Cells 2020, 9, 1234. [Google Scholar] [CrossRef]
- Wang, M.; Huang, H.; Hu, Y.; Huang, J.; Yang, H.; Wang, L.; Chen, S.; Chen, C.; He, S. Effects of dietary microencapsulated tannic acid supplementation on the growth performance, intestinal morphology, and intestinal microbiota in weaning piglets. J. Anim. Sci. 2020, 98, skaa112. [Google Scholar] [CrossRef]
- Lin, Y.C.; Chen, J.C. Acute toxicity of ammonia on Litopenaeus vannamei Boone juveniles at different salinity levels. J. Exp. Mar. Biol. Ecol. 2001, 259, 109–119. [Google Scholar] [CrossRef]
- Bullerwell, C.N.; Collins, S.A.; Lall, S.P.; Anderson, D.M. Growth performance, proximate and histological analysis of rainbow trout fed diets containing Camelina sativa seeds, meal (high-oil and solvent-extracted) and oil. Aquaculture 2016, 452, 342–350. [Google Scholar] [CrossRef]
- Edgar, R.C. UPARSE: Highly accurate OTU sequences from microbial amplicon reads. Nat. Methods 2013, 10, 996–998. [Google Scholar] [CrossRef]
- Edgar, R.C.; Haas, B.J.; Clemente, J.C.; Quince, C.; Knight, R. UCHIME improves sensitivity and speed of chimera detection. Bioinformatics 2011. [CrossRef] [PubMed]
- Schloss, P.D.; Westcott, S.L. Assessing and Improving Methods Used in Operational Taxonomic Unit-Based Approaches for 16S rRNA Gene Sequence Analysis. Appl. Environ. Microbiol. 2011, 77, 3219–3226. [Google Scholar] [CrossRef]
- Segata, N.; Abubucker, S.; Goll, J.; Schubert, A.M.; Izard, J.; Cantarel, B.L.; Rodriguez-Mueller, B.; Waldron, L.; Zucker, J.; Thiagarajan, M.; et al. Microbial community function and biomarker discovery in the human microbiome. Genome Biol. 2011, 12, P47. [Google Scholar] [CrossRef]
- Huang, Z.; Zeng, S.; Xiong, J.; Hou, D.; Zhou, R.; Xing, C.; Wei, D.; Deng, X.; Yu, L.; Wang, H.; et al. Microecological Koch’s postulates reveal that intestinal microbiota dysbiosis contributes to shrimp white feces syndrome. Microbiome 2020, 8, 32. [Google Scholar] [CrossRef] [PubMed]
- Ghosh, K.; Ray, A.K.; Ringø, E. Applications of plant ingredients for tropical and subtropical freshwater finfish: Possibilities and challenges. Rev. Aquac. 2018, 11, 793–815. [Google Scholar] [CrossRef]
- Abdel-Tawwab, M.; Adeshina, I.; Jenyo-Oni, A.; Ajani, E.K.; Emikpe, B.O. Growth, physiological, antioxidants, and immune response of African catfish, Clarias gariepinus (B.), to dietary clove basil, Ocimum gratissimum, leaf extract and its susceptibility to Listeria monocytogenes infection. Fish Shellfish Immunol. 2018, 78, 346–354. [Google Scholar] [CrossRef] [PubMed]
- Adeshina, I.; Jenyo-Oni, A.; Emikpe, B.O.; Ajani, E.K.; Abdel-Tawwab, M. Stimulatory effect of dietary clove, Eugenia caryophyllata, bud extract on growth performance, nutrient utilization, antioxidant capacity, and tolerance of African catfish, Clarias gariepinus (B.), to Aeromonas hydrophila infection. J. World Aquac. Soc. 2018, 50, 390–405. [Google Scholar] [CrossRef]
- Buyukcapar, H.M.; Atalay, A.I.; Kamalak, A. Growth performance of Nile tilapia (Oreochromis niloticus) fed with diets containing different levels of hydrolysable and condensed tannin. J. Agric. Sci. Technol. 2011, 6, 1045–1051. [Google Scholar] [CrossRef]
- Zhu, X.F.; Huang, Y.; Huang, J.H.; Li, G.L.; Zhu, C.H. Effects of hydrolyzed tannins on growth performance, antioxidant capacity, intestinal tissue structure and flora diversity of pearl gentian grouper. J. Anim. Nutr. 2021, 2, 1020–1035. [Google Scholar] [CrossRef]
- Chen, B.; Qiu, J.Q.; Wang, Y.X.; Huang, W.; Zhao, H.X.; Zhu, X.F.; Peng, K. Condensed tannins increased intestinal permeability of Chinese seabass (Lateolabrax maculatus) based on microbiome-metabolomics analysis. Aquaculture 2022, 560, 738615. [Google Scholar] [CrossRef]
- Pourmozaffar, S.; Hajimoradloo, A.; Paknejad, H.; Rameshi, H. Effect of dietary supplementation with apple cider vinegar and propionic acid on hemolymph chemistry, intestinal microbiota and histological structure of hepatopancreas in white shrimp, Litopenaeus vannamei. Fish Shellfish Immunol. 2018, 86, 900–905. [Google Scholar] [CrossRef] [PubMed]
- Johnston, D.; Calvert, K.; Crear, B.; Carter, C. Dietary carbohydrate/lipid ratios and nutritional condition in juvenile southern rock lobster, Jasus edwardsii. Aquaculture 2003, 220, 667–682. [Google Scholar] [CrossRef]
- Romano, N.; Koh, C.B.; Ng, W.K. Dietary microencapsulated organic acids blend enhances growth, phosphorus utilization, immune response, hepatopancreatic integrity and resistance against Vibrio harveyi in white shrimp, Litopenaeus vannamei. Aquaculture 2015, 435, 228–236. [Google Scholar] [CrossRef]
- Griffiths, D.W.; Moseley, G. The effect of diets containing field beans of high or low polyphenolic content on the activity of digestive enzymes in the intestines of rats. J. Sci. Food Agric. 2010, 3, 255–259. [Google Scholar] [CrossRef] [PubMed]
- da Costa, G.; Lamy, E.; e Silva, F.C.; Andersen, J.; Baptista, E.S.; Coelho, A.V. Salivary Amylase Induction by Tannin-Enriched Diets as a Possible Countermeasure Against Tannins. J. Chem. Ecol. 2008, 34, 376–387. [Google Scholar] [CrossRef]
- Liu, H.W. Study on antioxidant activity of chestnut tannins and its effect on growth performance of rabbits. Beijing Chin. Acad. Agric. Sci. 2010, 2010, 18–26. [Google Scholar]
- Chung, K.T.; Wei, C.I.; Johnson, M.G. Are tannins a double-edged sword in biology and health? Trends Food Sci. Technol. 1998, 9, 168–175. [Google Scholar] [CrossRef]
- Nyman, M.E.; Björck, I.M. In Vivo Effects of Phytic Acid and Polyphenols on the Bioavailability of Polysaccharides and Other Nutrients. J. Food Sci. 1989, 54, 1332–1335. [Google Scholar] [CrossRef]
- Wang, Z.; Yin, L.; Liu, L.; Lan, X.; He, J.; Wan, F.; Shen, W.; Tang, S.; Tan, Z.; Yang, Y. Tannic acid reduced apparent protein digestibility and induced oxidative stress and inflammatory response without altering growth performance and ruminal microbiota diversity of Xiangdong black goats. Front. Vet. Sci. 2022, 9, 1004841. [Google Scholar] [CrossRef]
- Noorolahi, Z.; Sahari, M.A.; Barzegar, M.; Gavlighi, H.A. Tannin fraction of pistachio green hull extract with pancreatic lipase inhibitory and antioxidant activity. J. Food Biochem. 2020, 44, e13208. [Google Scholar] [CrossRef]
- Min, B.H.; Ravikumar, Y.; Lee, D.H.; Choi, K.S.; Kim, B.M.; Rhee, J.S. Agedependent antioxidant responses to the bioconcentration of microcystin-LR in the mysid crustacean, Neomysis awatschensis. Environ. Pollut. 2018, 232, 284–292. [Google Scholar] [CrossRef] [PubMed]
- Hoseinifar, S.H.; Yousefi, S.; Capillo, G.; Paknejad, H.; Khalili, M.; Tabarraei, A.; Van Doan, H.; Spanò, N.; Faggio, C. Mucosal immune parameters, immune and antioxidant defence related genes expression and growth performance of zebrafish (Danio rerio) fed on Gracilaria gracilis powder. Fish Shellfish Immunol. 2018, 83, 232–237. [Google Scholar] [CrossRef] [PubMed]
- Parisi, F.; Mancini, S.; Mazzei, M.; Forzan, M.; Turchi, B.; Perrucci, S.; Poli, A.; Paci, G. Effect of Dietary Supplementation of a Mix of Chestnut and Quebracho Tannins on Intestinal Morphology, Bacterial Load, Eimeria spp. oocyst Excretion and Immune Response after Vaccination in Rabbits. Am. J. Anim. Vet. Sci. 2018, 13, 94–103. [Google Scholar] [CrossRef]
- Orzuna-Orzuna, J.F.; Dorantes-Iturbide, G.; Lara-Bueno, A.; Mendoza-Martínez, G.D.; Miranda-Romero, L.A.; Lee-Rangel, H.A. Growth Performance, Meat Quality and Antioxidant Status of Sheep Supplemented with Tannins: A Meta-Analysis. Animals 2021, 11, 3184. [Google Scholar] [CrossRef]
- Peng, K.; Lv, X.; Zhao, H.; Chen, B.; Chen, X.; Huang, W. Antioxidant and intestinal recovery function of condensed tannins in Lateolabrax maculatus responded to in vivo and in vitro oxidative stress. Aquaculture 2021, 547, 737399. [Google Scholar] [CrossRef]
- Khojasteh, A.; Mirjalili, M.H.; Alcalde, M.A.; Cusido, R.M.; Eibl, R.; Palazon, J. Powerful Plant Antioxidants: A New Biosustainable Approach to the Production of Rosmarinic Acid. Antioxidants 2020, 9, 1273. [Google Scholar] [CrossRef] [PubMed]
- Yao, C.-L.; Ji, P.-F.; Wang, Z.Y.; Li, F.H.; Xiang, J.-H. Molecular cloning and expression of NOS in shrimp, Litopenaeus vannamei. Fish Shellfish Immunol. 2010, 28, 453–460. [Google Scholar] [CrossRef] [PubMed]
- Saurabh, S.; Sahoo, P.K. Lysozyme: An important defence molecule of fish innate immune system. Aquac. Res. 2008, 39, 223–239. [Google Scholar] [CrossRef]
- Duan, Y.; Wang, Y.; Liu, Q.; Zhang, J.; Xiong, D. Changes in the intestine barrier function of Litopenaeus vannamei in response to pH stress. Fish Shellfish Immunol. 2019, 88, 142–149. [Google Scholar] [CrossRef]
- Sutthangkul, J.; Amparyup, P.; Eum, J.-H.; Strand, M.R.; Tassanakajon, A. Anti-melanization mechanism of the white spot syndrome viral protein, WSSV453, via interaction with shrimp proPO-activating enzyme, PmproPPAE2. J. Gen. Virol. 2017, 98, 769–778. [Google Scholar] [CrossRef]
- Peng, K.; Wang, G.; Zhao, H.; Wang, Y.; Mo, W.; Wu, H.; Huang, Y. Effect of high level of carbohydrate and supplementation of condensed tannins on growth performance, serum metabolites, antioxidant and immune response, and hepatic glycometabolism gene expression of Lateolabrax japonicus. Aquac. Rep. 2020, 18, 100515. [Google Scholar] [CrossRef]
- Klase, G.; Lee, S.; Liang, S.; Lee, J. The microbiome and antibiotic resistance in integrated fishfarm water: Implications of environmental public health. Sci. Total Environ. 2019, 649, 1491–1501. [Google Scholar] [CrossRef] [PubMed]
- Xiong, J.; Zhu, J.; Dai, W.; Dong, C.; Qiu, Q.; Li, C. Integrating gut microbiota immaturity and disease-discriminatory taxa to diagnose the initiation and severity of shrimp disease. Environ. Microbiol. 2017, 19, 1490–1501. [Google Scholar] [CrossRef] [PubMed]
- Fan, L.; Wang, Z.; Chen, M.; Qu, Y.; Li, J.; Zhou, A.; Xie, S.; Zeng, F.; Zou, J. Microbiota comparison of Pacific white shrimp intestine and sediment at freshwater and marine cultured environment. Sci. Total Environ. 2018, 657, 1194–1204. [Google Scholar] [CrossRef] [PubMed]
- Shin, N.R.; Whon, T.W.; Bae, J.W. Proteobacteria: Microbial signature of dysbiosis in gut microbiota. Trends Biotechnol. 2015, 33, 496–503. [Google Scholar] [CrossRef] [PubMed]
- van Kessel, M.A.; Harhangi, H.R.; van de Pas-Schoonen, K.; van de Vossenberg, J.; Flik, G.; Jetten, M.S.; Klaren, P.H.; Camp, H.J.O.D. Biodiversity of N-cycle bacteria in nitrogen removing moving bed biofilters for freshwater recirculating aquaculture systems. Aquaculture 2010, 306, 177–184. [Google Scholar] [CrossRef]
- Shi, X.; Ng, K.K.; Li, X.R.; Ng, H.Y. Investigation of Intertidal Wetland Sediment as a Novel Inoculation Source for Anaerobic Saline Wastewater Treatment. Environ. Sci. Technol. 2015, 49, 6231–6239. [Google Scholar] [CrossRef]
- Kou, L.; Huang, T.; Zhang, H.; Wen, G.; Li, N.; Wang, C.; Lu, L. Mix-cultured aerobic denitrifying bacterial communities reduce nitrate: Novel insights in micro-polluted water treatment at lower temperature. Sci. Total Environ. 2021, 796, 148910. [Google Scholar] [CrossRef]
- Klindworth, A.; Michael, R.; Tim, R.H.; Frank, O.G. Permanent draft genome of Rhodopirellula rubra SWK7. Mar. Genom. 2014, 13, 11–12. [Google Scholar] [CrossRef]
- Duan, Y.; Xiong, D.; Wang, Y.; Dong, H.; Huang, J.; Zhang, J. Effects of Microcystis aeruginosa and microcystin-LR on intestinal histology, immune response, and microbial community in Litopenaeus vannamei. Environ. Pollut. 2020, 265, 114774. [Google Scholar] [CrossRef]
- Qiao, F.; Liu, Y.; Sun, Y.; Wang, X.; Chen, K.; Li, T.; Li, E.; Zhang, M. Influence of different dietary carbohydrate sources on the growth and intestinal microbiota of Litopenaeus vannamei at low salinity. Aquac. Nutr. 2016, 23, 444–452. [Google Scholar] [CrossRef]
- Zhang, M.; Sun, Y.; Chen, K.; Yu, N.; Zhou, Z.; Chen, L.; Du, Z.; Li, E. Characterization of the intestinal microbiota in Pacific white shrimp, Litopenaeus vannamei, fed diets with different lipid sources. Aquaculture 2014, 434, 449–455. [Google Scholar] [CrossRef]
- Wang, J.; Huang, Y.; Xu, K.; Zhang, X.; Sun, H.; Fan, L.; Yan, M. White spot syndrome virus (WSSV) infection impacts intestinal microbiota composition and function in Litopenaeus vannamei. Fish Shellfish Immunol. 2018, 84, 130–137. [Google Scholar] [CrossRef]
- Cottrell, M.T.; Kirchman, D.L. Natural Assemblages of Marine Proteobacteria and Members of the Cytophaga-Flavobacter Cluster Consuming Low- and High-Molecular-Weight Dissolved Organic Matter. Appl. Environ. Microbiol. 2000, 66, 1692–1697. [Google Scholar] [CrossRef] [PubMed]
- Scalbert, A. Antimicrobial properties of tannins. Phytochemistry 1991, 30, 3875–3883. [Google Scholar] [CrossRef]
- Parshukov, A.N.; Fokina, N.N.; Sukhovskaya, I.V.; Kantserova, N.P.; Lysenko, L.A. Infection and antibiotic treatment have prolonged effect on gut microbiota, muscle and hepatic fatty acids in rainbow trout (Oncorhynchus mykiss). J. Appl. Microbiol. 2022, 133, 1709–1724. [Google Scholar] [CrossRef]
- Aguilar-Rendón, K.G.; Soto-Rodriguez, S.A.; Gomez-Gil, B.; Lozano-Olvera, R.; Yáñez-Rivera, B. Water microbiome dynamics of Pacific white shrimp Penaeus vannamei infected with Vibrio parahaemolyticus strains responsible for acute hepatopancreatic necrosis disease. Aquaculture 2022, 551, 737871. [Google Scholar] [CrossRef]
- Kumar, M.; Mishra, A.; Singh, S.S.; Srivastava, S.; Thakur, I.S. Expression and characterization of novel laccase gene from Pandoraea sp. ISTKB and its application. Int. J. Biol. Macromol. 2018, 115, 308–316. [Google Scholar] [CrossRef]
- Zhao, T.T.; Hu, Q.M.; Zhang, L.J.; Quan, X.J. A strain of Vibrio Fibribacteria isolated from mineralized waste. J. Chongqing Univ. Technol. 2011, 6, 1–5. [Google Scholar]
Publisher’s Note: MDPI stays neutral with regard to jurisdictional claims in published maps and institutional affiliations. |
© 2022 by the authors. Licensee MDPI, Basel, Switzerland. This article is an open access article distributed under the terms and conditions of the Creative Commons Attribution (CC BY) license (https://creativecommons.org/licenses/by/4.0/).