Article

Population Structure of Wild Schizothorax kozlovi in the Upper Yangtze River Based on mtDNA and Stable Isotopes, and Their Relationship with Ambient Temperature

1
Key Laboratory of Freshwater Biodiversity Conservation, Ministry of Agriculture of China, Yangtze River Fisheries Research Institute, Chinese Academy of Fishery Sciences, Wuhan 430223, China
2
Institute of Hydrobiology, Chinese Academy of Sciences, Wuhan 430072, China
*
Author to whom correspondence should be addressed.
Fishes 2022, 7(5), 292; https://doi.org/10.3390/fishes7050292
Submission received: 13 September 2022 / Revised: 10 October 2022 / Accepted: 17 October 2022 / Published: 19 October 2022
(This article belongs to the Special Issue Advances in Endangered Aquatic Animals Protection)

Abstract

:
Schizothorax kozlovi, as an endemic and vulnerable fish of the upper Yangtze River in China, faces many threats. In order to expose the population structure of wild S. kozlovi, the carbon and oxygen isotopic ratios in the otoliths, and the gene sequences of two common mitochondrial markers (Cytb and COI) were investigated in four sampling locations, and then their relationship with ambient temperature was further investigated. In general, it exhibits limited geographic population structuring of S. kozlovi in the upper Yangtze River by both mtDNA and stable isotopes. The values of otolith stable isotope ratios varied from −15.30‰ to −12.37‰ for δ18O and from −10.10‰ to −6.13‰ for δ13C. Significant relationships were revealed between stable isotope ratios and specific mean monthly water temperature variables (from November to March), indicating low temperature effect on otolith stable isotope ratios. Haplotype diversity and nucleotide diversity were 0.928 and 0.00778, both exhibiting high levels. A median-joining haplotype network indicated a mixture of geographical distribution but exhibited two distinct haplotype lineages (Clade I and Clade II). AMOVA detected that the higher percentage of genetic variance was within sampling locations (96.94%) and between two haplotype lineages (72.82%). Most FST values between sampling locations showed small levels of genetic differentiation except the differentiation between population SJ (Sanjiangkou) and JP (Jinping). Therefore, two haplotype lineages and population JP of S. kozlovi in the upper Yangtze River are suggested as three management units for conservation due to their moderate-to-great genetic differentiation and isolated habitat.

1. Introduction

Schizothorax kozlovi Nikolsky (Cypriniformes: Cyprinidae) is an endemic and economic fish of the upper Yangtze River in China, preferring a cold and running-water environment [1]. They are only found in the relatively low altitude area of the Qinghai–Tibet Plateau (namely as the third pole in the earth) and the Yunnan–Guizhou Plateau, such as the Jinsha River, Yalong River, Chishui River and Wujiang River [2,3,4]. As a locally distributed freshwater fish, no typical migration exists in S. kozlovi, but after the melting of ice and snow in spring, S. kozlovi may swim upstream to the tributaries, where the water temperature of the tributaries tends to recover rapidly [5]. Due to the influences of overfishing, water pollution, hydropower station and global climate changes, most habitats and spawning grounds of S. kozlovi are destroyed [1,6]. Their population magnitude has decreased significantly through field investigation by authors and other researchers in recent years, and wild individuals are rare in recent catches of the upper Yangtze River. This indicates that their ecological stability is vulnerable. In order to explore how these environmental changes influence the stability and suitability of their population, knowledge of their population structure is fundamental for a sustainable management of conservation. However, minimal knowledge of its population structure is known so far.
Three pairs of fish otoliths (namely lapillus, sagitta and asteriscus) are mainly composed of calcium carbonate (CaCO3). Otoliths grow as a series of layers that are variously interpreted as having annual and daily periodicities, depending on their dimensions, indicating the application of age estimation of fish from otoliths. Actually, otoliths are deposited undisturbed as layers, exhibiting acellular and metabolically inertness. Otoliths record the internal and external environment of the fish, remaining chemically (and isotopically) inert [7]. Stable isotopes of otoliths, especially stable oxygen and carbon isotope ratios (18O/16O or δ18O; and 13C/12C or δ13C), have been reported to be highly correlated with the living environment of fish, such as temperature, salinity, the primary productivity and food resources [8,9,10,11], inferring that different environments inhabited by fish populations or stocks will originate signatures in the stable isotopes of otoliths. The stable isotopes of δ18O and δ13C from fish can also differ with latitude and location [12,13], hence, the variations in stable isotope compositions can serve as natural tags of different locations, suggesting different population management units [14]. They have been proven to be a cost-effective tool for fish stock identification and a natural marker for exploring the spatial structure and connectivity of fish populations in many species [14,15,16,17,18,19,20,21].
On the other hand, genetic diversity is defined as an important measure of population structure, exhibiting genetic composition patterns and genetic variability in the current population, or reflecting vicarious events from its past that may have shaped their population history. Because of the ability of mitochondrial DNA (mtDNA) sequences to detect population differences, phylogeographic patterns [22], historical demographic events [23] and the existence of cryptic species or subspecies [24], mtDNA genes, including Cytb, COI and ND2, have been widely used [25,26,27,28].
In the present study, the carbon and oxygen isotopic ratios in the otoliths, and the gene sequences of two common mitochondrial markers (Cytb and COI) of wild S. kozlovi captured from four locations in the upper Yangtze River were used to explore the spatial population structure, and then the correlations between stable isotopes and ambient temperature were further investigated. It was expected to seek out the population management units of S. kozlovi, which could provide scientific basis for the conservation of this species.

2. Materials and Methods
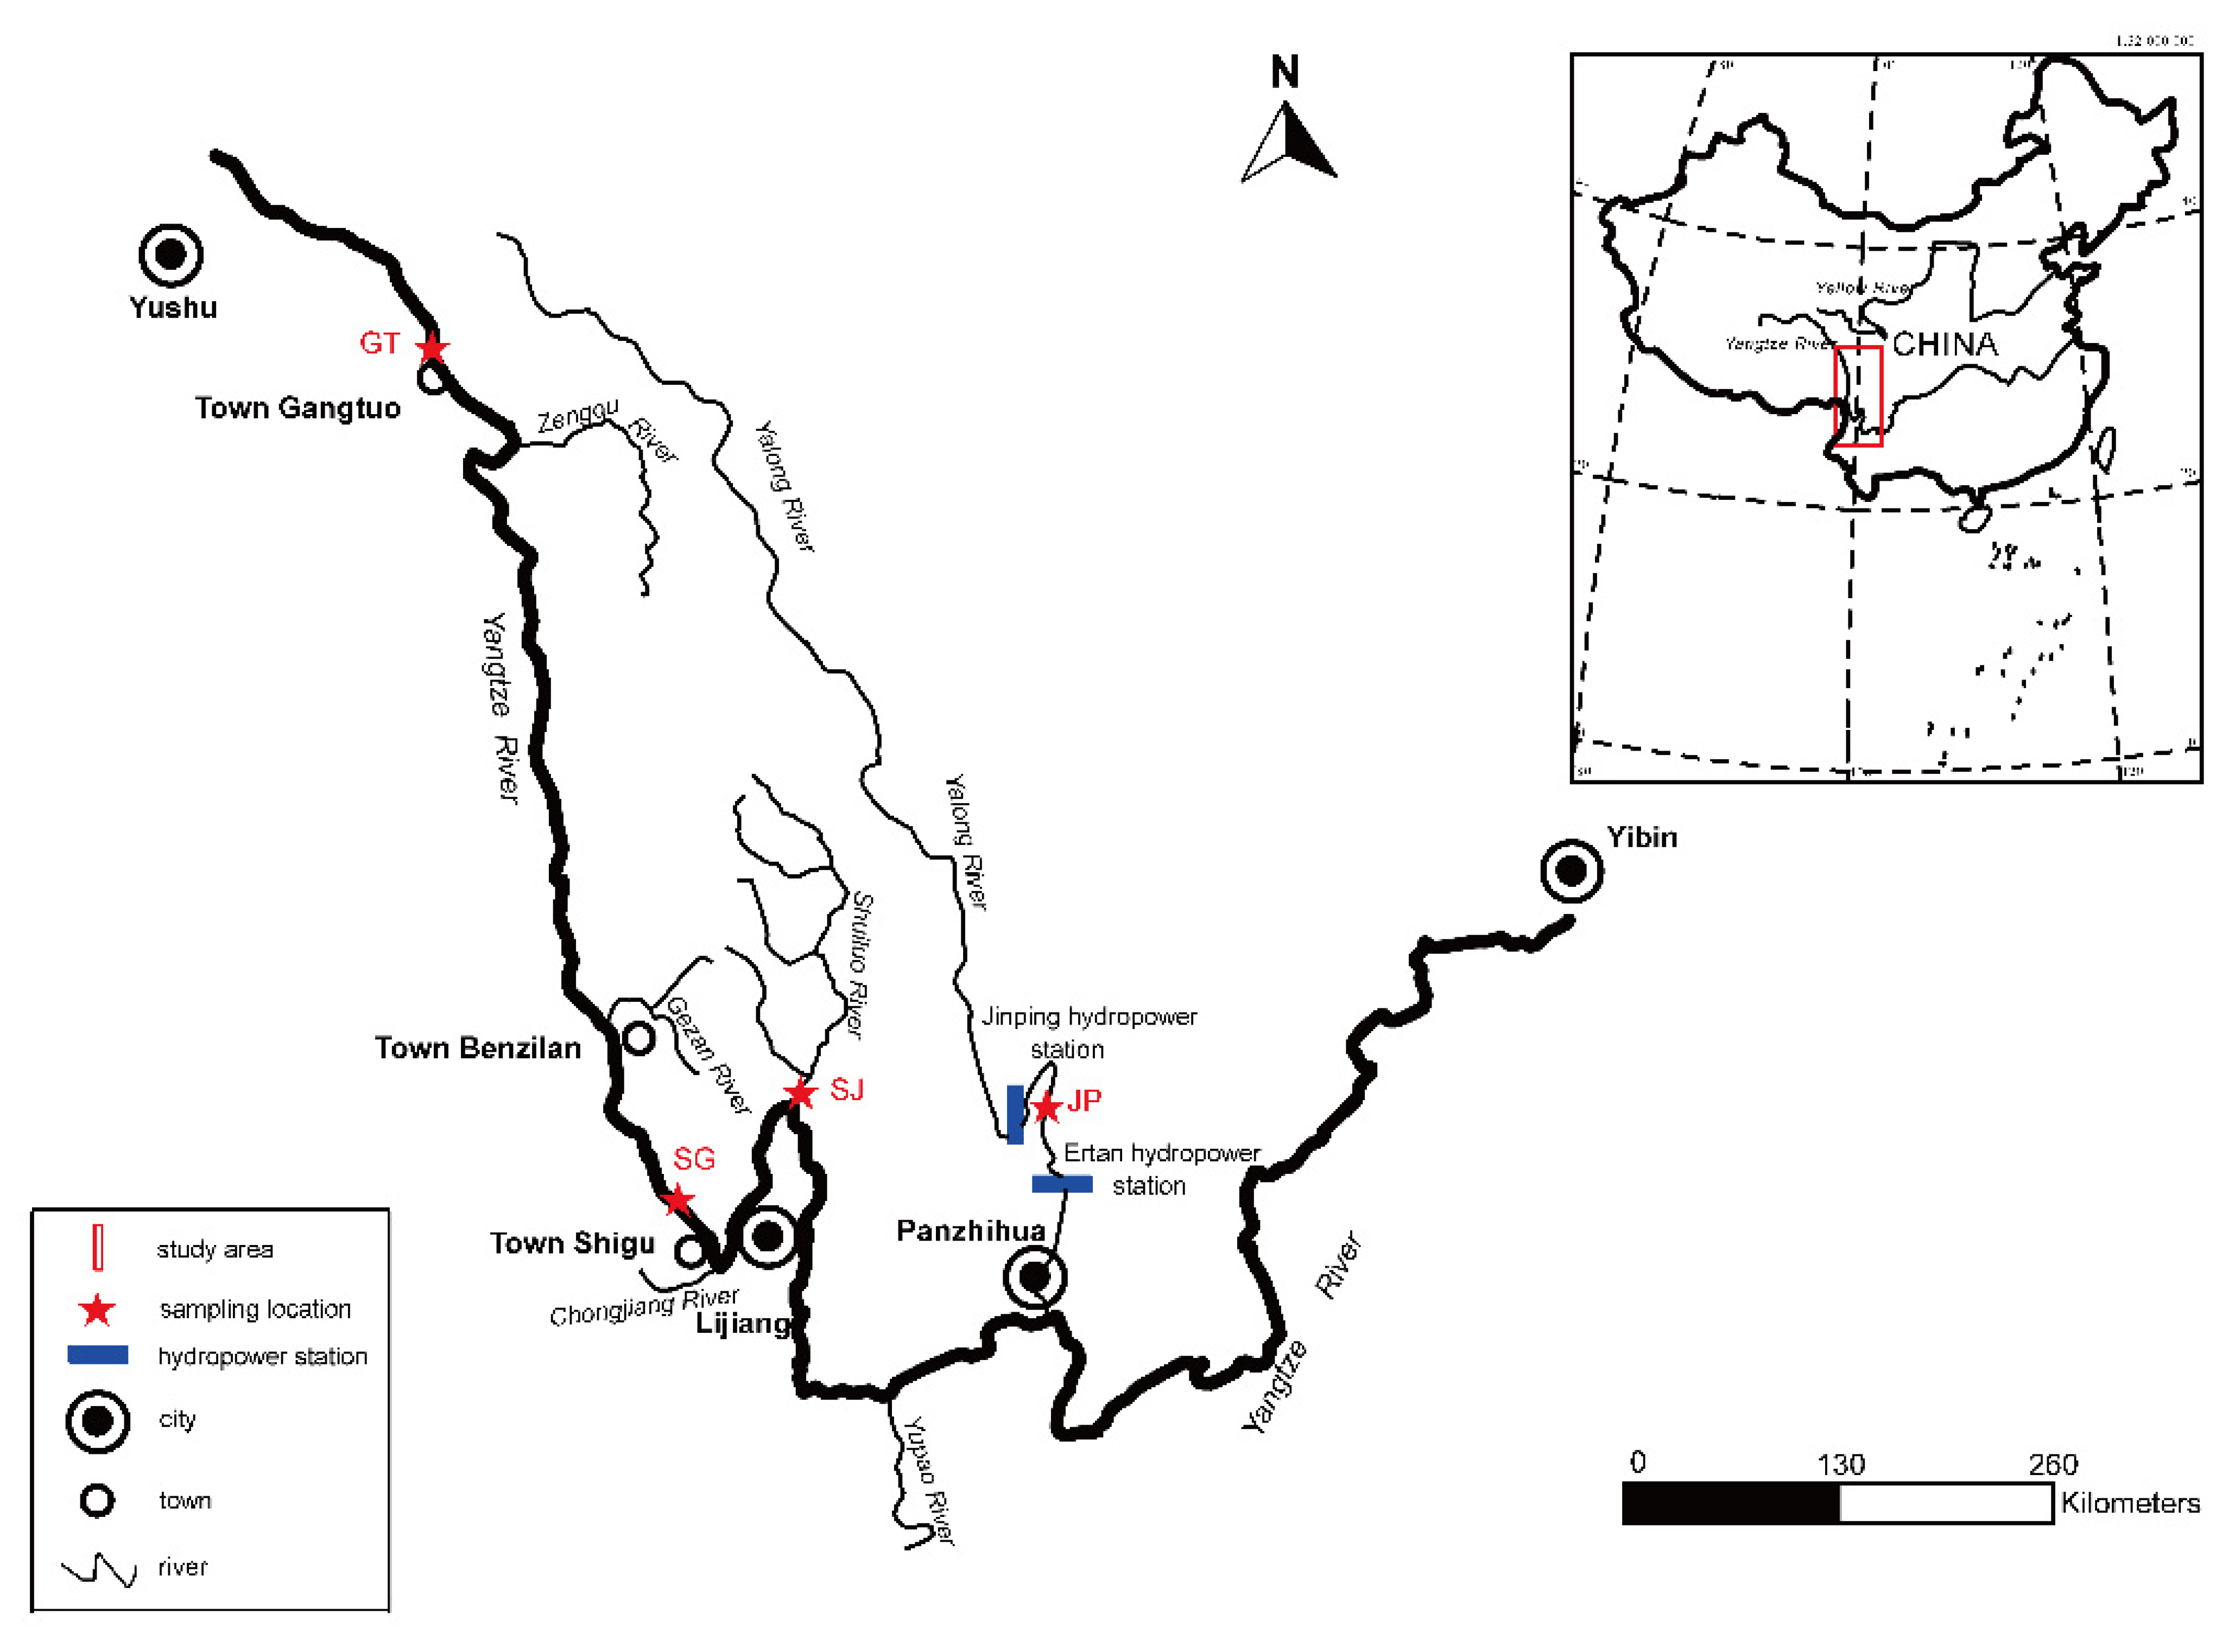
2.1. Field Sampling

Fishes from four locations along the upper Yangtze River were collected: Gangtuo in the Jinsha River (one section from Yushu to Yibin of the mainstream of the upper Yangtze River is called as Jinsha River) (GT), Shigu in the Jinsha River (SG), Sanjiangkou in the Shuiluo River (SJ) and Jinping in the Yalong River (JP) (Figure 1, Table 1). GT and SG were from the mainstream of the upper Yangtze River, while SJ and JP were from the tributaries (Shuiluo River and Yalong River) of the upper Yangtze River. For all samples, standard length (mm), body weight (g) and sex were recorded. One pair of lapillus (hereafter referred to as otoliths) were removed and stored in labelled plastic tubes. Collected fin rays were stored in 95% alcohol at −20 °C for genetic analyses.
During the fish collections, environmental surveys of the sampling locations recorded longitude, latitude and altitude. Water temperature (including mean annual water temperature, minimum annual water temperature, maximum annual water temperature and mean monthly water temperature) were automatically measured by HOBO Temperature Data Loggers UA-002-64 (Onset Company, Massachusetts, USA) every day for one year during the sampling. For example, water temperature was measured in 2017 at GT population and SJ population, in 2016 at SG population and JP population. In 2016 and 2017, all the otolith samples were collected, while in 2018 and 2019 some genetic samples were added in further analysis.

2.2. Isotope Analysis

For each sample location, seven to twelve left otoliths were selected for stable isotope analysis, while right otoliths were used for age estimation. Prior to analysis, all otoliths were rinsed with deionized water, cleaned ultrasonically for 3 min, dried under vacuum at a temperature of 55 °C for 12 h, and weighted by an electronic analytical balance. Each otolith was enclosed by silver paper, ground with a pestle and the powder was carefully collected into a labelled plastic tube. The isotopic composition (δ18O and δ13C) of the powdered otolith samples and water samples were analyzed by GasBench II-IRMS Delta V Advantage stable isotope mass spectrometry (Thermo Fisher Scientific Co., Massachusetts, USA). The δ18O and δ13C values were reported in conventional delta (δ) notation in per mil (‰), relative to the VPDB (otolith samples) and VSMOW (water samples): δ = [(Rsample − Rstandard)/Rstandard] × 1000 (‰), where R is the 18O/16O or 13C/12C isotopic ratio in the sample or standard. Replicate analysis of internal standards gave an analytical precision of 0.2‰.

2.3. DNA Extraction, Amplification and Sequencing

Total genomic DNA was extracted using Tissue DNA Kit (D3396) (Omega Bio-Tek, Georgia, USA), following the manufacturer’s specifications. Fragments of the mitochondrial cytochrome b (Cytb) and cytochrome oxidase subunit I (COI) genes were amplified by means of polymerase chain reaction (PCR). The primers L14724 and H15915 for Cytb [29] were used, and, for COI, the primers COI-F and COI-R [30] were used. Polymerase chain reactions (PCRs) were performed in a volume of 30 μL, containing the following: 15 μL of 2 × PowerTaqPCRMasterMix, 1 μL of each primer (10 mM), 1 μL DNA and 12 μL Milli-Q water to a final volume. The thermocycling protocol for both molecular markers involved denaturation for 5 min at 95 °C, 35 cycles for 30 s at 95 °C, 30 s for 58 °C, 1min extension at 72 °C, and a final extension for 5 min at 72 °C. Amplifications were verified by electrophoresis on 1% agarose gels. Successful amplifications were sequenced in both directions (TIANYI HUIYUAN Inc., Wuhan, China) by using the same primers as employed for amplification.

2.4. Data Analysis

Before all analysis, the values from δ13C, δ18O, otolith mass and environmental variables were standardized by using z-score method. After testing for normality (Shapiro–Wilk Test, p > 0.05) and homogeneity of variances (Levene’s Test, p > 0.05), δ13C and δ18O values of S. kozlovi were analyzed among locations by an analysis of covariance (ANCOVA). Considering that fish samples were comprising of multiple age classes, ANCOVA was analyzed with otolith mass as a covariate, including the assessment of the interaction effect (locations × otolith mass). A post hoc Dunnett’s T3 test was used to examine the existence of any significant differences in the isotopic ratios of carbon and oxygen between any two locations. To determine whether there was greater separation of locations when both stable isotopes were considered simultaneously in a multivariate analysis, a Permutational ANOVA (PERMANOVA) [31,32] was used to test for effects of location on both δ18O and δ13C. Regression analysis was used to evaluate relationships between ambient temperature variables and stable isotopes of wild S. kozlovi. All the analyses were conducted in SPSS software, except for PERMANOVA in R software.
The mitochondrial Cytb and COI gene sequences were edited and aligned in MEGA v6.0 software [33]. The two genes were concatenated in PhyloSuite software [34] to analyze the information jointly and to increase the possibility of detecting differences among sampling sites. Haplotype diversity, nucleotide diversity, variable sites, singleton variable sites and parsimony-informative sites were estimated in DnaSP v6 [35]. To explore the phylogeographic pattern, a minimal spanning network of concatenated sequence data was constructed using the median joining method [36] in the PopART software [37]. Population genetic structure and pairwise FST was investigated to test for genetic variation within and among populations by using analysis of molecular variance (AMOVA) in Arlequin 3.5 software [38]. In addition, we assessed population structure with a genetic-mixture analysis based on Bayesian inference in BAPS 6.0 software [39]. The range of K-population values (clusters: 2–10) was run 10 times and with 1000 iterations to increase the probability of finding the best partition. Whether S. kozlovi showed signs of population expansion, bottleneck or decline was tested with Tajima’s D and Fu’s FS statistic in Arlequin 3.5 software, as well as by drawing a diagram of the frequency distribution of pair-wise genetic differences in the program DnaSP v6.

3. Results

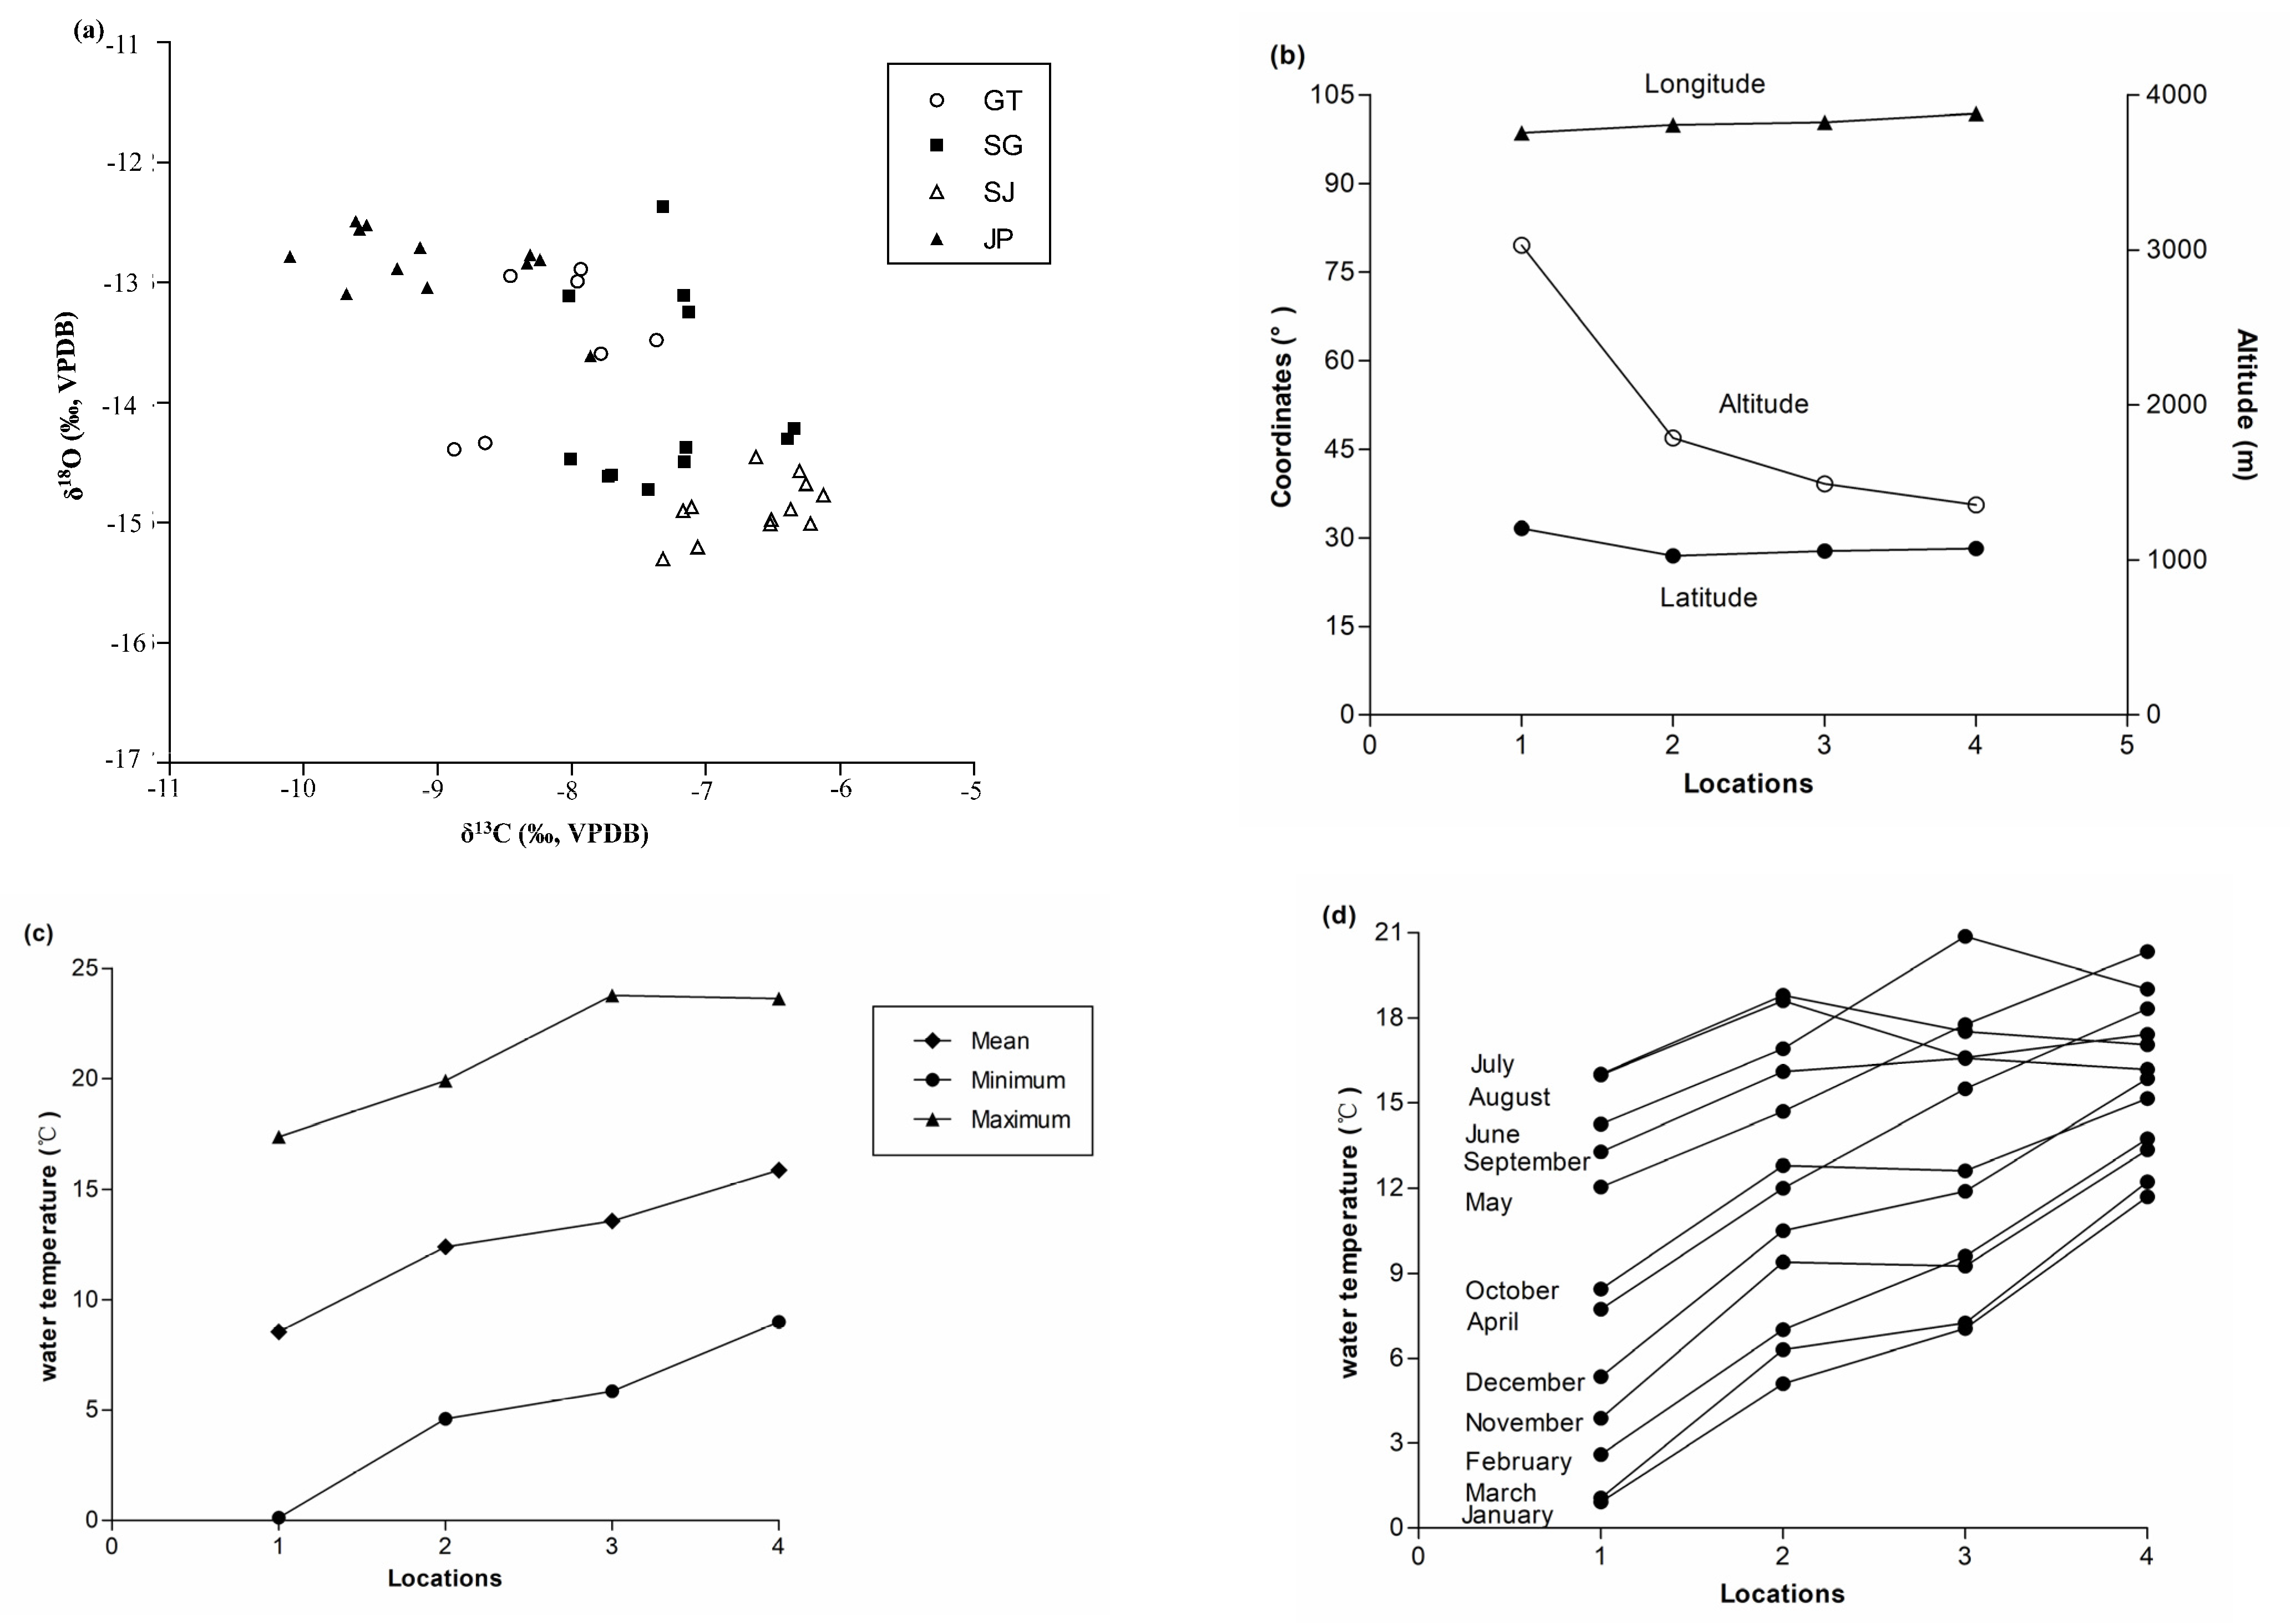
3.1. Stable Isotope Ratios of S. kozlovi Otolith

The values of S. kozlovi otolith stable isotope ratios varied from −15.30‰ to −12.37‰ for δ18O and from −10.10‰ to −6.13‰ for δ13C (Figure 2a). On average, population JP (Yalong River) showed the highest value of δ18O and the lowest value of δ13C, when comparing with other sampling locations. ANCOVA yielded significant variation of δ18O and δ13C among different locations with otolith mass as a covariate (p < 0.001). For δ13C, 77.7% of the sum of squares was explained by location (ANCOVA, p = 0.000, Table 2) and otolith mass was not significant (ANCOVA, p = 0.09). For δ18O, 70.7% of the sum of squares was explained by location (ANCOVA, p = 0.000, Table 2) and otolith mass was not significant (ANCOVA, p = 0.52). The pairwise comparison tests showed significant differences among all locations for each isotopic signature (p < 0.05), with the exceptions of population GT and population SG (δ18O: Dunnett’s T3 Test, p = 0.69), and population GT and population JP (δ18O: Dunnett’s T3 Test, p = 0.15) values.
The PERMANOVA revealed that 99.5% of the sum of squares was explained by location for multi-isotopic signatures (p = 0.001, Table 2), which was more clearly based on single stable isotopes than ANCONA. The a posteriori pairwise tests indicated that all locations were insignificantly different from each other at p > 0.05 except for population GT and population SJ (p = 0.001), and population SJ and population JP (p = 0.001). The bi-plot using the two variables (oxygen and carbon) suggest that the isotopic signatures appear to be site-specific (Figure 2a).

3.2. Correlations between Ambient Temperature and Otolith Stable Isotope Ratios

Population GT with the highest altitude located on the area with largest latitude and smallest longitude, compared with other populations (Figure 2b). Population JP with the lowest altitude was located in the area with largest longitude, while population SG was located in the area with smallest latitude (Figure 2b). Annual changes of ambient water temperature in each sampling location are quite different, such as population GT varying from 0.12 °C to 17.38 °C, population SG from 4.60 °C to 19.90 °C, population SJ from 5.86 °C to 23.77 °C, population JP from 9.00 °C to 23.63 °C (Figure 2c,d).
There were weak but significant negative relations between δ13C and five mean monthly water temperature variables (January (r2 = 0.15, p = 0.01), February (r2 = 0.11, p = 0.03), March (r2 = 0.10, p = 0.04), November (r2 = 0.12, p = 0.03), December (r2 = 0.15, p = 0.01)) while a weak but significant positive relation between δ13C and mean July water temperature was obtained (r2 = 0.17, p = 0.01). There were weak but significant positive relationships between δ18O and three mean monthly water temperature variables (January (r2 = 0.10, p = 0.04), November (r2 = 0.09, p = 0.04) and December (r2 = 0.10, p = 0.03)).

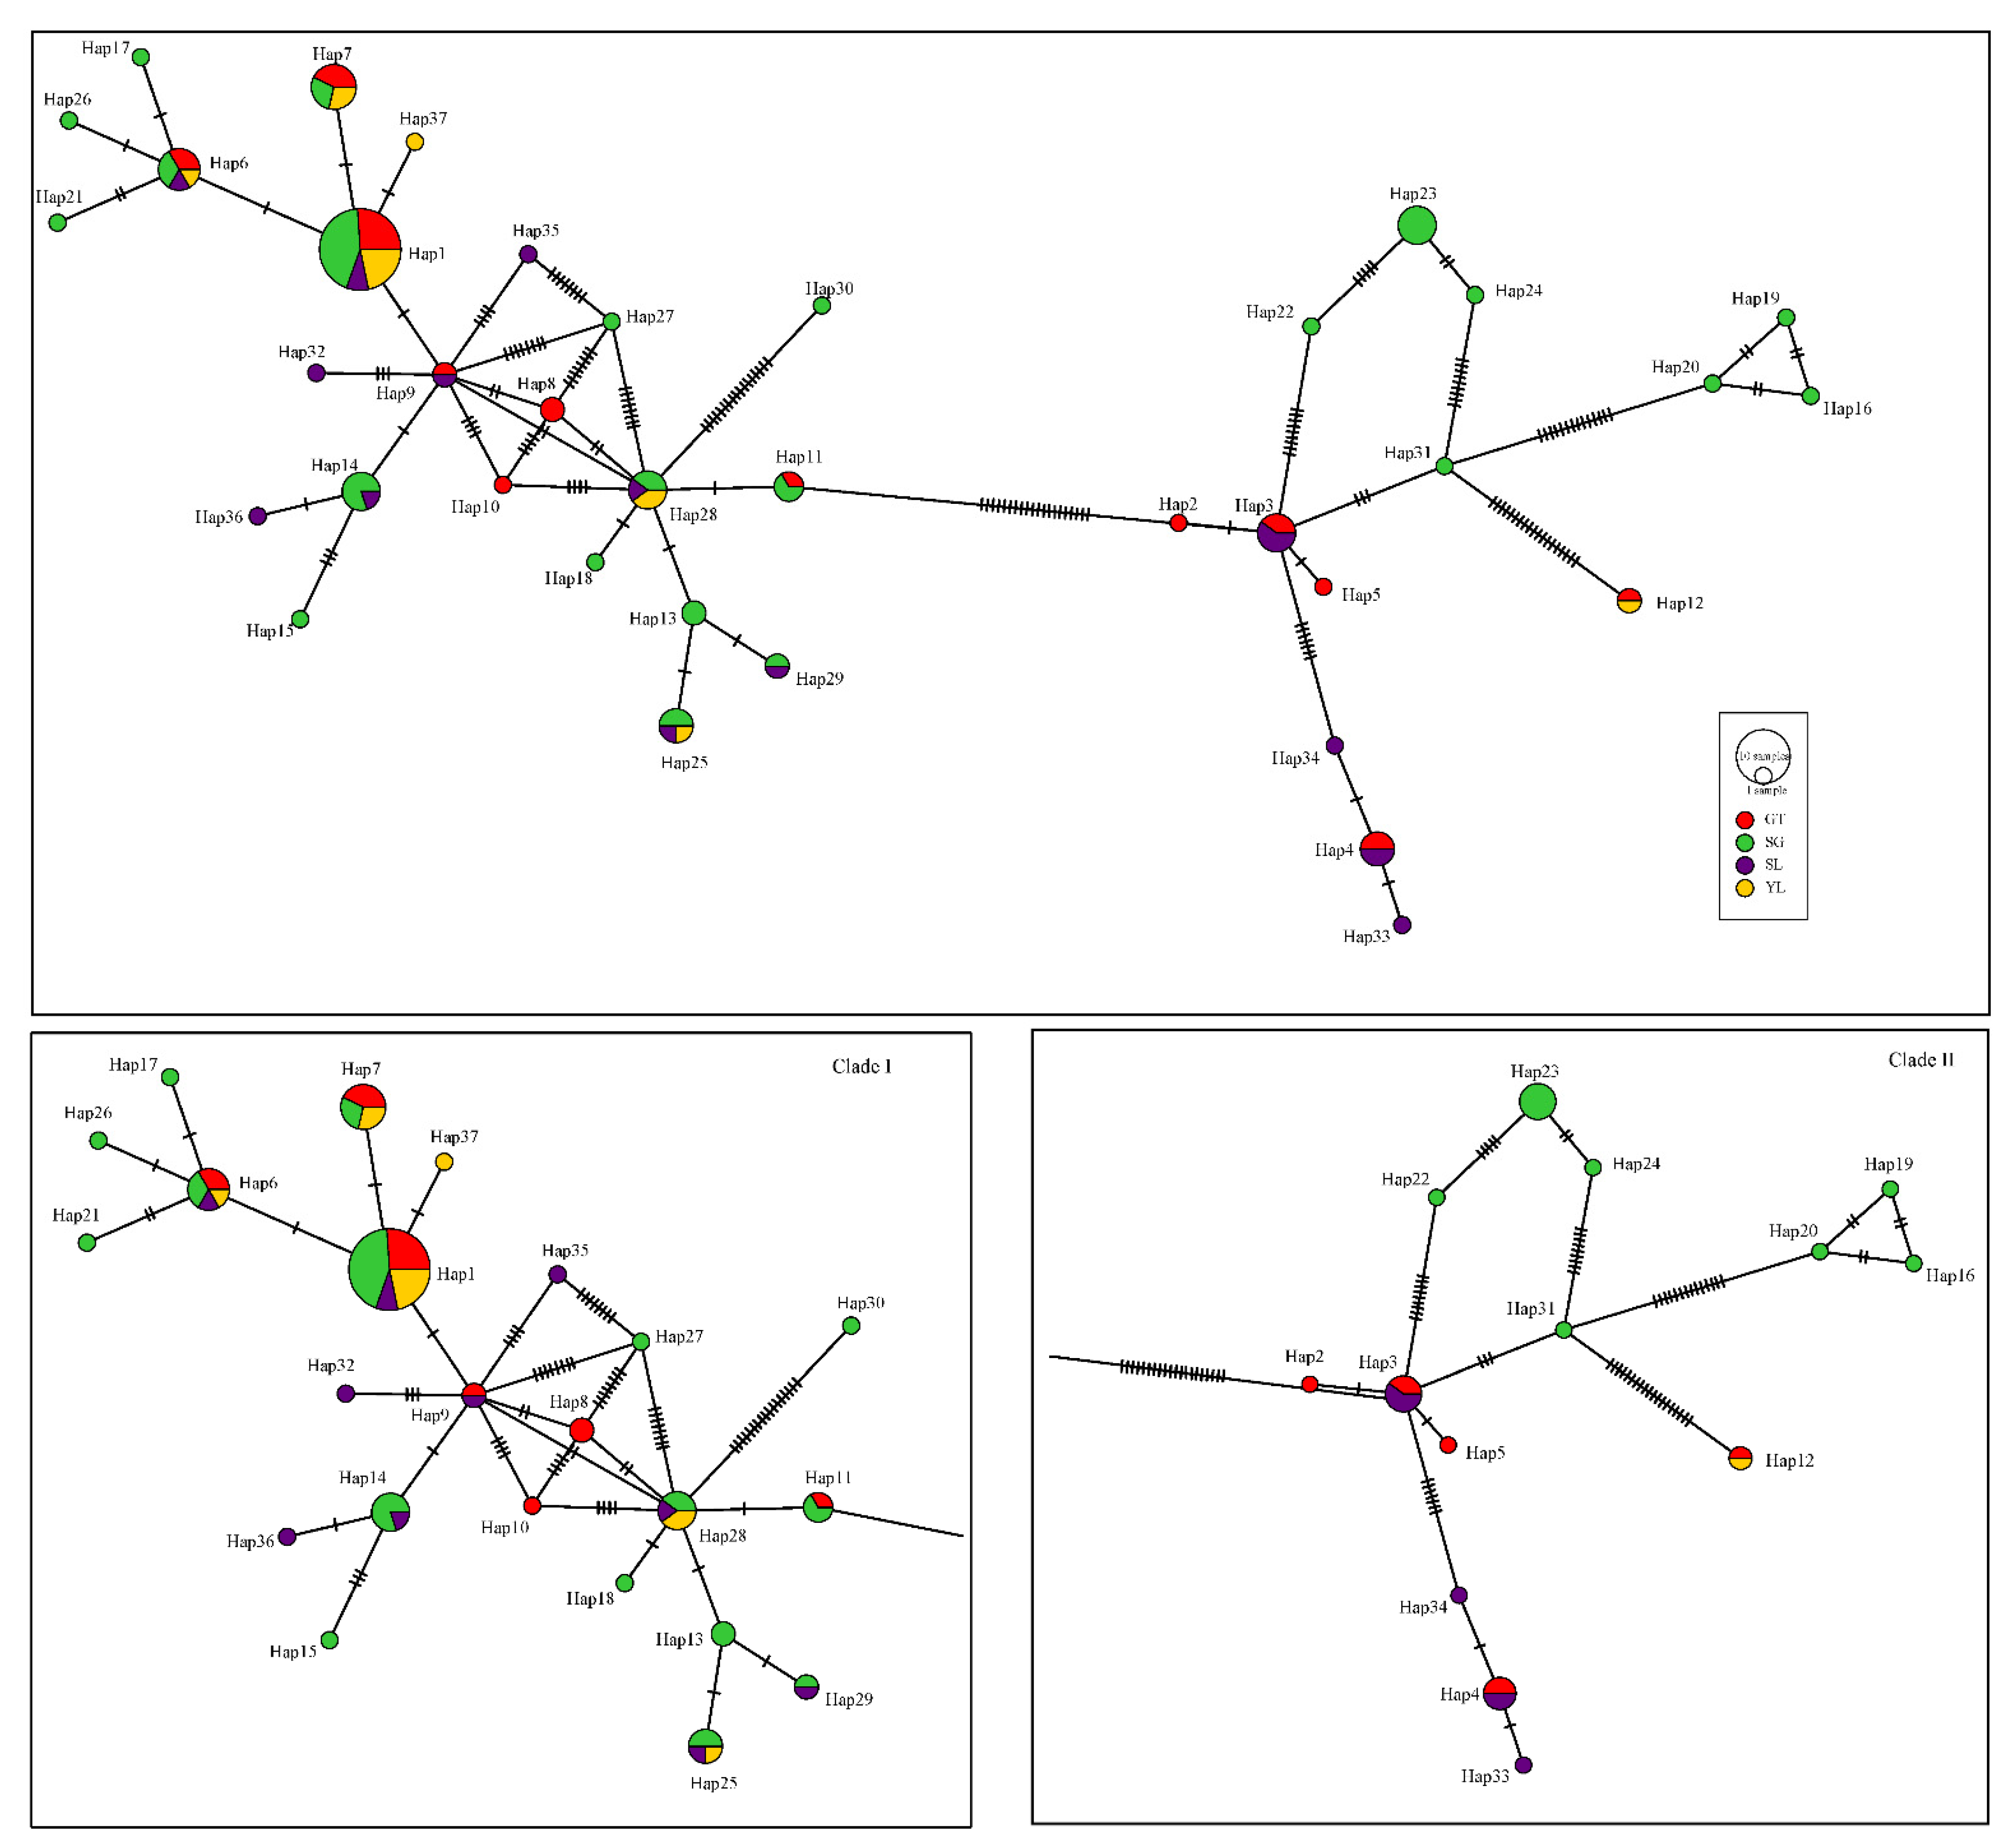
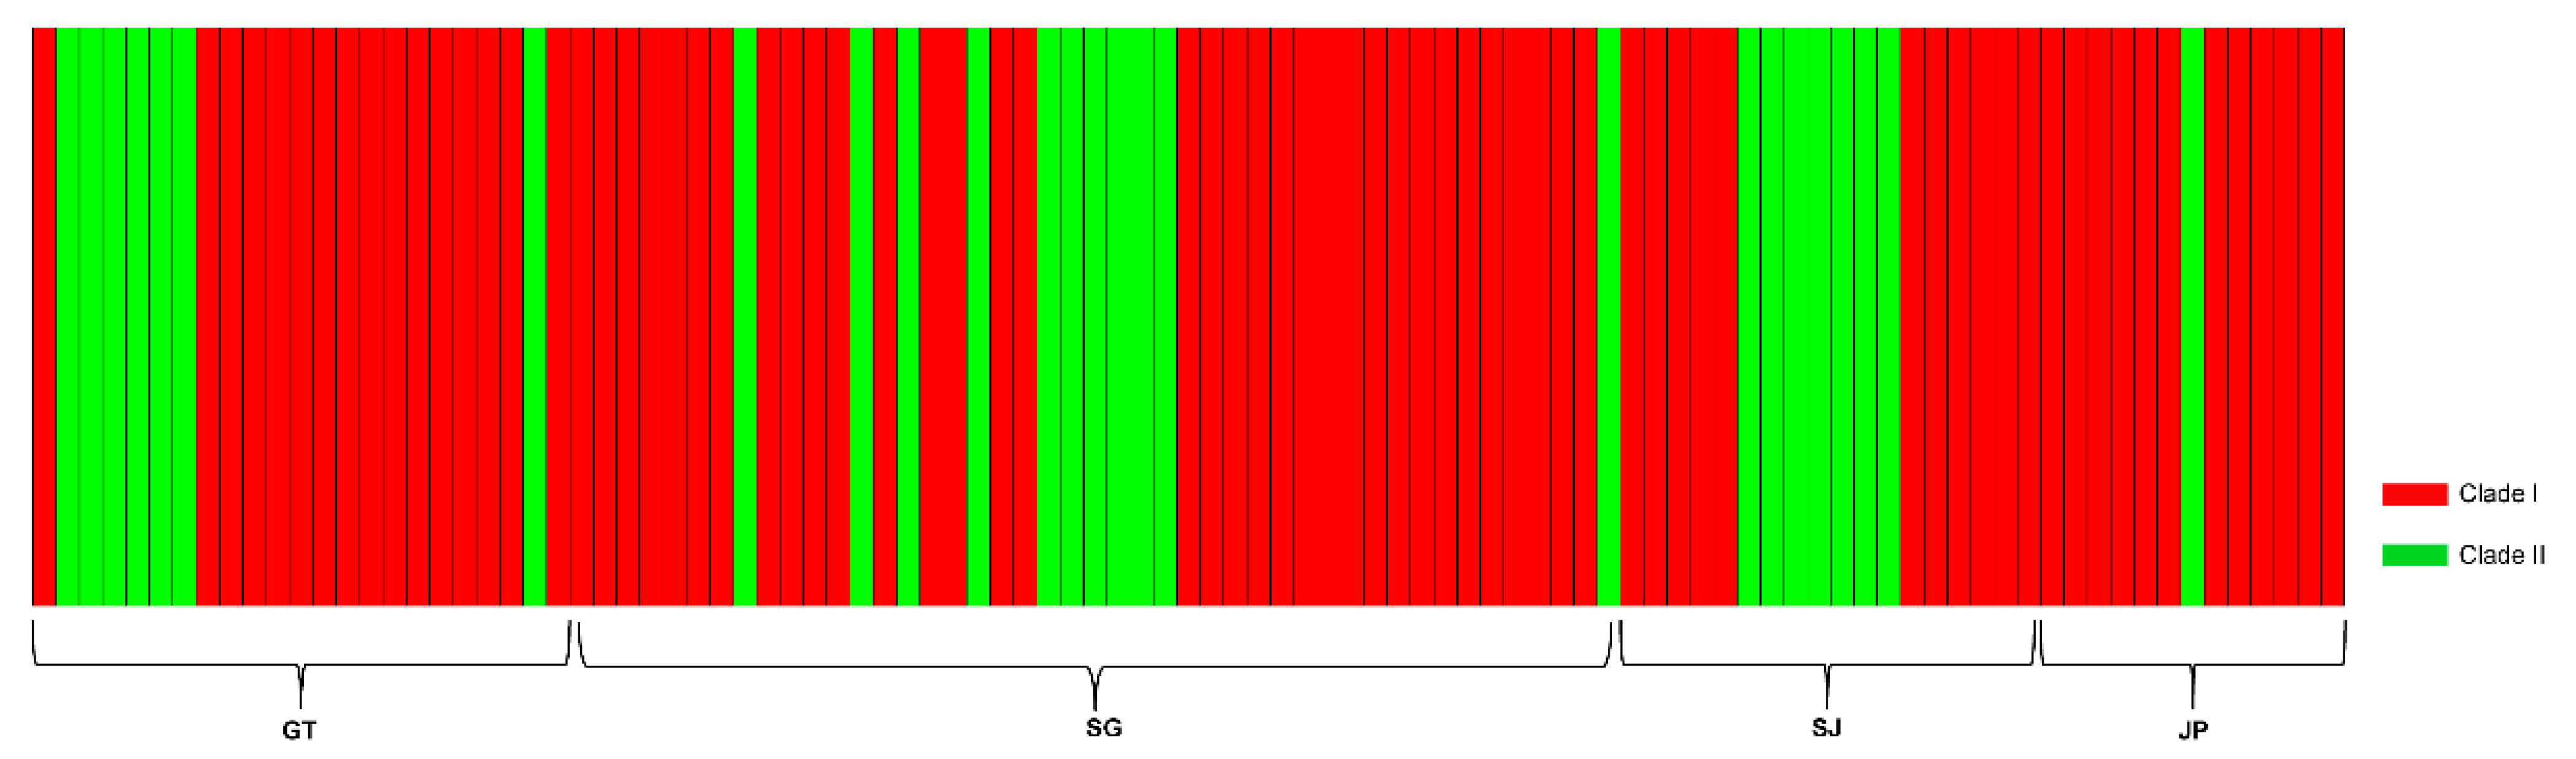
3.3. Genetic Diversity and Structure

Fragments 683 bp in length encoding the COI gene (GenBank Accession numbers: MW403091-MW403127) and 1141 bp in length encoding the Cytb gene (GenBank Accession numbers: MW401231-MW401267) were obtained from 99 specimens, yielding a total length of 1824 bp of concatenated sequence. For the Cytb gene, variable sites, singleton variable sites, and parsimony-informative sites were 84, 26 and 58, respectively. For the COI gene, variable sites, singleton variable sites, and parsimony-informative sites were 16, 4 and 12, respectively. In total, 37 haplotypes were identified based on the concatenated sequences of Cytb and COI, with the number of haplotypes varying between 7 and 23 among locations. Population SJ exhibited the highest haplotype diversity (0.967 ± 0.030), while population SG exhibited the highest nucleotide diversity (0.00871 ± 0.00124) (Table 3). Population JP presented the lowest haplotype diversity (0.846 ± 0.085) and nucleotide diversity (0.00361 ± 0.00199) (Table 3).
The most frequent haplotype (Hap1, n = 23) was found at all sampling locations. Four haplotypes (Hap2, Hap5, Hap8, Hap10) were unique to population GT in the Jinsha River, fifteen haplotypes (Hap13, Hap15-Hap24, Hap26-Hap27, Hap30-Hap31) were unique to population SG in the Jinsha River, five haplotypes (Hap32-Hap36) were unique to population SJ in the Shuiluo River, while only one haplotype (Hap37) was unique to population JP in the Yalong River.
The haplotype network based on the concatenated sequences resulted in two distinct lineages (Figure 3) while the Bayesian inference also detected two different clusters, with a log (marginal likelihood) optimal partition of −1691.8028 (Figure 4). Clade I, included 73/99 (73.7%) of the samples and was documented in all sampling locations while Clade II included 26/99 (26.3%) of the samples and was also found in all sampling locations.
The AMOVA detected that the highest percentage of genetic variance was within sampling locations (96.94%), and little genetic variance was found among sampling locations (3.06%) (Table 4). Meanwhile, the larger percentage of genetic variation was found between two clades (72.82%), and a smaller genetic variance was found within clades (27.18%). Pairwise FST comparison indicated significant differences between SJ and JP (FST = 0.159, p = 0.017), while no significant differences were found between other sampling locations (Table 5).
There was no direct evidence of population expansion, decline or bottleneck in the species, by the distribution of pair-wise sequence differences (Figure 5), Tajima’s D (−0.91, p = 0.19) or Fu’s FS (−2.13, p = 0.34).

4. Discussion

Using a combination of markers may help reach a better understanding of population structure and connectivity. The mitochondrial DNA of S. kozlovi in the present study shows limited geographic structuring between populations but shows high structuring between haplotype lineages. Carbon and oxygen isotopic ratios varied significantly between most geographic locations. By and large, it exhibits a limited geographic population structuring of wild S. kozlovi in the upper Yangtze River.
The genetic diversity of populations is usually evaluated by haplotype diversity and nucleotide diversity. In the present study, haplotype diversity and nucleotide diversity of wild S. kozlovi in the upper Yangtze River was 0.928 and 0.00778, which is larger than 0.5 and 0.5%, both exhibiting high levels. It indicates that the high level of divergence between haplotypes of wild S. kozlovi in the upper Yangtze River may be attributed to secondary contact between previously differentiated allopatric lineages [40]. Comparing with the results from Wujiang population of S. kozlovi, based on mtDNA control region sequences [41], higher haplotype diversity and nucleotide diversity of wild S. kozlovi in the upper Yangtze River was brought to light in the present study. In contrast to S. molesworthi in the Yarlung Zangbo River [27], both haplotype diversity and nucleotide diversity of S. kozlovi was higher.
Most of the FST values between the populations of S. kozlovi were in small levels of genetic differentiation (FST < 0.05), except for one in a moderate level (JP_GT, FST = 0.055) and one in a great level (JP_SJ, FST = 0.159) [42]. In addition, the population JP of S. kozlovi possessed the highest oxygen isotopic ratios, the lowest carbon isotopic ratios, the lowest haplotype diversity and nucleotide diversity. According to the findings, the population JP of S. kozlovi in the Yalong River should be paid more attention. Population JP is located between two large hydropower dams (Ertan hydropower station and Jinping hydropower station) in the Yalong River, which is the tributary of the upper Yangtze River. Ertan hydropower station and Jinping hydropower station, with the dam height of 240 m and 305 m, have been impounding water since 1998 and 2012, respectively. This means population JP of S. kozlovi has been isolated for eighteen years, and the water temperature of its habitat has been regulated by Jinping hydropower station but not following natural environmental changes. Gene flow between population JP and other populations has been greatly limited in recent years. Furthermore, the water temperature of population JP’s habitat fluctuates within ±1.3 °C in each 12 h by the effect of Jinping hydropower station, while population GT varied within ±2.8 °C in each 12 h by natural environmental changes through our field investigation. Mean water temperature of population JP’s habitat from each month was generally much higher than other populations. That is, the habitat environment of population JP was quite different from other populations.
Nevertheless, AMOVA revealed a significant genetic differentiation between two haplotype lineages of S. kozlovi (Clade I and Clade II, FST = 0.728 > 0.25). No matter how large the sample size is, there are two lineages in each geographical population. Clade I possess 73.7% individuals of all populations, while Clade II has only 26.3% individuals. In population GT, SG and SJ, 69.6%, 75.6% and 61.1% individuals belong to Clade I, respectively, while only 30.4%, 24.4% and 38.9% individuals belong to Clade II. Simultaneously, 92.3% of individuals in population JP belong to Clade I, while only 7.7% individuals belong to Clade II. In general, Clade I was relatively the most primitive lineage, while Hap 1 in Clade I was the most primitive haplotype.
Studies on the genetic structure and phylogenetic geographical pattern of fish populations can provide scientific basis for the conservation management of species. Although haplotype diversity and nucleotide diversity of wild S. kozlovi in the upper Yangtze River were in relatively high levels, genetic differentiation between populations or between lineages began to emerge, which is the most important signal for the conservation of this fish species. Therefore, the conservation of this species should be conducted because of its isolated and declining populations. According to the principle of evolutionarily significant units (ESUs) and management units (MUs) [43], two haplotype lineages (Clade I and Clade II) of S. kozlovi in the upper Yangtze River should be suggested as two management units for independent conservation. Furthermore, it is suggested that population JP should also be conserved as a management unit because of its low genetic diversity, low heterogeneity of habitat environment and high effect of anthropogenic activities.

5. Conclusions

Both mitochondrial DNA markers (Cytb and COI) and otolith stable isotope ratios (δ18O and δ13C) were used to explore the spatial population structure of wild S. kozlovi in the upper Yangtze River, and then to correlate the structure with ambient temperature changes. Exhibiting high haplotype diversity and nucleotide diversity, wild S. kozlovi showed limited geographic population structuring and two distinct haplotype lineages (Clade I and Clade II). Significant relationships between otolith stable isotope ratios and specific mean monthly water temperature (from November to March) were also revealed, indicating low temperature effect on otolith stable isotope ratios. In particular, the population JP (Jinping) of S. kozlovi with low genetic diversity and low heterogeneity of habitat environment is suggested as a management unit for independent conservation.

Author Contributions

Y.H. conceived, designed and performed the experiments, and wrote the manuscript. J.G. and X.W. collected the fish samples. Y.Z. and D.Y. revised the manuscript. All authors have read and agreed to the published version of the manuscript.

Funding

This work was supported by the National Natural Science Foundation of China (51609255) and by the financial investigation project of Ministry of Agriculture and Rural Affairs of China (CJDC-2017-01).

Institutional Review Board Statement

The animal study protocol was approved by the Institutional Ethics Committee of Yangtze River Fisheries Research Institute, Chinese Academy of Fishery Sciences (protocol code 2019-YFI-HYF-01 and date of approval was 27 March 2019).

Informed Consent Statement

Not applicable.

Data Availability Statement

Not applicable.

Acknowledgments

The authors are grateful to T.D. and M.Z. for their helps in collecting fish samples.

Conflicts of Interest

The authors declare no conflict of interest.

References

  1. Chen, Y.X. The genetic characterization and population genetic diversity of Schizothorax kozlovi (Nikolsky). Ph.D. Thesis, Sichuan Agricultural University, Ya’an, China, 2013. [Google Scholar]
  2. Wu, J.M.; Zhao, H.T.; Miao, Z.G.; Chen, Y.X.; Zhang, F.T.; Wang, J.W. Status and conservation of fish resources in the Chishui River. Biodiv. Sci. 2010, 18, 162–168. [Google Scholar]
  3. Wu, L. The Fishes of Guizhou; Guizhou People’s Press: Guiyang, China, 1989; p. 191. [Google Scholar]
  4. Yue, P.Q. Fauna Sinica: Osteichthyes–Cypriniformes III; Science Press: Beijing, China, 2000; pp. 327–328. [Google Scholar]
  5. Chen, Y.X.; Luo, Q.S. Study on reproductive ecology and biology of Schizothorax kozlovi: V propagation population and reproductive behavior. J. Bijie Teach. Coll. 1997, 1, 1–5. [Google Scholar]
  6. Zou, X.J. Study on Karyotype and Genetic Diversity in the Population of Schizothorax (Racoma) kozlovi. Master’s Thesis, Guizhou University, Guiyang, China, 2009. [Google Scholar]
  7. Campana, S.E.; Neilson, J.D. Microstructure of fish otoliths. Can. J. Fish. Aquat. Sci. 1985, 42, 1014–1032. [Google Scholar] [CrossRef]
  8. Gao, Y.W.; Beamish, R.J. Isotopic composition of otoliths as a chemical tracer in population identification of sockeye salmon (Oncorhynchus nerka). Can. J. Fish. Aquat. Sci. 1999, 56, 2062–2068. [Google Scholar] [CrossRef]
  9. Bastow, T.P.; Jackson, G.; Edmonds, J.S. Elevated salinity and isotopic composition of fish otolith carbonate: Stock delineation of pink snapper, Pagrus auratus, in Shark Bay, Western Australia. Mar. Biol. 2002, 141, 801–806. [Google Scholar] [CrossRef]
  10. Dufour, E.; Patterson, W.P.; Höök, T.; Rutherford, E.S. Early life history of Lake Michigan alewives (Alosa pseudoharengus) inferred from intra-otolith stable isotope ratios. Can. J. Fish. Aquat. Sci. 2005, 62, 2362–2370. [Google Scholar] [CrossRef] [Green Version]
  11. Huxham, M.; Kimani, E.; Newton, J.; Augley, J. Stable isotope records from otoliths as tracers of fish migration in a mangrove system. J. Fish. Biol. 2007, 70, 1554–1567. [Google Scholar] [CrossRef]
  12. Campana, S.E. Chemistry and composition of fish otoliths: Pathways, mechanisms and applications. Mar. Ecol. Prog. Ser. 1999, 188, 263–297. [Google Scholar] [CrossRef] [Green Version]
  13. Solomon, C.T.; Weber, P.K.; Cech, J.J.; Ingram, B.L.; Conrad, M.E.; Machavaram, M.V.; Pogodina, A.R.; Franklin, R.L. Experimental determination of the sources of otolith carbon and associated isotopic fractionation. Can. J. Fish. Aquat. Sci. 2006, 63, 79–89. [Google Scholar] [CrossRef]
  14. Gao, Y.W.; Joner, S.H.; Bargmann, G.G. Stable isotopic composition of otoliths in identification of spawning stocks of Pacific herring (Clupea pallasi) in Puget Sound. Can. J. Fish. Aquat. Sci. 2001, 58, 2113–2120. [Google Scholar] [CrossRef]
  15. Nelson, C.S.; Northcote, T.G.; Hendy, C.H. Potential use of oxygen and carbon isotopic composition of otoliths to identify migratory and non-migratory stocks of the New Zealand common smelt: A pilot study. N. Z. J. Mar. Freshwater Res. 1989, 23, 337–344. [Google Scholar] [CrossRef]
  16. Edmonds, J.S.; Fletcher, W.J. Stock discrimination of pilchards Sardinops sagax by stable isotope ratio analysis of otolith carbonate. Mar. Ecol. Prog. Ser. 1997, 152, 241–247. [Google Scholar] [CrossRef]
  17. Campana, S.E. Otolith science entering the 21st century. Mar. Freshw. Res. 2005, 56, 485–495. [Google Scholar] [CrossRef] [Green Version]
  18. Gao, Y.W.; Dettman, D.L.; Piner, K.R.; Wallace, F.R. Isotopic correlation (δ18O and δ13C) of otoliths in identification of groundfish stocks. Trans. Am. Fish. Soc. 2010, 139, 491–501. [Google Scholar] [CrossRef]
  19. Newman, S.J.; Pember, M.B.; Rome, B.M.; Mitsopoulos, G.E.A.; Skepper, C.L.; Allsop, Q.; Saunders, T.; Ballagh, A.C.; Van Herwerden, L.; Garrett, R.N.; et al. Stock structure of blue threadfin Eleutheronema tetradactylum across northern Australia as inferred from stable isotopes in sagittal otolith carbonate. Fish. Manag. Ecol. 2011, 18, 246–257. [Google Scholar] [CrossRef]
  20. Shen, J.; Gao, Y. Stable isotope analyses in otoliths of silver carp: A pilot study in identification of natal sources and stock differences. Environ. Biol. Fish. 2012, 95, 445–453. [Google Scholar] [CrossRef]
  21. Neves, A.; Vieira, A.R.; Sequeira, V.; Paiva, R.B.; Janeiro, A.I.; Gaspar, L.M.; Gordo, L.S. Otolith shape and isotopic ratio analyses as a tool to study Spondyliosoma cantharus population structure. Mar. Environ. Res. 2019, 143, 93–100. [Google Scholar] [CrossRef]
  22. Avise, J.C. Phylogeography: The History and Formation of Species; Harvard University Press: Cambridge, MA, USA, 2000. [Google Scholar]
  23. Grant, W.S.; Cheng, W. Incorporating deep and shallow components of genetic structure into the management of Alaskan red king crab. Evol. Appl. 2012, 5, 820–837. [Google Scholar] [CrossRef]
  24. Guerra, Á.; Roura, Á.; González, Á.F.; Pascual, S.; Cherel, Y.; Pérez-Losada, M. Morphological and genetic evidence that Octopus vulgaris Cuvier, 1797 inhabits Amsterdam and Saint Paul Islands (southern Indian Ocean). ICES J. Mar. Sci. 2010, 67, 1401–1407. [Google Scholar] [CrossRef] [Green Version]
  25. Kang, J.H.; Park, J.Y.; Choi, T.J. Genetic differentiation of octopuses from different habitats near the Korean peninsula and eastern China based on analysis of the mDNA cytochrome C oxidase 1 gene. Genet. Mol. Res. 2012, 11, 3988–3997. [Google Scholar] [CrossRef]
  26. Muhammad, F.; Chen, W.; Liu, L.; Gong, L.; Xun, D.; Shafi, M.; Lü, Z. Genetic structure of Amphioctopus fangsiao (Mollusca, Cephalopoda) in Chinese waters inferred from variation in three mtDNA genes (ATPase 6, ND2, and ND5). Hydrobiologia 2019, 838, 111–119. [Google Scholar] [CrossRef]
  27. Yu, D.; Zhang, Z.; Zhang, J.; Lin, P.C.; Xiong, S.R.; Tang, F.L.; Liu, H.Z. Genetic diversity and population demography of Schizothorax molesworthi from the Motuo area of lower reaches of the Yarlung Zangbo River and Lohit River. Acta Hydrobiol. Sin. 2019, 43, 923–930. [Google Scholar] [CrossRef]
  28. Dueñas-Romero, J.J.; Granados-Amores, J.; Palacios-Salgado, D.S.; Domínguez-Contreras, J.F.; Flores-Ortega, J.R.; García-Rodríguez, F.J. Diversity and population structure of Octopus hubbsorum in the Mexican Pacific inferred from mitochondrial DNA sequences. Mar. Freshw. Res. 2020, 72, 35–43. [Google Scholar] [CrossRef]
  29. Xiao, W.; Zhang, Y.; Liu, H. Molecular systematics of Xenocyprinae (Teleostei: Cyprinidae): Taxonomy, biogeography, and coevolution of a special group restricted in East Asia. Mol. Phylogenet. Evol. 2001, 18, 163–173. [Google Scholar] [CrossRef] [Green Version]
  30. Ward, R.D.; Zemlak, T.S.; Innes, B.H.; Last, P.R.; Hebert, P.D.N. DNA barcoding Australia’s fish species. Phil. Trans. R. Soc. B 2005, 360, 1847–1857. [Google Scholar] [CrossRef]
  31. Anderson, M.J. A new method for non-parametric multivariate analysis of variance. Austral. Ecol. 2001, 26, 32–46. [Google Scholar] [CrossRef]
  32. Anderson, M.J.; Gorley, R.N. PERMANOVA+ for PRIMER: Guide to Software and Statistical Methods; PRIMER-E: Plymouth, UK, 2007. [Google Scholar]
  33. Tamura, K.; Stecher, G.; Peterson, D.; Filipski, A.; Kumar, S. MEGA6: Molecular Evolutionary Genetics Analysis version 6.0. Mol. Biol. Evol. 2013, 30, 2725–2729. [Google Scholar] [CrossRef] [Green Version]
  34. Zhang, D.; Gao, F.; Jakovlić, I.; Zou, H.; Zhang, J.; Li, W.X.; Wang, G.T. PhyloSuite: An integrated and scalable desktop platform for streamlined molecular sequence data management and evolutionary phylogenetics studies. Mol. Ecol. Resour. 2020, 20, 348–355. [Google Scholar] [CrossRef]
  35. Rozas, J.; Ferrer-Mata, A.; Sánchez-DelBarrio, J.C.; Guirao-Librado, P.; Ramos-Onsins, S.E.; Sánchez-Gracia, A. DnaSP v6: DNA Sequence Polymorphism Analysis of Large Data Sets. Mol. Biol. Evol. 2017, 34, 3299–3302. [Google Scholar] [CrossRef]
  36. Bandelt, H.J.; Forster, P.; Röhl, A. Median-joining networks for inferring intraspecific phylogenies. Mol. Biol. Evol. 1999, 16, 37–48. [Google Scholar] [CrossRef]
  37. Leigh, J.W.; Bryant, D. POPART: Full-feature software for haplotype network construction. Methods Ecol. Evol. 2015, 6, 1110–1116. [Google Scholar] [CrossRef]
  38. Excoffier, L.; Lischer, H.E.L. Arlequin suite ver 3.5: A new series of programs to perform population genetics analyses under Linux and Windows. Mol. Ecol. Resour. 2010, 10, 564–567. [Google Scholar] [CrossRef] [PubMed]
  39. Corander, J.; Cheng, L.; Marttinen, P.; Sirén, J.; Tang, J. BAPS: Bayesian Analysis of Population Structure Version 6.0; Department of Mathematics and Statistics, University of Helsinki: Helsinki, Finland, 2013; p. 14. [Google Scholar]
  40. Grant, W.A.S.; Bowen, B.W. Shallow population histories in deep evolutionary lineages of marine fishes: Insights from sardines and anchovies and lessons for conservation. J. Hered. 1998, 89, 415–426. [Google Scholar] [CrossRef] [Green Version]
  41. Dai, Y.G.; Zou, X.J.; Xiao, H. Genetic diversity of the mtDNA D-loop in the population of Schizothorax kozlovi from the Wujiang River. Sichuan J. Zool. 2010, 29, 505–509. [Google Scholar] [CrossRef]
  42. Balloux, F.; Lugon-Moulin, N. The estimation of population differentiation with microsatellite markers. Mol. Ecol. 2002, 11, 155–165. [Google Scholar] [CrossRef] [Green Version]
  43. Moritz, C. Defining ‘evolutionarily significant units’ for conservation. Trends Ecol. Evol. 1994, 9, 373–375. [Google Scholar] [CrossRef]
Figure 1. Sampling locations of Schizothorax kozlovi in the upper Yangtze River.
Fishes 07 00292 g001
Figure 2. Stable isotope ratios, geographical location and ambient water temperature of wild Schizothorax kozlovi in each sampling location (1—location GT, 2—location SG, 3—location SJ, 4—location JP). (a) δ18O and δ13C variation; (b) coordinates and altitude; (c) mean, minimum and maximum water temperature; (d) mean monthly water temperature.
Fishes 07 00292 g002
Figure 3. The haplotype network of Schizothorax kozlovi based on the concatenated sequences of gene Cytb and COI.
Fishes 07 00292 g003
Figure 4. Bayesian analysis of population structure of Schizothorax kozlovi based on clustering with linked loci for both Cytb and COI gene. Each color represents a separate genetic cluster, and each bar represents an individual.
Fishes 07 00292 g004
Figure 5. Observed and expected distributions of pair-wise sequence differences in mitochondrial concatenated sequences of Cytb and COI of Schizothorax kozlovi in the upper Yangtze River.
Fishes 07 00292 g005
Table 1. Summary table of Schizothorax kozlovi, collected in the upper Yangtze River.
LocationSample YearSL (mm)Otolith Mass (mg)Estimated Age Range (Years)Sampling Numbers
GT2017, 2019278.3 (11.3)5.47 (0.61)4–623, 7 (4:3)
SG2016, 2017, 2018172.0 (9.3)2.18 (0.27)1–345, 12 (5:7)
SJ2017, 2018244.9 (16.6)3.98 (0.34)3–618, 12 (6:6)
JP2016266.8 (6.2)3.45 (0.24)4–613, 12 (2:10)
Sampling numbers—Number of samples for genetic analysis, isotope analysis (Female:Male); GT—Gangtuo in the Jinsha River; SG—Shigu in the Jinsha River; SJ—Sanjiangkou in the Shuiluo River; JP—Jinping in the Yalong River. Mean and standard error (in brackets) are given for standard length (SL) and otolith mass.
Table 2. Summary of ANCOVA and PERMANOVA (δ18O and δ13C) results across all locations of Schizothorax kozlovi based on Type III sums of squares of the standardized data.
MethodSourced.f.Sums of SquaresMean SquaresFp
ANCOVA (δ13C)Locations332.63510.87844.1820.000
Otolith mass10.7250.7252.9430.094
Residual389.3560.246
Total4342.000
ANCOVA (δ18O)Locations329.6219.87430.4850.000
Otolith mass10.1370.1370.4230.519
Residual3812.3080.324
Total4342.000
PERMANOVALocations365,551.78721,850.5962425.9940.001
Residual39351.2689.007
Total4265903.0551
Table 3. Genetic diversity of Schizothorax kozlovi at different locations of the upper Yangtze River based on the concatenated Cytb and COI genes sequences.
LocationsNumber of HaplotypesHaplotypesHaplotype DiversityNucleotide Diversity
GT12Hap1-Hap120.913 (±0.040)0.00708 (±0.00127)
SG23Hap1, Hap6-Hap7, Hap11, Hap13-Hap310.932 (±0.024)0.00871 (±0.00124)
SJ14Hap1, Hap3-Hap4, Hap6, Hap9, Hap14, Hap25, Hap28-Hap29, Hap32-Hap360.967 (±0.030)0.00795 (±0.00081)
JP7Hap1, Hap6-Hap7, Hap12, Hap25, Hap28, Hap370.846 (±0.085)0.00361 (±0.00199)
Total37Hap1-Hap370.928 (±0.017)0.00778 (±0.00078)
Values in the brackets represent standard deviation.
Table 4. Analysis of molecular variance analysis among locations of Schizothorax kozlovi from the upper Yangtze River based on the concatenated Cytb and COI genes sequences.
CategorySource of Variationd.f.Sum of SquaresVariance ComponentsPercentage of Variation (%)
LocationAmong locations338.7140.237043.06
Within locations95713.8627.5143396.94
Total98752.8627.75137
LineageAmong lineages1388.87510.0441172.82
Within lineages97363.7013.7494927.18
Total98752.57613.79360
Table 5. Pairwise FST values among different locations of Schizothorax kozlovi from the upper Yangtze River based on the concatenated Cytb and COI genes sequences.
LocationsGTSGSJJP
GT 0.2140.3980.122
SG0.010 0.1260.112
SJ−0.0090.028 0.017
JP0.0550.0400.159
Values in the right upper part represent p values.
Publisher’s Note: MDPI stays neutral with regard to jurisdictional claims in published maps and institutional affiliations.

