

Invasive Species Appearance and Climate Change Correspond with Dramatic Regime Shift in Thermal Guild Composition of Lake Huron Beach Fish Assemblages


Abstract
1. Introduction
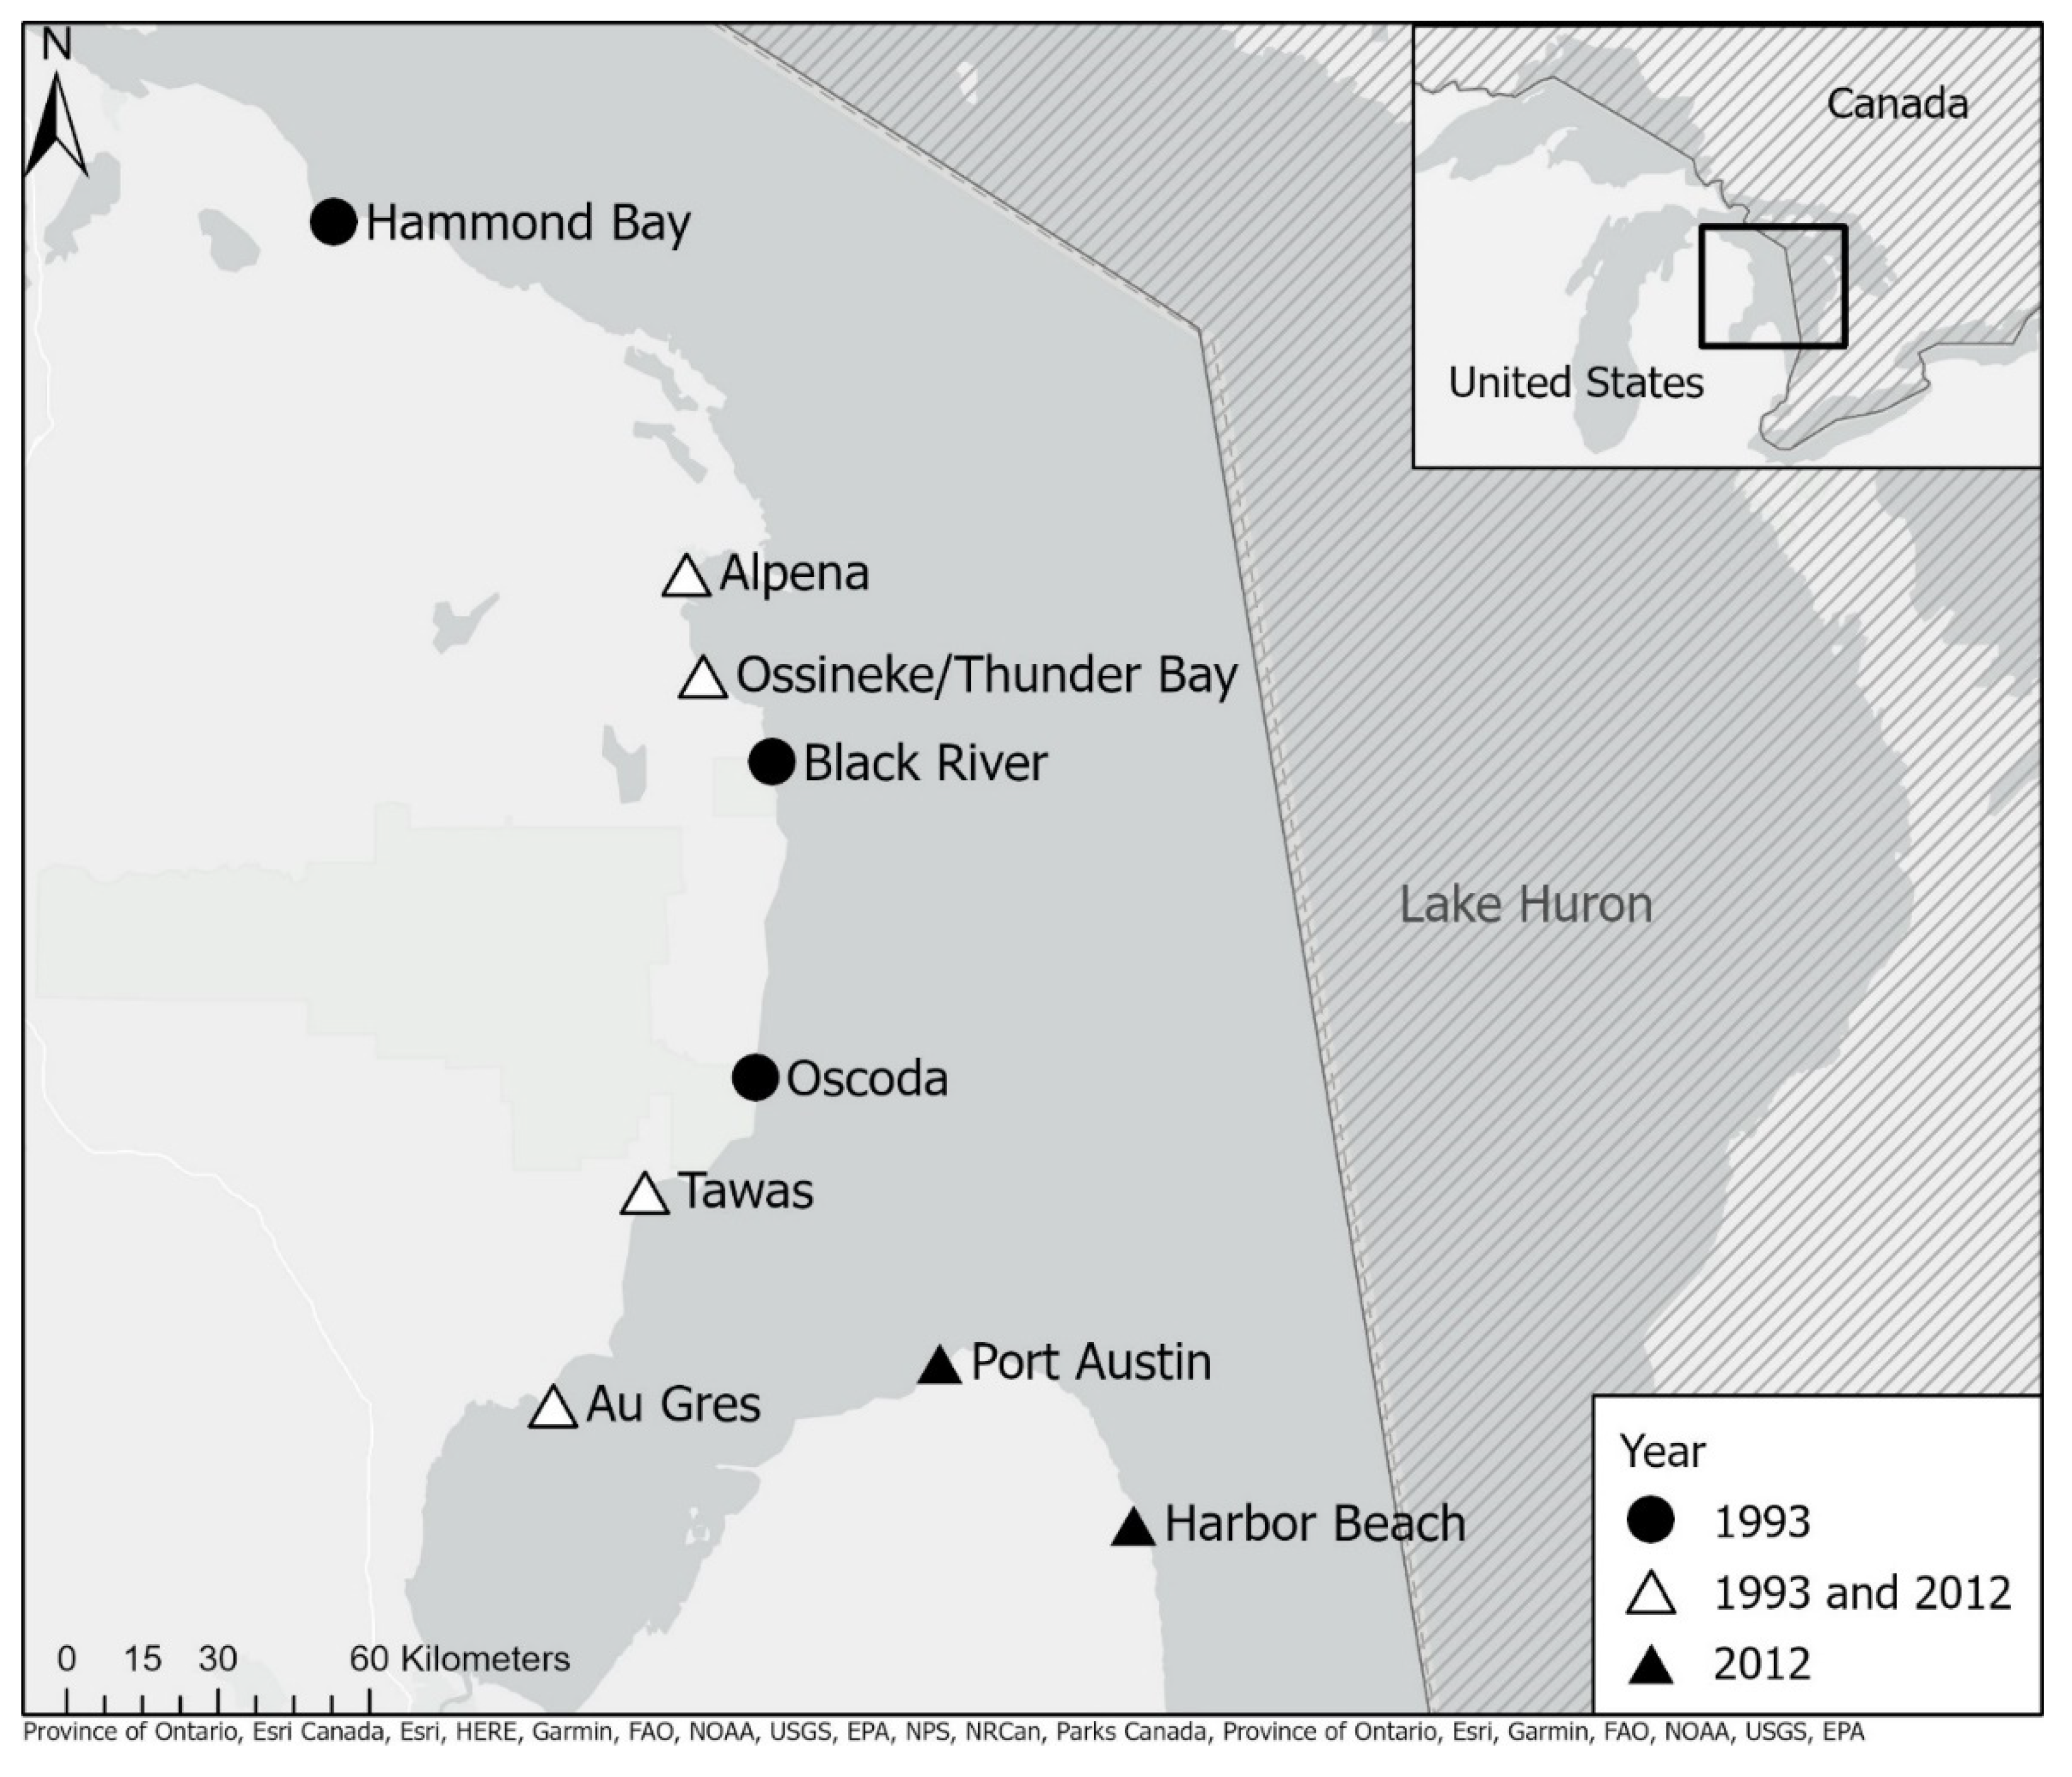
2. Methods
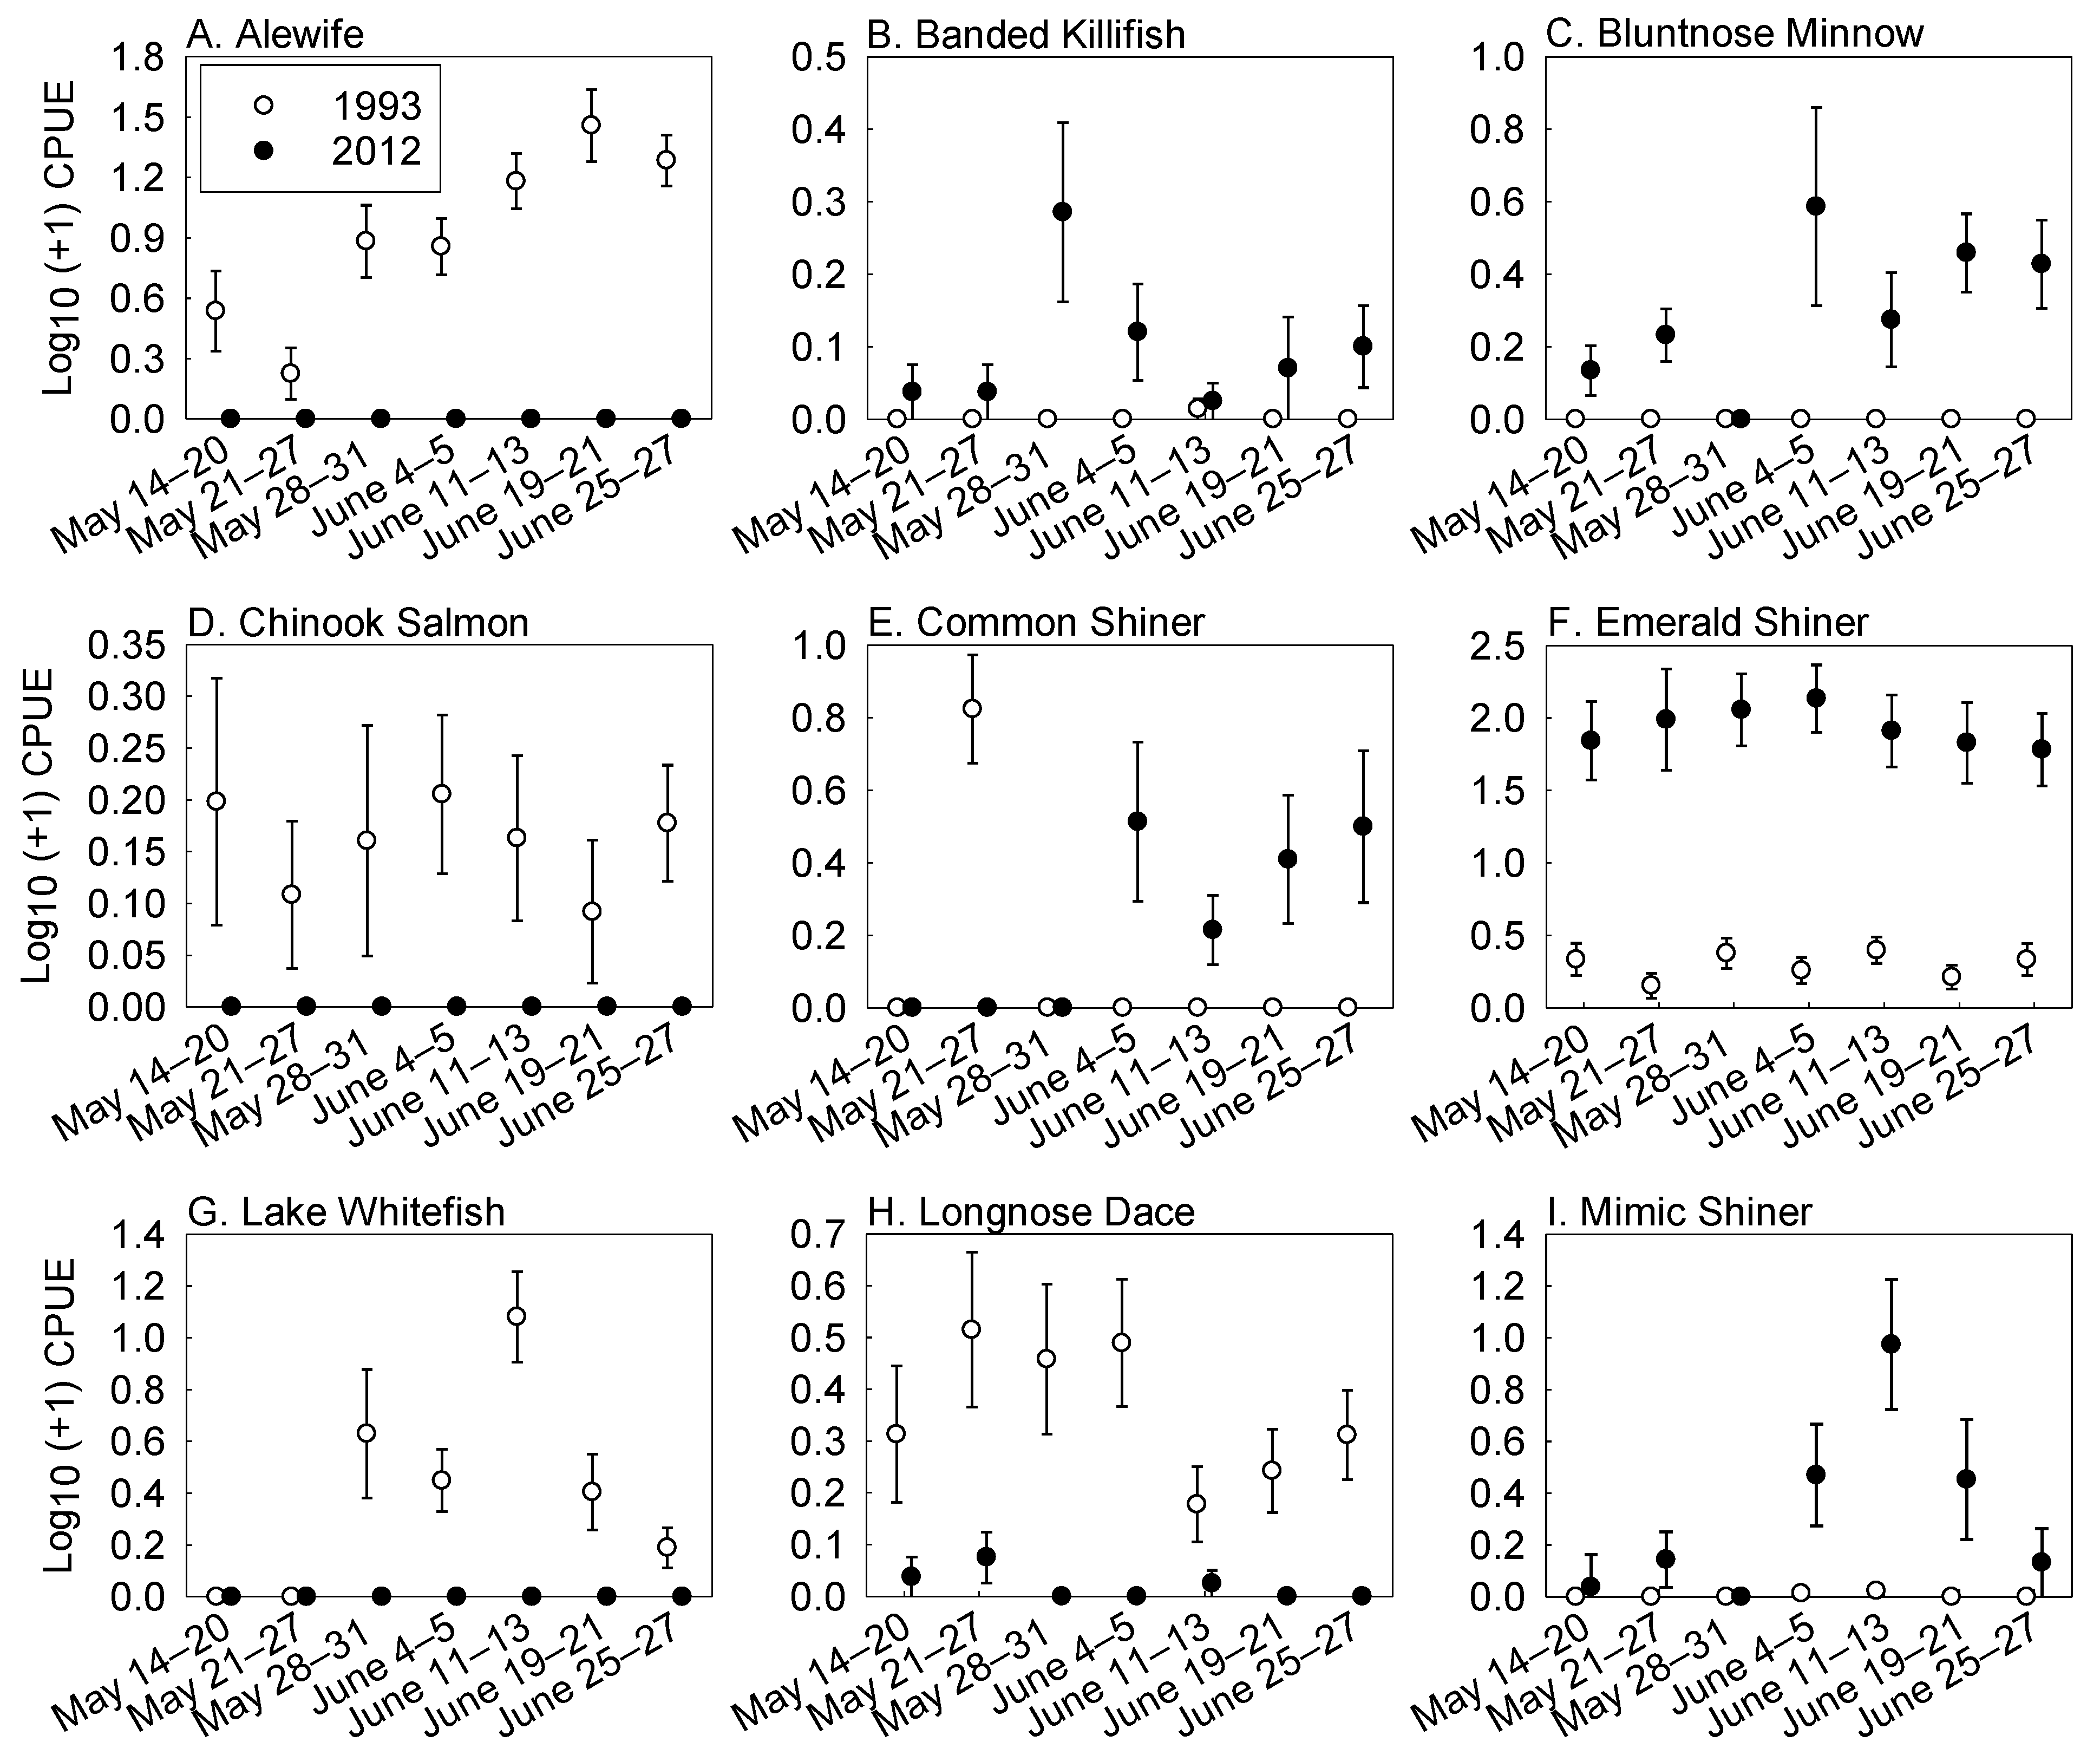
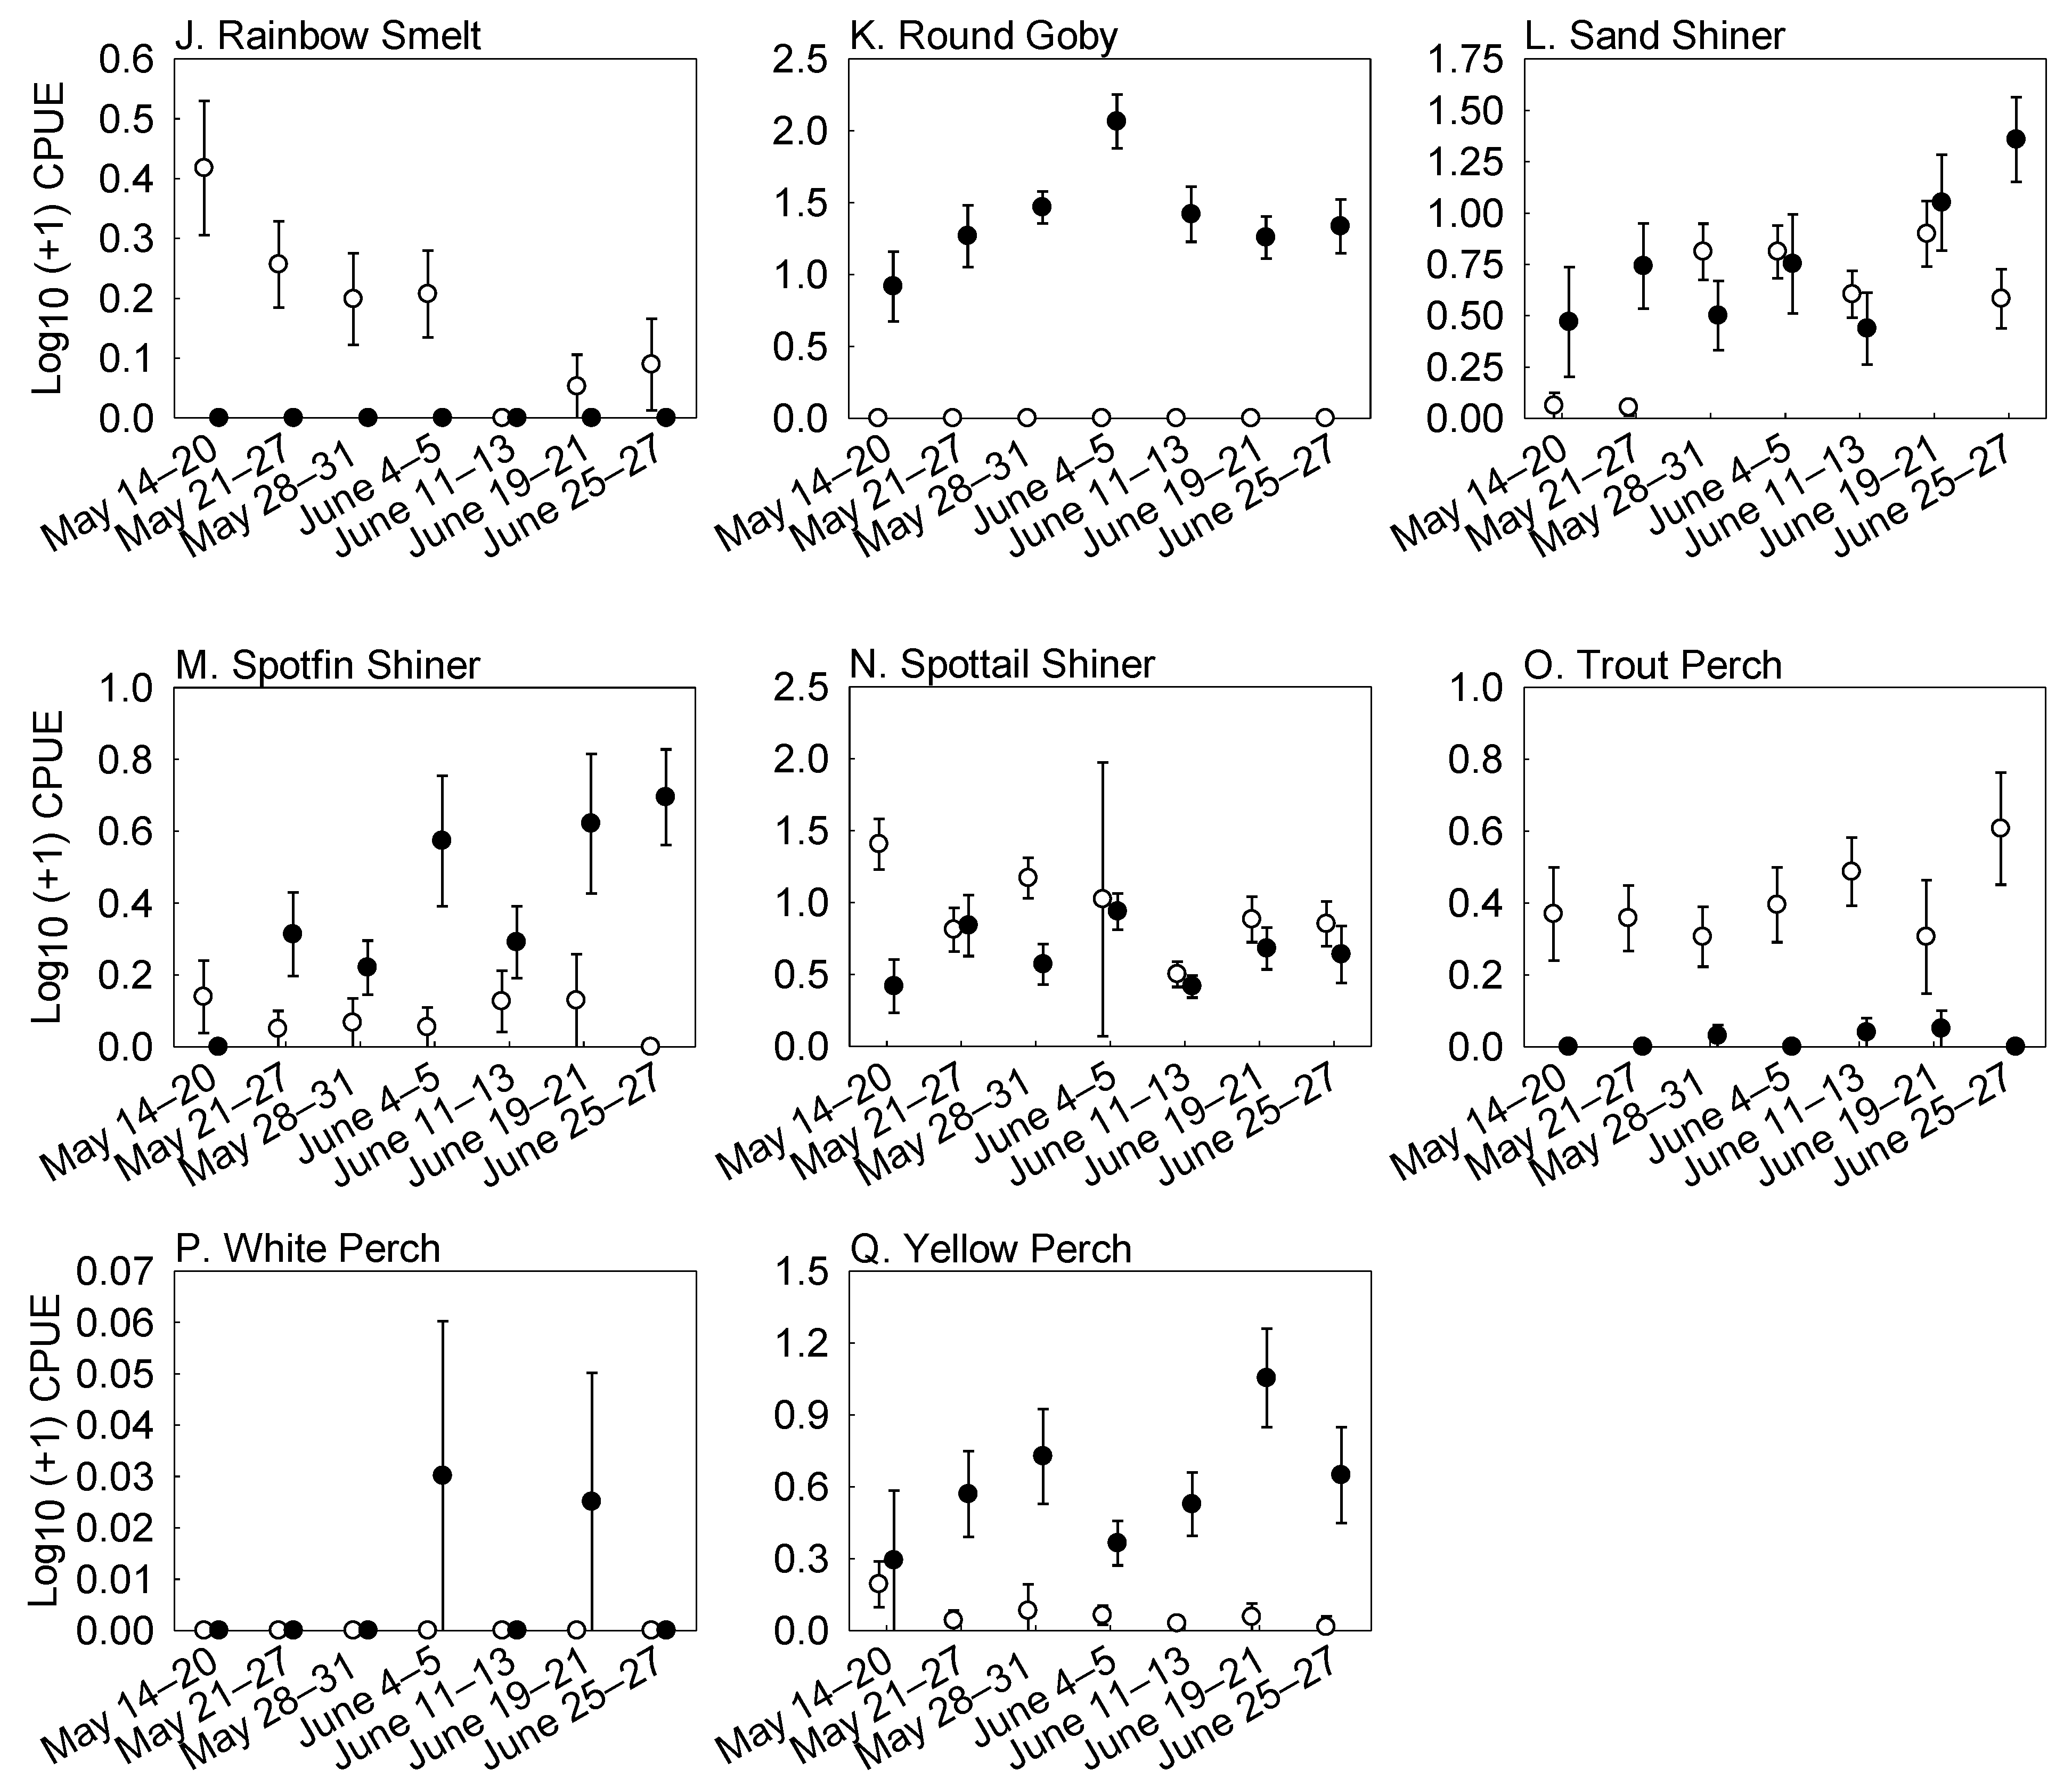
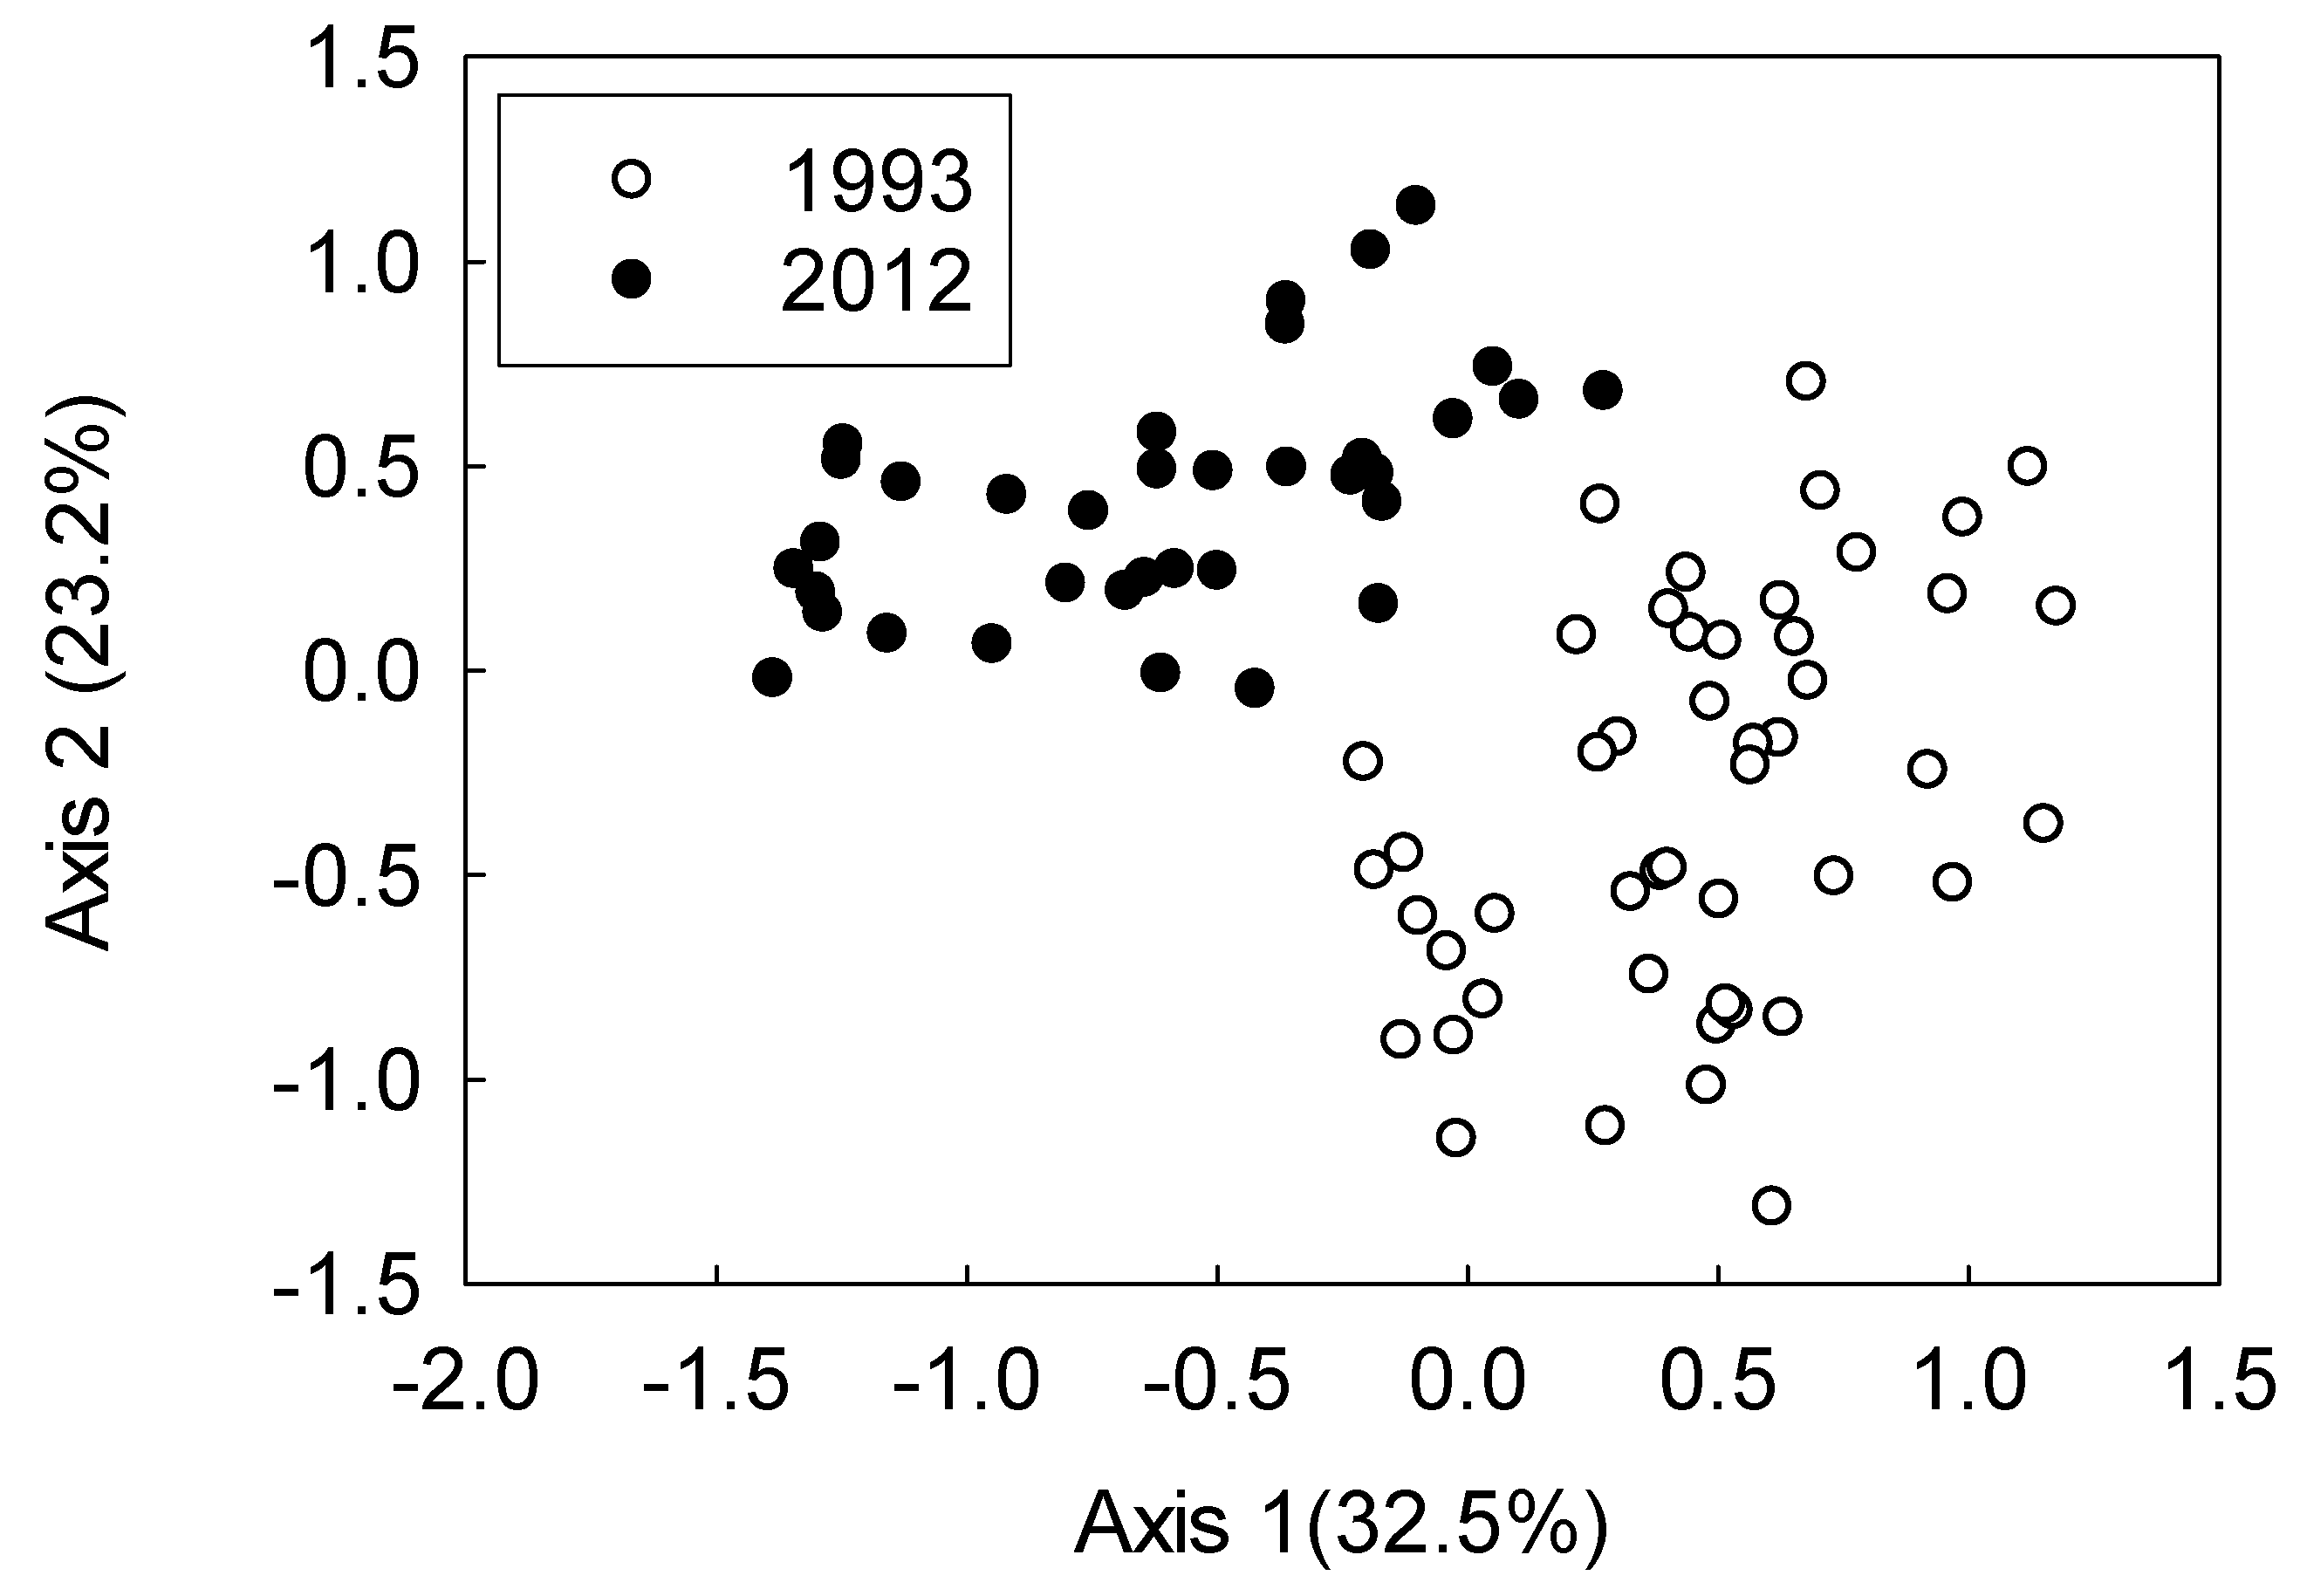
3. Results
Fish Abundance
4. Discussion
Author Contributions
Funding
Institutional Review Board Statement
Data Availability Statement
Acknowledgments
Conflicts of Interest
References
- Flecker, A.S.; Matthews, W.J. Patterns in Freshwater Fish Ecology; Chapman & Hall: New York, NY, USA, 1998. [Google Scholar] [CrossRef]
- Jackson, D.A.; Peres-Neto, P.R.; Olden, J. What controls who is where in freshwater fish communities? The roles of biotic, abiotic, and spatial factors. Can. J. Fish. Aquat. Sci. 2001, 58, 157–170. [Google Scholar] [CrossRef]
- Vadeboncoeur, Y.; McIntyre, P.B.; Zanden, M.J.V. Borders of Biodiversity: Life at the Edge of the World’s Large Lakes. BioScience 2011, 61, 526–537. [Google Scholar] [CrossRef]
- Trumpickas, J.; Smith, A.; Robillard, M.M.; La Rose, J.K. Temporal shifts in the biodiversity of nearshore small fishes in Lake Simcoe. J. Great Lakes Res. 2012, 38, 643–652. [Google Scholar] [CrossRef]
- Rahel, F.J.; Hubert, W.A. Fish Assemblages and Habitat Gradients in a Rocky Mountain–Great Plains Stream: Biotic Zonation and Additive Patterns of Community Change. Trans. Am. Fish. Soc. 1991, 120, 319–332. [Google Scholar] [CrossRef]
- Fetzer, W.W.; Roth, B.M.; Infante, D.M.; Clapp, D.F.; Claramunt, R.M.; Fielder, D.G.; Forsyth, D.K.; He, J.X.; Newcomb, T.J.; Riseng, C.M.; et al. Spatial and temporal dynamics of nearshore fish communities in Lake Michigan and Lake Huron. J. Great Lakes Res. 2017, 43, 319–334. [Google Scholar] [CrossRef]
- Barbiero, R.P.; Balcer, M.; Rockwell, D.C.; Tuchman, M.L. Recent shifts in the crustacean zooplankton community of Lake Huron. Can. J. Fish. Aquat. Sci. 2009, 66, 816–828. [Google Scholar] [CrossRef]
- Riley, S.C.; Adams, J.V. Long-Term Trends in Habitat Use of Offshore Demersal Fishes in Western Lake Huron Suggest Large-Scale Ecosystem Change. Trans. Am. Fish. Soc. 2010, 139, 1322–1334. [Google Scholar] [CrossRef]
- Munawar, M.; Munawar, I.F.; Mandrak, N.E.; Fitzpatrick, M.; Dermott, R.; Leach, J. An overview of the impact of non-indigenous species on the food web integrity of North American Great Lakes: Lake Erie example. Aquat. Ecosyst. Health Manag. 2005, 8, 375–395. [Google Scholar] [CrossRef]
- Roseman, E.; Schaeffer, J.S.; Steen, P.J. Review of fish diversity in the Lake Huron basin. Aquat. Ecosyst. Health Manag. 2009, 12, 11–22. [Google Scholar] [CrossRef]
- Kao, Y.-C.; Adlerstein, S.; Rutherford, E. The relative impacts of nutrient loads and invasive species on the Great Lakes food web: An Ecopath with Ecosim analysis. J. Great Lakes Res. 2014, 40, 35–52. [Google Scholar] [CrossRef]
- Harris, B.S.; Smith, B.J.; Hayer, C.-A. Development and implementation of an adaptive management approach for monitoring non-indigenous fishes in lower Green Bay, Lake Michigan. J. Great Lakes Res. 2018, 44, 960–969. [Google Scholar] [CrossRef]
- Riley, S.C.; Roseman, E.F.; Nichols, S.J.; O’Brien, T.P.; Kiley, C.S.; Schaeffer, J.S. Deepwater Demersal Fish Community Collapse in Lake Huron. Trans. Am. Fish. Soc. 2008, 137, 1879–1890. [Google Scholar] [CrossRef]
- Ricciardi, A. Facilitative interactions among aquatic invaders: Is an “invasional meltdown” occurring in the Great Lakes? Can. J. Fish. Aquat. Sci. 2001, 58, 2513–2525. [Google Scholar] [CrossRef]
- Dopazo, S.N.; Corkum, L.D.; Mandrak, N.E. Fish Assemblages and Environmental Variables Associated with Gobiids in Nearshore Areas of the Lower Great Lakes. J. Great Lakes Res. 2008, 34, 450–460. [Google Scholar] [CrossRef]
- Hecky, R.E.; Smith, R.E.; Barton, D.R.; Guildford, S.J.; Taylor, W.; Charlton, M.N.; Howell, T. The nearshore phosphorus shunt: A consequence of ecosystem engineering by dreissenids in the Laurentian Great Lakes. Can. J. Fish. Aquat. Sci. 2004, 61, 1285–1293. [Google Scholar] [CrossRef]
- Johnson, T.B.; Bunnell, D.B.; Knight, C.T. A Potential New Energy Pathway in Central Lake Erie: The Round Goby Connection. J. Great Lakes Res. 2005, 31, 238–251. [Google Scholar] [CrossRef]
- Campbell, L.M.; Thacker, R.; Barton, D.; Muir, D.C.; Greenwood, D.; Hecky, R.E. Re-engineering the eastern Lake Erie littoral food web: The trophic function of non-indigenous Ponto-Caspian species. J. Great Lakes Res. 2009, 35, 224–231. [Google Scholar] [CrossRef]
- Madenjian, C.P.; Bunnell, D.B.; Warner, D.M.; Pothoven, S.A.; Fahnenstiel, G.L.; Nalepa, T.F.; Vanderploeg, H.A.; Tsehaye, I.; Claramunt, R.M.; Clark, R.D. Changes in the Lake Michigan food web following dreissenid mussel invasions: A synthesis. J. Great Lakes Res. 2015, 41, 217–231. [Google Scholar] [CrossRef]
- Pothoven, S.A.; Madenjian, C.P.; Höök, T.O. Feeding ecology of the walleye (Percidae, Sander vitreus), a resurgent piscivore in Lake Huron (Laurentian Great Lakes) after shifts in the prey community. Ecol. Freshw. Fish 2017, 26, 676–685. [Google Scholar] [CrossRef]
- Roseman, E.F.; Schaeffer, J.S.; Bright, E.; Fielder, D.G. Angler-Caught Piscivore Diets Reflect Fish Community Changes in Lake Huron. Trans. Am. Fish. Soc. 2014, 143, 1419–1433. [Google Scholar] [CrossRef]
- USGS (U.S. Geological Survey). Compiled Reports to the Great Lakes Fishery Commission of the Annual Bottom Trawl and Acoustics Surveys for 2014. 2015. Available online: http://www.glfc.org/pubs/lake_committees/common_docs/CompiledReportsfromUSGS2015.pdf.
- Crane, D.P.; Einhouse, D.W. Changes in growth and diet of smallmouth bass following invasion of Lake Erie by the round goby. J. Great Lakes Res. 2016, 42, 405–412. [Google Scholar] [CrossRef]
- Kao, Y.-C.; Adlerstein, S.A.; Rutherford, E.S. Assessment of Top-Down and Bottom-Up Controls on the Collapse of Alewives (Alosa pseudoharengus) in Lake Huron. Ecosystems 2016, 19, 803–831. [Google Scholar] [CrossRef]
- Pothoven, S.; Madenjian, C.P. Changes in Consumption by Alewives and Lake Whitefish after Dreissenid Mussel Invasions in Lakes Michigan and Huron. N. Am. J. Fish. Manag. 2008, 28, 308–320. [Google Scholar] [CrossRef]
- Adlerstein, S.A.; Rutherford, E.S.; Clapp, D.; Clevenger, J.A.; Johnson, J.E. Estimating Seasonal Movements of Chinook Salmon in Lake Huron from Efficiency Analysis of Coded Wire Tag Recoveries in Recreational Fisheries. N. Am. J. Fish. Manag. 2007, 27, 792–803. [Google Scholar] [CrossRef]
- Johnson, J.E.; DeWitt, S.P.; Gonder, D.J.A. Mass-Marking Reveals Emerging Self Regulation of the Chinook Salmon Population in Lake Huron. N. Am. J. Fish. Manag. 2010, 30, 518–529. [Google Scholar] [CrossRef]
- Fielder, D.G.; Schaeffer, J.S.; Thomas, M.V. Environmental and Ecological Conditions Surrounding the Production of Large Year Classes of Walleye (Sander vitreus) in Saginaw Bay, Lake Huron. J. Great Lakes Res. 2007, 33, 118–132. [Google Scholar] [CrossRef]
- Riley, S.C.; He, J.X.; Johnson, J.E.; O’Brien, T.P.; Schaeffer, J.S. Evidence of Widespread Natural Reproduction by Lake Trout Salvelinus namaycush in the Michigan Waters of Lake Huron. J. Great Lakes Res. 2007, 33, 917–921. [Google Scholar] [CrossRef]
- Casselman, J.M. Effects of temperature, global extremes, and climate change on year-class production of warmwater, coolwater and coldwater fishes in the Great Lakes basin. In Fisheries in a Changing Climate, Symposium 32; McGinn, N.A., Ed.; American Fisheries Society: Bethesda, ML, USA, 2002; pp. 39–60. [Google Scholar]
- Simpson, S.D.; Jennings, S.; Johnson, M.; Blanchard, J.; Schön, P.-J.; Sims, D.; Genner, M.J. Continental Shelf-Wide Response of a Fish Assemblage to Rapid Warming of the Sea. Curr. Biol. 2011, 21, 1565–1570. [Google Scholar] [CrossRef]
- Albouy, C.; Guilhaumon, F.; Araújo, M.B.; Mouillot, D.; Leprieur, F. Combining projected changes in species richness and composition reveals climate change impacts on coastal Mediterranean fish assemblages. Glob. Chang. Biol. 2012, 18, 2995–3003. [Google Scholar] [CrossRef]
- Murry, B.A.; Farrell, J.M. Resistance of the size structure of the fish community to ecological perturbations in a large river ecosystem. Freshw. Biol. 2014, 59, 155–167. [Google Scholar] [CrossRef]
- Reid, S.M.; Mandrak, N. Lake Erie beaches: Diel variation in fish assemblage structure and implications for monitoring. Hydrobiologia 2008, 618, 139–148. [Google Scholar] [CrossRef]
- Hintz, A. Observations of the near-shore fish community. In The U.S. Waters of Northern Lake Huron, 1993; U.S. Fish and Wildlife Service: Washington, DC, USA, 1994. [Google Scholar]
- McCune, B.; Grace, J.B. Analysis of Ecological Communities; MJM Press: Gleneden Beach, OR, USA, 2002. [Google Scholar]
- Coker, G.A.; Portt, C.B.; Minns, C.K. Morphological and Ecological Characteristics of Canadian Freshwater Fishes; Canadian Manuscript Report of Fisheries and Aquatic Sciences 2554; Fisheries and Oceans Canada: Burlington, ON, Canada, 2001; Volume 2554, 89p. [Google Scholar]
- Hasnain, S.S.; Shuter, B.J.; Minns, C.K. Phylogeny influences the relationships linking key ecological thermal metrics for North American freshwater fish species. Can. J. Fish. Aquat. Sci. 2013, 70, 964–972. [Google Scholar] [CrossRef]
- Kornis, M.S.; Mercado-Silva, N.; Zanden, J.V. Twenty years of invasion: A review of round goby Neogobius melanostomus biology, spread and ecological implications. J. Fish Biol. 2012, 80, 235–285. [Google Scholar] [CrossRef] [PubMed]
- Madenjian, C.P.; Fahnenstiel, G.L.; Johengen, T.H.; Nalepa, T.F.; Vanderploeg, A.H.; Fleischer, G.W.; Schneeberger, P.J.; Benjamin, D.M.; Smith, E.B.; Bence, J.R.; et al. Dynamics of the Lake Michigan food web, 1970–2000. Can. J. Fish. Aquat. Sci. 2002, 59, 736–753. [Google Scholar] [CrossRef]
- Schaeffer, J.S.; Bowen, A.; Thomas, M.; French, J.R.; Curtis, G.L. Invasion History, Proliferation, and Offshore Diet of the Round Goby Neogobius melanostomus in Western Lake Huron, USA. J. Great Lakes Res. 2005, 31, 414–425. [Google Scholar] [CrossRef]
- Omara, M.; Crimmins, B.S.; Back, R.C.; Hopke, P.K.; Chang, F.-C.; Holsen, T.M. Mercury biomagnification and contemporary food web dynamics in lakes Superior and Huron. J. Great Lakes Res. 2015, 41, 473–483. [Google Scholar] [CrossRef]
- Barbiero, R.P.; Lesht, B.M.; Warren, G.J.; Rudstam, L.G.; Watkins, J.M.; Reavie, E.; Kovalenko, K.; Karatayev, A.Y. A comparative examination of recent changes in nutrients and lower food web structure in Lake Michigan and Lake Huron. J. Great Lakes Res. 2018, 44, 573–589. [Google Scholar] [CrossRef]
- Farrell, J.M.; Mead, J.V.; Murry, B.A. Protracted spawning of St Lawrence River northern pike (Esox lucius): Simulated effects on survival, growth, and production. Ecol. Freshw. Fish 2006, 15, 169–179. [Google Scholar] [CrossRef]
- Dunlop, E.S.; Riley, S.C. The contribution of cold winter temperatures to the 2003 alewife population collapse in Lake Huron. J. Great Lakes Res. 2013, 39, 682–689. [Google Scholar] [CrossRef]
- Pothoven, S.A.; Madenjian, C.P. Increased Piscivory by Lake Whitefish in Lake Huron. N. Am. J. Fish. Manag. 2013, 33, 1194–1202. [Google Scholar] [CrossRef]
- Pothoven, S.A.; Hondorp, D.W.; Nalepa, T.F. Declines in deepwater sculpin Myoxocephalus thompsonii energy density associated with the disappearance of Diporeia spp. in lakes Huron and Michigan. Ecol. Freshw. Fish 2011, 20, 14–22. [Google Scholar] [CrossRef]
- Vanderploeg, H.A.; Liebig, J.R.; Nalepa, T.F.; Fahnenstiel, G.L.; Pothoven, S.A. Dreissena and the disappearance of the spring phytoplankton bloom in Lake Michigan. J. Great Lakes Res. 2010, 36, 50–59. [Google Scholar] [CrossRef]
- Wei, A.; Chow-Fraser, P.; Albert, D. Influence of shoreline features on fish distribution in the Laurentian Great Lakes. Can. J. Fish. Aquat. Sci. 2004, 61, 1113–1123. [Google Scholar] [CrossRef]
- Francis, J.T.; Chiotti, J.A.; Boase, J.C.; Thomas, M.V.; Manny, B.A.; Roseman, E. A description of the nearshore fish communities in the Huron–Erie Corridor using multiple gear types. J. Great Lakes Res. 2014, 40, 52–61. [Google Scholar] [CrossRef]


| Species or Family | CPUE | Number | ||||
|---|---|---|---|---|---|---|
| Variable | df | F | p | F | p | |
| Alewife | Year | 1 | 7.21 | 0.04 | 4.32 | 0.05 |
| (Alosa pseudoharengus) | Week | 6 | 2.44 | 0.15 | 3.58 | 0.03 |
| Week*Year | 6 | 1.63 | 0.25 | 3.76 | 0.57 | |
| Banded killifish | Year | 1 | 4.56 | 0.06 | 2.2 | 0.15 |
| (Fundulus diaphanous) | Week | 6 | 4.7 | 0.053 | 3.69 | 0.02 |
| Week*Year | 6 | 4.7 | 0.053 | 2.49 | 0.08 | |
| Bluntnose minnow | Year | 1 | 208.82 | <0.0001 | 0.63 | 0.44 |
| (Pimephales notatus) | Week | 6 | 2.37 | 0.14 | 1.16 | 0.33 |
| Week*Year | 6 | 2.37 | 0.14 | 3.8 | 0.01 | |
| Chinook salmon | Year | 1 | 1.30 | 0.29 | 2.45 | 0.17 |
| (Oncorhynchus tshawytscha) | Week | 6 | 1.30 | 0.28 | 1.84 | 0.12 |
| Week*Year | 6 | 1.30 | 0.28 | 1.84 | 0.12 | |
| Common shiner | Year | 1 | 3.99 | 0.08 | 21.83 | 0.00 |
| (Luxilus cornutus) | Week | 6 | 9.3 | 0.0002 | 0.53 | 0.63 |
| Week*Year | 6 | 12.4 | <0.0001 | 0.49 | 0.66 | |
| Emerald shiner | Year | 1 | 18.24 | 0.004 | 2.98 | 0.10 |
| (Notropis atherinoides) | Week | 6 | 9.46 | <0.0001 | 1.39 | 0.26 |
| Week*Year | 6 | 18.38 | <0.0001 | 1.39 | 0.26 | |
| Lake whitefish | Year | 1 | 3.5 | 0.008 | 2.13 | 0.16 |
| (Coregonus clupeaformis) | Week | 6 | 3.5 | 0.08 | 1.01 | 0.34 |
| Week*Year | 6 | 3.5 | 0.08 | 1.01 | 0.33 | |
| Longnose dace | Year | 1 | 359.44 | <0.0001 | 4.55 | 0.04 |
| (Rhinichthys cataractae) | Week | 6 | 177.66 | <0.0001 | 2.71 | 0.08 |
| Week*Year | 6 | 179.89 | <0.0001 | 2.71 | 0.08 | |
| Mimic shiner | Year | 1 | 25.61 | 0.0007 | 2.12 | 0.16 |
| (Notropis volucellus) | Week | 6 | 3.24 | 0.04 | 4.75 | 0.00 |
| Week*Year | 6 | 2.63 | 0.08 | 1.02 | 0.39 | |
| Rainbow smelt | Year | 1 | 15.96 | 0.001 | 3.16 | 0.09 |
| (Osmerus mordax) | Week | 6 | 2.72 | 0.09 | 2.77 | 0.04 |
| Week*Year | 6 | 2.72 | 0.09 | 9.18 | 0.00 | |
| Round goby | Year | 1 | 59.54 | <0.0001 | 24.92 | 0.00 |
| (Neogobius melanostomus) | Week | 6 | 7.76 | 0.0005 | 5.9 | 0.002 |
| Week*Year | 6 | 7.79 | 0.0005 | 9.24 | 0.00 | |
| Sand shiner | Year | 1 | 0.58 | 0.48 | 1.34 | 0.26 |
| (Notropis stramineus) | Week | 6 | 1.71 | 0.15 | 0.85 | 0.42 |
| Week*Year | 6 | 3.03 | 0.02 | 0.87 | 0.42 | |
| Spotfin shiner | Year | 1 | 2.93 | 0.13 | 1.43 | 0.24 |
| (Cyprinella spiloptera) | Week | 6 | 1.29 | 0.29 | 0.93 | 0.35 |
| Week*Year | 6 | 1.7 | 0.15 | 0.93 | 0.35 | |
| Spottail shiner | Year | 1 | 788.38 | 0.001 | 9.28 | 0.01 |
| (Notropis hudsonius) | Week | 6 | 0.42 | 0.77 | 4 | 0.02 |
| Year*Week | 6 | 0.25 | 0.88 | 3.63 | 0.02 | |
| Trout perch | Year | 1 | 5.8 | 0.05 | 0.01 | 0.91 |
| (Percopsis omiscomaycus) | Week | 6 | 0.8 | 0.52 | 1.02 | 0.36 |
| Year*Week | 6 | 2.17 | 0.11 | 3.86 | 0.03 | |
| Yellow perch | Year | 1 | 3.91 | 0.08 | 1.51 | 0.24 |
| (Perca flavescens) | Week | 6 | 0.97 | 0.42 | 3.74 | 0.01 |
| Year*Week | 6 | 0.82 | 0.49 | 0.54 | 0.69 | |
| Catastomidae | Year | 1 | 7.21 | 0.044 | 4.44 | 0.05 |
| Week | 6 | 0.05 | 0.15 | 1.07 | 0.38 | |
| Year*Week | 6 | 0.17 | 0.25 | 1.47 | 0.23 | |
| Centrarchidae | Year | 1 | 15.71 | 0.004 | 1.19 | 0.29 |
| Week | 6 | 17.92 | 0.0006 | 0.83 | 0.43 | |
| Year*Week | 6 | 14.42 | 0.001 | 0.83 | 0.43 | |
| Cyprinidae | Year | 1 | 9.79 | 0.01 | 0.07 | 0.79 |
| Week | 6 | 2.76 | 0.07 | 15.53 | 0.00 | |
| Year*Week | 6 | 2.57 | 0.09 | 10.56 | 0.00 | |
| Ictaluridae | Year | 1 | 15.53 | 0.004 | 4.23 | 0.05 |
| Week | 6 | 7.21 | 0.003 | 0.96 | 0.42 | |
| Year*Week | 6 | 7.21 | 0.003 | 1.79 | 0.16 | |
| Percidae | Year | 1 | 0.07 | 0.80 | 4.32 | 0.05 |
| Week | 6 | 0.56 | 0.66 | 3.58 | 0.03 | |
| Year*Week | 6 | 1.57 | 0.23 | 3.76 | 0.57 | |
| Salmonidae | Year | 1 | 4.7 | 0.007 a | 2.2 | 0.15 |
| Week | 6 | 2.4 | 0.16 a | 3.69 | 0.02 | |
| Year*Week | 6 | 2.4 | 0.16 a | 2.49 | 0.08 | |
| Species or Family | Number Captured | Relative Abundance (%) | Thermal Guild [37] | Preferred Temperature [37] | Final Temperature Preferendum [38] | ||
|---|---|---|---|---|---|---|---|
| 1993 | 2012 | 1993 | 2012 | ||||
| Alewife (Alosa pseudoharengus) | 5382 | 0 | 31.3 | 0.0 | Cold | 18.8 | 16.9 ± 4.5 |
| Bluntnose Minnow (Pimephales notatus) | 0 | 493 | 0.0 | 1.3 | Warm | 29 | 24.1 ± 4.5 |
| Chinook salmon (Oncorhynchus tshawytscha) | 275 | 0 | 1.6 | 0.0 | Cold | 17.3 | 13.8 ± 2.5 |
| Common shiner (Luxilus cornutus) | 410 | 330 | 2.4 | 0.9 | Cool | 21.9 | 21.9 |
| Emerald shiner (Notropis atherinoides) | 472 | 27,197 | 2.7 | 71.8 | Cool | 22-25 | 19.3 ± 8.9 |
| Lake whitefish (Coregonus clupeaformis) | 2045 | 0 | 11.9 | 0.0 | Cold | 12.7 | --- |
| Longnose dace (Rhinichthys cataractae) | 924 | 4 | 5.4 | 0.0 | Cool | 20.6 | 15.3 ± 3.6 |
| Mimic shiner (Notropis volucellus) | 3 | 988 | 0.0 | 2.6 | Warm | --- | --- |
| Rainbow smelt (Osmerus mordax) | 211 | 0 | 1.2 | 0.0 | Cold | 15 | 11.2 ± 3.9 |
| Round goby (Neogobius melanostomus) | 0 | 4613 | 0.0 | 12.2 | Cool * | --- * | --- * |
| Sand shiner (Notropis stramineus) | 1716 | 1588 | 10.0 | 4.2 | Warm | --- | --- |
| Spotfin shiner (Cyprinella spiloptera) | 358 | 436 | 2.1 | 1.2 | Warm | 29.5 | 27.5 ± 3.7 |
| Spottail shiner (Notropis hudsonius) | 3693 | 579 | 21.5 | 1.5 | Cold/cool | 14.3 | 16.6 ± 3.7 |
| Trout perch (Percopsis omiscomaycus) | 880 | 6 | 5.1 | 0.0 | Cold | 15-16 | 13.4 ± 3.5 |
| Yellow perch (Perca flavescens) | 69 | 1035 | 0.4 | 2.7 | Cool | 21.4 | 17.6 ± 6.0 |
| Catastomidae 1 | 95 | 386 | 0.6 | 1.0 | Cool | 22.4 | 23.4 |
| Centrarchidae 2 | 13 | 12 | 0.1 | 0.0 | Warm | 30.3 | 25.0 ± 6.0 |
| Cottidae 3 | 87 | 0 | 0.5 | 0.0 | Cold | 10; 13 | 11.0 |
| Cyprinidae 4 | 210 | 3 | 1.2 | 0.0 | Warm | 29.7 | 27.7 |
| Esocidae 5 | 2 | 0 | 0.0 | 0.0 | Cool | 22.5 | 20.7 ± 2.5 |
| Fundulidae 6 | 1 | 19 | 0.0 | 0.1 | Cool | 21 | 23.0 ± 5.0 |
| Gasterosteidae 7 | 167 | 0 | 1.0 | 0.0 | Cold | 9–10, 15–16 1 | 16.5 ± 4.4 |
| Ictaluridae 8 | 2 | 155 | 0.0 | 0.4 | Warm | 24.9; 27.3 | 26.2 ± 2.6 |
| Lepisosteidae 9 | 4 | 0 | 0.0 | 0.0 | Warm | 33.1 | 27.4 ± 6.6 |
| Moronidae 10 | 1 | 2 | 0.0 | 0.0 | Warm | 32.0 | 29.8 |
| Percidae 11 | 34 | 27 | 0.2 | 0.1 | Cool | 22.8 | 22.8 |
| Petromyzontidae 12 | 6 | 0 | 0.0 | 0.0 | Cold | 6-15 | 10.3 ± 3.4 |
| Salmonidae 13 | 143 | 1 | 0.8 | 0.0 | Cold/cool | 21.1 | 15.7 ± 2.1 |
| Sciaenidae 14 | 3 | 0 | 0.0 | 0.0 | Warm | 26.5 | 24.6 ± 6.2 |
| Umbridae 15 | 0 | 2 | 0.0 | 0.0 | Cool/warm | --- | --- |
| Total | 17,206 | 37,876 | |||||
| Species | Axis 1 | Axis 2 |
|---|---|---|
| Alewife (Alosa pseudoharengus) | 0.31 | 0.46 |
| Brassy minnow (Hybognathus hankinsoni) | - | 0.28 |
| Brook stickleback (Culaea inconstans) | 0.23 | 0.27 |
| Brown trout (Salmo trutta) | 0.23 | 0.30 |
| Chinook salmon (Oncorhynchus tshawytscha) | 0.24 | - |
| Common carp (Cyprinus carpio) | 0.27 | - |
| Emerald shiner (Notropis atherinoides) | - | 0.38 |
| Johnny darter (Etheostoma nigrum) | 0.25 | - |
| Lake chub (Couesius plumbeus) | - | 0.29 |
| Lake whitefish (Coregonus clupeaformis) | - | 0.26 |
| Longnose dace (Rhinichthys cataractae) | 0.25 | 0.25 |
| Ninespine stickleback (Pungitius pungitius) | 0.29 | 0.30 |
| Rainbow smelt (Osmerus mordax) | 0.26 | 0.25 |
| Rainbow trout (Oncorhynchus mykiss) | 0.25 | 0.3 |
| Sand shiner (Notropis stramineus) | - | 0.35 |
| Sculpin spp. | 0.23 | - |
| Sea lamprey (Petromyzon marinus) | 0.25 | - |
| Spottail shiner (Notropis hudsonius) | 0.37 | - |
| Catch per Seine Haul | |||
|---|---|---|---|
| Thermal Guild | 1993 | 2012 | % Change |
| Cold | 61.6 | 0.1 | −99.8 |
| Cool | 39.7 | 468.4 | 1079.8 |
| Warm | 15.7 | 50.4 | 221.0 |
| Total | 117.0 | 518.8 | 343.5 |
Publisher’s Note: MDPI stays neutral with regard to jurisdictional claims in published maps and institutional affiliations. |
© 2022 by the authors. Licensee MDPI, Basel, Switzerland. This article is an open access article distributed under the terms and conditions of the Creative Commons Attribution (CC BY) license (https://creativecommons.org/licenses/by/4.0/).
Share and Cite
Bowser, J.; Galarowicz, T.; Murry, B.; Johnson, J. Invasive Species Appearance and Climate Change Correspond with Dramatic Regime Shift in Thermal Guild Composition of Lake Huron Beach Fish Assemblages. Fishes 2022, 7, 263. https://doi.org/10.3390/fishes7050263
Bowser J, Galarowicz T, Murry B, Johnson J. Invasive Species Appearance and Climate Change Correspond with Dramatic Regime Shift in Thermal Guild Composition of Lake Huron Beach Fish Assemblages. Fishes. 2022; 7(5):263. https://doi.org/10.3390/fishes7050263
Chicago/Turabian StyleBowser, Jessica, Tracy Galarowicz, Brent Murry, and Jim Johnson. 2022. "Invasive Species Appearance and Climate Change Correspond with Dramatic Regime Shift in Thermal Guild Composition of Lake Huron Beach Fish Assemblages" Fishes 7, no. 5: 263. https://doi.org/10.3390/fishes7050263
APA StyleBowser, J., Galarowicz, T., Murry, B., & Johnson, J. (2022). Invasive Species Appearance and Climate Change Correspond with Dramatic Regime Shift in Thermal Guild Composition of Lake Huron Beach Fish Assemblages. Fishes, 7(5), 263. https://doi.org/10.3390/fishes7050263