Article

Transcriptome Analysis of Immune Response against Streptococcus agalactiae Infection in the Nile Tilapia GIFT Strain

1
Key Laboratory of Exploration and Utilization of Aquatic Genetic Resources, Ministry of Education, Shanghai Ocean University, Shanghai 201306, China
2
International Research Center for Marine Biosciences, Ministry of Science and Technology, Shanghai Ocean University, Shanghai 201306, China
3
National Demonstration Center for Experimental Fisheries Science Education, Shanghai Ocean University, Shanghai 201306, China
4
Faculty of Sciences and Technology, University of Algarve, 8005-139 Faro, Portugal
*
Authors to whom correspondence should be addressed.
These authors contributed equally to this article.
Fishes 2022, 7(5), 246; https://doi.org/10.3390/fishes7050246
Submission received: 15 July 2022 / Revised: 28 August 2022 / Accepted: 7 September 2022 / Published: 20 September 2022
(This article belongs to the Special Issue Study in Immune System and Disease of Fishes)

Abstract

:
Streptococcus agalactiae (group B streptococcus, GBS), a broad-spectrum pathogen, causes great economic losses in fish aquaculture, especially the industry of tilapia. Until now, the knowledge of the immune response mechanism against S. agalactiae infection in tilapia has been limited. In the present study, the gill transcriptome of the tilapia from the GBS and the phosphate buffered saline (PBS) groups were sequenced. The transcriptomic analysis results presented the differentially expressed genes (DEGs) at different time points (DEGs number, 6 h: 2122, 9 h: 1851, 15 h: 1791, and 18 h: 2395) after GBS injection, and significantly enriched immune-related gene ontology (GO) terms such as the innate immune response. The significantly enriched immune pathways included the Toll-like receptor signaling pathway, the nucleotide oligomerization domain (NOD)-like receptor signaling pathway, the cytosolic-DNA sensing pathway, and the intestinal immune network for Immunoglobulin A (IgA) production. Most of the DEGs in Toll-like receptor signaling, NOD-like receptor signaling, and cytosolic-DNA sensing pathways presented upregulations at 18 h, which indicated that the innate immune pathways were activated. Two immune-related pathways (phagosome and cell adhesion molecules) were significantly enriched at all time points, suggesting that these two pathways might also play important roles in the immune response against the GBS infection. The results of HE staining showed that the gills of tilapia were damaged seriously at 9 h post-infection, which might be due to the possibility of pyroptosis resulting from the changes of DEGs in the NOD-like receptor signaling pathway. This study provided new insight into the mechanisms of gill damage in fish infected with S. agalactiae.

1. Introduction

Streptococcus agalactiae, a Gram-positive pathogenic bacterium, also known as group B streptococcus (GBS), was first reported in 1939 as an important opportunistic agent [1,2]. As a broad-spectrum pathogen, it is recognized as a serious causative agent of zoonosis including mammals and fish [3,4,5,6,7,8,9]. S. agalactiae has been isolated from numerous fish species in natural outbreaks of disease, and has been shown to be pathogenic to several fish species in experimental trials using different routes of infection such as cohabitation, immersion, and intraperitoneal (IP) and intra-muscular injections [10]. It affects a variety of freshwater and saltwater fish aquacultures, causing significant morbidity and mortality worldwide, particularly in tilapia. Streptococci have the ability to disseminate through tissues, and multiple virulence factors have been described to play roles in this function. S. agalactiae had a predilection for some organs such as the brain, eyes and heart, which were also positive by histopathology [11]. Viable S. agalactiae were seen within macrophages, which was previously demonstrated by Pulido et al. [12] using electron microscopy, and S. agalactiae may reach different organs via transport within macrophages.
Tilapia is an important economical fish around the world, especially in China, where the production accounts for nearly half of the global production [13,14]. Recently, S. agalactiae has become one of the most serious bacterial diseases in southern China, causing high cumulative mortality and economic loss to the tilapia industry [6,8]. Moreover, co-infections of virus and bacteria in cultured tilapia is a new threat for the tilapia industry [15]. Nevertheless, effective immune measures to control and prevent the infection of S. agalactiae have not yet been developed due to the limited knowledge of immune mechanisms against this bacterial infection in tilapia.
Gills have evolved in various organisms as multifunctional organs involved in respiration, pH, hormones, etc. [16]. Constant contact with the aquatic environment means that fish gills suffer from the invasion of pathogens [17]. Fish mucosal organs (gills, skin, and gut) are lined with epithelium equipped with mucus-producing cells, which are channels for both the innate and adaptive immune defense [18,19]. Adverse conditions are commonly characterized by inflammation and epithelial cell hyperplasia in the fish gill diseases. Clearly, adequately regulated immune responses distinguishing between self and non-self are imperative to maintain tissue homeostasis and integrity, and in this way, the gills are very similar to the gut where a number of diseases may occur if these outer barriers get out of balance [19]. GBS were detected in a sampled gill, indicating generalized infection and colonization of body surfaces including gills as a consequence of intraperitoneal injection [20,21]. After infection via GBS fish isolates (intraperitoneally injected with approximately 1 × 10⁸ CFU), tilapia showed hemorrhage of the gills (8.3–58.3%) [21]. However, the underlying mechanism of fish gills against S. agalactiae are still unknown.
Although several studies have been conducted to understand the molecular responses against S. agalactiae infection in tilapia, most of the studies focused on the characterization of the expression profiles of certain genes by qPCR [22,23], or the efficiency of recombinant propeptide in resistance against S. agalactiae [24]. With the development of next-generation sequencing technology, RNA-seq allows the identification of gene sequences and determination of their expression levels at the same time, which is widely employed in the teleost to characterize the host bacteria interactions [4,22]. Until now, few transcriptomic studies have been conducted in the gill of tilapia during infection [25,26]. Therefore, we sought here to characterize the expression profiles of tilapia gills against S. agalactiae infection at the whole transcriptome level by RNA-seq technology. The objectives of this study were to investigate the molecular mechanisms involved in its susceptibility to S. agalactiae and provide new insight into the mechanisms of gill damage in fish infected with S. agalactiae.

2. Materials and Methods

2.1. Experimental Design and Sampling

Genetically improved farmed tilapia (GIFT) strain Nile Tilapias (Oreochromis niloticus) (size 3.34 ± 1.05 cm/5.85 ± 0.63 g) were obtained from the Guangxi Academy of Fishery Sciences. The S. agalactiae strain was provided by the disease lab at the Shanghai Ocean University, and its concentration was determined using colony-forming units (CFU) per mL by plating 10 mL of 10-fold serial dilutions onto brain heart infusion broth (BHI; DifcoTM, San Diego, CA, USA) agar plates. The fish were randomly divided into three groups: untreated group (no treatment), GBS group (injected with S. agalactiae), and PBS group (injected with PBS solution), with 50 fish per aquaria (30 L with 20 L water), and the water temperature was kept at 32 ± 0.5 °C. The fish in the GBS group were intraperitoneally injected with a bacterial culture of 6.67 × 10⁵ CFU, while the fish from the PBS group received the same volume of PBS solution. Survival rate was calculated each hour by counting tilapias survived in the GBS group from 0 h to 43 h (survival rate = {number of tilapias survived}/50). Five fish in the untreated group were sampled and named as C0h. Gill samples from five fish in the treated group (the GBS and PBS groups) were, respectively, collected at corresponding time points (6 h, 9 h, 15 h, 18 h) and marked according to the time point (GBS: B6h, B9h, B15h, B18h; PBS: P6h, P9h, P15h, P18h) following injection. All samples were flash-frozen in liquid nitrogen and stored at −80 °C before RNA extraction.

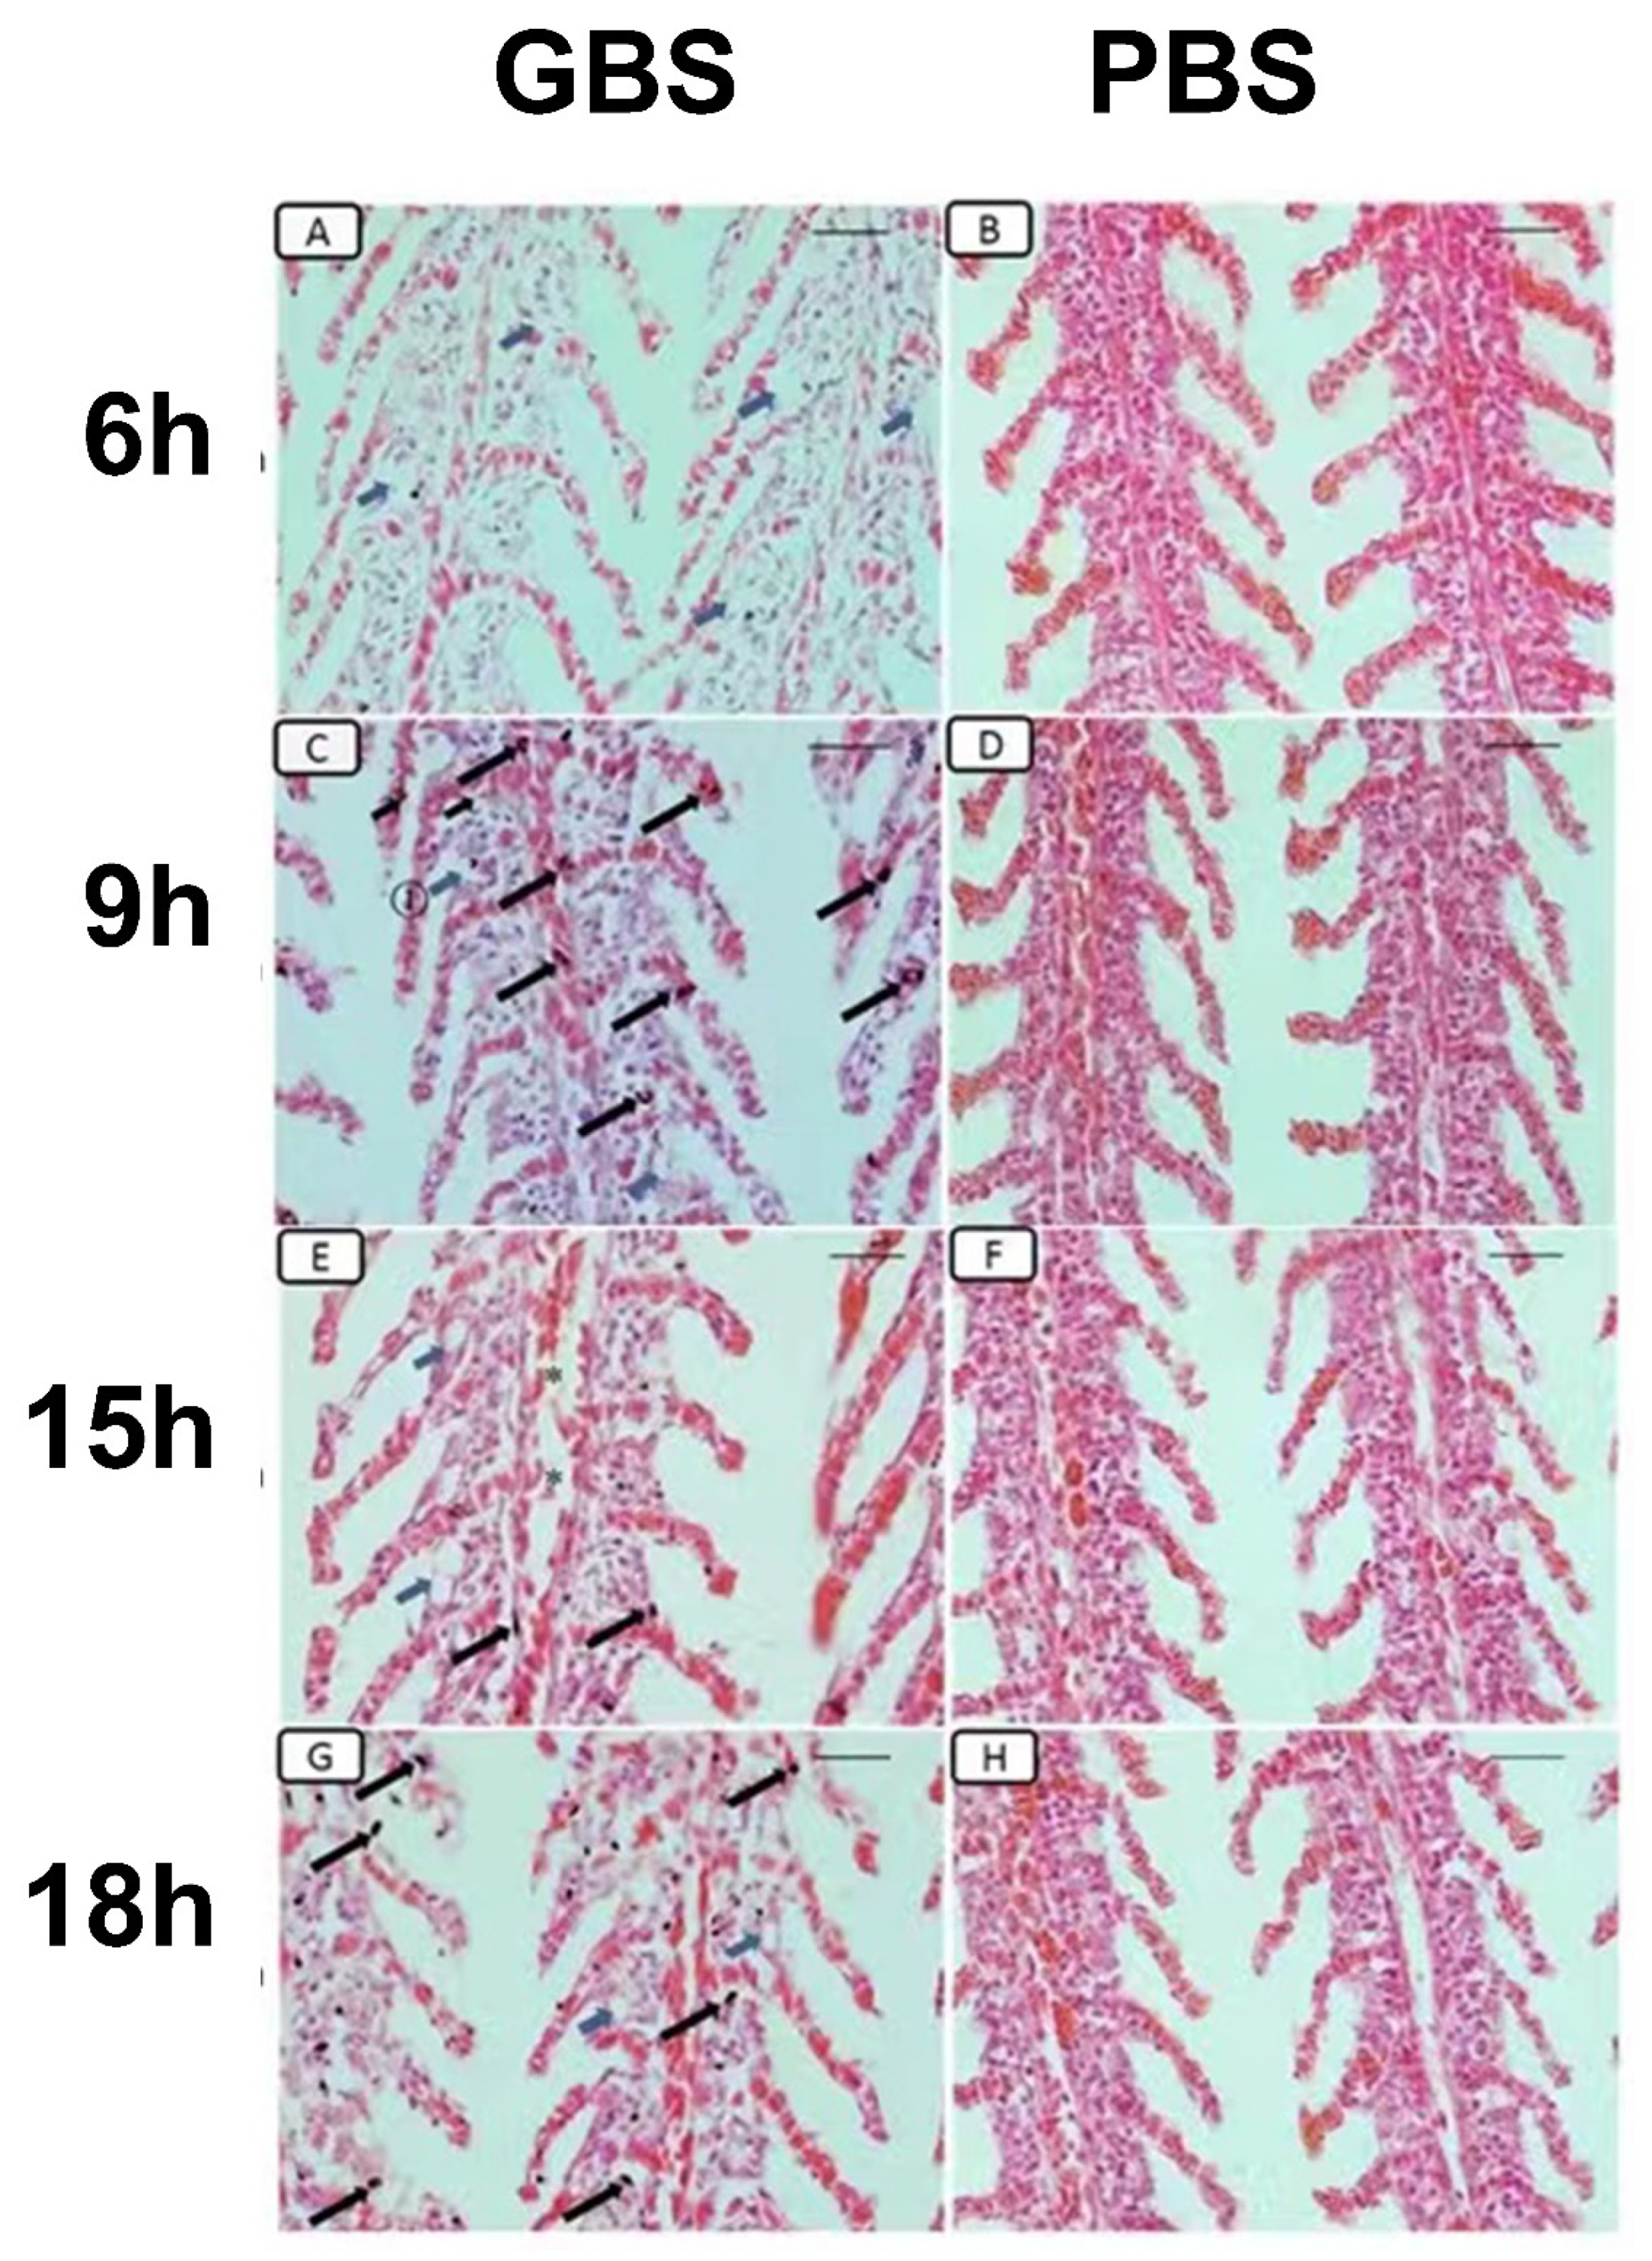
2.2. Paraffin Sections of the Gill

The excised gill samples (5 fish in each treated group at different time points) were fixed in paraformaldehyde (4%) for 24 h. The fixed gills were then dehydrated in ascending concentrations of alcohol and cleaned in xylol, followed by vacuum-embedding in paraffin. The embedded gills were sectioned with a rotary microtome at 5 μm. The tissue slices of the gills were stained with hematoxylin and eosin (HE). The stained sections were analyzed using the BX51 system (OLYMPUS, Tokyo, Japan), and digital images were taken using Image-Pro plus 6.0.

2.3. RNA Isolate and Sequencing

Total RNA was extracted from the gill samples (mixed using 5 fish at each time point) using the RNAprep pure Tissue Kit following the manufacturer’s instructions (Tiangen Biotechnology Co., Ltd., Beijing, China). The quality of total RNA was assessed on an Agilent Bioanalyzer Chip RNA 7500 series II, and its concentration was determined by a Qubit fluorometer. Three micrograms of RNA from different groups at each time point were used to prepare the mRNA-Seq library with the TruSeq RNA Sample Prep Kit (Illumina) according to the manufacturer’s protocol. Proper index codes were used to attribute sequences to corresponding samples. Briefly, poly(A) + RNA was purified and fragmented using divalent cations at elevated temperatures. RNA fragments were converted to cDNA using random primers, followed by second-strand cDNA synthesis and end repair. Illumina PE adaptors were attached to the cDNA ends. Fragments that were approximately 300 bp in length were extracted from a 2% low-range ultra-agarose sizing gel. Adaptor-tagged cDNA fragments were enriched using the manufacturer’s cocktail and 10-cycle PCR. The library quality and insert length were checked using the DNA High Sensitivity DNA Kit (Bioanalyzer 2100, Agilent, Santa Clara, CA, USA) to ensure the proper insert size of 300–500 bp. A total of 4 libraries were separately generated from the gills of tilapia using the same protocol.

2.4. RNA Reads Processing and Mapping

Raw data were firstly processed through in-house Perl scripts. In this step, clean data (clean reads) were obtained after the removal of adapters, ploy-N, and low-quality bases. The Q20, Q30, GC-content, and sequence duplication level of the clean data were calculated. All the downstream analyses were based on clean data with high quality. Clean reads were mapped to the O. niloticus reference genome (http://asia.ensembl.org/info/data/ftp/index.html (accessed on 3 June 2020)) using HISAT 2 with default settings, and the reads from each sample were mapped separately.

2.5. Annotation

Sequences of the tilapia’s genes and proteins were downloaded from the Ensembl database (http://.asia.ensembl.org/info/data/ftp/index.html (accessed on 10 June 2020)). Gene and function annotations of the tilapia were performed using the BLASTP algorithm with an E-value cut-off of 10−5, which was based on the databases of the Nr (NCBI non-redundant protein sequences), Nt (NCBI non-redundant nucleotide sequences), KOG/COG (Clusters of Orthologous Groups of proteins), Swiss-Prot (A manually annotated and reviewed protein sequence database), Pfam (Protein family), KO (KEGG Ortholog database), and GO (Gene Ontology). KEGG annotation was performed on the KASS-KEGG Automatic Annotation Sever (http://www.genome.jp/tools/kaas/ (accessed on 20 June 2020)).

2.6. Differential Expression Analysis and Enrichment Analysis

Differential expression analysis of the GBS and PBS group samples at different time points was performed using the EBseq, and genes satisfied FDR < 0.05 & |Fold Change| ≥ 2 were interpreted as differentially expressed. Gene Ontology (GO) enrichment analysis of the differentially expressed genes (DEGs) was implemented by the GOseq R packages based on Wallenius non-central hypergeometric distribution [26], which can adjust for gene length bias in DEGs. KOBAS [27] software (v3.0.3, Dechao Bu, Peking, China) was used to test the statistical enrichment of differential expression genes in KEGG pathways.

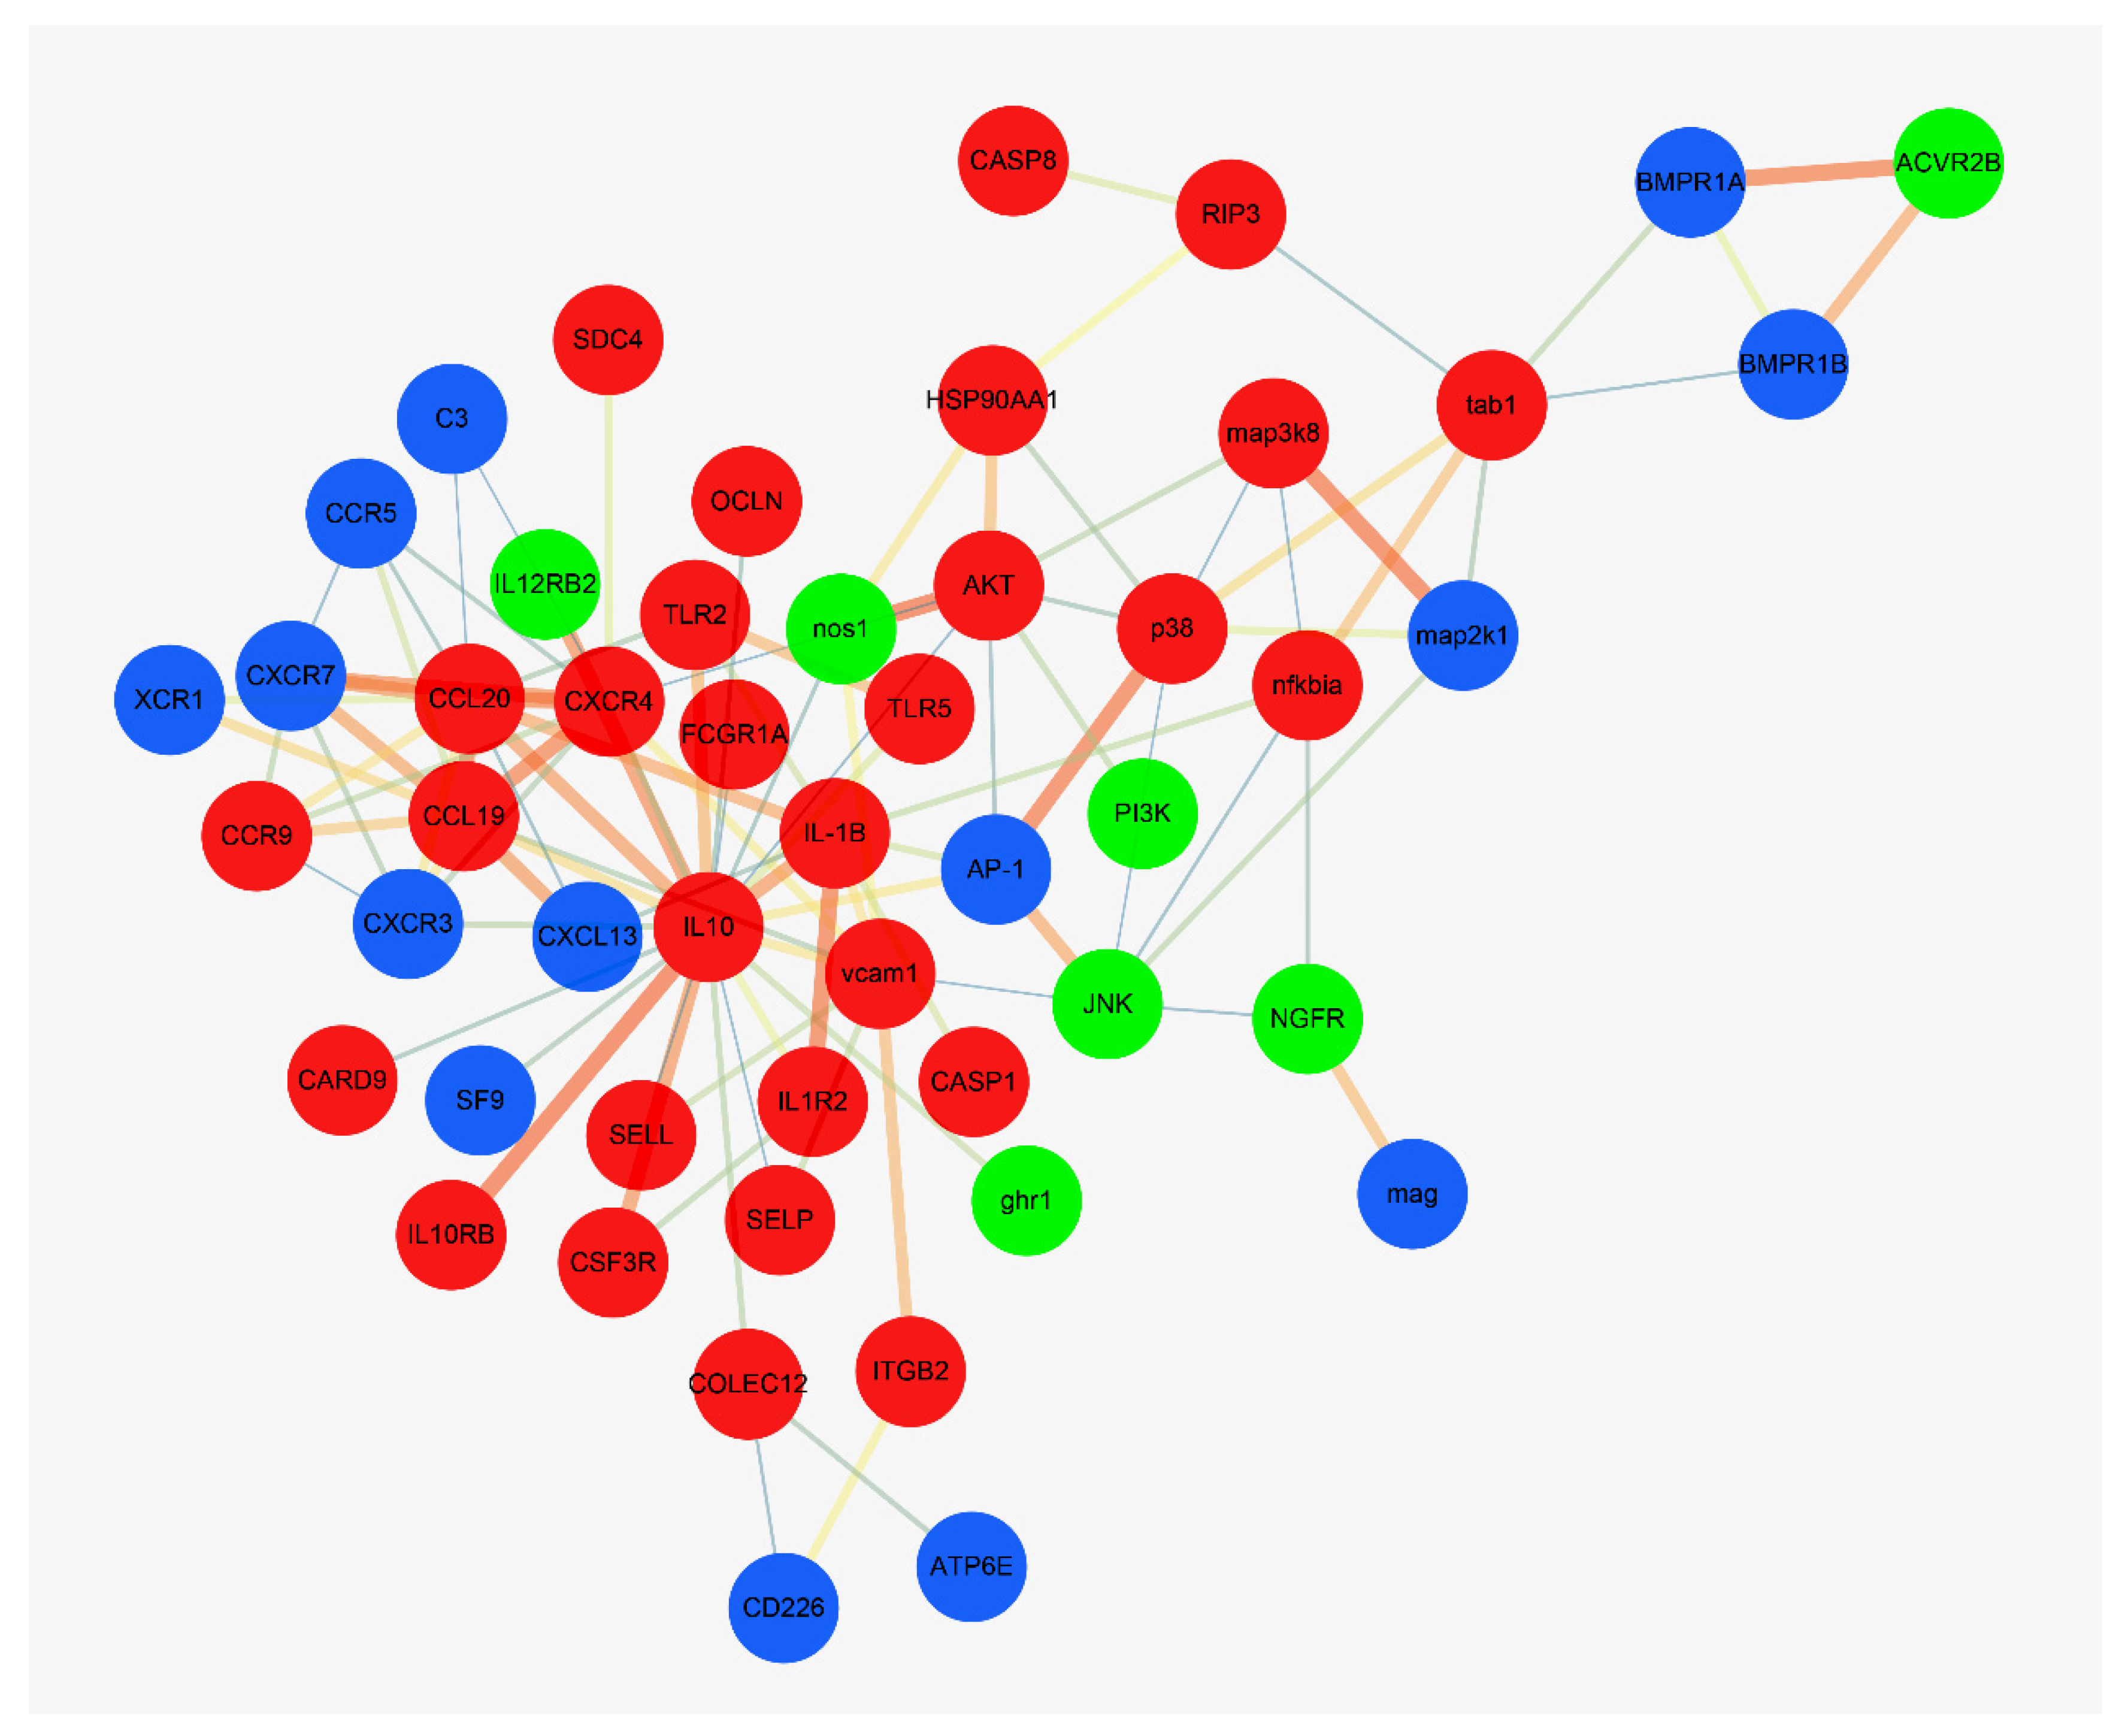
2.7. PPI (Protein–Protein Interaction)

Sequences of the DEGs were aligned to the O. niloticus reference genome using BLASTX to get the predicted PPI network (the protein–protein interaction which exists in the STRING database: http://string-db.org/ (accessed on 20 July 2020)), and the PPI network was visualized in Cytoscape [28].

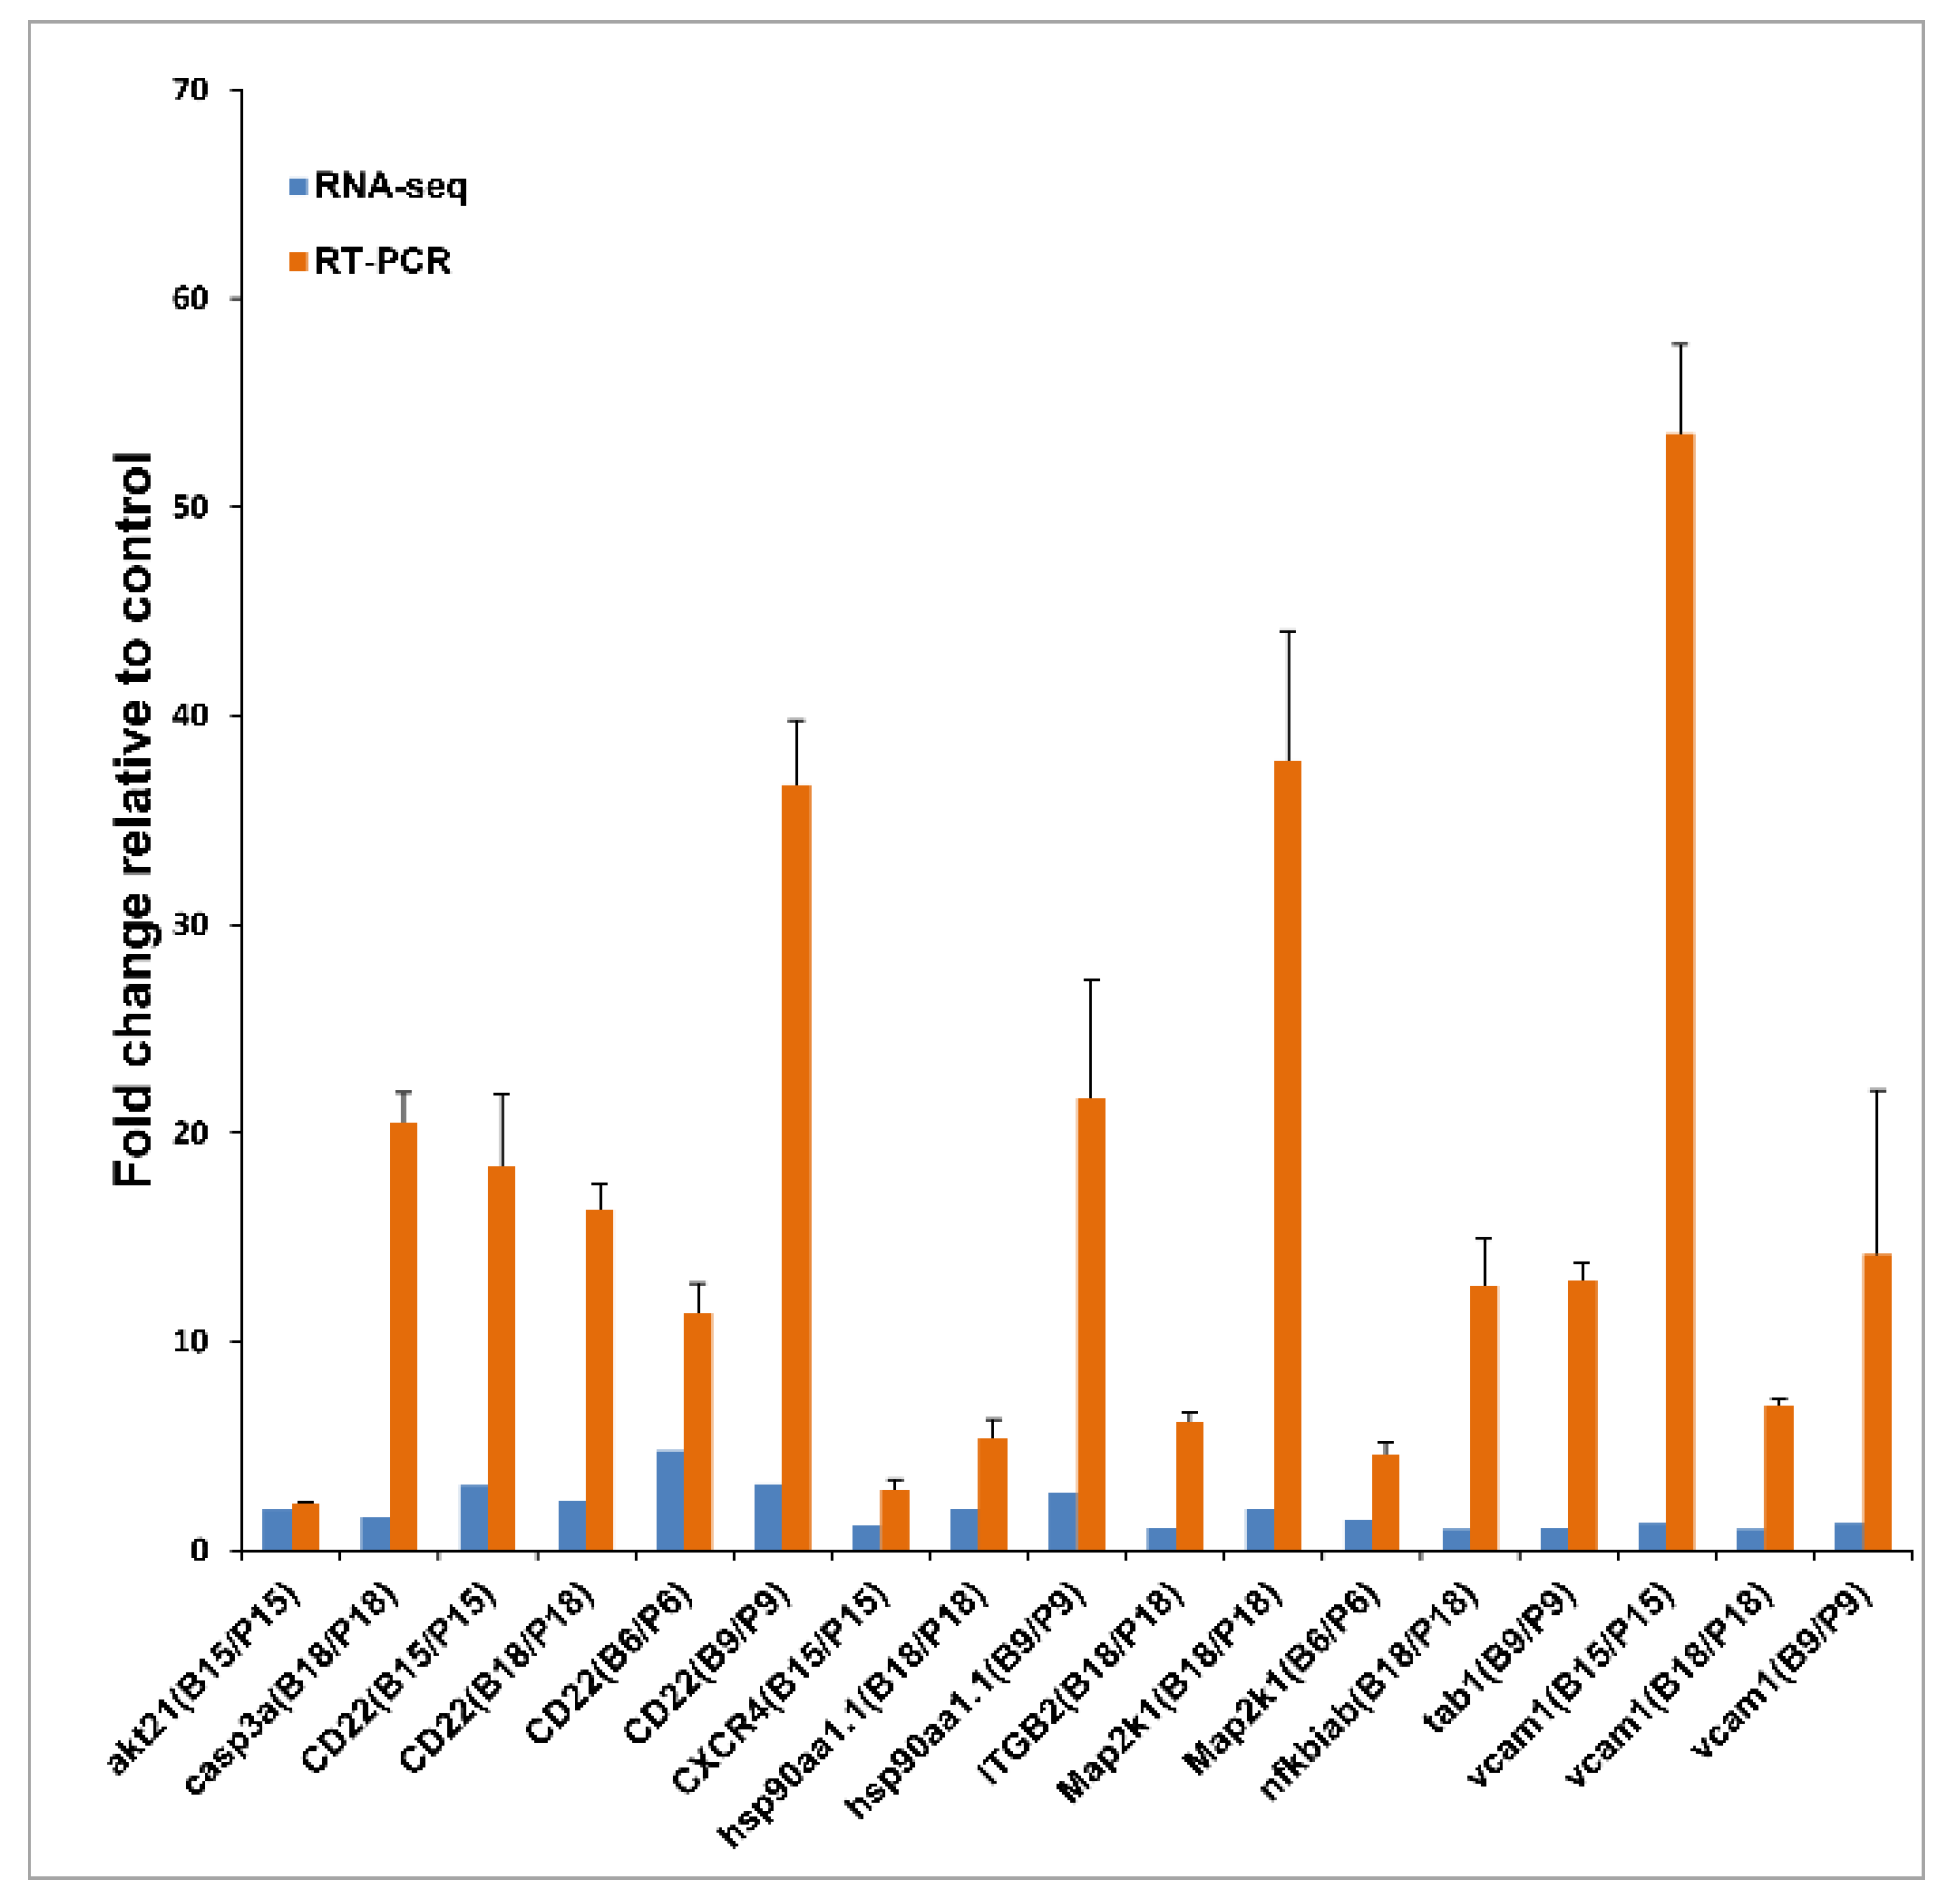
2.8. Real-Time RT-PCR Confirmation of Illumina Sequencing Data

From four comparisons (B6h vs. P6h, B9h vs. P9h, B15h vs. P15h, B18h vs. P18h), 10 differentially expressed genes were identified and selected for quantitative RT-PCR (RT-qPCR) analysis, using RNA samples as transcriptome profiling. The primers were designed using the PrimerQuest tool (sg.idtdna.com (accessed on 6 August 2020)), and their specificity was tested by Primer-BLAST [29]. All the primers used are listed in Table 1. The β-actin gene was determined as the internal control for the qPCR analysis. Two micrograms of RNA from each sample were reverse transcribed to cDNA using an RT-PCR kit (PrimeScript™ RT reagent Kit, Takara, Kusatsu, Shiga, Japan). A qPCR analysis was conducted in an Applied Biosystems 7500 Real-Time PCR System. PCR reactions (a 25 μL reaction mixture containing 1 μL of each primer (10 μM), 2 μL first-strand cDNA as a template, 12.5 μL Roche FastStart Universal SYBR Green Master (Rox), and 8.5 μL water) were exposed to an initial denaturation (95 °C for 4 min), followed by 39 cycles of denaturing at 95 °C for 30 s, annealing at 60 °C for 20 s, and extending at 72 °C for 30 s. The relative transcript abundance of each gene was obtained by normalizing with the O. niloticus β-actin gene expression based on the 2−ΔΔCT method [30].

3. Results

3.1. RNA Sequencing Results

The raw data were deposited to the National Center for Biotechnology Information (NCBI, Bethesda, MD, USA) with the accession number of PRJNA751364. Approximately 36.6–54.7 M clean reads were obtained from different samples after trimming. The percentages of total mapped reads ranged from 80.04 to 86.34%, and the numbers of mapped reads were shown in Table 2.

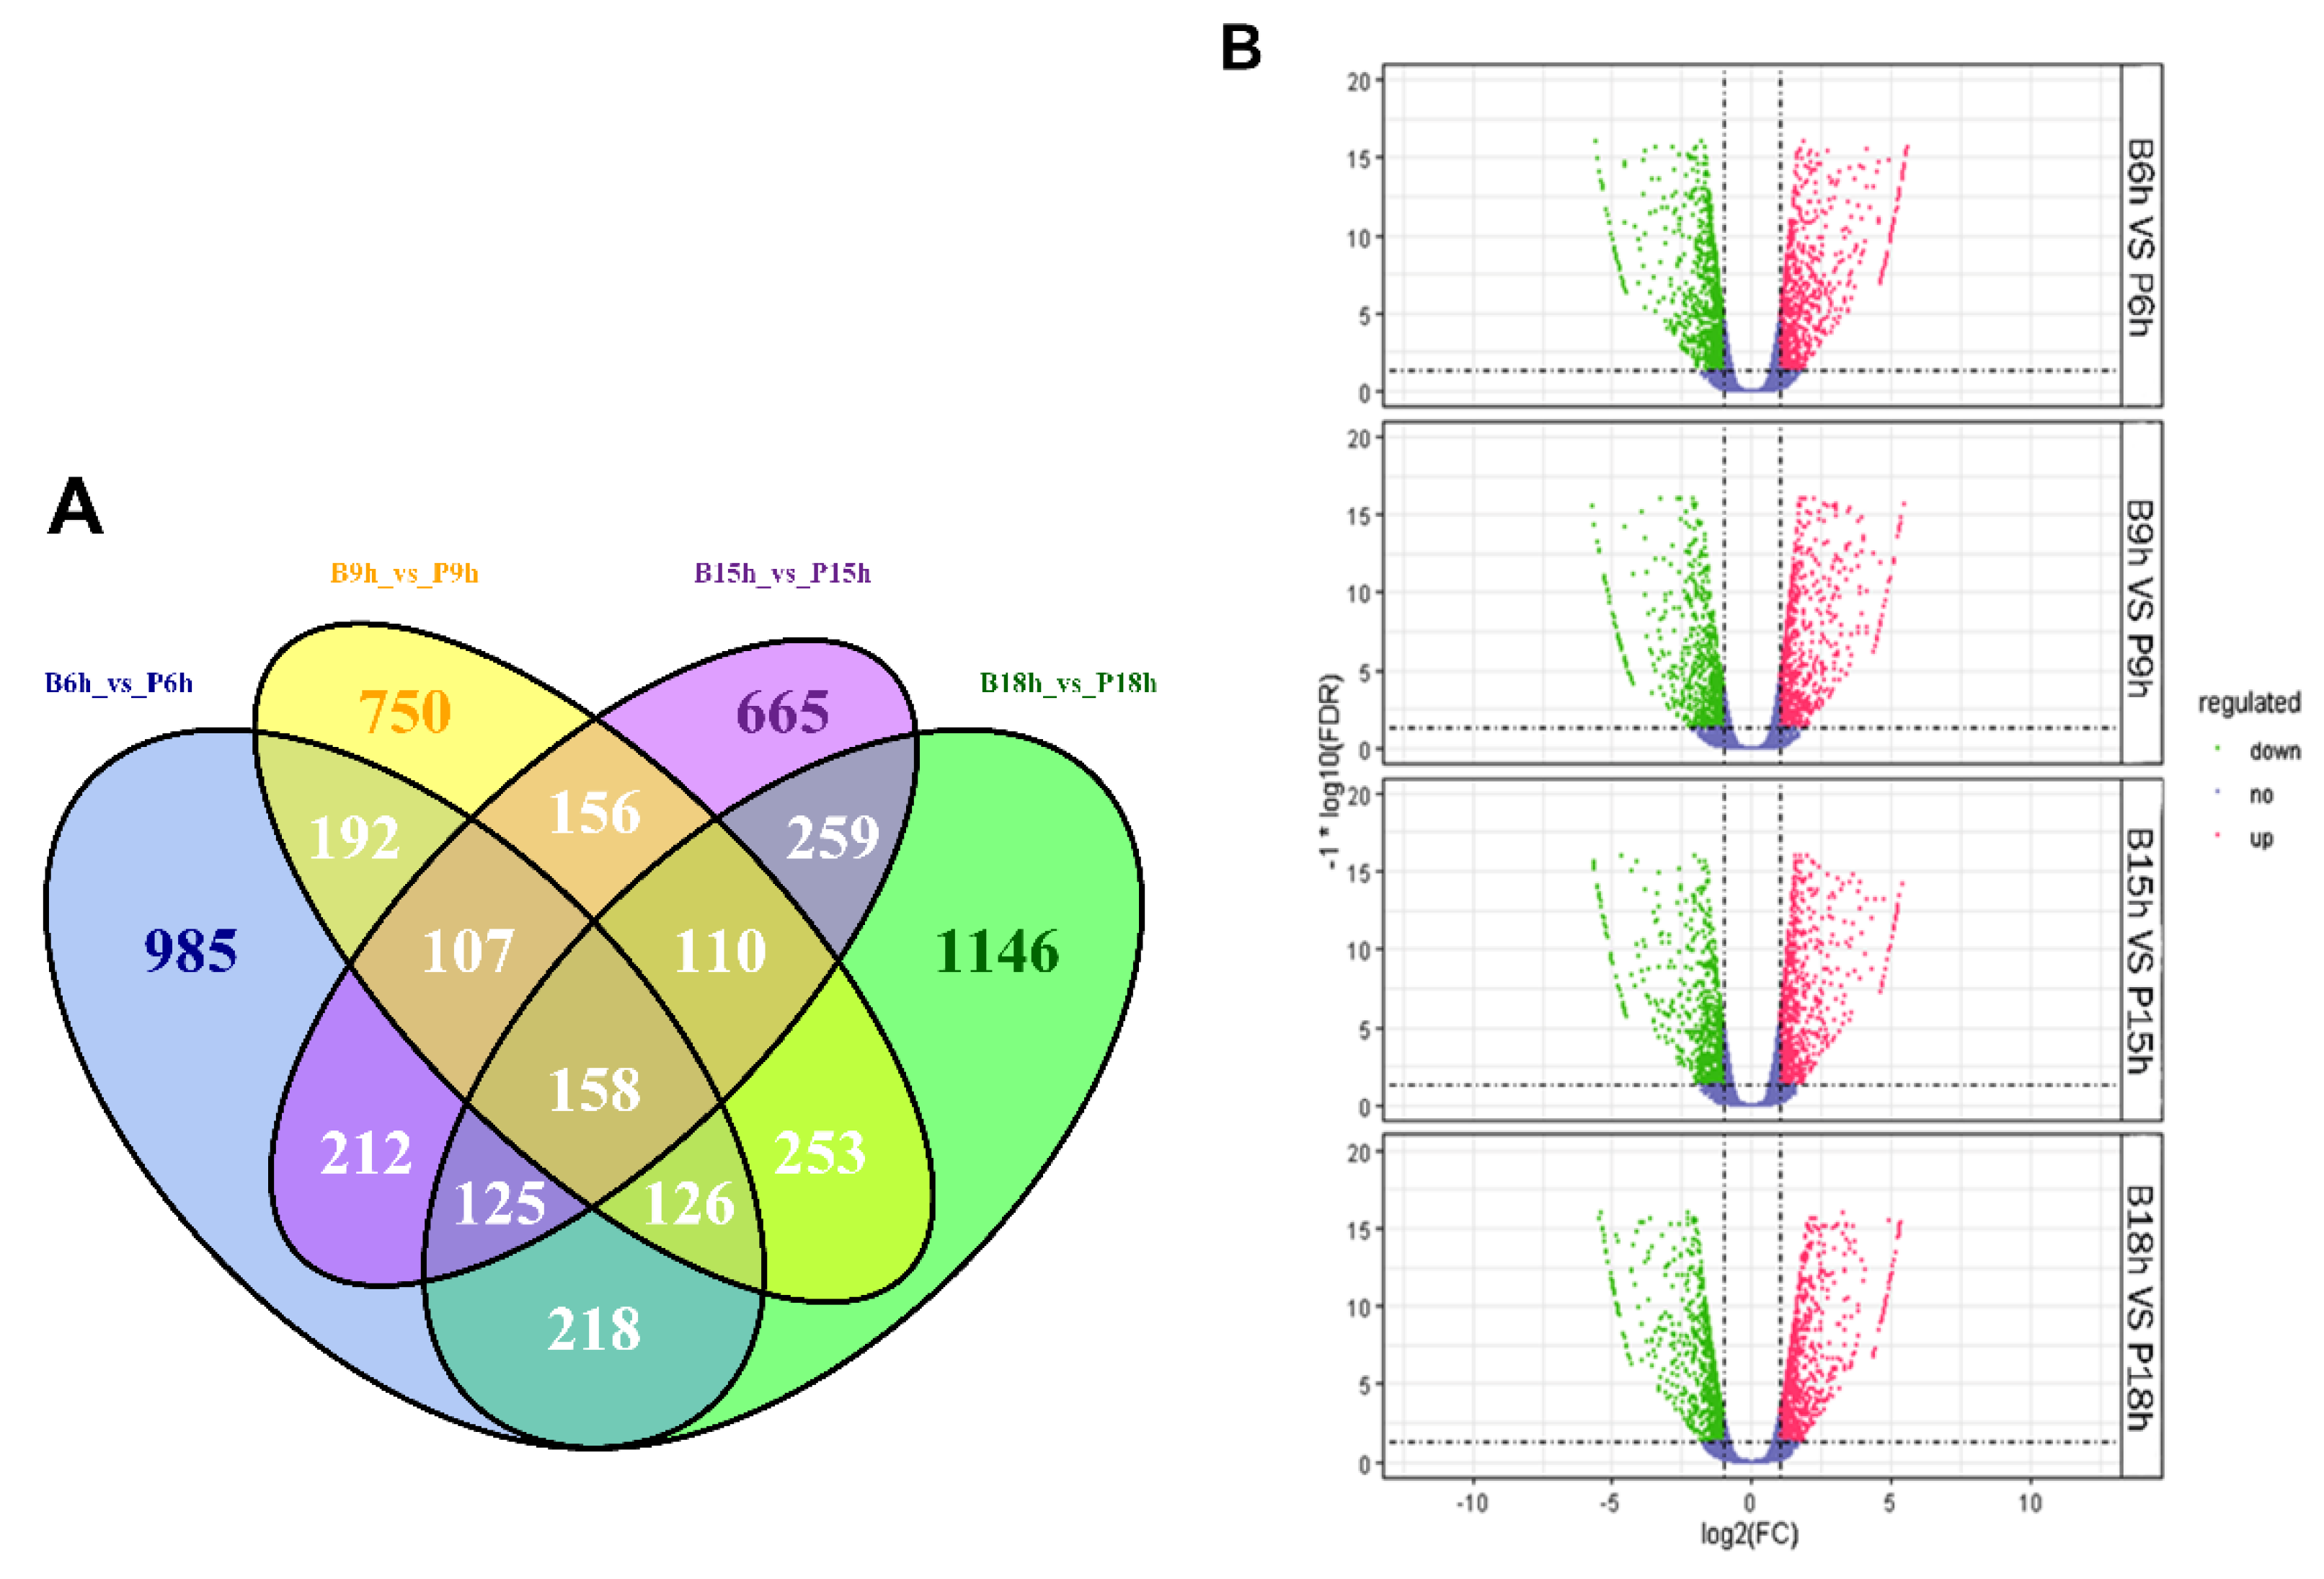
3.2. Differential Gene Expression Analysis

The differentially expressed genes between the samples (GBS group and PBS group) at each corresponding time point were identified. The B6h vs. P6h yielded 2122 DEGs (upregulated: 1074; downregulated: 1048). In the B9h vs. P9h, 1851 DEGs were identified (816 upregulated; 1035 downregulated). In the B15h vs. P15h, there were 1791 DEGs (822 upregulated; 969 downregulated). In the B18h vs. P18h, 2395 DEGs were identified (1134 upregulated; 1261 downregulated). The volcano plot and Venn diagram results of the DEGs are shown in Figure 1. The Venn diagram showed the total number of DEGs at different time points that was divided into numbers of unique and common DEGs, and the number of downregulated genes was bigger than that upregulated at 9 h, 15 h, and 18 h. There were 158 common DEGs at four time points, and hierarchical clustering of the top 20 DEGs involved in these common DEGs based on the gene expression patterns are shown in Figure 2.

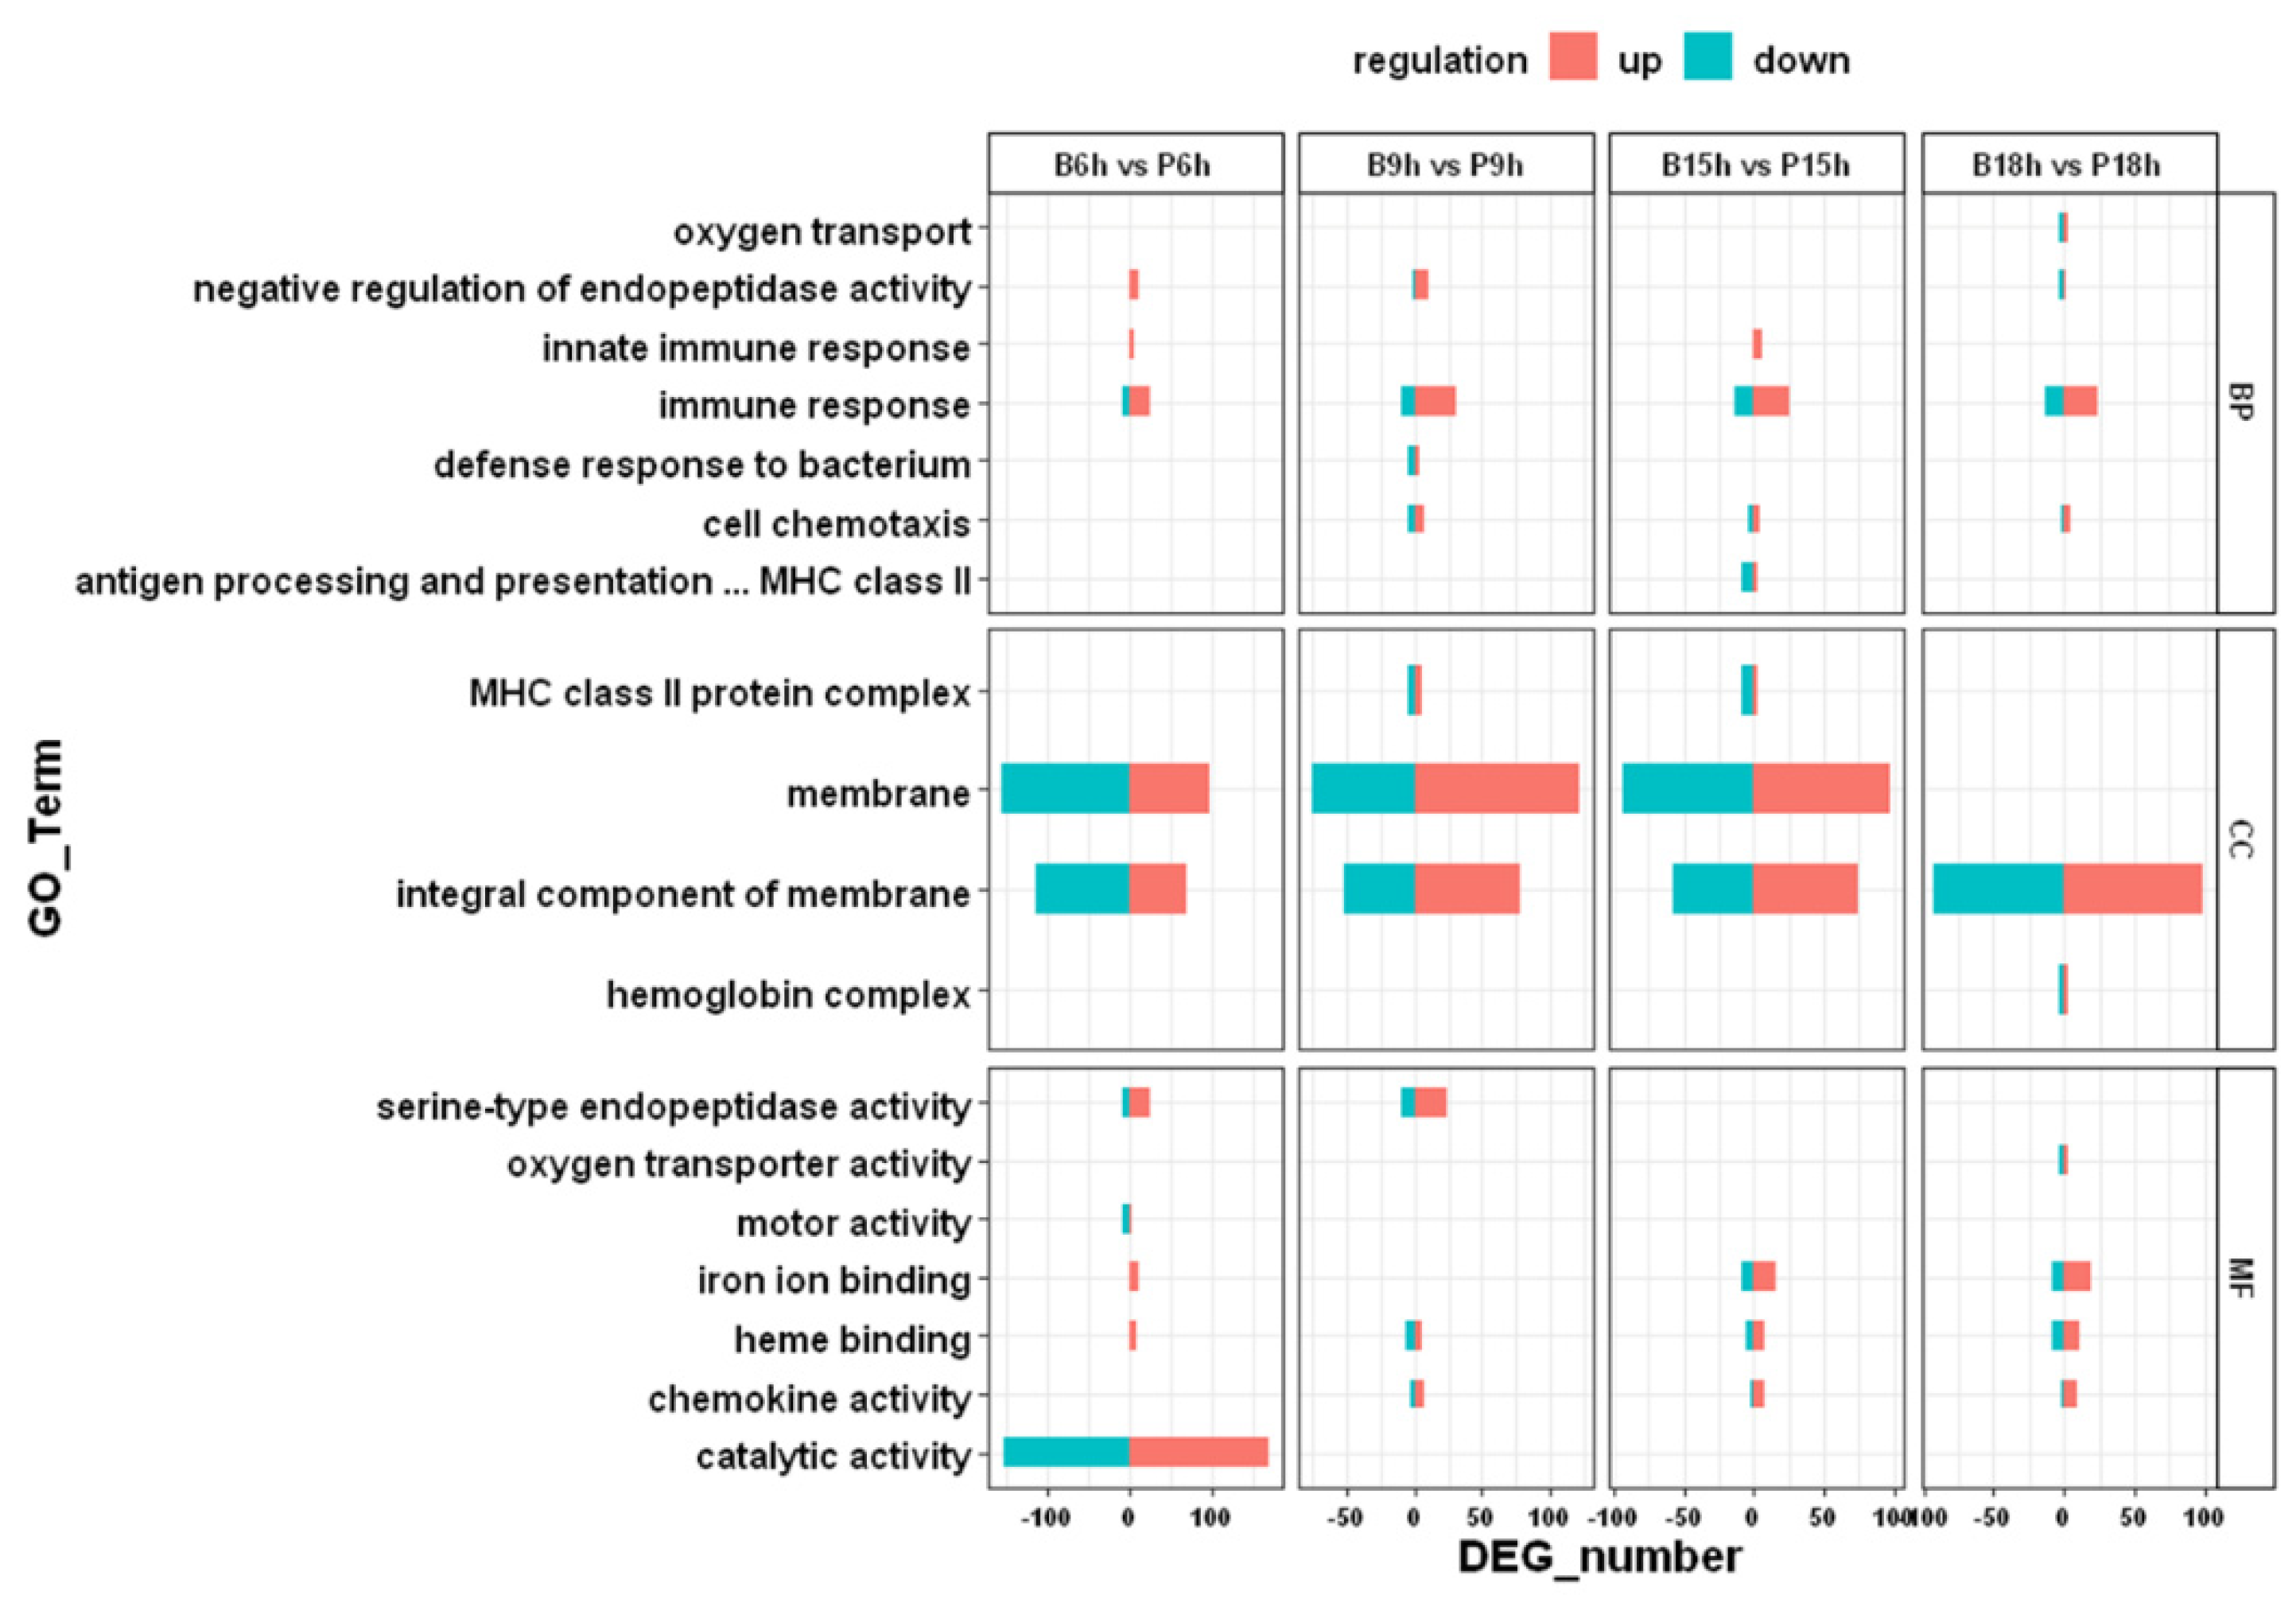
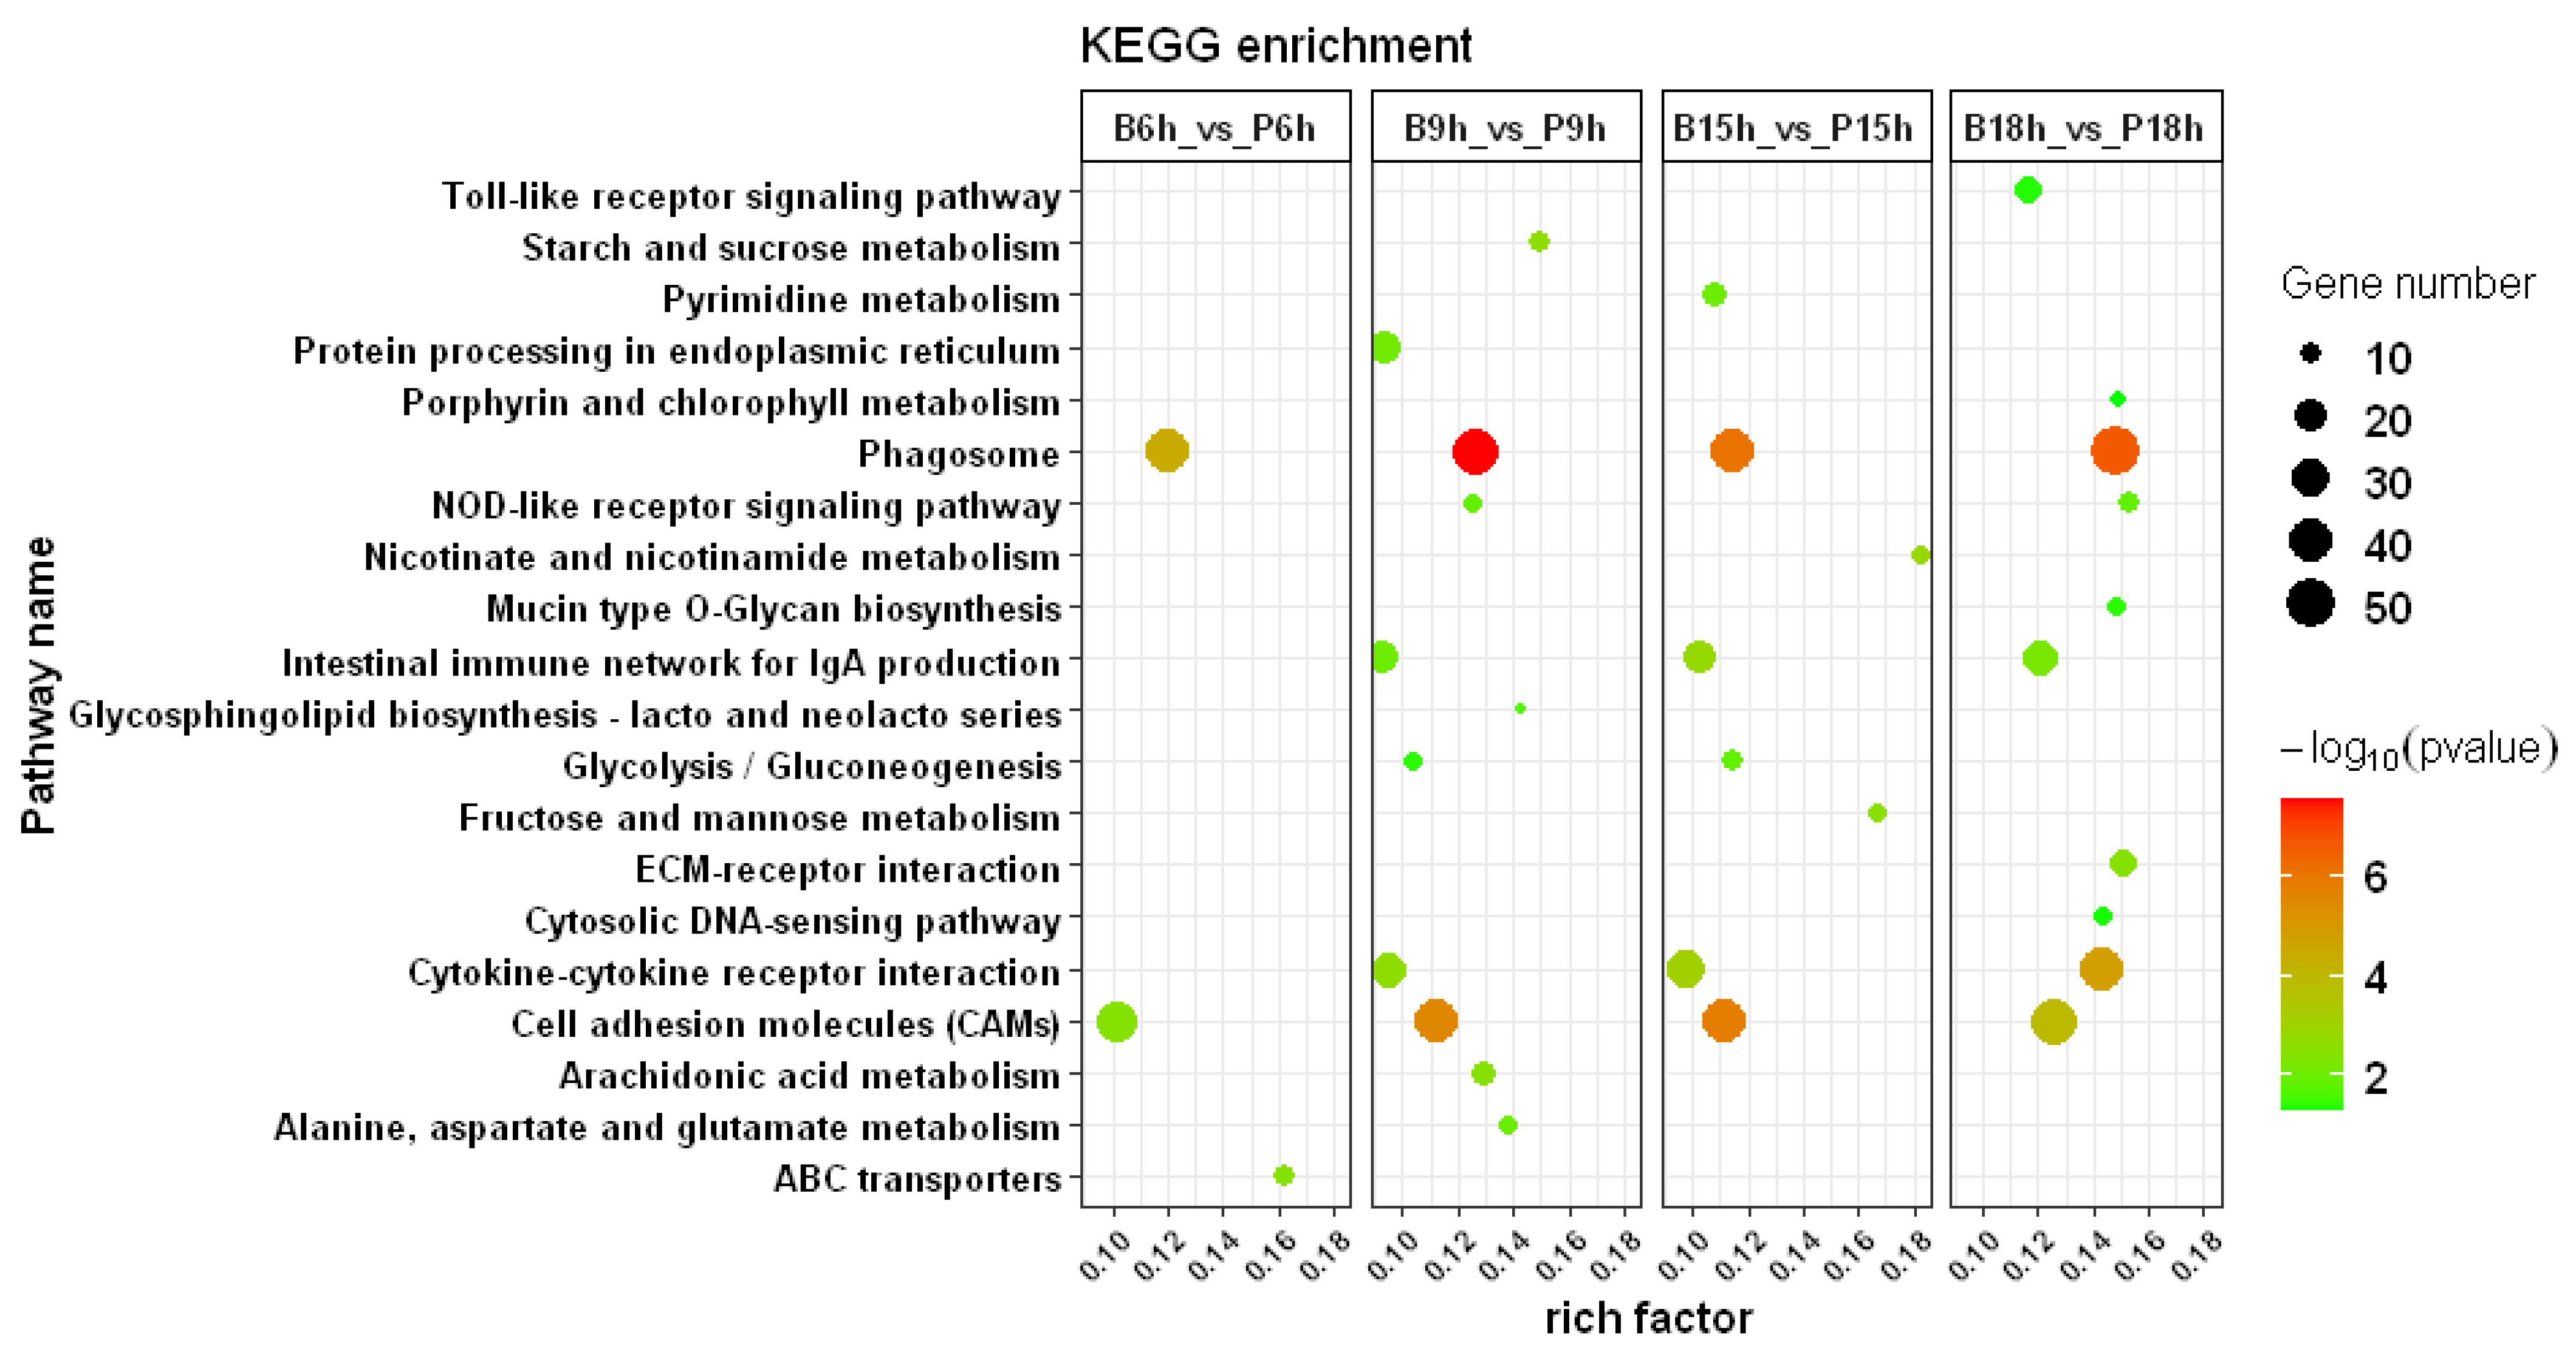
3.3. GO and KEGG Enrichment Analysis

GO enrichment was conducted for the four comparisons (B6h vs. P6h, B9h vs. P9h, B15h vs. P15h, B18h vs. P18h). In the B6h vs. P6h, 833 DEGs could be assigned by GO classification, and the corresponding number for B9h vs. P9h was 747. In the B15h vs. P15h, 677 DEGs could be assigned by GO classification, and the corresponding number for B18h vs. P18h was 983. The top two significant enriched GO terms in the biological process of the B6h vs. P6h were immune response (GO:0006955) and negative regulation of endopeptidase activity (GO:0010951), while that in all of other comparisons (B9h vs. P9h, B15h vs. P15h, and B18h vs. P18h) were immune response (GO:0006955) and cell chemotaxis (GO:0060326). The top 18 significantly enriched GO terms in four comparisons were shown in Figure 3. Immune-related GO terms including immune response, innate immune response, antigen processing and presentation, and complement activation were significantly enriched in these four comparisons (Table S1).
The classified genes of the GBS and PBS groups resulted in 337 different pathways, which were included in five categories of KEGG pathways, such as metabolism, genetic information processing, environmental information processing, cellular process, organism systems, and human diseases. In the B6h vs. P6h, 1000 DEGs were assigned to 143 pathways. In the B9h vs. P9h, 802 DEGs were assigned to 144 pathways. In the B15h vs. P15h, 788 DEGs were assigned to 133 pathways. In the B18h vs. P18h, 1036 DEGs were assigned to 139 pathways. In three comparisons (B6h vs. P6h, B9h vs. P9h, and B15h vs. P15h), the top two significantly enriched pathways were phagosome (ko04145) and cell adhesion molecules (CAMs) (ko04514). In the B18h vs. P18h, the top two significantly enriched pathways were phagosome (ko04145) (Table S1) and cytokine–cytokine receptor interaction (ko04060). The KEGG enrichment among the GBS and PBS groups at different time points is shown in Figure 4.

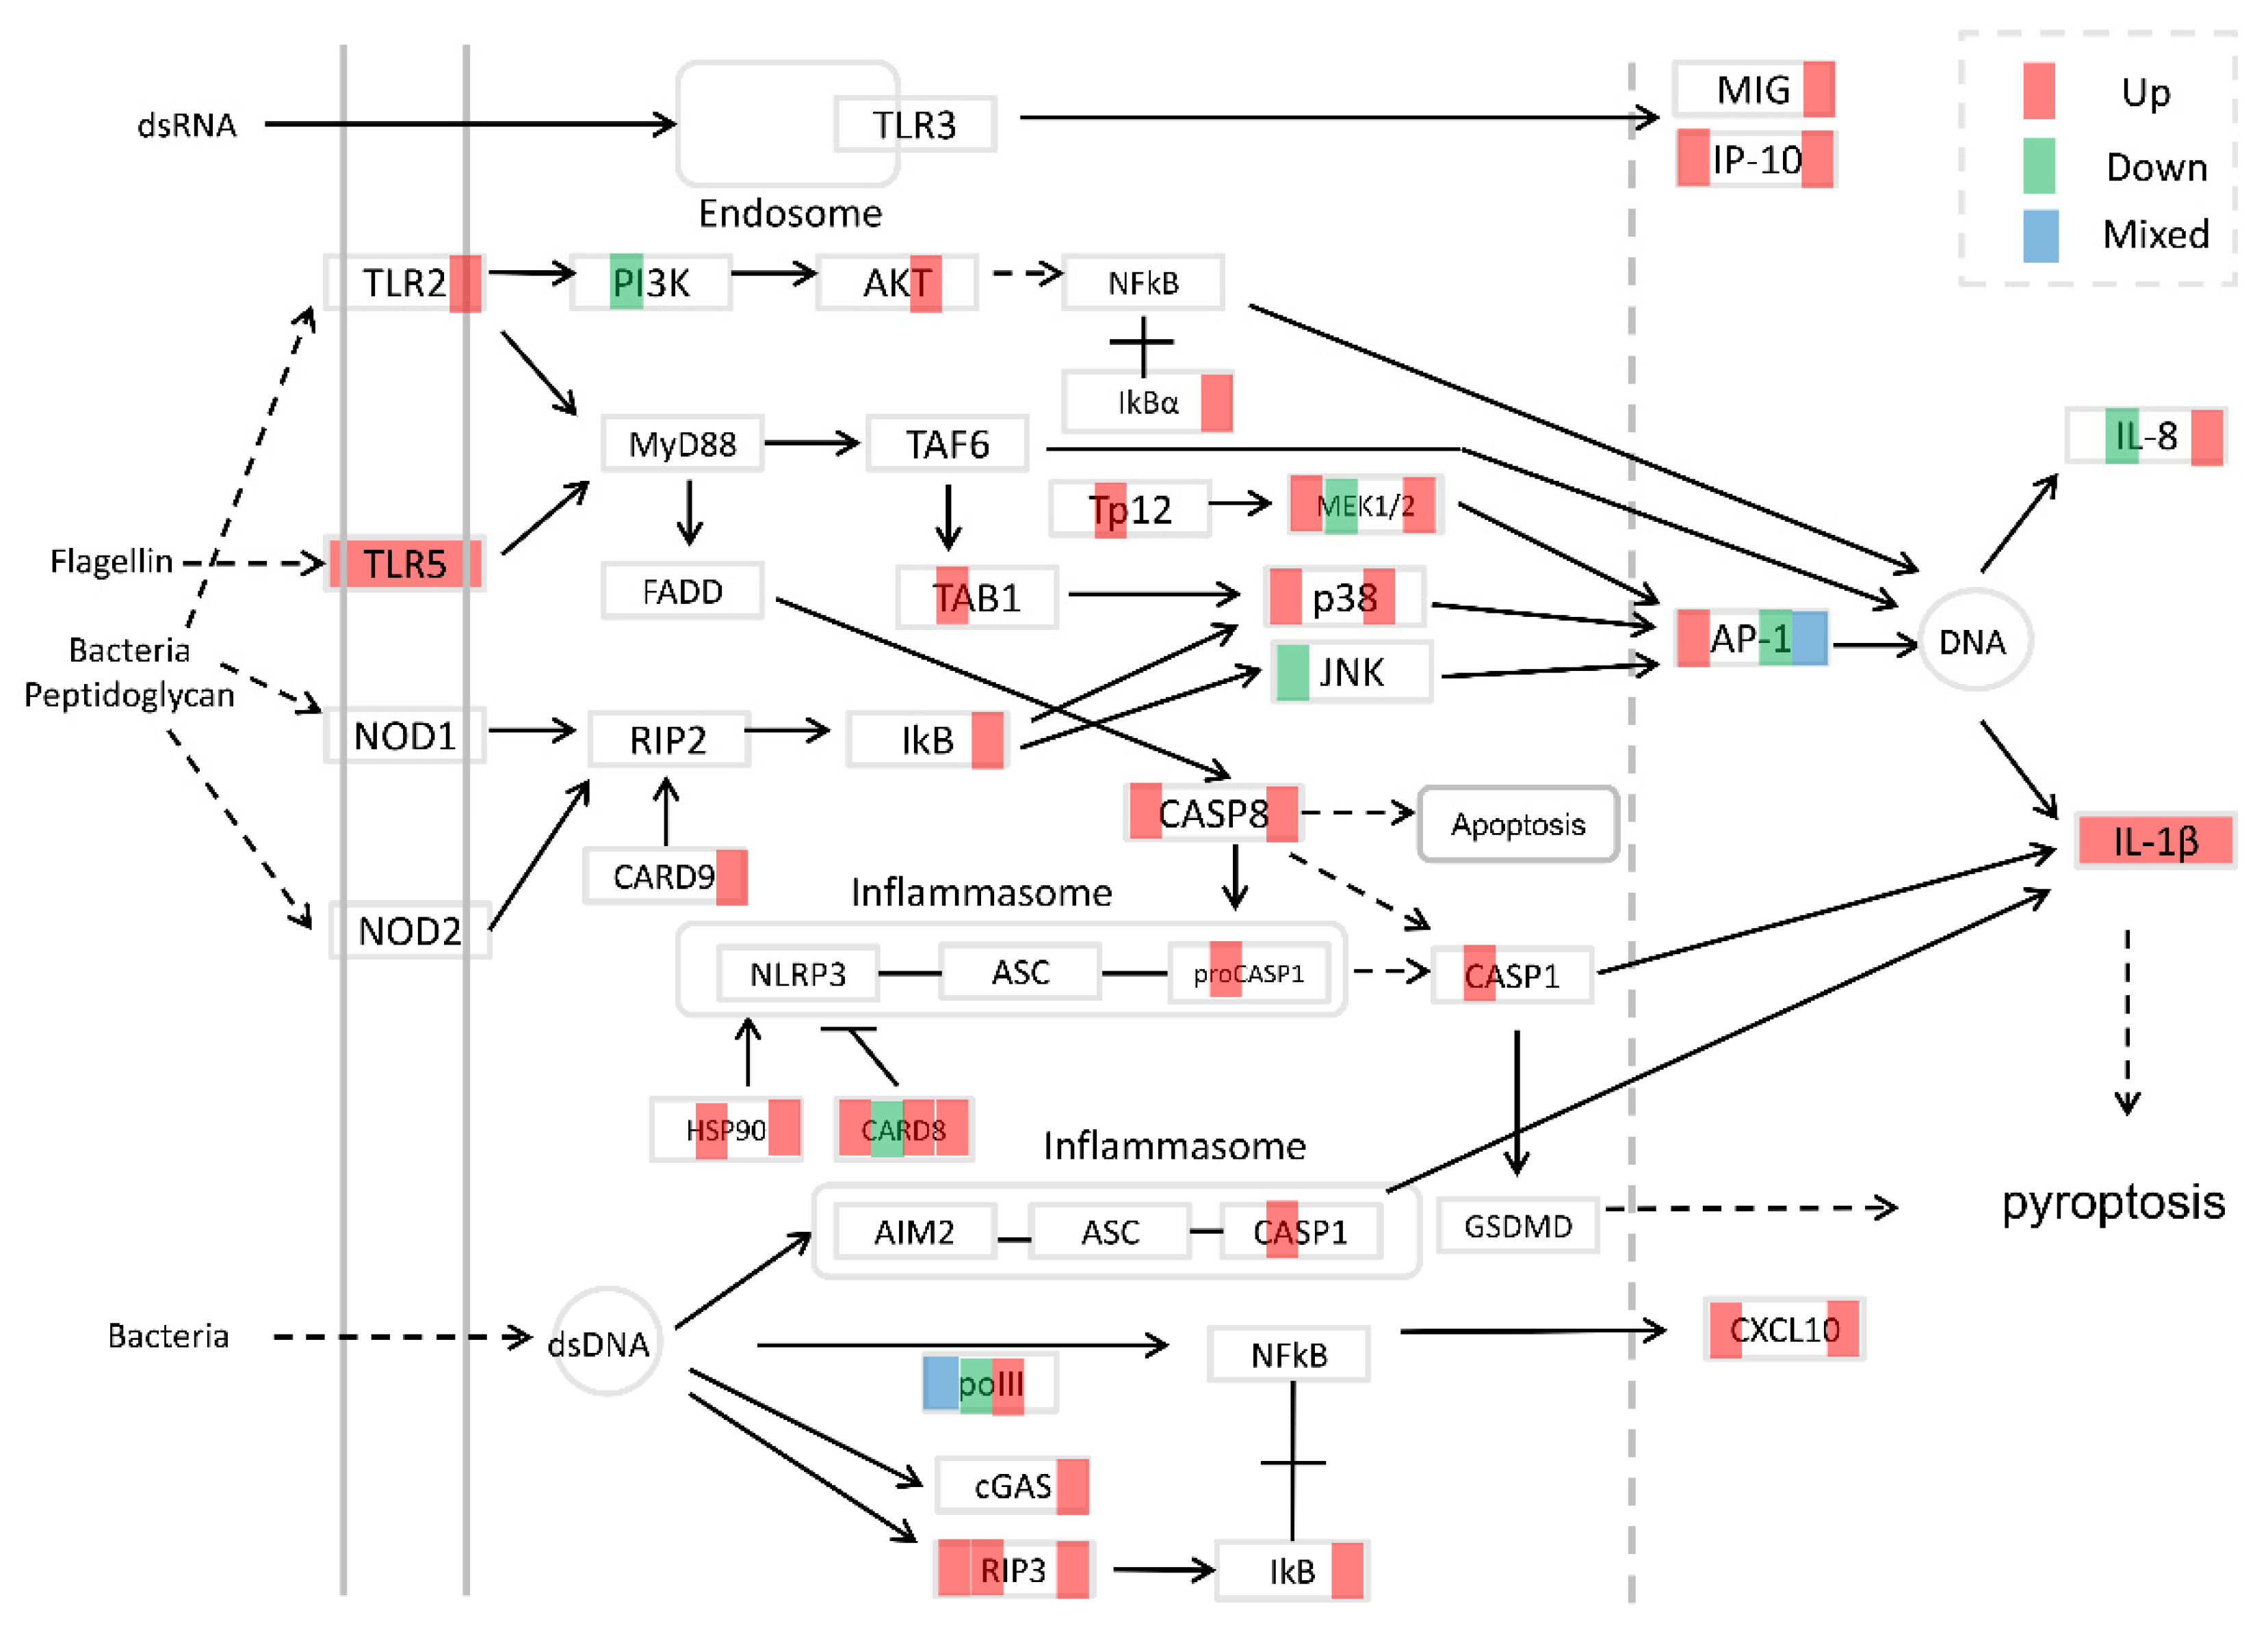
3.4. Immune-Related Pathways after Infection

Phagosome and cell adhesion molecules pathways were significantly enriched at four time points, while the cytokine–cytokine receptor interaction pathway did not significantly enrich at 6 h post-GBS injection. At 9 h and 18 h, the NOD-like receptor signaling pathway significantly changed, and the Toll-like signaling pathway only significantly enriched at 18 h. The integrated graph of DEGs in three innate immune pathways (Toll-like receptor signaling pathway, NOD-like receptor signaling pathway, and cytosolic DNA-sensing pathway) was shown in Figure 5. DEGs in the phagosome and cell adhesion molecules, and the cytokine–cytokine receptor interaction pathway at four time points, were respectively marked by red, green, and blue colors (Figures S1–S3).

3.5. Interaction Network Analysis of DEGs

To determine the interrelationship among the DEGs involved in the immune and immune-related signaling pathways, PPI analysis was performed based on the STRING database (Figure 6). The majority of the DEGs in the interaction network were upregulated. For CAMs, the DEGs in the network were CD226, ITGB2, OCLN, SDC4, SELL, SELP, and mag. For the Toll-like receptor signaling pathway, the DEGs included in the network were PI3K, AP-1, AKT, map2k1, map3k8, TLR2, and TLR5. For the NOD-like receptor signaling pathway, the DEGs in the network were JNK, CARD9, CASP1, CASP8, HSP90AA1, p38, and tab1. For the cytosolic DNA-sensing pathway, the DEGs involved in the network were nfkbia and RIP3. For the phagosome pathway, the DEGs included in the network were nos1, C3, ATP6E, COLEC12, and FCGR1A. For the cytokine–cytokine receptor interaction pathway, the DEGs involved in the network were ACVR2B, BMPR1A, BMPR1B, CCL19, CCL20, CCR5, CCR9, CSF3R, CXCL13, CXCR3, CXCR4, CXCR7, ghr1, IL10, IL10RB, IL12RB2, IL-1b, IL1R2, KIT, NGFR, PDGFA, PDGFRA, SF9, and XCR1. In particular, TLR2 was involved in both the Toll-like receptor signaling pathway and the phagosome pathway; JNK, CASP8, p38, and tab1 were involved in both the Toll-like receptor signaling pathway and the NOD-like receptor signaling pathway; CASP1 was involved in both the NOD-like receptor signaling pathway and the cytosolic DNA-sensing pathway; CXCR4, IL10, and CCR9 were involved in both cytokine–cytokine receptor interaction and intestinal immune network for IgA production; while IL-1b was involved in cytokine–cytokine receptor interaction, the cytosolic DNA-sensing pathway, the NOD-like receptor signaling pathway, and the Toll-like receptor signaling pathway.

3.6. Histopathological Changes Induced by S. agalactiae Infection

The gills of tilapia fish in the GBS groups showed typical clinical symptoms (Figure 7). The gills post-challenge with GBS’s pathologic examination (B6h, B9h, B15h, B18h) presented slightly damaged. The structure of the gills in the GBS groups was damaged most seriously at 9 h among the four time points.

3.7. qRT-PCR of Immune-Related Genes

The outcomes of real-time PCR were further summarized. The 10 DEGs qPCR results, of B6/P6, B9/P9, B15/P15, andB18/P18, are shown in Figure 8. Grouped comparison results between RT-PCR and RNA-seq were also displayed, and the results showed that all 10 candidate genes in RT-PCR verification agree with the results of the RNA-seq technology.

4. Discussion

Understanding the molecular mechanisms underlying tilapia’s susceptibility to S. agalactiae is an essential issue in tilapia culture as high tilapia mortality arising from GBS infection often cause economic loss. Previous studies mainly focused on the roles the tilapia’s spleen and kidney played in the fight against the GBS infection [31,32,33], while few studies emphasized the importance of the gills in the defence against these bacteria. The gill, one of the largest immune organs [30] in fish, plays a central role in the physiology of fish (such as gas exchange, acid–base balance, osmoregulation, and nitrogenous waste excretion) [34,35]. Moreover, their physiological functions, accompanied by continuous contact to waterborne pathogens (bacteria, fungi, viruses, and other toxic elements), mean that is exposed to immune challenges and initiates immune responses [35]. The initial process of pathogen infection is physical contact, and the host responds with a series of cellular and biological processes to resist infection [36]. Fish gills have immune and physical barrier functions, which has been considered as one of the first lines of defense against dangerous pathogens [37]. Chen et al. [38] showed that disturbance of the gill immune and physical barrier function could cause impaired immune response and growth retardation in fish.
As a Gram-positive bacterium, GBS contains peptidoglycan (PGN), lipoteichoic acid (LTA), lipoproteins (LP), and other pathogen-associated molecular patterns (PAMPs); information about these antigens can be transmitted to lymphocytes, which in turn induce humoral and cellular immune responses in the host [2]. The innate immune system plays a larger role than the adaptive immune system in protecting fish against pathogen invasion [39]. A previous report has indicated that these TLR genes play a role in host anti-Cryptocryon irritans immune responses [25]. To protect against attaching and invading pathogens, organ-specific and systemic immunological host responses are both activated by the pathogen-associated molecular-pattern pathway via membrane-associated TLRs and cytoplasmic NLRs [33].
In the present study, the transcriptome of tilapias’ gills in the GBS and PBS group at different time points were sequenced. According to the result of different expression analysis, thousands of genes were differentially expressed among four time points, 185 of which were common. In addition, hundreds of unique DEGs at each time point suggested the different pattern of immune response over time. When looking at the top 20 DEGs involved in these 185 common DEGs, many of them (such as IL-1b, TLR5, CD22, and MHC2) are closely related to immune response. Moreover, significant enrichment of GO terms including immune response, innate immune response, antigen processing and presentation, and complement activation at four time points indicated the overall activation of tilapia’s immune system. Three immune system pathways were significantly enriched with most of the DEGs up-regulated, including the Toll-like receptor signaling pathway, the NOD-like receptor signaling pathway, and the cytosolic DNA-sensing pathway. Wu et al. [40] revealed that NOD-like signaling pathway plays an important role against S. agalactiae in the spleen of tilapia. In addition, two immune-related pathways (phagosome, cell adhesion molecules) were significantly enriched at each time point with dozens of DEGs.
PPRs involved in three immune pathways, such as TLRs, NLRs, and DNA-dependent activator of IRFs (DAI), are responsible for detecting various pathogens and generating innate immune responses [33]. Here, the gene encoding TLR5 was upregulated at all time points, which indicated that TLRs recognized the GBS at an early time point. TLR5 is an acute-phase protein that recognizes the motility apparatus protein flagellin [5], which can be present on both Gram types [38]. Furthermore, a transcriptome analysis of L. crocea infected with C. irritans showed that TLR5 might be involved in the identification of its antigen composition [41]. IL-1b has been reported to play an important role in the early immune response to Aeromonas salmonicida infection in channel catfish [7]. In this study, compared to PBS groups, most of the DEGs involved in the Toll-like receptor signaling pathway were upregulated in the GBS groups. Moreover, this pathway was significantly enriched with an overall upregulation in the P18h vs. B18h, suggesting that the Toll-like receptor signaling pathway was activated in the tilapia after GBS infection. Although the Toll-like receptor was only significantly enriched at 18 h, TLR5 and IL-1b were involved in different pathways. Here, the constant upregulation of IL-1b and TLR5 at all time points suggests that these two genes played important roles against S. agalactiae. The tilapia recognized the S. alagactiae at an early time point, while the significantly overall upregulation of the Toll-like signaling pathway happened at a later period (18 h).
Quantities of DEGs contributed to the defense against the GBS as many immune-related DEGs upregulated in the PPI network (Figure 6). However, tilapia started to die at 9 h post-injection with GBS (Figure S4), suggesting that neither their innate immune system nor their adaptive imunity could tackle GBS for a long time. When looking at three immune pathways together, the changes of TLR5 and other gene can lead to pryoptosis, though NOD1 and NOD2 were not differentially expressed between the GBS and PBS group. Upregulation of HSP90 and downregulation of CARD8, the increase of expression of TLR5 and TLR2 at 9 h can upregulate caspase-1. The activation of caspase-1 promotes the maturation of the pro-inflammatory cytokines IL-1b, IL-18, and drives pyroptosis [42]. In the present study, most of the DEGs included in the NOD-like receptor signaling pathway were upregulated, including IL-1b, HSP90, CASP1, CARD9, JNK, nfkiba, p38, and tab1. Notably, the DEGs encoding IL-1b were upregulated in the GBS group at all time points. In B9h vs. P9h and B18h vs. P18h, the NOD-like receptor signaling pathway was significantly enriched. It is likely that the upregulation of HSP90 and CASP1, and the downregulation of CARD8 at 9 h drove the pyroptosis. Correspondingly, GBS freely dispersed at 9 h in the tissue (Figure 7C: black arrow), and it was also found in the spleen, kidney [2], and brain [8] after intraperitoneal injection of GBS. Infiltration of inflammatory cells was observed in areas of filament and lamellae’s vessel (Figure 7A,C,E,G: blue arrow). In particular, infiltration of inflammatory cells and lamellar telangiectasis and hemorrhages at 9 h was observed (Figure 7C: A long arrow). Similar studies on tilapia inflammation are also found in the spleen [43], and the mechanism between the pyroptosis and inflammation have been revealed [44,45].
Pathogens, under a long period of selective pressure, have evolved to develop antagonistic mechanisms against the TLRs or NLRs signal transduction, in order to facilitate their survival in the host [46]. Phagosome formation is essential for tissue homeostasis and both the innate and adaptive immune response against pathogens [47]. There are many phagocytosis-promoting receptors involved in the phagosome pathway, such as Fc receptors [48], opsonins, complement receptors, integrins, Toll-like receptors, c-lectin receptors, and scavenger receptors [49]. Our results showed that FCGR1A, an Fc receptor, showed upregulation at each time point. In B9h vs. P9h, all of the DEGs belonging to phagocytosis-promoting receptors presented upregulation, which is indicative that these receptors may be activated by S. agalactiae infection. Interestingly, at 18 h, most of the phagocytosis-prompting receptors DEGs showed upregulation, including FCGR1A (CD64), ITGB2 (CD18), MBL, TLR2, MRC, and MARCO, whereas IGH and C3 were downregulated. Nonetheless, many intracellular pathogens, for example, Mycobacterium tuberculosis, Salmonella typhimurium, and Legionella pneumophila, have developed the ability to prevent phagosome maturation in macrophages and survive inside these vesicles [50]. Moreover, TLR7, which can recognize the GBS resided in the phagosome, was not differentially expressed here. Therefore, the maturation of the phagosome may drive GBS escape instead of preventing the infection of GBS in the tilapia.
In this study, we tried to explore the mechanism underlying the tilapias’ susceptibility to S. agalactiae. According to results of different analysis, 9 h was a key time point, as it was at this time that tilapia started to die and the structure of the gills in the GBS groups were damaged most seriously. Although the TLRs and ILs played important roles in defence against bacteria, GBS may escape through the phagosome.

5. Conclusions

In the present study, the transcriptome of tilapia gills was sequenced via high-throughput sequencing technology. This showed the differentially expressed genes and the significantly enriched GO and KEGG pathways after S. agalactiae infection. The results of HE staining showed that tilapia gills were damaged most seriously at 9 h, which was in accordance with the possibility of pyroptosis resulting from the changes of DEGs in the NOD-like receptor signaling pathway. These results indicated that S. agalactiae infection could cause gill damage and activate the immune-related pathway in the gills of tilapia.

Supplementary Materials

The following supporting information can be downloaded at: https://www.mdpi.com/article/10.3390/fishes7050246/s1, Figure S1: Color pathway of cell adhesion molecules. The rectangles of putative protein were equally divided into four parts from left to right, corresponding to four comparisons (B6h vs. P6h, B9h vs. P9h, B15h vs. P15h, and B18h vs. P18h). The green and red background colors in the rectangles represented the downregulated and upregulated genes, respectively. The blue background in the rectangles indicates that genes encoding this protein showed both upregulation and downregulation; Figure S2: Color pathway of phagosome. The rectangles of putative protein were equally divided into four parts from left to right, corresponding to four comparisons (B6h vs. P6h, B9h vs. P9h, B15h vs. P15h, and B18h vs. P18h). The green and red background colors in the rectangles represented the downregulated and upregulated genes, respectively. The blue background in the rectangles indicates that genes encoding this protein showed both upregulation and downregulation; Figure S3: Color pathway of cytokine–cytokine receptor interaction. The rectangles of putative protein were equally divided into four parts from left to right corresponding to four comparisons (B6h vs. P6h, B9h vs. P9h, B15h vs. P15h, and B18h vs. P18h). The green and red background colors in the rectangles represented the downregulated and upregulated genes, respectively. The blue background in the rectangles indicates that genes encoding this protein showed both upregulation and downregulation; Figure S4: Survival rate of experimental tilapia injected with GBS at different time points; Table S1: GO enrichment result.

Author Contributions

Conceptualization, T.Z. and L.G.; methodology, Z.F.; software, T.Z.; validation, Z.F. and T.Z.; formal analysis, Y.L.; investigation, Z.F., D.F.C.D. and S.A.F.; revision: S.A.F.; resources, J.G.; data curation, L.G.; writing—original draft preparation, T.Z.; writing—review and editing, L.G.; visualization, J.G.; supervision, L.C.; project administration, L.G. and L.C. All authors have read and agreed to the published version of the manuscript.

Funding

This study was funded by the National Key Research and Development Program of China, grant number 2018YFD0900601 and 2018YFD0900302.

Institutional Review Board Statement

All handling of fish in this study was conducted in accordance with the guidelines of the Shanghai Ocean University Animal Care and Use Committee with approval number SHOU-2021-118.

Informed Consent Statement

Not applicable.

Data Availability Statement

All raw reads in the present study are archived in the National Center for Biotechnology Information (NCBI) Short Read Archive (SRA) databases under BioProject PRJNA751364.

Acknowledgments

We gratefully acknowledge Qinghua Zhang from Shanghai Ocean University for providing the S. agalactiae strain.

Conflicts of Interest

The authors declare that they have no financial and personal conflict with other people or organizations.

References

  1. Abdullah, S.; Omar, N.; Yusoff, S.M.; Obukwho, B.; Nwunuji, T.P.; Hanan, L.; Samad, J. Clinicopathological Features and Immunohistochemical Detection of Antigens in Acute Experimental Streptococcus Agalactiae Infection in Red Tilapia (Oreochromis spp.). SpingerPlus 2013, 2, 286. [Google Scholar] [CrossRef]
  2. Shi, Y.H.; Chen, K.; Ma, W.J.; Chen, J. Ayu C-Reactive Protein/Serum Amyloid P Agglutinates Bacteria and Inhibits Complement-Mediated Opsonophagocytosis by Monocytes/Macrophages. Fish Shellfish Immunol. 2018, 76, 58–67. [Google Scholar] [CrossRef] [PubMed]
  3. Ebrahimi, A.; Nikookhah, F.; Nikpour, S.; Majiian, F.; Gholami, M. Isolation of Streptococci from Milk Samples of Normal, Acute and Subclinical Mastitis Cows and Determination of Their Antibiotic Susceptibility Patterns. Pak. J. Biol. Sci. 2008, 11, 148–150. [Google Scholar] [CrossRef]
  4. Lämmler, C.; Abdulmawjood, A.; Weiss, R. Properties of Serological Group B Streptococci of Dog, Cat and Monkey Origin. Zent. Vet. B 1998, 45, 561–566. [Google Scholar] [CrossRef]
  5. Santi, M.; Egan, S.A.; Leigh, J.A.; Verner-Jeffreys, D.W.; Blanchard, A.M. Complete Genome Sequence of Streptococcus Agalactiae Strain 01173, Isolated from Kuwaiti Wild Fish. Microbiol. Resour. Announc. 2021, 9, e00674-20. [Google Scholar] [CrossRef]
  6. Rosa-Fraile, M.; Sampedro, A.; Varela, J.; Garcia-Peña, M.; Gimenez-Gallego, G. Identification of a Peptide from Mammal Albumins Responsible for Enhanced Pigment Production by Group B Streptococci. Clin. Diagn. Lab. Immunol. 1999, 6, 425–426. [Google Scholar] [CrossRef]
  7. Sullivan, M.J.; Ulett, G.C. Evaluation of Hematogenous Spread and Ascending Infection in the Pathogenesis of Acute Pyelonephritis Due to Group B Streptococcus in Mice. Microb. Pathog. 2020, 138, 103796. [Google Scholar] [CrossRef] [PubMed]
  8. Yildirim, A.O.; Lämmler, C.; Weiss, R. Identification and Characterization of Streptococcus Agalactiae Isolated from Horses. Vet. Microbiol. 2002, 85, 31–35. [Google Scholar] [CrossRef]
  9. Liu, Y.; Li, L.; Luo, Z.; Wang, R.; Huang, T.; Liang, W.; Gu, Q.; Yu, F.; Chen, M. Arginine Deiminase and Biotin Metabolism Signaling Pathways Play an Important Role in Human-Derived Serotype V, ST1 Streptococcus Agalactiae Virulent Strain upon Infected Tilapia. Animals 2020, 10, 849. [Google Scholar] [CrossRef] [PubMed]
  10. Evans, J.J.; Klesius, P.H.; Gilbert, P.M.; Shoemaker, C.A.; al Sarawi, M.A.; Landsberg, J.; Duremdez, R.; al Marzouk, A.; al Zenki, S. Characterization of β-Haemolytic Group B Streptococcus Agalactiae in Cultured Seabream, Sparus auratus L., and Wild Mullet, Liza Klunzingeri (Day), in Kuwait. J. Fish Dis. 2002, 25, 505–513. [Google Scholar] [CrossRef]
  11. Hernandez, E.; Figueroa, J.; Iregui, C. Streptococcosis on a Red Tilapia, Oreochromis sp., Farm: A Case Study. J. Fish Dis. 2009, 32, 247–252. [Google Scholar] [CrossRef]
  12. Pulido Bravo, E.; Iregui, C.; Figueroa, J.; Klesius, P. Streptococosis in cultured Tilapias (Oreochromis spp.) in Colombia. Revista AquaTIC 2004, 20, 97–106. [Google Scholar]
  13. FAO. The State of World Fisheries and Aquaculture 2014; FAO: Rome, Italy, 2011; Volume 4, pp. 40–41. [Google Scholar]
  14. Zhang, W.B.; Murray, F.J.; Liu, L.P.; Little, D.C. A Comparative Analysis of Four Internationally Traded Farmed Seafood Commodities in China: Domestic and International Markets as Key Drivers. Rev. Aquac. 2017, 9, 157–178. [Google Scholar] [CrossRef]
  15. Basri, L.; Nor, R.M.; Salleh, A.; Md Yasin, I.S.; Saad, M.Z.; Abd Rahaman, N.Y.; Barkham, T.; Amal, M.N.A. Co-Infections of Tilapia Lake Virus, Aeromonas Hydrophila and Streptococcus Agalactiae in Farmed Red Hybrid Tilapia. Animals 2020, 10, 2141. [Google Scholar] [CrossRef] [PubMed]
  16. Maina, J.N. Structure, Function and Evolution of the Gas Exchangers: Comparative Perspectives. J. Anat. 2002, 201, 281–304. [Google Scholar] [CrossRef] [PubMed]
  17. Koppang, E.O.; Kvellestad, A.; Fischer, U. Fish Mucosal Immunity: Gill. In Mucosal Health Aquac; Elsevier Inc: Amsterdam, The Netherlands, 2015; pp. 93–133. [Google Scholar] [CrossRef]
  18. Wilson, J.M.; Laurent, P. Fish Gill Morphology: Inside Out. J. Exp. Zool. 2002, 293, 192–213. [Google Scholar] [CrossRef]
  19. Gomez, D.; Sunyer, J.O.; Salinas, I. The Mucosal Immune System of Fish: The Evolution of Tolerating Commensals While Fighting Pathogens. Fish Shellfish Immunol. 2013, 35, 1729–1739. [Google Scholar] [CrossRef] [PubMed]
  20. Baums, C.G.; Hermeyer, K.; Leimbach, S.; Adamek, M.; Czerny, C.P.; Hörstgen-Schwark, G.; Valentin-Weigand, P.; Baumgärtner, W.; Steinhagen, D. Establishment of a Model of Streptococcus Iniae Meningoencephalitis in Nile Tilapia (Oreochromis Niloticus). J. Comp. Pathol. 2013, 149, 94–102. [Google Scholar] [CrossRef] [PubMed]
  21. Chu, C.; Huang, P.Y.; Chen, H.M.; Wang, Y.H.; Tsai, I.A.; Lu, C.C.; Chen, C.C. Genetic and Pathogenic Difference between Streptococcus Agalactiae Serotype Ia Fish and Human Isolates. BMC Microbiol. 2016, 16, 175. [Google Scholar] [CrossRef] [PubMed]
  22. Junior, J.A.F.; Leal, C.A.G.; de Oliveira, T.F.; Nascimento, K.A.; de Macêdo, J.T.S.A.; Pedroso, P.M.O. Anatomopathological Characterization and Etiology of Lesions on Nile Tilapia Fillets (Oreochromis niloticus) Caused by Bacterial Pathogens. Aquaculture 2020, 526, 735387. [Google Scholar] [CrossRef]
  23. Liang, F.-R.; Wang, Q.-Q.; Jiang, Y.-L.; Yue, B.-Y.; Zhou, Q.-Z.; Wang, J.-H. Characterization of Matrix Metalloprotease-9 Gene from Nile Tilapia (Oreochromis niloticus) and Its High-Level Expression Induced by the Streptococcus Agalactiae Challenge. Biomolecules 2020, 10, 76. [Google Scholar] [CrossRef]
  24. Phan-Aram, P.; Mahasri, G.; Kayansamruaj, P.; Amparyup, P.; Srisapoome, P. Immune Regulation, but Not Antibacterial Activity, Is a Crucial Function of Hepcidins in Resistance against Pathogenic Bacteria in Nile Tilapia (Oreochromis niloticus Linn.). Biomolecules 2020, 10, 1132. [Google Scholar] [CrossRef]
  25. Mann, E.R.; Li, X. Intestinal Antigen-Presenting Cells in Mucosal Immune Homeostasis: Crosstalk between Dendritic Cells, Macrophages and B-Cells. World J. Gastroenterol. 2014, 20, 9653–9664. [Google Scholar] [CrossRef]
  26. Young, M.D.; Smyth, G.K.; Oshlack, A.; Wakefield, M.J. Gene Ontology Analysis for RNA-Seq: Accounting for Selection Bias. Genome Biol. 2010, 11, R14. [Google Scholar] [CrossRef] [PubMed]
  27. Mao, X.; Cai, T.; Olyarchuk, J.G.; Wei, L. Automated Genome Annotation and Pathway Identification Using the KEGG Orthology (KO) as a Controlled Vocabulary. Bioinformatics 2005, 21, 3787–3793. [Google Scholar] [CrossRef] [PubMed]
  28. Shannon, P.; Markiel, A.; Ozier, O.; Baliga, N.S.; Wang, J.T.; Ramage, D.; Amin, N.; Schwikowski, B.; Ideker, T. Cytoscape: A Software Environment for Integrated Models of Biomolecular Interaction Networks. Genome Res. 2003, 13, 2498–2504. [Google Scholar] [CrossRef]
  29. Ye, J.; Coulouris, G.; Zaretskaya, I.; Cutcutache, I.; Rozen, S.; Madden, T.L. Primer-BLAST: A Tool to Design Target-Specific Primers for Polymerase Chain Reaction. BMC Bioinform. 2012, 13, 134. [Google Scholar] [CrossRef] [PubMed]
  30. Dezfuli, B.S.; Giari, L.; Lui, A.; Lorenzoni, M.; Noga, E.J. Mast Cell Responses to Ergasilus (Copepoda), a Gill Ectoparasite of Sea Bream. Fish Shellfish Immunol. 2011, 30, 1087–1094. [Google Scholar] [CrossRef]
  31. Yamamoto-Furusho, J.K.; Barnich, N.; Hisamatsu, T.; Podolsky, D.K. MDP-NOD2 Stimulation Induces HNP-1 Secretion, Which Contributes to NOD2 Antibacterial Function. Inflamm. Bowel Dis. 2010, 16, 736–742. [Google Scholar] [CrossRef] [PubMed]
  32. Cho, S.Y.; Park, S.J.; Kwon, M.J.; Jeong, T.S.; Bok, S.H.; Choi, W.Y.; Jeong, W.I.; Ryu, S.Y.; Do, S.H.; Lee, C.S.; et al. Quercetin Suppresses Proinflammatory Cytokines Production through MAP Kinases AndNF-KappaB Pathway in Lipopolysaccharide-Stimulated Macrophage. Mol. Cell. Biochem. 2003, 243, 153–160. [Google Scholar] [CrossRef]
  33. Abrahams, V.M. The Role of the Nod-like Receptor Family in Trophoblast Innate Immune Responses. J. Reprod. Immunol. 2011, 88, 112–117. [Google Scholar] [CrossRef] [PubMed]
  34. Evans, D.H.; Piermarini, P.M.; Choe, K.P. The Multifunctional Fish Gill: Dominant Site of Gas Exchange, Osmoregulation, Acid-Base Regulation, and Excretion of Nitrogenous Waste. Physiol. Rev. 2005, 85, 97–177. [Google Scholar] [CrossRef] [PubMed]
  35. Wang, B.; Feng, L.; Jiang, W.D.; Wu, P.; Kuang, S.Y.; Jiang, J.; Tang, L.; Tang, W.N.; Zhang, Y.A.; Liu, Y.; et al. Copper-Induced Tight Junction MRNA Expression Changes, Apoptosis and Antioxidant Responses via NF-KappaB, TOR and Nrf2 Signaling Molecules in the Gills of Fish: Preventive Role of Arginine. Aquat. Toxicol. 2015, 158, 125–137. [Google Scholar] [CrossRef]
  36. Zhou, Y.; Liu, Y.; Luo, Y.; Zhong, H.; Huang, T.; Liang, W.; Xiao, J.; Wu, W.; Li, L.; Chen, M. Large-Scale Profiling of the Proteome and Dual Transcriptome in Nile Tilapia (Oreochromis niloticus) Challenged with Low- and High-Virulence Strains of Streptococcus Agalactiae. Fish Shellfish Immunol. 2020, 100, 386–396. [Google Scholar] [CrossRef]
  37. Zubair, S.; de Villiers, E.P.; Younan, M.; Andersson, G.; Tettelin, H.; Riley, D.R.; Jores, J.; Bongcam-Rudloff, E.; Bishop, R.P. Genome Sequences of Two Pathogenic Streptococcus Agalactiae Isolates from the One-Humped Camel Camelus Dromedarius. Genome Announc. 2013, 1, e00515-13. [Google Scholar] [CrossRef]
  38. Chen, L.; Feng, L.; Jiang, W.D.; Jiang, J.; Wu, P.; Zhao, J.; Kuang, S.Y.; Tang, L.; Tang, W.N.; Zhang, Y.A.; et al. Dietary Riboflavin Deficiency Decreases Immunity and Antioxidant Capacity, and Changes Tight Junction Proteins and Related Signaling Molecules MRNA Expression in the Gills of Young Grass Carp (Ctenopharyngodon idella). Fish Shellfish Immunol. 2015, 45, 307–320. [Google Scholar] [CrossRef]
  39. Evans, J.J.; Shoemaker, C.A.; Klesius, P.H. Density and Dose: Factors Affecting Mortality of Streptococcus Iniaeinfected Tilapia (Oreochromis niloticus). Aquaculture 2000, 188, 229–235. [Google Scholar]
  40. Wu, W.; Li, L.; Liu, Y.; Huang, T.; Liang, W.; Chen, M. Multiomics Analyses Reveal That NOD-like Signaling Pathway Plays an Important Role against Streptococcus agalactiae in the Spleen of Tilapia. Fish Shellfish Immunol. 2019, 95, 336–348. [Google Scholar] [CrossRef]
  41. Bai, H.; Zhou, T.; Zhao, J.; Chen, B.; Xu, P. Transcriptome Analysis Reveals the Temporal Gene Expression Patterns in Skin of Large Yellow Croaker (Larimichthys crocea) in Response to Cryptocaryon Irritans Infection. Fish Shellfish Immunol. 2020, 99, 462–472. [Google Scholar] [CrossRef] [PubMed]
  42. Lacey, C.A.; Mitchell, W.J.; Dadelahi, A.S.; Skyberg, J.A. Caspase-1 and Caspase-11 Mediate Pyroptosis, Inflammation, and Control of Brucella Joint Infection. Infect. Immun. 2018, 86, e00361-18. [Google Scholar] [CrossRef]
  43. He, Y.; Wang, K.Y.; Xiao, D.; Chen, D.F.; Huang, L.; Liu, T.; Wang, J.; Geng, Y.; Wang, E.L.; Yang, Q. A Recombinant Truncated Surface Immunogenic Protein (TSip) plus Adjuvant FIA Confers Active Protection against Group B Streptococcus Infection in Tilapia. Vaccine 2014, 32, 7025–7032. [Google Scholar] [CrossRef]
  44. Bergsbaken, T.; Fink, S.L.; Cookson, B.T. Pyroptosis: Host Cell Death and Inflammation. Nat. Rev. Microbiol. 2009, 7, 99–109. [Google Scholar] [CrossRef]
  45. Whidbey, C.; Vornhagen, J.; Gendrin, C.; Boldenow, E.; Samson, J.M.; Doering, K.; Ngo, L.; Ezekwe, E.A.D.; Gundlach, J.H.; Elovitz, M.A.; et al. A Streptococcal Lipid Toxin Induces Membrane Permeabilization and Pyroptosis Leading to Fetal Injury. EMBO Mol. Med. 2015, 7, 488–505. [Google Scholar] [CrossRef]
  46. Vogel, S.N. How Discovery of Toll-Mediated Innate Immunity in Drosophila Impacted Our Understanding of TLR Signaling (and Vice Versa). J. Immunol. 2012, 188, 5207–5209. [Google Scholar] [CrossRef]
  47. Carranza, C.; Chavez-Galan, L. Several Routes to the Same Destination: Inhibition of Phagosome-Lysosome Fusion by Mycobacterium tuberculosis. Am. J. Med. Sci. 2019, 357, 184–194. [Google Scholar] [CrossRef]
  48. Raeesi, V.; Ehsani, A.; Torshizi, R.V. Genomic Loci Associated with Antibody-Mediated Immune Responses in an F2 Chicken Population. Animal 2019, 13, 1341–1349. [Google Scholar] [CrossRef]
  49. Feinberg, H.; Taylor, M.E.; Weis, W.I. Scavenger Receptor C-Type Lectin Binds to the Leukocyte Cell Surface Glycan Lewis(x) by a Novel Mechanism. J. Biol. Chem. 2007, 282, 17250–17258. [Google Scholar] [CrossRef]
  50. Awuh, J.A.; Flo, T.H. Molecular Basis of Mycobacterial Survival in Macrophages. Cell. Mol. Life Sci. 2017, 74, 1625–1648. [Google Scholar] [CrossRef] [Green Version]
Figure 1. (A) Venn diagram of differentially expressed genes (DEGs) numbers in different comparisons (B6h vs. P6h, B9h vs. P9h, B15h vs. P15h, B18h vs. P18h). (B) Volcano plot of differentially expressed genes distribution trends among B6h vs. P6h, B9h vs. P9h, B15h vs. P15h, and B18h vs. P18h. The log2 (fold change) indicates the mean expression level for each gene. Each dot represents one gene. Green and red dots represent upregulated and downregulated DEGs, respectively. Blue dots represent genes not differentially expressed.
Fishes 07 00246 g001
Figure 2. Hierarchical clustering of the top 20 differentially expressed (DE) mRNAs among the nine libraries (C0h, P6h, P9h, P15h, P18h, B6h, B9h, B15h, and B18h). Heatmap of the count data for DE mRNA libraries for the differentially expressed genes.
Fishes 07 00246 g002
Figure 3. Top 18 significantly enriched GO terms in four comparisons (B6h vs. P6h, B9h vs. P9h, B15h vs. P15h, and B18h vs. P18h). BP: biological process; CC: cellular component; MF: molecular function.
Fishes 07 00246 g003
Figure 4. KEGG enrichment analysis scatter plot representing pathways of significant DEGs between GBS and PBS groups in four comparisons. Red color indicates highly significant enrichment according to the p-value range.
Fishes 07 00246 g004
Figure 5. The integrated graph of DEGs changes included in the Toll-like receptor signaling pathway, the NOD-like receptor signaling pathway, and the cytosolic DNA-sensing pathway in four comparisons (B6h vs. P6h, B9h vs. P9h, B15h vs. P15h, and B18h vs. P18h). The rectangles of putative protein were equally divided into four parts from left to right, corresponding to four comparisons. Red, green, and blue colors, respectively, represent up, down, and mixed regulation.
Fishes 07 00246 g005
Figure 6. The protein–protein interaction (PPI) network of DEGs in immune-related pathways (Toll-like receptor signaling pathway, NOD-like receptor signaling pathway, cytosolic DNA-sensing pathway, cytokine–cytokine receptor interaction, cell adhesion molecules, and phagosome). Circles (Proteins) in the network were marked with different colours according to their regulation (red: upregulated, green: downregulated, blue: upregulated and downregulated).
Fishes 07 00246 g006
Figure 7. Pathologic examination of the gills of tilapia taken at 6 h, 9 h, 15 h, and 18 h post-challenge with GBS and PBS (hematoxylin-eosin staining, HE). (A) Severe oedema of mucous cells in the filament (blue arrow: ↑). (C) GBS dispersed in the filaments and lamellae (black arrow: ↑); infiltration of inflammatory cells present in areas of filament and lamellae’s vessel (long arrow); inflammation of mucous cells (blue arrow ①: ). (E) Severe oedema of mucous cells in the filament (blue arrow: ↑), lamellar telangiectasis (*), infiltration of lightly inflammatory cells (long arrow). (G) Numerous inflammatory cells were distributed in filaments and lamellae (long arrow). (B,D,F,H) were intraperitoneally injected with PBS and present a normal structure of the gills with no abnormalities in the tissue (×400, Scale bars = 25 μm).
Fishes 07 00246 g007
Figure 8. Validation of RNA-seq results using RT-PCR. The transcript expression levels of the selected genes were normalized to that of the β-actin gene.
Fishes 07 00246 g008
Table 1. Primers used for quantitative RT-PCR validation.
Gene NameForward Primer (5′-3′)Reverse Primer (5′-3′)Amplicon Length (bp)
akt2lCTCGGCTTATCTTTGACCTCTGCTCCTTCACCAGGATCACTTTAC103
casp3aTGGACGATACAGACGCAAAGTGGACGATACAGACGCAAAG114
CD22GGACAGTTGGTGTATAGGAGTTGCATCTACTCACCTGGCGTTATT121
CXCR4CGTTTACTCACTAGTCCCACAGACCATCCCACACACAAGTT100
hsp90aa1CTTGTCTGCCACGGTTCTAATACTCCGTCTGGTCTTCCTT99
ITGB2CCAAGCACTGGTGAGAAAGACAGCAGTGGATTAGACGACAG111
map2k1GGGTCTGATTATGGCAAGGAAGTGCACAAACACTGGAGTAATG103
nfkbiabGACTTCCTCAACAGACAGAATGATCTGGAGAGGGACAGGTATTT116
tab1CTTGACGTCTCCGATATCCTTCGCCTTCTTATACCCGTCTTTCT102
vcam1CAGTCTGTGCACTCCCTTTAGACCTCCTCACCCGGAATTA107
β-actinGATCTGGCATCACACCTTCTACTCTTCTCCCTGTTGGCTTTG104
Table 2. The ratio of mapping to the tilapia genome.
SampleTotal Clean ReadsTotal Mapped ReadsGC (%)Q20 (%)Q30 (%)
C0h54,708,46643,788,477 (80.04%)48.7697.4193.67
B6h52,297,47643,565,354 (83.30%)48.8097.5593.92
B9h36,636,61631,095,881 (84.88%)49.6897.6294.00
B15h46,424,53638,965,528 (83.93%)49.1997.5893.91
B18h53,185,07845,678,704 (85.89%)48.2697.7794.23
P6h47,948,88041,022,046 (85.55%)49.3797.8594.40
P9h47,849,04041,310,833 (86.34%)48.6897.8594.44
P15h51,421,08043,273,464 (84.16%)49.7897.5794.03
P18h54,731,99646,234,883 (84.48%)49.5097.4393.65
Publisher’s Note: MDPI stays neutral with regard to jurisdictional claims in published maps and institutional affiliations.

