Abstract
This study was conducted to investigate the effects of Clostridium autoethanogenum protein (CAP) replacement for fish meal (FM) on growth performance, digestive enzyme activity, humoral immunity and liver and intestinal health in large yellow croakers (Larimichthys crocea). Four experimental diets were formulated by replacing FM with CAP at different levels—0% (CAP0), 15% (CAP15), 30% (CAP30) and 45% (CAP45). Triplicate groups of juveniles (initial weight = 11.86 ± 0.13 g) were fed the test diets to apparent satiation two times daily for eight weeks. There was no significant difference in final body weight (FBW), weight gain rate (WG) and feed efficiency (FE) between CAP0 and CAP15. However, compared to the CAP0, CAP30 and CAP45 significantly reduced FBW, WG and LDR (p < 0.05), while CAP45 significantly reduced FE and PDR (p < 0.05). The whole-body moisture was significantly increased by CAP replacement of FM while crude lipid content was decreased (p < 0.05). No significant difference in crude protein, ash and liver crude lipid was observed among all groups (p > 0.05). Compared to CAP0, CAP30 and CAP45 significantly reduced serum C4 concentration (p < 0.05), and CAP45 significantly reduced serum AKP activity (p < 0.05) but significantly increased LZM activity (p < 0.05). Serum C3 concentration was significantly increased by CAP15 (p < 0.05). In terms of intestinal histology, CAP addition significantly increased the thickness of intestinal villus (p < 0.05), and CAP15 and CAP45 significantly increased the thickness of intestinal muscular (p < 0.05). The addition of CAP significantly reduced serum DAO and D-lactate concentrations (p < 0.05), indicating the intestinal physical barrier was improved. The results of 16S rRNA gene sequencing showed that the intestinal microorganisms of large yellow croakers are dominated by organisms from Proteobacteria, Bacteroidetes and Firmicutes. The addition of CAP reduced the relative abundance of Ralstonia and Christensenellaceae and increased the relative abundance of Paenibacillus. Overall, the optimum level of CAP replacement FM in large yellow croakers feed is 15%, which helps to improve humoral immunity and intestinal health with no adverse effects on growth. However, the 30% and 45% substitution levels adversely affect the growth and humoral immunity of large yellow croakers.
1. Introduction
Fish meal (FM) is the most common protein source in aquatic feeds [1], as it has balanced nutrients, good palatability and high digestibility for aquatic animals [2,3]. However, the decline of fishery resources and the increased demand have led to a shortage of FM resources in recent years [4]. To ensure the sustainable development of the aquaculture industry, it is crucial to find a low-price, high-quality protein source to replace FM. Traditionally, there are multiple kinds of plant and animal sources of protein used as substitute for FM. However, plant sources of protein often contain anti-nutritional factors such as tannin and gossypol which are harmful to fish health [5], placing constraints on their application. Animal proteins generally have an amino acid imbalance, low digestibility, poor palatability and other problems [6].
Single-cell proteins are cellular manufactured products of microorganisms such as yeast, bacteria, actinomycetes, molds, microalgae and higher fungi produced in the large-scale factory [7]. Single-cell protein powder is a cytoplasmic mass mixture of proteins, carbohydrates, fats, nucleic acids, vitamins and inorganic substances [8], which is an important source of protein for the food and feed industries [9]. Clostridium autoethanogenum is regarded as a naturally occurring non-pathogenic strain and can use carbon monoxide as its carbon and energy source and for industrial-scale gas fermentation [10]. Clostridium autoethanogenum protein (CAP) is a new type of microbial protein produced by the fermentation of Clostridium autoethanogenum with carbon monoxide from steelmaking waste gas [11]. It converts carbon monoxide into a protein source, which can reduce harmful emissions and solve the shortage of feed protein [12]. Compared with traditional FM, CAP has a richer amino acid profile, with a variety of essential amino acids ahead of FM, and CAP contains a higher protein content (Table 1), giving it an inherent advantage as a protein ingredient. Several studies have indicated that CAP is an effective source of protein for aquatic animals. For example, replacing 51% of FM with CAP in largemouth bass (Micropterus salmoides) adversely affecting growth performance, body composition, digestive enzyme activity, blood biochemistry and liver function, and replacement within a level of 63% can improve antioxidant capacity, apparent digestibility and intestinal health of the fish [13]. CAP can effectively replace 30% of FM in pacific white shrimp (Litopenaeus vannamei) diets without adversely affecting growth and meat quality [14]. Replacing 25% of FM in abalone (Haliotis discus hannai) diets with CAP can promote abalone growth and improve digestibility [15]. As a new protein source, the effects of CAP inclusion on the growth and gut health of marine fishes are still unclear. Large yellow croakers (Larimichthys crocea) are the most important economically farmed marine fish in China due to their delicious taste and important commercial value. In this study, we aimed to evaluate the effects of CAP on the growth and gut health of large yellow croakers.

Table 1.
Nutrient composition of FM and CAP used in this study (% dry matter).
2. Materials and Method
2.1. Experimental Diets
Four experimental diets were formulated with 0, 4.8%, 9.5% and 14.2% CAP to substitute 0 (control group, FM content: 40%), 15%, 30% and 45% fish meal (Table 2). 48% crude protein and 8.5% crude lipid can meet the nutritional requirements of large yellow croakers [16,17]. All ingredients were crushed, passed through a 180 µm sieve, then accurately weighed according to the feed formulation and produced into 2 mm puffed pellets using a TSE65 twin-screw extruder (Modern Yanggong Machinery Technology Development Co., Ltd., Beijing, China). After drying at 45 °C for 12 h, all diets were sealed and stored at −20 °C until use.

Table 2.
Formulation and proximate composition of experimental diets (% dry matter).
2.2. Fish and Feeding Trial
Large yellow croakers were obtained from a local hatchery (Ningde City, Fujian Province, China). Before the feeding trial, fish were cultured in floating sea cages (4.0 m × 4.0 m × 4.0 m) to acclimate to the experimental condition for 14 days. After the adaptation period, 1800 healthy fish with similar size (11.86 ± 0.13 g) were randomly selected and assigned to 12 floating cages (2.0 m × 2.0 m × 2.0 m) with 150 fish per cage. All experimental fish were significantly satiated by hand feeding twice daily (6:00 a.m. and 6:00 p.m.) using the four experimental diets. The feeding trial lasted 56 days. During the feeding trial, the water temperature, pH, dissolved oxygen and salinity ranged as follows: 20.4–25.8 °C, 8.16–8.65, 6.11–7.97 mg/L and 27.3–27.9‰.
2.3. Sample Collection
At the end of the feeding trial, all fish were fasted for 24 h and anesthetized with eugenol (1:10,000). The total number and weight of fish in each cage were counted to calculate the survival rate (SR) and weight gain (WG). Twenty fish were randomly selected from each cage. Blood was drawn from the tail vein according to the method in [19] by using a sterile injector, and serum was separated by centrifuging (850× g, 4 °C, 10 min) and then stored at −80 °C till analysis. The liver and gut were collected for histological and other analysis, in accordance with the method described in our recent study [20].
2.4. Analytical Methods
2.4.1. Proximate Composition
The proximate compositions of feed and fish were measured according to the AOAC methods [21]. The moisture was analyzed by drying continuously at 105 °C. The crude protein was determined using the Kjeldahl method after acid digestion. The crude lipid was determined by Soxhlet ether extraction, and the ash content was determined by scorching in a muffle furnace at 550 °C for 8 h. Phosphorus (P) concentration in experimental diets was quantified by inductively coupled plasma atomic emission spectrometry (ICP-OES, Prodigy7, Leeman, Hudson, NH, USA). Samples of feed and protein materials were lyophilized to constant weight, and 30 mg of each sample was taken and placed in 15 mL 6N HCl solution and hydrolyzed at 110 °C for 24 h. Determining amino acid profiles with an automated amino acid analyzer (L-8900, Hitachi, Tokyo, Japan).
2.4.2. Serum Biochemical Parameters
Serum complement 4 (C4) levels, complement 3 (C3) levels and D-lactate concentration were analyzed spectrophotometrically according to previous reports [22] using fish ELISA kits (Nanjing Jiancheng Biological Company, China). Serum diamine oxidase (DAO), alkaline phosphatase (AKP) and lysozyme (LZM) activities were quantified using enzymatic colorimetric methods according to our previous study [23] with commercial kits (Nanjing Jiancheng Bioengineering Institute, Nanjing, China). One LZM activity unit was to be defined as the amount of enzyme required to decrease absorptivity at 37 °C at a rate of 0.001 min/mL, one AKP activity unit was defined as the production of 1 mg of phenol by the action of serum with the substrate for 15 min at 37 °C and one DAO activity unit was defined as the formation of 1 mmol of ammonia per minute per milliliter of serum at 37 °C.
2.4.3. Intestinal Histology
Gut samples were stained with hematoxylin and eosin (H&E) according to the methods described in our previous study [24,25]. Observation of sections was conducted under a light microscope (Leica DM5500B, Solms, Germany) and morphometric analysis was performed with Image J software.
2.4.4. Gut Microbiota Collection and Analyses
Extraction of bacterial DNA from large yellow croaker gut was done using the HiPure Soil DNA Kit (Magen, Beijing, China), then using Nanodrop 2000 (Thermo Scientific, Waltham, MA, USA) detecting the DNA yield. Amplicons of the V3-V4 region of the 16SrRNA gene were extracted from a 2% agarose gel, and purified using the AxyPrep DNA Gel Extraction Kit (Axygen Biosciences, San Francisco, CA, USA). Quantification was then performed using ABI StepOnePlus Real-Time PCR System (Life Technologies, New York, NY, USA). The purified amplicons were sent to Illumina Miseq PE 250 for sequence analysis, performed by Gene Denovo Biotechnology Co., Ltd., Guangzhou, China.
All chimeric tags were removed with QIIME software to obtain valid tags for further analysis. The valid tags were clustered into operational taxonomic units (OTUs) of ≥97% similarity using UPARSE software. The highest abundant tags sequence was selected as the representative sequence within each cluster. The biological classification of representative sequences was performed using the RDP classifier based on the SILVA database with a confidence threshold of 80%. The KEGG pathway analysis of the OTUs was inferred using PICRUSt2. Analysis of function difference between groups was calculated by Welch’s t-test.
2.5. Statistical Analysis
All data were analyzed by one-way ANOVA using SPSS 22.0, and multiple comparisons were performed using Tukey’s test. p < 0.05 was set to indicate a significant level of difference. The data are presented as means ± S.E.M (standard error of the mean).
3. Results
3.1. Growth and Feed Utilization
The growth performance, feed utilization and morphological parameters of the large yellow croaker are shown in Table 3. Compared with the CAP0 group, FBW and WGR were significantly lower in the CAP30 and CAP45 groups (p < 0.05). However, there were no significant differences in FBW and WGR between the CAP0 and CAP15 groups (p > 0.05). Among all groups, the FE of the CAP45 group was significantly lower than that of CAP0 and other groups (p < 0.05). PER of the CAP45 group was significantly lower than that of the CAP0 and CAP30 groups (p < 0.05). In terms of nutrient deposition rate, the PDR of the CAP45 group was significantly lower than the other groups (p < 0.05). The LDR showed a decreasing trend from the CAP0 group to the CAP45 group, and the LDR in the CAP45 group was significantly lower than that in the CAP0 group (p < 0.05).

Table 3.
Growth, feed utilization, morphological parameters and nutrient depositions of large yellow croakers fed diets with different levels of CAP for 56 days.
3.2. Body Composition
The contents of moisture, crude protein, crude lipid and ash of whole-body and liver lipid content were shown in Table 4. The moisture of whole-body was significantly increased in the CAP45 group (p < 0.05), comparing to other groups.

Table 4.
Body compositions of large yellow croakers fed diets with different levels of CAP for 56 days.
3.3. Non-Specific Immunity
As shown in Table 5, AKP activity in CAP15 and CAP45 groups was significantly higher than other groups (p < 0.05), but not significantly different from the CAP0 group (p > 0.05). Serum LZM activity was elevated with increasing the levels of CAP, and there was a significant difference between the CAP45 and CAP0 groups (p < 0.05). The CAP15 group had significantly higher serum C3 than the other treatments (p < 0.05).

Table 5.
Serum immunity indexes of large yellow croakers fed diets with different levels of CAP for 56 days.
3.4. Gut Morphology
The gut morphology is shown in Figure 1A. The gut villus height was the longest and significantly higher in the CAP30 group than in the CAP15 group (p < 0.05, Figure 1B). The intestinal villus thickness increased with increasing levels of diet CAP substitution and was significantly higher in the CAP45 group than in the other groups (p < 0.05, Figure 1C). There was no significant difference in muscular thickness of large yellow croaker intestines between CAP15 and CAP45 (p > 0.05), but both were significantly higher than the CAP0 and CAP30 groups (p < 0.05, Figure 1D). Moreover, the addition of CAP to diets had no significant effect on the enzyme activity of DAO (p > 0.05), an indicator of the intestinal epithelial physical barrier, but all were significantly lower than in the CAP0 group (p < 0.05, Figure 2A). The CAP15 and CAP30 diets can significantly reduce the serum D-lactate concentration (p < 0.05, Figure 2B).
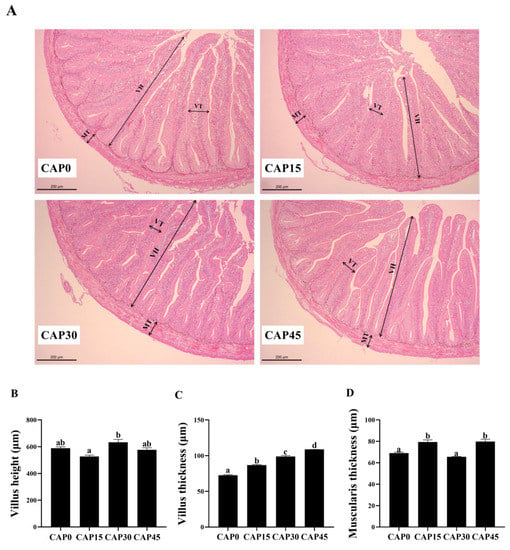
Figure 1.
(A) Observation of gut morphology of large yellow croakers fed diets with different levels of CAP (Clostridium autoethanogenum protein) by H&E staining (200×) for 56 days. VH (Villus height), VT (Villus thickness), MT (Muscularis thickness). (B) Villus height, (C) Villus thickness and (D) Muscularis thickness. Bars with different letters indicate significant difference (p < 0.05).
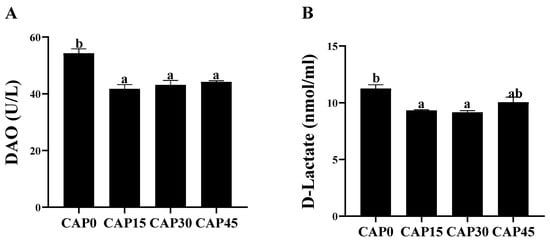
Figure 2.
Gut epithelial permeability of large yellow croakers fed diets with different levels of CAP (Clostridium autoethanogenum protein): (A) Diamine oxidase (DAO), and (B) D-lactate. Bars with different letters indicate significant difference (p < 0.05).
3.5. Gut Microbial Communities
The microbial communities Venn diagram showed that the number of core OTUs in the four groups of microbial communities was 87, and the total number of OTUs for CAP0, CAP15, CAP30 and CAP45 groups were 236, 238, 221 and 212, respectively (Figure 3A). The variability of intestinal bacterial community structure among the four groups was represented by an NMDS plot based on an unweighted uniFrace distance matrix, and showed that some data of the CAP15, CAP30 and CAP45 groups have overlapping parts, while there was no overlapping with CAP0 (Figure 3B).
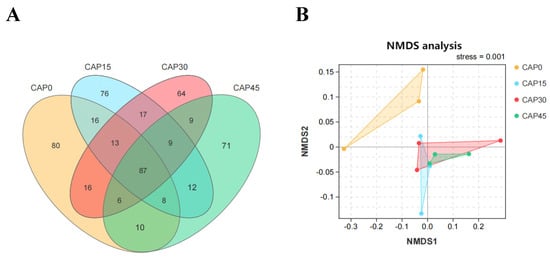
Figure 3.
(A) Venn diagram. (B) Non-metric multidimensional scale analysis (NMDS) based on unweighted uniFrac distance matrix of gut microbiota.
Proteobacteria, Bacteroidetes and Firmicutes are the major intestinal bacterial phyla of large yellow croakers (Figure 4A). Analyzed from the genus level, Ralstonia, Sediminibacterium and Bradyrhizobium are the major intestinal bacterial genera of large yellow croakers (Figure 4B). CAP45 diet can significantly increase the abundance of Paenibacillus (p < 0.05, Figure 4C). LEFSE analysis was used to compare the differences in the composition of intestinal bacterial species among groups (Figure 5). The results showed that there were significant differences in the bacterial categories of CAP0, CAP15 and CAP30 groups. The addition of CAP to diets significantly decreased the relative abundance of family Christensenellaceae, species Romboutsia and family Peptostreptococcaceae (p < 0.05, Figure 5A,B). Moreover, the CAP15 group increased the relative abundance of genus Ruminococcus and class Pirellulaceae, and the CAP30 group increased the relative abundance of class Rubrobacteria (p < 0.05, Figure 5A,B).
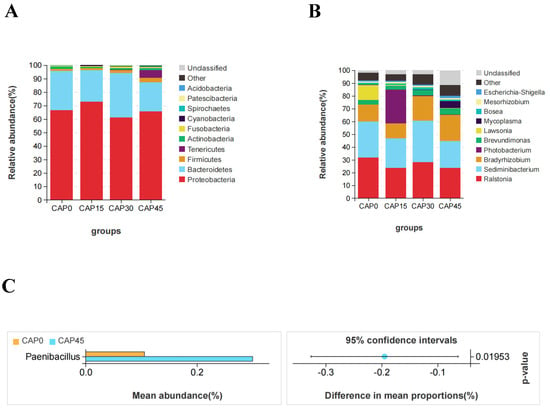
Figure 4.
Barplot (A) and barplot (B) were used to represent the relative abundance of the major intestinal bacterial phyla and genera, respectively. (C) Difference in Paenibacillus was calculated by Welch’s t-test (p < 0.05).
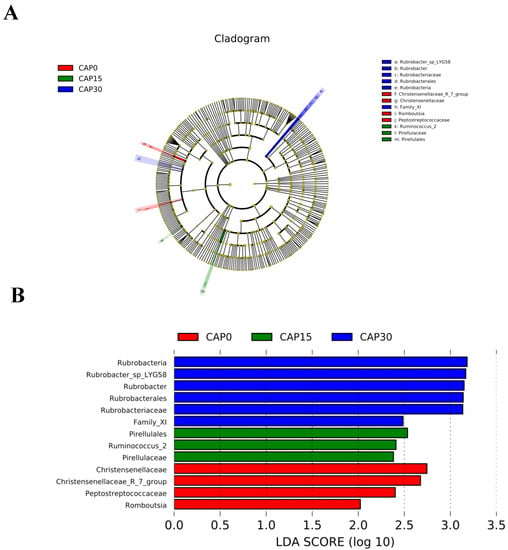
Figure 5.
LEFSE (Linear discriminant analysis Effect Size) analysis identified bacterial species that differed significantly in abundance among groups. (A) Differences in bacterial species abundance were represented by the color (red indicates a significantly higher relative abundance in the CAP0 group, green indicates a significantly higher abundance in the CAP15 group and blue indicates a significantly higher abundance in the CAP30 group). (B) Linear regression analysis (LDA) was used to estimate the magnitude of the effect of the abundance of each bacterial species on the differential effect.
Functional analysis of PICRUSt2 prediction of intestinal bacterial flora revealed the top 20 level-2 KO groups. From the plot, the KEGG pathways in CAP15 were more enriched than those in CAP0, but the degree decreased as the level of CAP substitution rose (Figure 6). Among them, the microbiota of the CAP15 group upregulated the pathways of amino acid metabolism, lipid metabolism, metabolism of cofactors and vitamins and membrane transport.
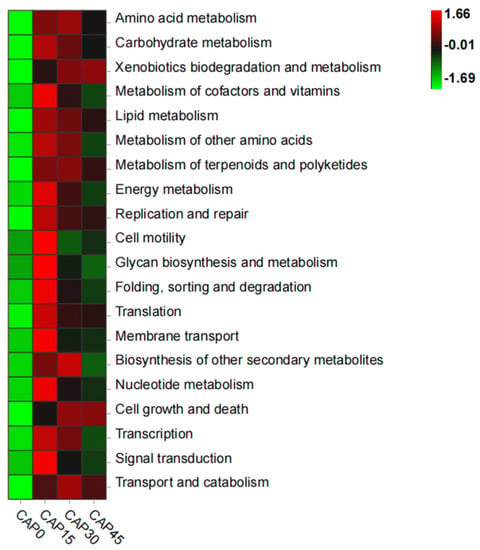
Figure 6.
Predicting the functional distribution of gut microbiota using PICRUSt2 at level.
4. Discussion
In the current study, we evaluated the potential of replacing FM with CAP in the feed of large yellow croakers. The results showed replacement of 15% FM by CAP had no negative effect on growth, indicating CAP could serve as a partial fishmeal substitution of large yellow croakers. However, the higher FM substitution levels (30–45% FM replacement by CAP) decrease the growth performance. Similar findings were reported in studies that used white shrimp (Litopenaeus vannamei) [13] and largemouth bass (Micropterus salmoides) [26]. It has been found that there are some differences in the nutritional composition between fish meals and CAP [13,14]. Moreover, the high content of nucleic acids in a bacterial meal may hazard fish due to its negative effect on metabolism.
The lipid content of whole-body was decreased by CAP diet feeding. This result showed a similar trend with the value of LDR, implying CAP may suppress lipid deposition and synthesis of large yellow croakers. However, studies in grass carp (Ctenopharyngodon idella) [27] and largemouth bass (Micropterus salmoides) [12] showed CAP did not affect the crude lipid content of fish. This needs further studies in the future.
Serum immune parameters can use to reflect the immune function of fish [28,29]. AKP had been proved to have immunomodulation effects by inhibiting neutrophil production and inflammation [30]. The decreased AKP activity resulted in decreased immunity of fish [31]. LZM play an important role in the process against microbial invasion by hydrolysis of the bacterial cell walls [32,33]. Furthermore, the complement system is also a significant component of the innate immune system [34]. Increasing C3 and C4 levels in serum could improve the ability against pathogenic microorganisms [35]. The results of the present study showed that replacing 45% of FM with CAP in diets reduced AKP activity but increased LZM activity. Replacing 15% of FM by CAP increased C3 content, and replacing 30% or more FM decreased C4 content. Generally speaking, these results indicate that replacing 15% FM with CAP could improve the immunity function, while more than 30% substitution damages the immune ability of large yellow croakers.
It is widely accepted that the intestine is an important digestion and absorption organ that also plays a critical role in immune regulation [36]. Histological analysis through HE staining is a direct way to assess the health of the intestine. It is generally believed that the longer the height and thickness of the intestinal villi, the greater the digestion and absorption capacity of the intestine for nutrients by increasing the contact area with nutrients [37], and muscle stenosis may cause intestinal inflammation to harm intestinal health [38]. In the present study, CAP diets increase the thickness of the intestinal villi in large yellow croakers, and 15% and 45% substitution levels increase the thickness of the muscularis. These results suggest that CAP may have a beneficial effect on intestinal health. Similar results were also observed in a previous study that used largemouth bass (Micropterus salmoides) [12]. Serum concentrations of D-lactate and DAO often increase when intestinal epithelial permeability is damaged [39]. In the present study, we evaluated the intestinal epithelial permeability by measuring serum D-lactate and DAO level/activity. As a result, CAP reduced serum concentrations of D-lactate and DAO, suggesting that CAP has a repairing effect on the intestinal epithelial mucosa.
Intestinal microbiota plays a crucial role in the health status of the host [40]. In the present study, the three major phyla in the gut of large yellow croakers were Proteobacteria, Bacteroidetes and Firmicutes. Ralstonia, Sediminibacterium and Bradyrhizobium were the three major bacteria genera. A previous study found pathogenic bacteria in Ralstonia can damage the intestinal health of zebrafish (Danio rerio) [41]. In this study, the addition of CAP reduced the relative abundance of Ralstonia. Paenibacillus is an important disease-preventing microorganism that produces antifungal proteins and induces resistance in the host [42]. Currently, the abundance of Paenibacillus was significantly increased with a 45% level of substitution. In addition, the 30% CAP substitution level significantly increased the relative abundance of the Rubrobacter genus in gut microbes, and the 15% CAP substitution level significantly increased the relative abundance of the Pirellulaceae family in gut microbes. CAP also reduced the relative abundance of Christensenellaceae, the former of which was shown to induce obesity [43]. These data suggest that CAP selectively improved the proliferation of intestinal flora and changed the flora composition of large yellow croakers. This experiment was also done on the function of gut microorganisms, to predict changes in the gut function of large yellow croakers under CAP addition. The results showed that a 15% substitution level was more favorable to improve the cellular function and various metabolic functions of the large yellow croaker intestine.
5. Conclusions
This study showed that dietary fish meal could be replaced by 15% CAP in feeds containing 40% fish meal without adversely affecting the growth of large yellow croakers, and to some extent improving the immunity of the organism. Furthermore, the addition of CAP improves intestinal health by improving the structure and microbial composition of the gut.
Author Contributions
Conceptualization, C.Z. and K.L.; methodology, Y.D.; software, J.Z.; validation, X.L., K.S. and L.W.; formal analysis, J.Z.; investigation, C.Z.; resources, C.Z.; data curation, J.Z.; writing—original draft preparation, J.Z.; writing—review and editing, K.L.; visualization, K.L.; supervision, C.Z.; project administration, C.Z.; funding acquisition, B.T. and C.Z. All authors have read and agreed to the published version of the manuscript.
Funding
This study was supported by the National Key Research and Development Program, China (2019YFD0900200).
Institutional Review Board Statement
The study was conducted in accordance with the Declaration of Basel, and approved by the Recommendations of Animal Research Institute Committee guidelines, Jimei University, China (Approval number: 2011-58).
Data Availability Statement
The data presented in this study are available on request from the corresponding author.
Conflicts of Interest
The authors declare no conflict of interest.
References
- Jia, S.; Li, X.; He, W.; Wu, G. Protein-Sourced Feedstuffs for Aquatic Animals in Nutrition Research and Aquaculture. Adv. Exp. Med. Biol. 2022, 1354, 237–261. [Google Scholar] [CrossRef] [PubMed]
- Muziri, M.; Mahmoud, A.O.D.; Fahad, K.; Hani, S. Replacement of fish meal with fermented plant proteins in the aquafeed industry: A systematic review and meta-analysis. Rev. Aquac. 2022. [Google Scholar] [CrossRef]
- Cho, J.H.; Kim, I.H. Fish meal–nutritive value. J. Anim. Physiol. Anim. Nutr. 2011, 95, 685–692. [Google Scholar] [CrossRef]
- Rumsey, G.L. Fish Meal and Alternate Sources of Protein in Fish Feeds Update 1993. Fisheries 2011, 18, 14–19. [Google Scholar] [CrossRef]
- Gatlin, D.M.; Barrows, F.T.; Brown, P.; Dabrowski, K.; Gaylord, T.G.; Hardy, R.W.; Herman, E.; Hu, G.; Krogdahl, Å.; Nelson, R.; et al. Expanding the utilization of sustainable plant products in aquafeeds: A review. Aquac. Res. 2007, 38, 551–579. [Google Scholar] [CrossRef]
- Floret, C.; Monnet, A.; Micard, V.; Walrand, S.; Michon, C. Replacement of animal proteins in food: How to take advantage of nutritional and gelling properties of alternative protein sources. Crit. Rev. Food Sci. 2021, 21–27. [Google Scholar] [CrossRef] [PubMed]
- Litchfield, J.H. Microbial Protein Production. BioScience 1980, 30, 387–396. [Google Scholar] [CrossRef]
- Jacob-Lopes, E.Z.L.Q. Protein characterisation of the Aphanothece Microscopica Nägeli cyanobacterium cultivated in parboiled rice effluent. Food Sci. Technol. 2006, 26, 482–488. [Google Scholar] [CrossRef]
- Ritala, A.; Häkkinen, S.T.; Toivari, M.; Wiebe, M.G. Single Cell Protein-State-of-the-Art, Industrial Landscape and Patents 2001–2016. Front. Microbiol. 2017, 8, 2009. [Google Scholar] [CrossRef]
- Utturkar, S.M.; Klingeman, D.M.; Bruno-Barcena, J.M.; Chinn, M.S.; Grunden, A.M.; Köpke, M.; Brown, S.D. Sequence data for Clostridium autoethanogenum using three generations of sequencing technologies. Sci. Data 2015, 2, 150014. [Google Scholar] [CrossRef]
- Yang, P.; Li, X.; Song, B.; He, M.; Wu, C.; Leng, X. The potential of Clostridium autoethanogenum, a new single cell protein, in substituting fish meal in the diet of largemouth bass (Micropterus salmoides): Growth, feed utilization and intestinal histology. Aquac. Fish. 2021, 8, 67–75. [Google Scholar] [CrossRef]
- Fackler, N.; Heffernan, J.; Juminaga, A.; Doser, D.; Nagaraju, S.; Gonzalez-Garcia, R.A.; Simpson, S.D.; Marcellin, E.; Köpke, M. Transcriptional control of Clostridium autoethanogenum using CRISPRi. Synth. Biol. 2021, 6, ysab008. [Google Scholar] [CrossRef] [PubMed]
- Shujie, Z.; Weihua, G.; Zhengyong, W.; Shuyan, C.; Yuhui, S.; Wei, H.; Beiping, T. Partial substitution of fish meal by Clostridium autoethanogenum protein in the diets of juvenile largemouth bass (Micropterus salmoides). Aquac. Rep. 2021, 22, 100938. [Google Scholar] [CrossRef]
- Wenxiang, Y.; Pinxian, Y.; Xin, Z.; Xiaoying, X.; Chunyan, Z.; Xiaoqin, L.; Xiangjun, L. Effects of replacing dietary fish meal with Clostridium autoethanogenum protein on growth and flesh quality of Pacific white shrimp (Litopenaeus vannamei). Aquaculture 2021, 549, 737770. [Google Scholar] [CrossRef]
- Zhenhua, W.; Xiaojun, Y.; Jinshu, G.; Yonghao, F.; Yanlin, G.; Mingzhu, P.; Wenbing, Z.; Kangsen, M. Replacement of dietary fish meal with Clostridium autoethanogenum protein on growth performance, digestion, mTOR pathways and muscle quality of abalone Haliotis discus hannai. Aquaculture 2022, 553, 738070. [Google Scholar] [CrossRef]
- Mai, K.; Wan, J.; Ai, Q.; Xu, W.; Liufu, Z.; Zhang, L.; Zhang, C.; Li, H. Dietary methionine requirement of large yellow croaker, Pseudosciaena crocea R. Aquaculture 2006, 253, 564–572. [Google Scholar] [CrossRef]
- Zhang, C.; Ai, Q.; Mai, K.; Tan, B.; Li, H.; Zhang, L. Dietary lysine requirement of large yellow croaker, Pseudosciaena crocea R. Aquaculture 2008, 283, 123–127. [Google Scholar] [CrossRef]
- Cai, L.; Wang, L.; Song, K.; Lu, K.; Zhang, C.; Rahimnejad, S. Evaluation of protein requirement of spotted seabass (Lateolabrax maculatus) under two temperatures, and the liver transcriptome response to thermal stress. Aquaculture 2020, 516, 734615. [Google Scholar] [CrossRef]
- Zhou, W.; Rahimnejad, S.; Lu, K.; Wang, L.; Liu, W. Effects of berberine on growth, liver histology, and expression of lipid-related genes in blunt snout bream (Megalobrama amblycephala) fed high-fat diets. Fish Physiol. Biochem. 2018, 45, 83–91. [Google Scholar] [CrossRef]
- Yanzou, D.; Lei, L.; Tian, X.; Lina, W.; Liping, X.; Nengshui, D.; Youlin, W.; Kangle, L. Oxidative Stress Can Be Attenuated by 4-PBA Caused by High-Fat or Ammonia Nitrogen in Cultured Spotted Seabass: The Mechanism Is Related to Endoplasmic Reticulum Stress. Antioxidants 2022, 11, 1276. [Google Scholar] [CrossRef]
- AOAC. Official methods of analysis of Analysis of Offical Analytical Chemists International, 17th ed.; Association of Official Analytical Chemists: Arlington, VA, USA, 2002. [Google Scholar]
- Syedbasha, M.; Linnik, J.; Santer, D.; O’Shea, D.; Barakat, K.; Joyce, M.; Khanna, N.; Tyrrell, D.L.; Houghton, M.; Egli, A. An ELISA Based Binding and Competition Method to Rapidly Determine Ligand-receptor Interactions. J. Vis. Exp. 2016, 109, 53575. [Google Scholar] [CrossRef] [PubMed]
- Rahimnejad, S.; Zhang, J.; Wang, L.; Sun, Y.; Zhang, C. Evaluation of Bacillus pumillus SE5 fermented soybean meal as a fish meal replacer in spotted seabass (Lateolabrax maculatus) feed. Aquaculture 2021, 531, 735975. [Google Scholar] [CrossRef]
- Dong, Y.; Li, L.; Espe, M.; Lu, K.; Rahimnejad, S. Hydroxytyrosol Attenuates Hepatic Fat Accumulation via Activating Mitochondrial Biogenesis and Autophagy through the AMPK Pathway. J. Agric. Food Chem. 2020, 68, 9377–9386. [Google Scholar] [CrossRef] [PubMed]
- Dong, Y.; Yu, M.; Wu, Y.; Xia, T.; Wang, L.; Song, K.; Zhang, C.; Lu, K.; Rahimnejad, S. Hydroxytyrosol Promotes the Mitochondrial Function through Activating Mitophagy. Antioxidants 2022, 11, 893. [Google Scholar] [CrossRef] [PubMed]
- Zhang, Q.; Liang, H.; Longshaw, M.; Wang, J.; Ge, X.; Zhu, J.; Li, S.; Ren, M. Effects of replacing fishmeal with methanotroph (Methylococcus capsulatus, Bath) bacteria meal (FeedKind®) on growth and intestinal health status of juvenile largemouth bass (Micropterus salmoides). Fish Shellfish Immun. 2022, 122, 298–305. [Google Scholar] [CrossRef]
- Wei, H.Y.H.C. Effects of soybean meal replaced by Clostridium autoethanogenum protein on growth performance, plasma biochemical indexes and hepatopancreas and intestinal histopathology of Grass Carp (Ctenopharyngodon idllus). Chin. J. Anim. Nutr. 2018, 30, 4190–4201. [Google Scholar]
- Ahmadifar, E.; Kalhor, N.; Dawood, M.A.O.; Ahmadifar, M.; Moghadam, M.S.; Yousefi, M. Effects of dietary p-coumaric acid on the growth performance, digestive enzyme activity, humoral immunity and immune-related gene expression in common carp, Cyprinus carpio. Aquac. Nutr. 2021, 27, 747–756. [Google Scholar] [CrossRef]
- Jia, R.; Liu, B.; Han, C.; Huang, B.; Lei, J. The physiological performance and immune response of juvenile turbot (Scophthalmus maximus) to nitrite exposure. Comp. Biochem. Physiol. C Toxicol. Pharmacol. 2016, 181–182, 40–46. [Google Scholar] [CrossRef]
- Lallès, J. Biology, environmental and nutritional modulation of skin mucus alkaline phosphatase in fish: A review. Fish Shellfish Immun. 2019, 89, 179–186. [Google Scholar] [CrossRef]
- Dos Santos Silva, M.J.; Da Costa, F.F.B.; Leme, F.P.; Takata, R.; Costa, D.C.; Mattioli, C.C.; Luz, R.K.; Miranda-Filho, K.C. Biological responses of Neotropical freshwater fish Lophiosilurus alexandri exposed to ammonia and nitrite. Sci. Total Environ. 2017, 616–617, 1566–1575. [Google Scholar] [CrossRef]
- Dawood, M.A.O.; Koshio, S.; Ishikawa, M.; Yokoyama, S. Immune responses and stress resistance in red sea bream, Pagrus major, after oral administration of heat-killed Lactobacillus plantarum and vitamin C. Fish Shellfish Immun. 2016, 54, 266–275. [Google Scholar] [CrossRef] [PubMed]
- Adel, M.; Yeganeh, S.; Dadar, M.; Sakai, M.; Dawood, M.A.O. Effects of dietary Spirulina platensis on growth performance, humoral and mucosal immune responses and disease resistance in juvenile great sturgeon (Huso huso Linnaeus, 1754). Fish Shellfish Immun. 2016, 56, 436–444. [Google Scholar] [CrossRef] [PubMed]
- Copenhaver, M.; Yu, C.; Hoffman, R.P. Complement Components, C3 and C4, and the Metabolic Syndrome. Curr. Diabetes Rev. 2018, 15, 44–48. [Google Scholar] [CrossRef] [PubMed]
- Tang, H.; Wu, T.; Zhao, Z.; Pan, X. Effects of fish protein hydrolysate on growth performance and humoral immune response in large yellow croaker (Pseudosciaena crocea R.). J. Zhejiang Univ. Sci. B 2008, 9, 684–690. [Google Scholar] [CrossRef]
- Pereira, S.A.; Jesus, G.F.A.; Cardoso, L.; Silva, B.C.; Ferrarezi, J.V.S.; Ferreira, T.H.; Sterzelecki, F.C.; Sugai, J.K.; Martins, M.L.; Mouriño, J.L.P. The intestinal health of silver catfish Rhamdia quelen can be changed by organic acid salts, independent of the chelating minerals. Aquaculture 2019, 505, 118–126. [Google Scholar] [CrossRef]
- Zhe, W.; Manqi, Y.; Ling, W.; Kangle, L.; Kai, S.; Chunxiao, Z. Bacillus subtilis LCBS1 supplementation and replacement of fish meal with fermented soybean meal in bullfrog (Lithobates catesbeianus) diets: Effects on growth performance, feed digestibility and gut health. Aquaculture 2021, 545, 737217. [Google Scholar] [CrossRef]
- Li, Y.; Hu, H.; Liu, J.; Yang, P.; Zhang, Y.; Ai, Q.; Xu, W.; Zhang, W.; Mai, K. Dietary soya allergen β-conglycinin induces intestinal inflammatory reactions, serum-specific antibody response and growth reduction in a carnivorous fish species, turbot Scophthalmus maximus L. Aquac. Res. 2016, 48, 4022–4037. [Google Scholar] [CrossRef]
- Liu, X.; Cheng, Y.; Shao, L.; Ling, Z. Alterations of the Predominant Fecal Microbiota and Disruption of the Gut Mucosal Barrier in Patients with Early-Stage Colorectal Cancer. BioMed Res. Int. 2020, 2020, 2948282. [Google Scholar] [CrossRef]
- Yin, Z.; Liu, Q.; Liu, Y.; Gao, S.; He, Y.; Yao, C.; Huang, W.; Gong, Y.; Mai, K.; Ai, Q. Early Life Intervention Using Probiotic Clostridium butyricum Improves Intestinal Development, Immune Response, and Gut Microbiota in Large Yellow Croaker (Larimichthys crocea) Larvae. Front. Immunol. 2021, 12, 640767. [Google Scholar] [CrossRef]
- Zhao, F.; Guo, M.; Zhang, M.; Duan, M.; Zheng, J.; Liu, Y.; Qiu, L. Sub-lethal concentration of metamifop exposure impair gut health of zebrafish (Danio rerio). Chemosphere 2022, 303, 135081. [Google Scholar] [CrossRef]
- Wang, P.; Zhou, Q.; Feng, J.; He, J.; Lou, Y.; Zhu, J. Effect of dietary fermented soybean meal on growth, intestinal morphology and microbiota in juvenile large yellow croaker, Larimichthys crocea. Aquac. Res. 2019, 50, 748–757. [Google Scholar] [CrossRef]
- Gong, S.; Ye, T.; Wang, M.; Wang, M.; Li, Y.; Ma, L.; Yang, Y.; Wang, Y.; Zhao, X.; Liu, L.; et al. Traditional Chinese Medicine Formula Kang Shuai Lao Pian Improves Obesity, Gut Dysbiosis, and Fecal Metabolic Disorders in High-Fat Diet-Fed Mice. Front. Pharmacol. 2020, 11, 297. [Google Scholar] [CrossRef] [PubMed]
Publisher’s Note: MDPI stays neutral with regard to jurisdictional claims in published maps and institutional affiliations. |
© 2022 by the authors. Licensee MDPI, Basel, Switzerland. This article is an open access article distributed under the terms and conditions of the Creative Commons Attribution (CC BY) license (https://creativecommons.org/licenses/by/4.0/).