Article

Fatty Acid Profile of Jumbo Squid (Dosidicus gigas) off the Peruvian Exclusive Economic Zone: Revealing the Variability of Feeding Strategies

1
College of Marine Sciences, Shanghai Ocean University, Shanghai 201306, China
2
State Key Laboratory of Marine Geology, Tongji University, Shanghai 200092, China
3
Key Laboratory of Sustainable Exploitation of Oceanic Fisheries Resources, Ministry of Education, Shanghai Ocean University, Shanghai 201306, China
4
National Engineering Research Center for Oceanic Fisheries, Shanghai Ocean University, Shanghai 201306, China
5
Key Laboratory of Ocean Fisheries Exploitation, Ministry of Agriculture and Rural Affairs, Shanghai 201306, China
6
Scientific Observing and Experimental Station of Oceanic Fishery Resources, Ministry of Agriculture and Rural Affairs, Shanghai 201306, China
*
Authors to whom correspondence should be addressed.
These authors contributed equally to this work.
Fishes 2022, 7(5), 221; https://doi.org/10.3390/fishes7050221
Submission received: 17 July 2022 / Revised: 17 August 2022 / Accepted: 24 August 2022 / Published: 26 August 2022
(This article belongs to the Section Biology and Ecology)

Abstract

:
Jumbo squid Dosidicus gigas play a critical role in the marine ecosystems and are an important commercial species in the East Pacific. Generally, three size groups have been distinguished on the basis of the mantle length (ML) of an adult. Here, fatty acid (FA) analyses of muscle tissues were used to explore the feeding strategies of D. gigas off the Peruvian exclusive economic zone in terms of different size groups and sexes. There was no significant difference in fatty acid composition between the small- and medium-sized groups, whereas the large-sized group differed significantly from other groups. The higher content of C20:4n6 and (C18:2n6 + C18:3n3) indicates that the large-sized group may feed more frequently in nearshore and deep waters. Furthermore, the niches of the three size groups were consistent with the results of fatty acid composition, with the large-sized group occupying the widest trophic niche, followed by the medium-sized group and then the small-sized group. In addition, there was evidence of trophic niche overlap between the small and medium groups. In terms of sexual variability of the small and medium groups, the fatty acid composition significantly differed between females and males. In terms of sexual variation of the large group, the fatty acid composition between females and males was similar, indicating that similar feeding strategies may be adopted by them. This study revealed the variability of the feeding strategies of three size groups of D. gigas off the Peruvian exclusive economic zone.

1. Introduction

Dosidicus gigas belongs to Ommastrephidae [1] and is a cephalopod species distributed in the eastern Pacific Ocean from the Gulf of Alaska to southern Chile [2,3,4,5]. D. gigas can vertically migrate up to 1200 m and feed in deep, middle, and surface waters [6,7,8]. It is preyed upon by other cephalopods and mammals while feeding on other invertebrates and fishes [3]. D. gigas is therefore considered a trophic carrier linking spatially relatively independent marine ecosystems and plays an important role in the marine ecosystems in the eastern Pacific Ocean [9]. The feeding habits of marine organisms are important in the material and energy flow analysis of marine ecosystems and provide the basis for better conservation and management of fishery resources [10]. Therefore, it is necessary to explore the feeding habits of D. gigas in marine ecosystems.
The traditional stomach content analysis method is widely used to study the feeding ecology of marine organisms [8,11,12,13]. However, it is only applicable to a short feeding period of 24 h, and it is difficult to identify decayed components in stomachs [14]. In marine ecosystems, the majority of polyunsaturated fatty acids in organisms come from food supply because of their limited synthetic ability [15,16,17]. Therefore, fatty acid biomarkers are widely used in studies on feeding transitions and trophic relationships [18]. Some signature fatty acids can be reflected in the fatty acid composition of high-trophic animals through feeding activities [16]. For example, C18:2n6 and C18:3n3 are signature fatty acid markers for terrestrial organic food sources [19], C20:4n6 indicates zoobenthos [20], and C22:6n3 (DHA) could indicate dinoflagellates [21]. Gong et al. [22] investigated the dietary habits of D. gigas using fatty acids in muscle tissue and found that the spatial variability of fatty acid profiles was mainly ascribed to the different contents of C16:0, C18:2n6, C20:4n6, and DHA in different areas. Chen et al. [23] used fatty acid analysis to study the reproductive input strategy of female D. gigas and found that the energy of D. gigas during the reproductive period was mainly converted from food intake, whereas the reused muscle energy reserve was limited. Similarly, Quispe et al. [24] suggested that the digestive gland had the highest mean proportion of fatty acids in three tissues (digestive gland, gonad, and mantle), which are obtained through food and stored in their organs as bioenergetic fuel and may then be used for the subsequent process of migration and reproduction in oceanic waters. Meanwhile, Quispe et al. [25] investigated the variability of fatty acid profiles between the digestive gland, gonad, and mantle muscle of squids and the prey in the stomach contents and found that D. gigas may present an energy optimization strategy during the cold season (austral winter), characterized by the intake of prey with a high energy content and rich in polyunsaturated fatty acids.
The population structure of D. gigas is complicated [26]. Previous studies have been conducted to distinguish the population of D. gigas based on geographic area and body length at maturity. On the one hand, Liu et al. [27] used inductively coupled plasma mass spectrometry (ICP-MS) to determine the trace elements in statoliths of D. gigas sampled outside the EEZ waters of Chile, Peru, and Costa Rica. They suggested that the spatial differences in trace elements of statolith can be used to separate geographic populations of D. gigas and found that there were at least two geographic populations in the northern and southern parts of the eastern Pacific. Sandoval-Castellanos et al. [28] analyzed randomly amplified polymorphic DNA (RAPD) data of D. gigas from eight eastern Pacific sites and found that a genetic structure was detected that divided the populations into northern and southern locations. On the other hand, it was suggested that sub-populations of this species can be identified based on the size of mature individuals [29,30,31,32,33,34]. Three groups of length-at-maturity were distinguished on the basis of the mantle length (ML) of adult males and females: a small-sized group (mantle length: 130 to 260 mm for adult males and 140 to 340 mm for adult females), a medium-sized group (mantle length: 240 to 420 mm for adult males and 280 to 600 mm for adult females), and a large-sized group (mantle length: >400 mm for adult males and >550 mm for adult females) [35,36]. However, the feeding habits and coexistence mechanism of the three groups are currently unclear. Therefore, we attempted to explore the variability of feeding strategies and trophic niche among these three groups using fatty acids in the muscle tissue of D. gigas.
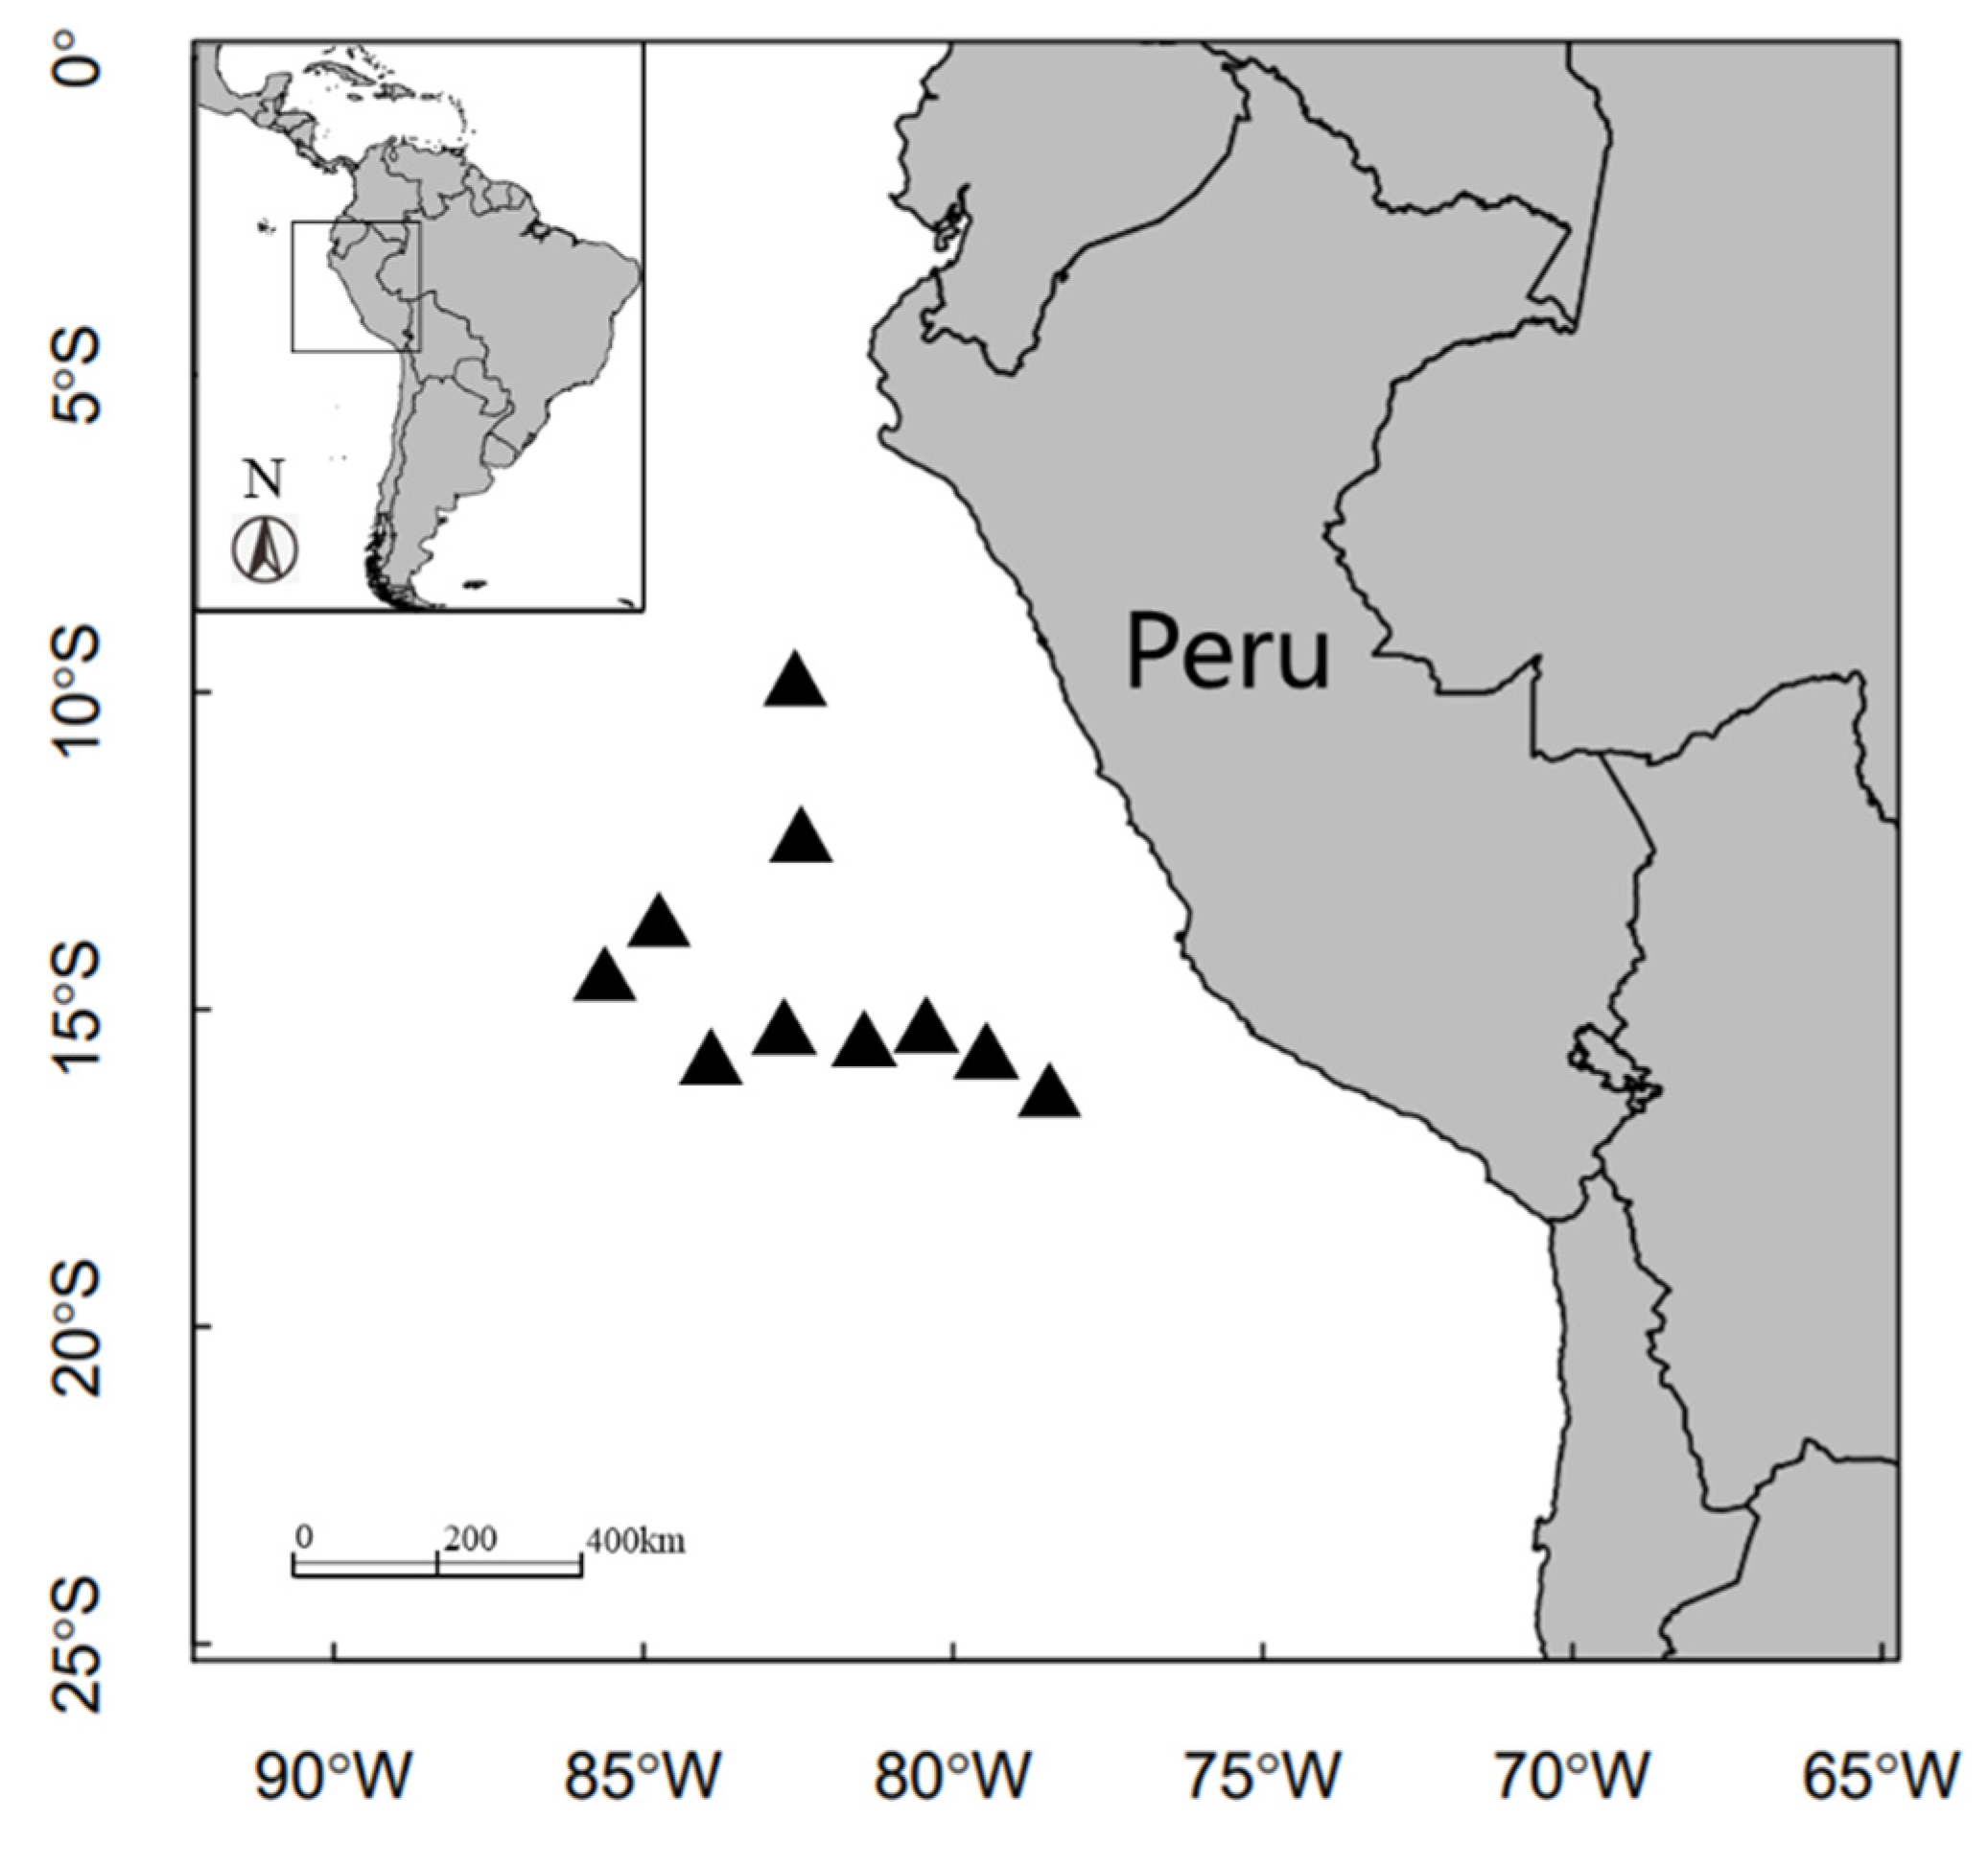
Here, we used fatty acid analysis to investigate the variability of feeding strategies and trophic niche among these three groups off the Peruvian exclusive economic zone. As the fatty acids of a heterotrophic organism effectively reflect those in its diet [37], this study was designed to (1) determine the differences in fatty acid composition and trophic niche among three groups, (2) explore the variability of fatty acid composition between sexes, and (3) evaluate the feeding strategy of three groups of D. gigas. This study provides the basis for understanding the variability of feeding strategy and coexistence mechanism among groups and sexes.

2. Materials and Methods

2.1. Sample Collection and Preparation

A total of 108 squids were caught by commercial jigging vessels off the Peruvian exclusive economic zone (EEZ) (80°41′~89°07′ W, 10°39′~18°49′ S) from June to December 2020 (Figure 1). D. gigas were collected and immediately frozen at −20 °C on board to prevent tissue degradation and lipid oxidation [10]. Before defrosting in the laboratory, the muscle tissue (~10.0 g wet weight) from the ventral mantle of each specimen was obtained, placed immediately in a drying chamber (ChristAlpha 1-4/LDplus, Osterode, Germany), and lyophilized to constant weight. Each dried sample was then ground into powder, and about 0.2 g of powder was used for fatty acid analysis. After defrosting, mantle length and body weight were measured, and sexually mature samples were screened. The division of three size groups is based on body length at sexual maturity: small-sized group (mantle length: 130 to 260 mm for adult males and 140 to 340 mm for adult females), medium-sized group (mantle length: 240 to 420 mm for adult males and 280 to 600 mm for adult females), large-sized group (mantle length: >400 mm for adult males and >550 mm for adult females) [36]. A total of 108 samples were selected, including 26 small-sized samples, 43 medium-sized samples, and 39 large-sized samples (Table 1).

2.2. Fatty Acid Analysis

Fatty acid methyl esters (FAMEs) of each sample were measured according to the GAQSIQ method with minor modifications [38]. Briefly, we used a mixture of chloroform and methanol 2:1 (v/v) [39,40] to extract the lipids for each tissue sample, and the lipid content was determined gravimetrically. Lipids were then trans-esterified with boron trifluoride–methanol and analyzed as FAMEs. FAMEs were separated and quantified by a gas chromatography/mass selective detector (7890B/5977A, Agilent Technologies, Santa Clara, CA, USA) equipped with an HP-88 capillary column (60 m × 0.25 mm × 0.2 µm, Agilent Technologies). Methyl nonadecanoate (19:0) was used as an internal standard. Injection of samples was carried out in splitless mode, using helium as the carrier gas and a thermal gradient from 125 °C to 250 °C, with an auxiliary heater at 280 °C. Fatty acids were identified by comparison to relative retention times of a known standard [38] and the fatty acid data for this study. The results were calculated as a percentage of the total fatty acids in the sample.
The total content of fatty acids (total FAs) was measured based on dry tissue weight (mg/g dry weight), and each fatty acid (FA) was calculated as a percentage of total FAs [37]. The individual fatty acids were grouped into three main FA classes: saturated fatty acids (SFAs), monounsaturated fatty acids (MUFAs), and polyunsaturated fatty acids (PUFAs). FAs accounting for less than 1% of total FAs in at least one sample were excluded in subsequent analyses. In addition, the fatty acids indicating feeding habits were called signature fatty acids. In this study, the differences in feeding habits among various groups of squids were explored based on the signature fatty acids. The signature fatty acids and their indications are shown in Table 2.

2.3. Statistical Analysis

All content data were analyzed with the one-sample Kolmogorov–Smirnov test to check for normal distribution and subjected to Levene’s test to check for homogeneity of variance [44]. If they did not conform to the normal distribution, the data were converted to the logarithmic form before testing. Afterwards, t-test (two-tailed) was used to test the means of each FA profile and main FA class between males and females [44]. In addition, the means of each FA profile and main FA class among groups were compared using one-way analysis of variance (ANOVA) followed by Tukey’s post hoc test, if necessary [44,45].
Based on the Bray–Curtis distance, the Permutational Multivariate Analysis of Variance (PERMANOVA) was employed in a two-way crossed design in order to test the interaction between group and sex [46]. In the two-way PERMANOVA, both group (3 levels: small group, medium group, and large group) and sex (2 levels: male and female) were used as fixed factors. The nonmetric multidimensional scaling (nMDS) and one-way PERMANOVA were performed to test sexual differences in fatty acid composition within each group. Afterwards, we used principal component analysis (PCA) to reduce the dimensionality of the data. According to the results of principal components (PC 1 and PC 2), the standard elliptic area (SEAc) was calculated with the R language SIAR software package to characterize the trophic niches of three groups [47]. Statistical analyses were carried out using R version 3.5.0 [48]. Significant differences were considered when p < 0.05 for all statistical tests.

3. Results

A total of 28 FAs were identified in the three size groups, including 10 SFAs, 8 MUFAs, and 10 PUFAs. The results of two-way PERMANOVA showed that both group and sex had significant impacts on the fatty acid composition (group, F = 31.989, p < 0.05; sex, F = 5.211, p < 0.05). The interaction between group and sex was significant, and the effect of sex on fatty acid composition was significantly different among the three groups (group × sex, F = 3.318, p < 0.05) (Table 3).

3.1. Sexual Variation within Groups

For the small-sized group, the content of saturated fatty acids (SFAs) in females was significantly higher than that in males (t-test, p < 0.05), and the content of monounsaturated fatty acids (MUFAs) also showed a similar sexual difference. In contrast, the content of polyunsaturated fatty acids (PUFAs) in males was significantly higher than that in females (t-test, p < 0.05). For the medium-sized group, the content of SFAs in females was significantly higher than that in males (t-test, p < 0.05). Similarly, the content of MUFAs in females was also significantly higher than that in males (t-test, p < 0.05), whereas the content of PUFAs showed no significant difference between males and females (t-test, p > 0.05). For the large-sized group, the content of SFAs in males was significantly higher than that in females (t-test, p < 0.05), whereas the content of PUFAs in males was significantly lower than that in females (t-test, p < 0.05), and the content of MUFAs showed no significant difference between males and females (t-test, p > 0.05). In addition, the fatty acids differed significantly between males and females in the small-sized group, including C18:1n9, C20:5n3, and C22:6n3 (t-test, C18:1n9: p < 0.05; C20:5n3: p < 0.05; C22:6n3: p < 0.05). In the medium group, the fatty acids differed significantly between males and females, including C20:1n9, C20:3n3, C20:4n6, and C22:6n3 (t-test, C20:1n9: p < 0.05; C20:5n3: p < 0.05; C22:6n3: p < 0.05). Only one fatty acid, C20:1n9, showed significant differences between males and females in the large-sized group (t-test, p < 0.05) (Table 4).
In the small-sized group, nonmetric multidimensional scaling (nMDS) showed that the fatty acid composition in males was significantly different from that in females (Figure 2A). The fatty acid composition in males was significantly different from that in females in the medium-sized group (Figure 2B). On the contrary, fatty acid composition showed no significant difference between males and females in the large-sized group (Figure 2C). Moreover, these findings were further confirmed by the results of one-way PERMANOVA (Table 5). In the small- and medium-sized groups, the fatty acid composition showed a significant difference between males and females (small-sized group: F = 6.20, p < 0.05; medium-sized group: F = 6.57, p < 0.05). However, the fatty acid composition showed no significant difference between males and females in the large-sized group (F = 1.44, p > 0.05).

3.2. Variations among Groups

3.2.1. Total Fatty Acid Profile

Twenty-eight fatty acids, including ten SFAs, eight MUFAs, and ten PUFAs, were determined for each group (Table 6), with the carbon chain length ranging from C14 to C24. The PUFAs accounted for the largest proportion of 28 fatty acids in the small-, medium-, and large-sized groups, with proportions of 51.64%, 51.08%, and 50.75%, respectively, and the content of PUFAs showed a significant difference among the three groups (ANOVA, F2,105 = 15.861, p < 0.05). The proportion of SFAs was the second highest and respectively reached 36.73%, 36.48%, and 34.72% in the small-, medium-, and large-sized groups, and the content of SFAs showed a significant difference among the three groups (ANOVA, F2,105 = 18.342, p < 0.05). In addition, the content of MUFAs was significantly different among the three groups (ANOVA, F2,105 = 14.443, p < 0.05). Meanwhile, the proportions of C16:0, C20:1n9, and DHA were the highest in SFAs, MUFAs, and PUFAs, respectively. Meanwhile, there were significant differences in the relative content of C16:0 among the three groups, and similar results were obtained for C20:1n9 and DHA. Moreover, the DHA/EPA ratio in the small-, medium-, and large-sized groups was 4.61, 4.58, and 3.40, respectively. The total proportion of 13 fatty acids among total fatty acids was above 1% in all three groups, including C14:0, C15:0, C16:0, C17:0, C18:0, C18:1n9, C20:1, C18:2n6, C20:3n3, C20:4n6, C22:2n6, C20:5n3, and C22:6n3.

3.2.2. Signature Fatty Acid Profiles

No significant difference in the relative content of C18:1n9 was detected among the three groups (ANOVA, F2,105 = 1.311, p > 0.05), and similar results were obtained for C18:3n3 (ANOVA, F2,105 = 2.106, p > 0.05) and C18:2n6 (ANOVA, F2,105 = 0.111, p > 0.05). Moreover, the relative contents of other signature fatty acids showed significant differences among the three groups, including C16:1n7, C20:4n6, C20:1n9, C20:5n3, and C22:6n3 (ANOVA, C16:1n7: F2,105 = 5.147, p < 0.01, C20:4n6: F2,105 = 2.298, p < 0.05, C20:1n9: F2,105 = 54.225, p < 0.01, C20:5n3: F2,105 = 62.875, p < 0.01, C22:6n3: F2,105 = 16.684, p < 0.01).

3.3. Principal Component Analysis (PCA) and Permutational Multivariate Analysis of Variance (PERMANOVA)

With three groups of D. gigas as the samples, fatty acids with a proportion above 1% were selected as the parameters for PCA. The variance contribution rates of PC1 and PC2 were respectively 39.37% and 24.99%.
According to the principal component scatter plot (Figure 3A), the small- and medium-sized groups were basically distributed in the same area, indicating that their main fatty acid composition was similar. In contrast, the scatter points of the large-sized group were mainly distributed on the upper right side and clearly separated from those of the small- and medium-sized groups. The loading coefficients of the principal components (Table 7) showed that the top five eigenvectors contributing to principal components 1 and 2 were C16:0, C18:1n9, C20:1n9, C20:5n3, and C22:6n3. The loading plots indicated that the large-sized group had high contents of C20:1n9, C20:5n3, C20:4n6, and C22:2n6, which were the main fatty acids responsible for their differences from the small- and medium-sized groups. In contrast, the small- and medium-sized groups contained higher levels of C16:0, C22:6n3, and C18:1n9. According to the results of PERMANOVA, the fatty acid composition showed no significant differences between the small and medium groups (F = 1.35, p > 0.05). On the contrary, there were significant differences between the small and large groups (F = 7.23, p < 0.05). Similar results were found for the medium and large groups (F = 6.96, p < 0.05) (Table 8).
The standard ellipse area for fatty acids showed that the large-sized group occupied the largest trophic niche area with a standard ellipse area of 11.80, followed by the medium-sized group with a standard ellipse area of 5.26 (Figure 3B). The small-sized group occupied the smallest trophic niche area with a standard ellipse area of 2.76 (Table 9). In addition, there was no overlap in the standard ellipse areas between the large-sized group and the medium-sized group. The large-sized group and the small group showed a significant separation phenomenon in trophic niches without overlap in the standard ellipse area. In contrast, the small-sized group and the medium-sized group had a significant overlap in the standard ellipse area, with a percentage of overlap area of 32.16%.

4. Discussion

Intraspecific feeding variation of pelagic predators allows them to make the best use of available food resources and improve adaptation to variable marine environments [49]. This intraspecific variation in feeding is critical for the Dosidicus gigas, which is widely distributed in the eastern Pacific Ocean [36]. In the present study, we used the methodology of fatty acid analyses to evaluate the feeding strategies and coexistence mechanisms for large-, medium-, and small-sized groups of Dosidicus gigas in Peruvian waters. We randomly selected a total of 108 specimens for the fatty acids analyses, with 39 individuals in the large-sized group, 43 individuals in the medium-sized group, and 26 individuals in the small-sized group. The sample size was comparable to that of previous studies using fatty acids as trophic biomarkers (e.g., 18 individuals of Idioteuthis cordiformis used by Jackson et al. [50]; 32 individuals of D. gigas used by Quispe-Machaca et al. [25]).
In this study, 28 fatty acids were detected in the samples of squids off the Peruvian EEZ, and the fatty acid composition was dominated by PUFAs (50.75–51.64%), followed by SFAs (34.72–36.73%) and MUFAs (11.64–14.53%). Our results were consistent with the findings of Gong et al. [22] and Chen et al. [23]. Moreover, a similar relative fatty acid composition in other cephalopod species was also reported. Lin et al. [51] analyzed the fatty acid composition of the muscles, digestive glands, and ovaries of D. gigas. They found that the fatty acid composition in all three tissues was dominated by PUFAs, and the relative content of MUFAs was the lowest. In addition, the fatty acid composition in Octopodidae and Sepiidae was also dominated by PUFAs, SFAs, and MUFAs, which had the lowest content [52,53]. It could be seen that the proportions of PUFAs, MUFAs, and SFAs in cephalopod muscle tissue were generally similar.

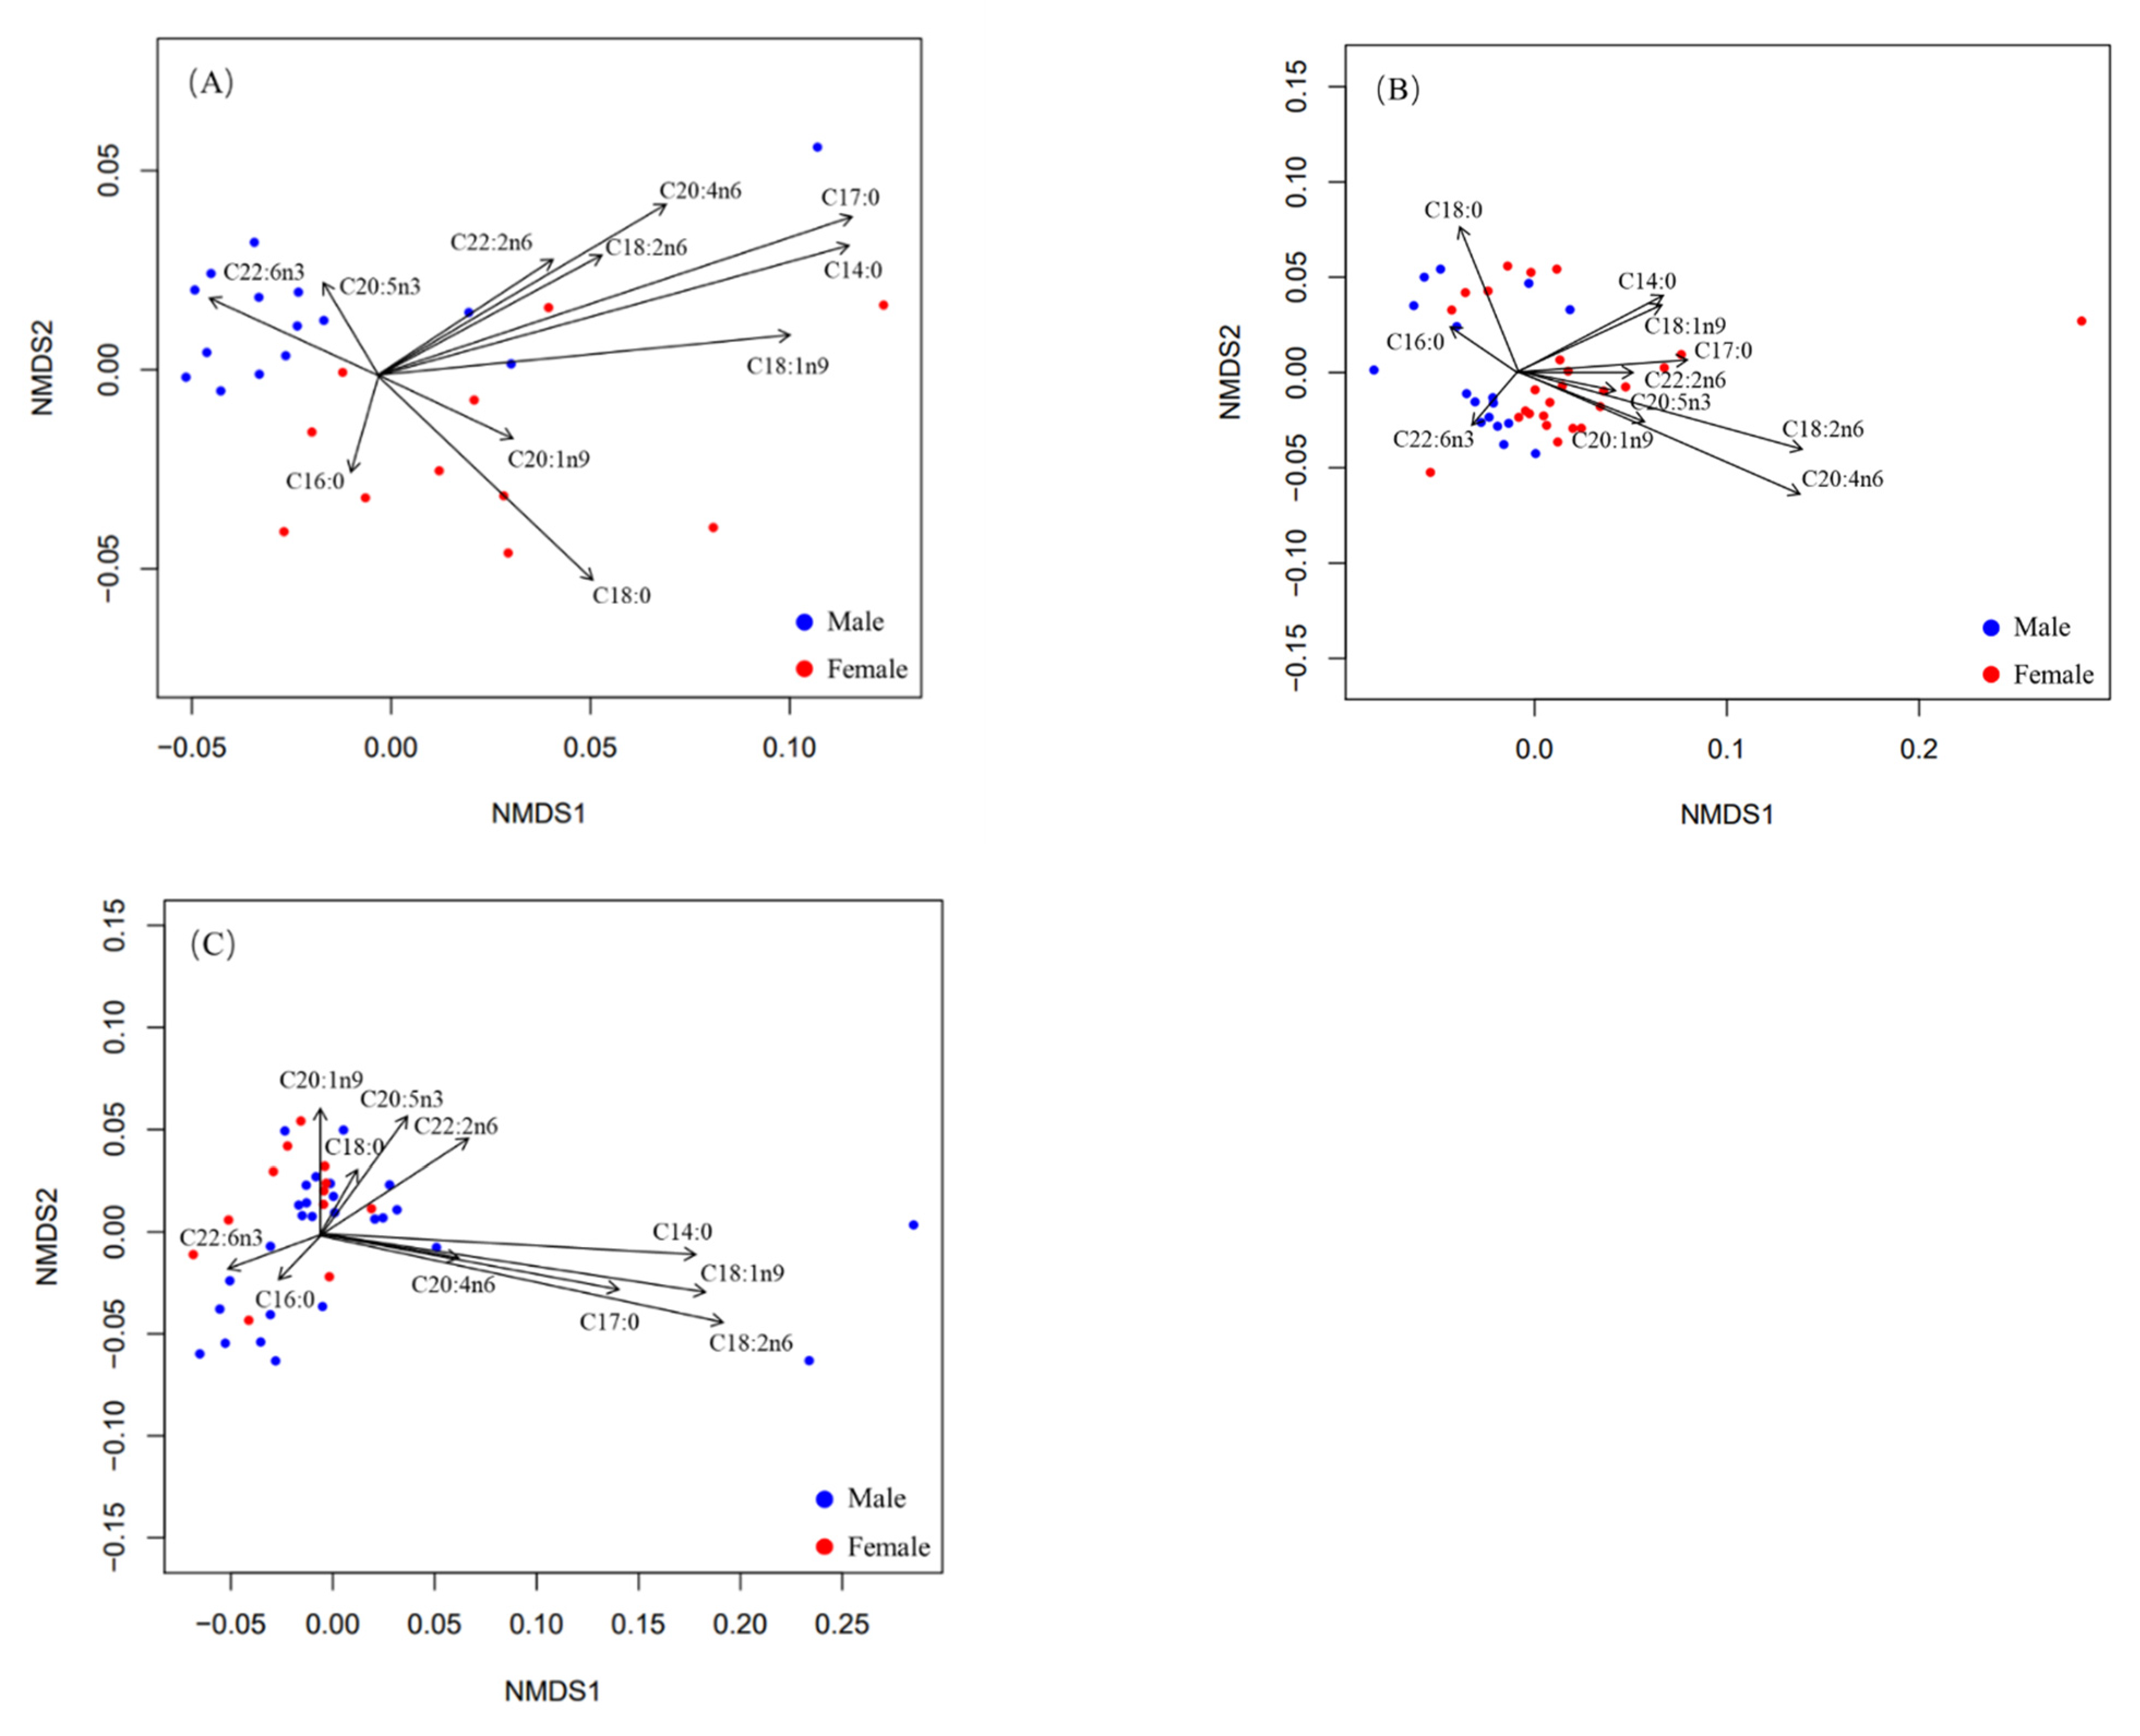
4.1. Intraspecific Sexual Variation

In marine ecosystems, male and female individuals of many species coexist by using different habitats or adopting different feeding behaviors [54]. This coexistence strategy is often associated with sexual variability in size, feeding behavior, and nutrient requirements [55].
In this study, we found that the fatty acid composition in female and male samples from the small-sized group differed significantly, and C18:1n9, C20:5n3, and C22:6n3 were identified as the main fatty acids, which were responsible for the above differences. Diet species may differ between male and female individuals in small groups. In the medium-sized group, the fatty acid composition also showed significant differences between males and females. Given that females in small- and medium-sized groups are slightly larger in body length than males, sexual differences in body size may have an impact on the feeding of squid, which in turn may lead to the differences in fatty acid composition. High levels of C20:4n6 suggested that females tend to consume more benthic organisms, making them frequently inhabit deeper waters. Therefore, their coexistence also benefits from sexual difference in habitats. However, the large-sized group showed no significant differences between males and females. It has been reported that individuals with large body length tend to consume more food to maintain their metabolism [56]. Meanwhile, Liu et al. [18] pointed out that, as body length increased, D. gigas tended to adopt a specific feeding strategy. This feeding strategy may lead to the similarity in diet of males and females, which in turn affects the fatty acids composition.
Rossi et al. [39] suggested that the higher DHA/EPA ratio corresponded to the higher trophic level. The DHA/EPA ratio in males was higher than in females in the three groups, so males likely fed on prey with higher trophic levels. However, Gong et al. [54] explored immature D. gigas through stable isotope analysis and found that the trophic level of females was higher than that of males and that females tended to feed on prey with a higher trophic level. Since all samples in our study were sexually mature individuals, DHA and EPA contents were strongly influenced by reproductive activity [20,57]. Therefore, a possible diet transition from the immature stage to the mature stage may exist in males and females and may be affected by reproductive activities. However, regardless of the changes in the contents of DHA and EPA in males and females during growth, the trophic levels of prey were different among different growth stages. Consequently, they can coexist in the same waters.

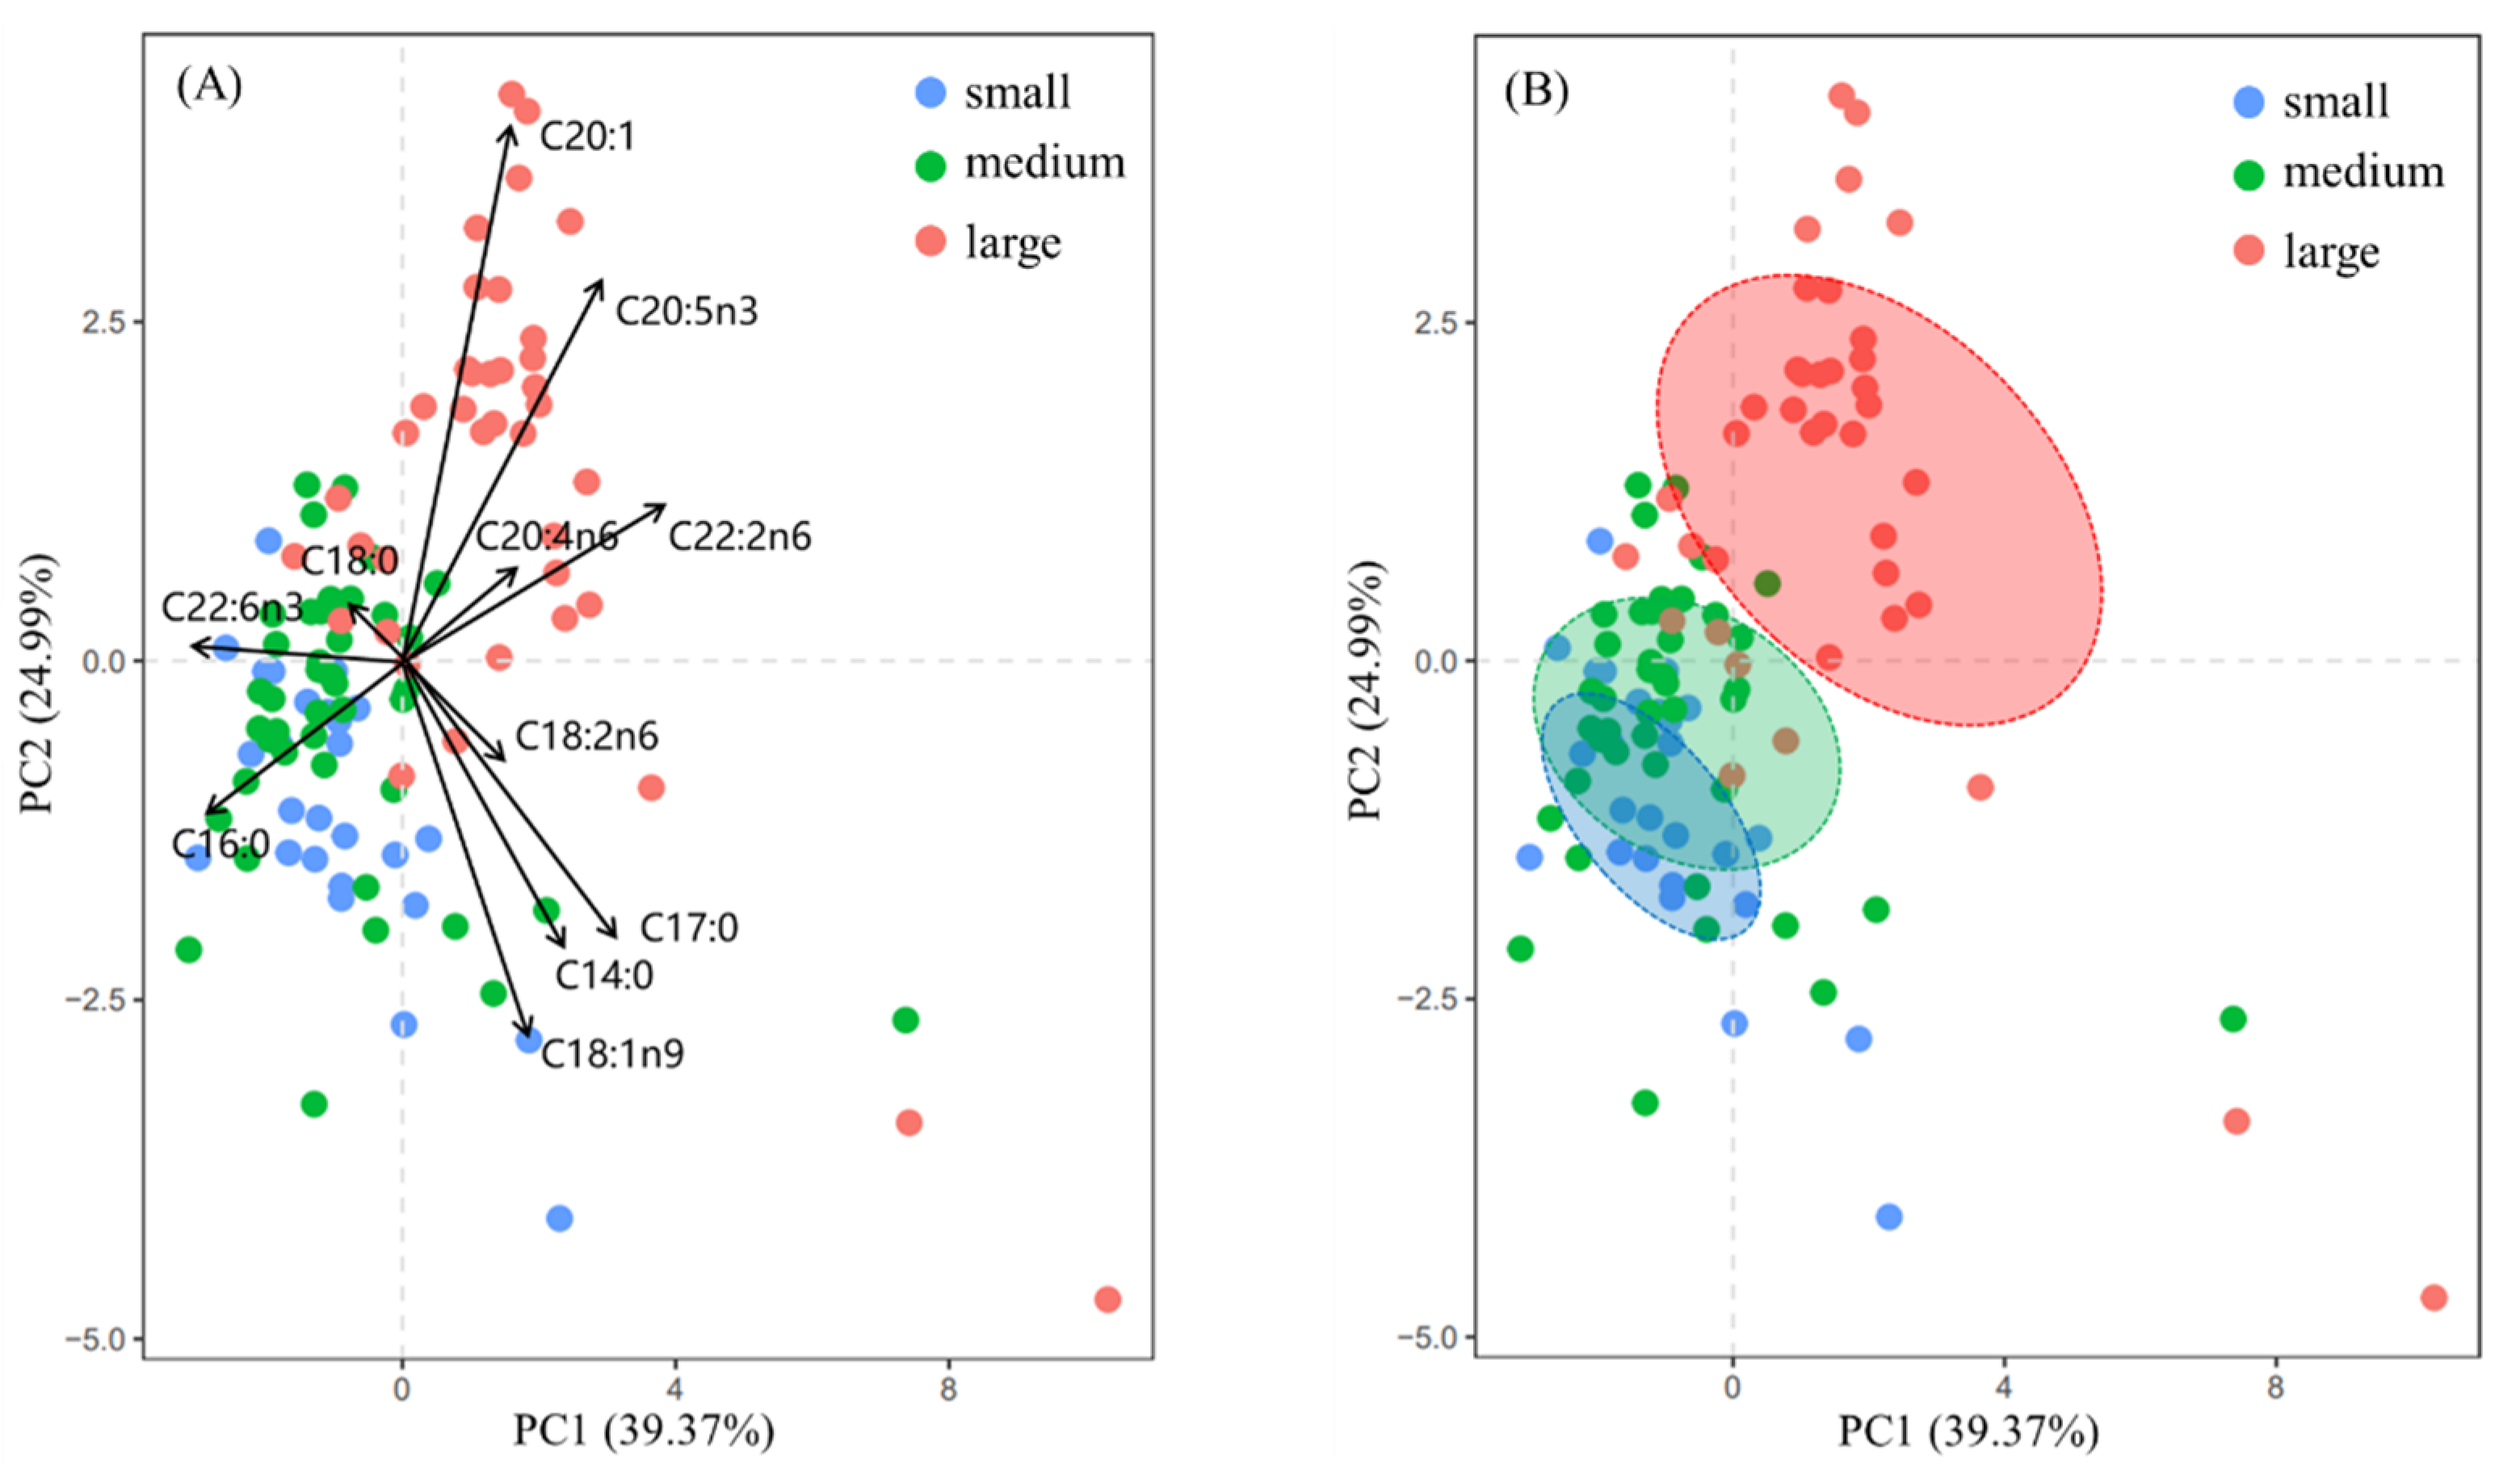
4.2. Interspecific Variation

PCA results showed that C16:0, C18:1n9, C20:1n9, C20:5n3, and C22:6n3 were the main fatty acids that were responsible for the differences in fatty acid composition among the small-, medium- and large-sized groups. The content of C16:0 in the large-sized group was significantly lower than that in the small- and medium-sized groups (p < 0.05). Marine fatty acids come from their own synthesis or food supply, and cephalopods can extend and desaturate the carbon chain of C16:0 to synthesize C18:1n9 [58]. However, the content of C18:1n9 showed no significant difference among small-, medium-, and large-sized groups (p > 0.05), so most of C18:1n9 in the muscle tissue of the large-sized group probably originated from feeding activities.
Since the fatty acid composition of organisms largely depends on the fatty acid profile of their food [59] and signature fatty acids indicate feeding habits, fatty acid composition and content can be used to indicate food sources. According to the available fatty acid marker system (Table 2), C18:1n9 in marine organisms is mostly from zooplankton [39], and therefore, the large-sized group of D. gigas may feed on more zooplankton or other species that feed on zooplankton. In addition, the content of C20:1n9 in the muscle tissue in the large-sized group was significantly higher than that in the small- and medium-sized groups, suggesting that more copepods or other species that feed on copepods may be consumed by the large-sized group [60,61,62,63]. Cecilia et al. [63] found that Trachurus murphyi significantly exceeded other species in the stomach of D. gigas in terms of frequency, quantity, and weight. Given that the main prey of Trachurus murphyi includes copepods and zooplankton [60,61], we inferred that C18:1n9 and C20:1n9 in D. gigas in our study may be derived from Trachurus murphyi, and the large-sized population had a more significant feeding preference for Trachurus murphyi. Similarly, the content of C20:4n6 in the muscle tissue of the large-sized group was also significantly higher than that in small- and medium-sized groups, indicating that more benthic organisms may be preyed on by the large-sized group. The oxygen consumption of squids in normal metabolism is negatively correlated with body length, and the larger body size of squids corresponds to lower oxygen consumption [56]. As a result, the large-sized group can remain at greater depths for longer periods of time due to relatively low oxygen consumption, thereby feeding on prey that lives in deeper water.
In our study, the trophic niches of the small- and medium-sized groups overlapped highly, which may reveal a similarity in their use of food or habitat resources. In contrast, the standard ellipse of the large-sized group was clearly distinguished from that of the small- and medium-sized groups (Figure 3). Tentacles and beaks, as the feeding apparatus, influence the feeding and resource utilization of D. gigas [49]. Firstly, the longer tentacles and larger beaks of large-sized groups allow them to feed on larger prey, thus broadening their trophic niche. Secondly, large-sized groups have larger feeding organs and feed on larger prey with a higher trophic level, so that stable food supplements can be obtained by small- and medium-sized groups. Thirdly, the contents of C18:2n6 and C18:3n3 indicate the terrestrial organic source of marine organisms, such as estuarine/coastal macroalgae [19,43]. In our study, the sum of the C18:2n6 and C18:3n3 in the large-sized group was slightly higher than in other groups, suggesting frequent feeding nearshore where the terrestrial input exists. The results were in agreement with the point of Gong et al. [49]. According to the report by Gong et al. [49], both pelagic and nearshore food resources were utilized by D. gigas. Therefore, compared with the small- and medium-sized groups, the large-sized group may migrate to the sea area closer to the coast for feeding. In other words, the differences in food sources and habitats may contribute to the stable survival of different groups in the same waters. In addition, the relative oxygen consumption of D. gigas is negatively correlated with body length [56], so larger individuals can migrate to deeper waters to feed. In our study, the content of C20:4n6 indicating the food origin of zoobenthos was highest in the large group, followed by the medium group and lowest in the small group. The large-sized group can migrate more easily to deeper locations. As a result, both the horizontal and vertical migration areas of the large-sized groups were larger than those of the medium- and small-sized groups, thus occupying the largest area of trophic niches. However, the ratio of DHA/EPA indicating trophic level was highest in the small-sized group and lowest in the large-sized group. Previous studies indicated that DHA and EPA, which are essential for the structure and function of biological membranes, may be significantly altered by factors unrelated to feeding (reproductive activities) [57,64]. The samples in this study were all sexually mature individuals, suggesting that reproductive activities may lead to abnormal changes in DHA/EPA among different groups.

5. Conclusions

This study focused on a comparison of fatty acids in the muscle tissue of small-, medium-, and large-sized groups of D. gigas off Peru and further explored the feeding habit and trophic niche of these three groups. There was no significant difference in fatty acid composition between the small and medium groups, and their trophic niche overlapped significantly. Meanwhile, they usually achieve coexistence through internal regulation, in which males likely feed on prey with higher trophic levels. We found that there was no significant difference in fatty acid composition between males and females in large groups. However, the fatty acid composition differed significantly between the large-sized group and other groups. The squids from the large-sized group may feed more frequently in nearshore and deep waters. In other words, they may coexist with other groups through a more specialized feeding strategy and a wider feeding space. However, the samples selected in this study were sexually mature individuals, and discriminant equations of hard tissue, such as beak, could be established for the three size groups. Once three size groups are distinguished by discriminant equations, it is possible to study early life history samples. In addition, multiple analysis may benefit from correction, especially in cases with a great deal of testing. Finally, there are some limitations of fatty acid analysis. Fatty acid analysis, for example, is only an indirect indication of food source and does not determine trophic level. In future studies, stable isotopes and gastric DNA barcoding technology can be combined to improve the feeding ecology of the three populations from multiple dimensions.

Author Contributions

G.H., Z.Z. and X.C. conceived and designed the experiments. X.C. and B.L. provided the tissue samples. G.H. and Z.Z. performed the experiments and analyzed the data with the help of Z.F. and J.L., G.H. and Z.Z. wrote the manuscript with the advice of B.L. and D.L. All authors have read and agreed to the published version of the manuscript.

Funding

This work was supported by the National Key Research and Development Program (2019YFD0901404), the Postdoctoral Innovative Talent Support Program (BX20200238), the National Natural Science Foundation of China (NSFC41876141, NSFC41876144), and the Shanghai Science and Technology Innovation Action Plan (10DZ1207500).

Institutional Review Board Statement

The animal study was reviewed and approved by Institutional Animal Care and Use Committee of Shanghai Ocean University (approval code 2022031501, approved on 15 March 2022).

Data Availability Statement

The raw data supporting the conclusions of this article will be made available by the authors, without undue reservation.

Acknowledgments

This is a contribution of the Distant Squid Fisheries Sci-Tech Group, SHOU. We thank the staff members of the Key Laboratory of Sustainable Exploitation of Oceanic Fisheries Resources, Ministry of Education, Shanghai Ocean University for providing assistance at laboratory. We are grateful to technician Shaoqin Wang for the fatty acids determination.

Conflicts of Interest

The authors declare no conflict of interest.

References

  1. Chen, X.J.; Fang, Z.; Su, H.; Lu, H.J.; Liu, B.L.; Li, J.H. Review and application of geometric morphometrics in aquatic animals. J. Fish. China 2013, 37, 1873–1885. [Google Scholar] [CrossRef]
  2. Arancibia, H.; Neira, S. Overview of the Chilean Hake (Merluccius gayi) stock, a biomass forecast, and the jumbo squid (Dosidicus gigas) predator-prey relationship off central Chile (33 degrees S-39 degrees S). CalCOFI Rep. 2008, 49, 104–115. [Google Scholar]
  3. Ibáñez, C.M.; Sepulveda, R.; Ulloa, P.; Keyl, F.; Pardo, G. The biology and ecology of the jumbo squid Dosidicus gigas (Cephalopoda) in Chilean waters: A review. Lat. Am. J. Aquat. Res. 2015, 43, 402–414. [Google Scholar] [CrossRef]
  4. Hu, G.Y.; Fang, Z.; Chen, X.J. Review on the life history of jumbo squid (Dosidicus gigas) in the Eastern Pacific Ocean. J. Fish. China 2018, 42, 1315–1328. (In Chinese) [Google Scholar] [CrossRef]
  5. Jereb, P.; Roper, C.F.E. Cephalopods of the World—An Annotated and Illustrated Catalogue of Cephalopod Species Known to Date. Vol 2. Myopsid and Oegopsid Squids; FAO: Rome, Italy, 2010. [Google Scholar]
  6. Gilly, W.F.; Markaida, U.; Baxter, C.H.; Block, B.A.; Boustany, A.; Zeidberg, L.; Reisenbichler, K.; Robison, B.; Bazzino, G.; Salinas, C. Vertical and horizontal migrations by the jumbo squid Dosidicus gigas revealed by electronic tagging. Mar. Ecol. Prog. Ser. 2006, 324, 1–17. [Google Scholar] [CrossRef]
  7. Markaida, U.; Rosenthal, J.J.; Gilly, W.F. Tagging studies on the jumbo squid (Dosidicus gigas) in the Gulf of California, Mexico. Fish. Bull. 2005, 103, 219–226. [Google Scholar]
  8. Rosas-Luis, R.; Chompoy-Salazar, L. Description of food sources used by jumbo squid Dosidicus gigas (D’Orbigny, 1835) in Ecuadorian waters during 2014. Fish. Res. 2016, 173, 139–144. [Google Scholar] [CrossRef]
  9. Arkhipkin, A.I. Squid as nutrient vectors linking Southwest Atlantic marine ecosystems. Deep Sea Res. Part II Top. Stud. Oceanogr. 2013, 95, 7–20. [Google Scholar] [CrossRef]
  10. Phillips, K.L.; Nichols, P.D.; Jackson, G.D. Lipid and fatty acid composition of the mantle and digestive gland of four Southern Ocean squid species: Implications for food-web studies. Antarct. Sci. 2002, 14, 212–220. [Google Scholar] [CrossRef]
  11. Bruno, C.; Cornejo, C.F.; Riera, R.; Ibáñez, C.M. What is on the menu? Feeding, consumption and cannibalism in exploited stocks of the jumbo squid Dosidicus gigas in south-central Chile. Fish. Res. 2021, 233, e105722. [Google Scholar] [CrossRef]
  12. Ibáñez, C.M.; Riera, R.; Leite, T.; Díaz-Santana-Iturrios, M.; Rosa, R.; Pardo-Gandarillas, M.C. Stomach content analysis in cephalopods: Past research, current challenges, and future directions. Rev. Fish Biol. Fish. 2021, 31, 505–522. [Google Scholar] [CrossRef]
  13. Nielsen, J.; Christiansen, J.S.; Gronkjaer, P.; Bushnell, P.; Steffensen, J.F.; Kiilerich, H.O.; Praebel, K.; Hedeholm, R. Greenland Shark (Somniosus microcephalus) Stomach Contents and Stable Isotope Values Reveal an Ontogenetic Dietary Shift. Front. Mar. Sci. 2019, 6, e00125. [Google Scholar] [CrossRef] [Green Version]
  14. Yan, Y.R.; Lu, H.S.; Jin, X.S. Marine fish feeding ecology and food web: Progress and perspectives. J. Fish. China 2011, 35, 145–153. (In Chinese) [Google Scholar]
  15. Sargent, J.; Bell, J.; Bell, M.; Henderson, R.; Tocher, D. Requirement criteria for essential fatty acids. J. Appl. Ichthyol. 1995, 11, 183–198. [Google Scholar] [CrossRef]
  16. Berge, J.; Barnathan, G. Fatty acids from lipids of marine organisms: Molecular biodiversity, roles as biomarkers, biologically active compounds, and economical aspects. Adv. Biochem. Eng. Biotechnol. 2005, 96, 49–125. [Google Scholar] [CrossRef] [PubMed]
  17. Kabeya, N.; Fonseca, M.M.; Ferrier, D.E.; Navarro, J.C.; Bay, L.K.; Francis, D.S.; Tocher, D.R.; Castro, L.F.; Monroig, Ó. Genes for de novo biosynthesis of omega-3 polyunsaturated fatty acids are widespread in animals. Sci. Adv. 2018, 4, e6849. [Google Scholar] [CrossRef]
  18. Liu, B.L.; Xu, W.; Chen, X.J.; Huan, M.Y.; Liu, N. Ontogenetic shifts in trophic geography of jumbo squid, Dosidicus gigas, inferred from stable isotopes in eye lens. Fish. Res. 2020, 226, e10. [Google Scholar] [CrossRef]
  19. Every, S.L.; Pethybridge, H.R.; Crook, D.A.; Kyne, P.M.; Fulton, C.J. Comparison of fin and muscle tissues for analysis of signature fatty acids in tropical euryhaline sharks. J. Exp. Mar. Biol. Ecol. 2016, 479, 46–53. [Google Scholar] [CrossRef]
  20. Stowasser, G.; Pond, D.W.; Collins, M.A. Using fatty acid analysis to elucidate the feeding habits of Southern Ocean mesopelagic fish. Mar. Biol. 2009, 156, 2289–2302. [Google Scholar] [CrossRef]
  21. Liu, M.T.; Li, C.L.; Sun, S. Identification of trophic relationships between marine algae and the copepodCalanus sinicus in a fatty acid approach. Acta Ecol. Sin. 2011, 31, 933–942. (In Chinese) [Google Scholar]
  22. Gong, Y.; Li, Y.K.; Chen, L.; Gao, X.D.; Chen, X.J. A comparative analysis of fatty acid profiles in muscle of Dosidicus gigas from different harvest locations in the eastern Pacific ocean. Prog. Fish. Sci. 2018, 39, 147–154. (In Chinese) [Google Scholar]
  23. Chen, X.J.; Han, F.; Zhu, K.; Punt, A.E.; Lin, D.M. The breeding strategy of female jumbo squid Dosidicus gigas: Energy acquisition and allocation. Sci. Rep. 2020, 10, e9639. [Google Scholar] [CrossRef] [PubMed]
  24. Quispe-Machaca, M.; Guzmán-Rivas, F.A.; Ibáñez, C.M.; Urzúa, A. Intra-individual variability in biochemical constituents and fatty acidcomposition of adult jumbo squid (Dosidicus gigas) in the southeastern Pacific Ocean. J. Sea Res. 2021, 174, 102082. [Google Scholar] [CrossRef]
  25. Quispe-Machaca, M.; Guzmán-Rivas, F.; Ibáñez, C.M.; Urzúa, Á. Trophodynamics of the jumbo squid Dosidicus gigas during winter in the Southeast Pacific Ocean off the coast of Chile: Diet analyses and fatty acid profile. Fish. Res. 2022, 245, 106154. [Google Scholar] [CrossRef]
  26. Argüelles, J.; Tafur, R. New insights on the biology of the jumbo squid Dosidicus gigas in the Northern Humboldt Current System: Size at maturity, somatic and reproductive investment. Fish. Res. 2010, 106, 185–192. [Google Scholar] [CrossRef]
  27. Liu, B.L.; Chen, X.J.; Chen, Y.; Tian, S.Q. Geographic variation in statolith trace elements of the Humboldt squid, Dosidicus gigas, in high seas of Eastern Pacific Ocean. Mar. Biol. 2013, 160, 2853–2862. [Google Scholar] [CrossRef]
  28. Sandoval-Castellanos, E.; Uribe-Alcocer, M.; Díaz-Jaimes, P. Population genetic structure of jumbo squid (Dosidicus gigas) evaluated by RAPD analysis. Fish. Res. 2007, 83, 113–118. [Google Scholar] [CrossRef]
  29. Argüelles, J.; Rodhouse, P.; Villegas, P.; Castillo, G. Age, growth and population structure of the jumbo flying squid Dosidicus gigas in Peruvian waters. Fish. Res. 2001, 54, 51–61. [Google Scholar] [CrossRef]
  30. Markaida, U.; Sosa-Nishizaki, O. Reproductive biology of jumbo squid Dosidicus gigas in the Gulf of California, 1995–1997. Fish. Res. 2001, 54, 63–82. [Google Scholar] [CrossRef]
  31. Markaida, U. Population structure and reproductive biology of jumbo squid Dosidicus gigas from the Gulf of California after the 1997–1998 El Niño event. Fish. Res. 2006, 79, 28–37. [Google Scholar] [CrossRef]
  32. Argüelles, J.; Tafur, R.; Taipe, A.; Villegas, P.; Keyl, F.; Dominguez, N.; Salazar, M. Size increment of jumbo flying squid Dosidicus gigas mature females in Peruvian waters, 1989–2004. Prog. Oceanogr. 2008, 79, 308–312. [Google Scholar] [CrossRef]
  33. Tafur, R.; Keyl, F.; Argüelles, J. Reproductive biology of jumbo squid Dosidicus gigas in relation to environmental variability of the northern Humboldt Current System. Mar. Ecol. Prog. Ser. 2010, 400, 127–141. [Google Scholar] [CrossRef]
  34. Keyl, F.; Arguëlles, J.; Tafur, R. Interannual variability in size structure, age, and growth of jumbo squid (Dosidicus gigas) assessed by modal progression analysis. ICES J. Mar. Sci. 2011, 68, 507–518. [Google Scholar] [CrossRef]
  35. Nesis, K. Cephalopod Life Cycles, Vol. 1. Species Accounts; Boyle, P.R., Ed.; Academic Press: London, UK, 1983; Volume 1, pp. 216–231. [Google Scholar]
  36. Nigmatullin, C.M.; Nesis, K.N.; Arkhipkin, A.I. A review of the biology of the jumbo squid Dosidicus gigas (Cephalopoda: Ommastrephidae). Fish. Res. 2001, 54, 9–19. [Google Scholar] [CrossRef]
  37. Lin, D.M.; Zhu, K.; Qian, W.G.; Punt, A.E.; Chen, X.J. Fatty acid comparison of four sympatric loliginid squids in the northern South China Sea: Indication for their similar feeding strategy. PLoS ONE 2020, 15, e0234250. [Google Scholar] [CrossRef]
  38. GAQSIQ. Determination of Total Fat, Saturated Fat, and Unsaturated Fat in Foods: Hydrolytic Extraction-Gas Chromatography; Standards Press of China: Beijing, China, 2008. (In Chinese)
  39. Rossi, S.; Sabates, A.; Latasa, M.; Reyes, E. Lipid biomarkers and trophic linkages between phytoplankton, zooplankton and anchovy (Engraulis encrasicolus) larvae in the NW Mediterranean. J. Plankton Res. 2006, 28, 551–562. [Google Scholar] [CrossRef]
  40. Parrish, C.C. Determination of Total Lipid, Lipid Classes, and Fatty Acids in Aquatic Samples. In Lipids in Freshwater Ecosystems; Arts, M.T., Wainman, B.C., Eds.; Springer: New York, NY, USA, 1999; pp. 4–20. [Google Scholar]
  41. Gao, X.D.; Chen, X.J.; Li, Y.K. A review on the methods used in aquatic food web research: Development and applications. J. Fish. Sci. China 2018, 25, 1347–1360. [Google Scholar] [CrossRef]
  42. Persson, J.; Vrede, T. Polyunsaturated fatty acids in zooplankton: Variation due to taxonomy and trophic position. Freshw. Biol. 2006, 51, 887–900. [Google Scholar] [CrossRef]
  43. Dalsgaard, J.; John, M.; Kattner, G.; Muller-Navarra, D.; Hagen, W. Fatty acid trophic markers in the pelagic marine environment. Adv. Mar. Biol. 2003, 46, 225–340. [Google Scholar]
  44. Zar, J. Biostatistical Analysis, 4th ed.; Prentice Hall: Hoboken, NJ, USA, 1999; p. 960. [Google Scholar]
  45. Zuur, A.F.; Ieno, E.N.; Elphick, C.S. A protocol for data exploration to avoid common statistical problems. Methods Ecol. Evol. 2010, 1, 3–14. [Google Scholar] [CrossRef]
  46. Anderson, M.J. Permutational Multivariate Analysis of Variance (PERMANOVA). In Wiley StatsRef: Statistics Reference Online; John Wiley & Sons, Ltd.: Hoboken, NJ, USA, 2017; pp. 1–15. [Google Scholar] [CrossRef]
  47. Pedro, S.; Fisk, A.T.; Ferguson, S.H.; Hussey, N.E.; Kessel, S.T.; McKinney, M.A. Broad feeding niches of capelin and sand lance may overlap those of polar cod and other native fish in the eastern Canadian Arctic. Polar Biol. 2020, 43, 1707–1724. [Google Scholar] [CrossRef]
  48. R Core Team. R: A Language and Environment for Statistical Computing, 3.5.0 ed.; R Foundation for Statistical Computing: Vienna, Austria, 2018. [Google Scholar]
  49. Gong, Y.; Li, Y.K.; Chen, X.J.; Yu, W. Trophic Niche and Diversity of a Pelagic Squid (Dosidicus gigas): A Comparative Study Using Stable Isotope, Fatty Acid, and Feeding Apparatuses Morphology. Front. Mar. Sci. 2020, 7, e00642. [Google Scholar] [CrossRef]
  50. Jackson, G.D.; Jackson, C.H.; Virtue, P.; Fluckiger, M.; Nichols, P.D. Dietary fatty acid analyses of the squid Idioteuthis cordiformis: Further evidence for predation on deepwater sharks. Mar. Ecol. Prog. Ser. 2021, 675, 67–79. [Google Scholar] [CrossRef]
  51. Lin, D.M.; Sun, C.; Xuan, S.P.; Han, F.; Chen, X.J. Fatty acid composition and its changes during sexual maturation in female Illex argentinus. J. Shanghai Ocean Uni. 2019, 28, 409–418. (In Chinese) [Google Scholar] [CrossRef]
  52. Fluckiger, M.; Jackson, G.D.; Nichols, P.; Virtue, P.; Daw, A.; Wotherspoon, S. An experimental study of the effect of diet on the fatty acid profiles of the European Cuttlefish (Sepia officinalis). Mar. Biol. 2008, 154, 363–372. [Google Scholar] [CrossRef]
  53. Rosa, R.; Costa, P.R.; Nunes, M.L. Effect of sexual maturation on the tissue biochemical composition of Octopus vulgaris and O-defflippi (Mollusca: Cephalopoda). Mar. Biol. 2004, 145, 563–574. [Google Scholar] [CrossRef]
  54. Gong, Y.; Ruiz-Cooley, R.I.; Hunsicker, M.E.; Li, Y.; Chen, X. Sexual dimorphism in feeding apparatus and niche partitioning in juvenile jumbo squid Dosidicus gigas. Mar. Ecol. Prog. Ser. 2018, 607, 99–112. [Google Scholar] [CrossRef]
  55. Ruckstuhl, K.E.; Neuhaus, P. Sexual segregation in ungulates: A comparative test of three hypotheses. Biol. Rev. 2002, 77, 77–96. [Google Scholar] [CrossRef]
  56. Rosa, R.; Seibel, B.A. Metabolic physiology of the Humboldt squid, Dosidicus gigas: Implications for vertical migration in a pronounced oxygen minimum zone. Prog. Oceanogr. 2010, 86, 72–80. [Google Scholar] [CrossRef]
  57. Cripps, G.C.; Watkins, J.L.; Hill, H.J.; Atkinson, A. Fatty acid content of Antarctic krill Euphausia superba at South Georgia related to regional populations and variations in diet. Mar. Ecol. Prog. Ser. 1999, 181, 177–188. [Google Scholar] [CrossRef]
  58. Wako, Y.; Ishikawa, S.; Nakaya, H. Comparison of fatty acids in liver lipids from various sizes of squid (Illex argentinus). Biosci. Biotechnol. Biochem. 1993, 57, 2181–2183. [Google Scholar] [CrossRef]
  59. Iverson, S.J.; Frost, K.J.; Lowry, L.F. Fatty acid signatures reveal fine scale structure of foraging distribution of harbor seals and their prey in Prince William Sound, Alaska. Mar. Ecol. Prog. Ser. 1997, 151, 255–271. [Google Scholar] [CrossRef]
  60. Hirota, Y.; Uehara, S.; Honda, H. Ontogenetic changes of feeding selectivity in juvenile jack mackerel Trachurus japonicus collected off south-east Kyushu, Japan. Fish. Sci. 2004, 70, 100–107. [Google Scholar] [CrossRef]
  61. Jiang, R.J.; Jin, H.W.; Zhou, Y.D.; Xue, L.J.; Guo, A. Feeding habits of Trachurus japonicus in the East China Sea. Chin. J. Appl. Ecol. 2013, 24, 2015–2024. (In Chinese) [Google Scholar] [CrossRef]
  62. Alegre, A.; Menard, F.; Tafur, R.; Espinoza, P.; Arguelles, J.; Maehara, V.; Flores, O.; Simier, M.; Bertrand, A. Comprehensive model of Jumbo squid Dosidicus gigas trophic ecology in the Northern Humboldt current system. PLoS ONE 2014, 9, e85919. [Google Scholar] [CrossRef]
  63. Cecilia Pardo-Gandarillas, M.; Lohrmann, K.B.; George-Nascimento, M.; Ibanez, C.M. Diet and parasites of the jumbo squid Dosidicus gigas in the Humboldt Current System. Molluscan Res. 2014, 34, 10–19. [Google Scholar] [CrossRef]
  64. Stubing, D.; Hagen, W. Fatty acid biomarker ratios—suitable trophic indicators in Antarctic euphausiids? Polar Biol. 2003, 26, 774–782. [Google Scholar] [CrossRef]
Figure 1. Sampling locations of Dosidicus gigas off the Peruvian EEZ from June to December 2020. The small rectangle shown in the top right denotes the region of the East Pacific from which the samples were taken; black triangles indicate the locations of sampling stations within that region.
Fishes 07 00221 g001
Figure 2. Nonmetric Multidimensional Scaling (nMDS) ordination of fatty acid composition for large-, medium-, and small-sized groups: (A) nMDS plots for small-sized group, (B) nMDS plots for medium-sized group, and (C) nMDS plots for large-sized group.
Fishes 07 00221 g002
Figure 3. Principal component analysis (PCA) of large-, medium-, and small-sized groups. (A) PCA plots for three-sized group, and (B) FA niche breadth of three-sized group.
Fishes 07 00221 g003
Table 1. Summary of samples of D. gigas off the Peruvian EEZ.
GroupsSexSample Size/NMantle Length/mm
Mean ± SDMinMax
Small-sizedMale15233.25 ± 17.82214248
Female11282.63 ± 17.90236296
Total26253.37 ± 30.20214296
Medium-sizedMale17315.18 ± 49.91259413
Female26448.35 ± 77.25303570
Total43391.63 ± 90.44259570
Large-sizedMale27732.89 ± 107.12539845
Female12737.25 ± 131.29593864
Total39734.23 ± 113.27539864
Mantle lengths are expressed as mean values ± standard deviation (SD).
Table 2. Signature fatty acids and corresponding sources.
SourcesReferences
C18:1n9Zooplankton[39]
C16:1n7Diatom[21,41]
C18:2n6 + C18:3n3Terrestrial organic[19]
C22:6n3Dinoflagellate[21]
C20:4n6Zoobenthos[20]
C20:1n9Copepod[41,42]
C20:5n-3/C22:6n-3 < 1Dinoflagellate[43]
Table 3. Comparisons of fatty acids profile of Dosidicus gigas among three groups and both sexes (two-way PERMANOVA analysis based on Bray–Curtis similarity measure).
dfF-ValueR2p-Value
Group231.9890.360.001
Sex15.2110.0290.003
Group × Sex23.3180.0370.013
Residuals102-0.574-
Total107-1-
Degree of freedom (df). Level of statistical significance (p-value).
Table 4. Fatty acid profiles of females and males in each group.
Fatty Acid AcidsSmall-Sized GroupMedium-Sized GroupLarge-Sized Group
Male/%Female/%p-ValueMale/%Female/%p-ValueMale/%Female/%p-Value
C14:01.26 ± 0.151.24 ± 0.200.6281.26 ± 0.141.22 ± 0.190.3871.32 ± 0.251.20 ± 0.080.116
C15:01.11 ± 0.181.11 ± 0.210.7781.07 ± 0.121.08 ± 0.200.9991.20 ± 0.301.04 ± 0.120.059
C16:021.16 ± 0.9021.75 ± 1.000.24221.44 ± 1.5420.57 ± 1.560.08218.17 ± 1.5517.96 ± 0.880.757
C17:01.48 ± 0.171.49 ± 0.180.6131.42 ± 0.111.47 ± 0.180.3811.54 ± 0.271.43 ± 0.100.182
C18:06.85 ± 0.457.71 ± 0.880.0567.94 ± 1.287.36 ± 1.270.1237.73 ± 0.567.82 ± 0.690.709
C20:00.84 ± 0.200.92 ± 0.220.2560.86 ± 0.130.89 ± 0.230.7541.09 ± 0.300.92 ± 0.130.052
C21:00.80 ± 0.190.88 ± 0.220.2730.82 ± 0.130.85 ± 0.220.7881.04 ± 0.300.87 ± 0.130.051
C22:00.75 ± 0.180.81 ± 0.200.2790.76 ± 0.120.78 ± 0.200.7940.96 ± 0.280.81 ± 0.120.051
C23:00.81 ± 0.200.89 ± 0.220.2720.83 ± 0.130.86 ± 0.230.7831.01 ± 0.220.89 ± 0.130.602
C24:00.84 ± 0.200.92 ± 0.230.2750.86 ± 0.140.89 ± 0.230.7811.09 ± 0.320.92 ± 0.140.051
ΣSFA35.91 ± 2.8237.73 ± 3.550.001 **37.27 ± 3.8535.96 ± 4.520.001 **35.14 ± 4.3533.87 ± 2.520.001 **
C14:1n50.63 ± 0.150.68 ± 0.170.2800.64 ± 0.100.66 ± 0.180.4390.81 ± 0.240.68 ± 0.100.052
C15:1n50.69 ± 0.170.75 ± 0.190.2720.71 ± 0.110.70 ± 0.130.8630.88 ± 0.260.75 ± 0.110.616
C16:1n70.74 ± 0.150.79 ± 0.180.3580.74 ± 0.100.75 ± 0.170.8810.90 ± 0.240.77 ± 0.100.056
C17:1n70.69 ± 0.160.76 ± 0.190.2750.69 ± 0.080.72 ± 0.190.0710.91 ± 0.290.76 ± 0.130.429
C18:1n92.15 ± 0.282.37 ± 0.170.015 *2.13 ± 0.282.17 ± 0.290.6342.19 ± 0.482.03 ± 0.190.260
C20:1n94.93 ± 0.395.52 ± 0.790.0865.32 ± 0.836.72 ± 0.0.800.001 **7.44 ± 0.978.38 ± 0.790.007 **
C22:1n90.64 ± 0.140.70 ± 0.160.2740.66 ± 0.100.69 ± 0.170.4770.84 ± 0.220.74 ± 0.090.097
C24:1n90.70 ± 0.170.76 ± 0.180.3800.71 ± 0.110.74 ± 0.190.5810.89 ± 0.250.76 ± 0.100.607
ΣMUFA11.18 ± 1.6112.34 ± 2.040.001 **11.58 ± 1.7213.16 ± 2.100.00114.85 ± 2.9514.87 ± 1.630.662
C18:2n61.33 ± 0.251.30 ± 0.380.5471.31 ± 0.321.28 ± 0.510.5731.27 ± 0.541.37 ± 0.380.395
C18:3n60.66 ± 0.090.72 ± 0.150.2930.74 ± 0.140.69 ± 0.250.1550.90 ± 0.200.79 ± 0.110.732
C18:3n30.74 ± 0.180.81 ± 0.200.2770.75 ± 0.120.74 ± 0.140.2480.95 ± 0.280.80 ± 0.120.051
C20:20.76 ± 0.150.79 ± 0.180.5120.74 ± 0.100.78 ± 0.170.4910.92 ± 0.240.80 ± 0.090.064
C20:3n60.70 ± 0.180.79 ± 0.230.3720.70 ± 0.080.71 ± 0.120.7780.86 ± 0.140.72 ± 0.090.208
C20:3n31.10 ± 0.311.14 ± 0.360.6601.14 ± 0.321.52 ± 0.440.004 **1.36 ± 0.331.47 ± 0.320.313
C20:4n61.33 ± 0.231.32 ± 0.260.9971.11 ± 0.301.81 ± 0.540.001 **1.50 ± 0.251.68 ± 0.400.129
C22:2n62.59 ± 0.302.64 ± 0.090.5132.56 ± 0.162.56 ± 0.260.9953.07 ± 0.313.07 ± 0.280.965
C20:5n37.79 ± 0.567.34 ± 0.310.021 *7.33 ± 0.517.58 ± 0.540.1359.05 ± 1.009.46 ± 1.070.264
C22:6n336.22 ± 2.0833.65 ± 2.650.033 *35.27 ± 1.6533.58 ± 2.800.039 *30.88 ± 3.4831.85 ± 0.390.329
ΣPUFA53.23 ± 4.3250.49 ± 4.810.001 **51.66 ± 3.7051.26 ± 5.750.12650.77 ± 6.7752.01 ± 4.230.001 **
Mean values ± standard deviation (SD). SFA: Saturated Fatty Acid, MUFA: Monounsaturated Fatty Acid, PUFA: Polyunsaturated Fatty Acids. Statistical significance at * p < 0.05 and ** p < 0.01 is shown.
Table 5. PERMANOVA of the fatty acid composition of male and female individuals.
GroupsTermsF-Valuep-Value
Small-sized groupMale vs. Female6.200.004 **
Medium-sized groupMale vs. Female6.570.001 **
Large-sized groupMale vs. Female1.440.224
Degree of freedom (df). Statistical significance at ** p < 0.01 is shown.
Table 6. Fatty acid composition of small-, medium-, and large-sized groups.
Small-Sized Group/%Medium-Sized Group/%Large-Sized Group/%F-Valuep-Value
C14:01.25 ± 0.171.23 ± 0.171.28 ± 0.220.7520.474
C15:01.11 ± 0.191.08 ± 0.171.15 ± 0.261.0690.347
C16:021.43 ± 0.9920.9 ± 0.1718.10 ± 1.3758.5610.001 **
C17:01.48 ± 0.171.45 ± 0.161.51 ± 0.230.8310.439
C18:07.25 ± 0.807.59 ± 1.297.76 ± 0.592.5360.084
C20:00.87 ± 0.210.88 ± 0.191.04 ± 0.278.3140.001 **
C21:00.84 ± 0.210.84 ± 0.190.99 ± 0.277.4030.001 **
C22:00.77 ± 0.190.78 ± 0.170.92 ± 0.257.6310.001 **
C23:00.85 ± 0.210.85 ± 0.190.94 ± 0.250.3790.686
C24:00.88 ± 0.220.88 ± 0.201.04 ± 0.287.4090.001 **
ΣSFA36.73 ± 3.3736.48 ± 4.3434.72 ± 4.0115.8610.001**
C14:1n50.65 ± 0.160.63 ± 0.180.77 ± 0.211.2580.288
C15:1n50.72 ± 0.180.65 ± 0.210.82 ± 0.261.3160.273
C16:1n70.76 ± 0.160.75 ± 0.150.86 ± 0.225.1470.007 **
C17:1n70.69 ± 0.230.68 ± 0.220.58 ± 0.478.7430.236
C18:1n92.25 ± 0.422.15 ± 0.362.14 ± 0.441.3110.274
C20:1n95.20 ± 0.676.17 ± 1.067.73 ± 1.0154.2250.001 **
C22:1n90.67 ± 0.150.68 ± 0.140.81 ± 0.2011.0150.001 **
C24:1n90.70 ± 0.220.73 ± 0.160.83 ± 0.260.6520.523
ΣMUFA11.64 ± 2.2012.44 ± 2.4814.53 ± 3.0618.3420.001 **
C18:2n61.31 ± 0.521.30 ± 0.561.30 ± 0.690.1110.895
C18:3n60.47 ± 0.340.51 ± 0.370.69 ± 0.390.6580.127
C18:3n30.77 ± 0.190.71 ± 0.200.90 ± 0.252.1060.520
C20:20.77 ± 0.160.77 ± 0.150.89 ± 0.227.0080.001 **
C20:3n60.63 ± 0.330.61 ± 0.270.59 ± 0.401.4220.246
C20:3n31.12 ± 0.331.37 ± 0.431.40 ± 0.335.7210.004 **
C20:4n61.34 ± 0.241.54 ± 0.571.57 ± 0.312.2980.025 *
C22:2n62.61 ± 0.232.56 ± 0.223.07 ± 0.2940.7490.001 **
C20:5n37.60 ± 0.527.48 ± 0.539.18 ± 1.0262.8750.001 **
C22:6n335.02 ± 2.6734.25 ± 2.5331.18 ± 3.0116.6840.001 **
ΣPUFA51.64 ± 5.5351.08 ± 5.8350.75 ± 6.9014.4430.008 **
Mean values ± standard deviation (SD). SFA: Saturated Fatty Acid, MUFA: Monounsaturated Fatty Acid, PUFA: Polyunsaturated Fatty Acids. Statistical significance at * p < 0.05 and ** p < 0.01 is shown.
Table 7. Main component loading coefficients of fatty acid composition.
Fatty AcidPC1PC2
C14:00.34−0.36
C16:0−0.42−0.21
C17:00.37−0.35
C18:0−0.040.14
C18:1n90.28−0.41
C18:2n60.19−0.13
C20:1n90.210.48
C20:4n60.130.11
C22:2n60.370.25
C20:5n30.260.44
C22:6n3−0.430.03
Table 8. PERMANOVA of the fatty acid composition of the three groups.
GroupdfDistanceF-Valuep-Value
Small/Medium1Bray-Curtis1.350.264
Small/Large1Bray-Curtis7.230.001 **
Medium/Large1Bray-Curtis6.960.001 **
Degree of freedom (df). Statistical significance at ** p < 0.01 is shown.
Table 9. Percent fatty acid niche overlap (confidence intervals) for different groups collected off the Peruvian EEZ.
GroupsNiche LevelsSmall-Sized GroupMedium-Sized GroupLarge-Sized Group
Small-sized group2.79100%--
Medium-sized group5.2632.16%100%-
Large-sized group11.800100%
Publisher’s Note: MDPI stays neutral with regard to jurisdictional claims in published maps and institutional affiliations.

