Article

Reduced Hypoxia Tolerance and Altered Gill Morphology at Elevated Temperatures May Limit the Survival of Tilapia (GIFT, Oreochromis niloticus) under Global Warming

1
Key Laboratory of Exploration and Utilization of Aquatic Genetic Resources, Ministry of Education, Shanghai Ocean University, Shanghai 201306, China
2
International Research Center for Marine Biosciences, Ministry of Science and Technology, Shanghai Ocean University, Shanghai 201306, China
3
College of Fisheries and Life Science, Shanghai Ocean University, Shanghai 201306, China
4
College of Marine Sciences, Shanghai Ocean University, Shanghai 201306, China
5
Key Laboratory of Sustainable Exploitation of Oceanic Fisheries Resources, Ministry of Education, Shanghai Ocean University, Shanghai 201306, China
6
Laboratory for Marine Biology and Biotechnology, Qingdao National Laboratory for Marine Science and Technology, Qingdao 266237, China
*
Author to whom correspondence should be addressed.
These authors contributed equally to this work.
Fishes 2022, 7(5), 216; https://doi.org/10.3390/fishes7050216
Submission received: 15 July 2022 / Revised: 10 August 2022 / Accepted: 19 August 2022 / Published: 24 August 2022

Abstract

:
Nile tilapia (Oreochromis niloticus) is one of the most important food fishes in global aquaculture. The optimal rearing temperature for Nile tilapia is 27–30 °C; however, in some Asian breeding areas, such as south China, water temperatures in summer frequently exceed 35 °C for several days. Potential effects of long-term exposure to high temperatures on the survival and metabolism of tilapia are unclear. In this study, genetically improved farmed tilapia, age six weeks, were exposed to water temperatures of 28, 32, and 36 °C for 15 weeks. Mean survival rates and tolerance to hypoxia were significantly reduced, and respiratory rates were increased in fish reared at 36 °C, compared to the 28 and 32 °C treatments (p < 0.05). Partial temperature compensation for routine metabolic rates was observed after 15 weeks at 36 °C. Gill morphology changes in the 36 °C treatment included curling of the lamellae and hyperplasia of the filament end, which became more pronounced after acute hypoxia (0.2 mg/L O2). Transcriptomics demonstrated that expression of numerous genes related to aerobic metabolism was altered in the 36 °C treatment, including down-regulation of nine genes of the tricarboxylic acid cycle. In summary, high temperature affected tilapia gill morphology, reduced hypoxia tolerance, and inhibited aerobic metabolism, thus ultimately threatening tilapia viability and survival.

Graphical Abstract

1. Introduction

Nile tilapia (Oreochromis niloticus) belong to the family Cichlidae and are native to Africa. Globally, these fishes are one of the most important aquaculture species. In 2020, the global production of tilapia was 6.9 million tons, second only to carp [1]. The optimal growing temperature for Nile tilapia in a controlled environment is approximately 27–30 °C [2]. However, in many Asian breeding areas, such as southern China, the Philippines, Vietnam, and Thailand, water temperatures in summer frequently exceed 35 °C for several days [3]. Due to ongoing global warming, the number of high-temperature days is likely to increase further, thus the effects of long-term exposure to high temperatures on the metabolism and survival of tilapia are a major concern.
Temperature determines habitat suitability and directly affects metabolic rates of aquatic organisms [4]. In most fish, respiratory rates may double per 10 °C increase in temperature [5], and accelerated respiration under high temperatures increases the consumption of oxygen. However, extended periods of high oxygen consumption are detrimental to animals [6,7]; this is particularly problematic for aquatic animals, as an increase in water temperature reduces the concentration of dissolved oxygen (DO) in the water, and subsequently, accelerated respiratory rates lead to increased oxygen consumption [6,8,9]. Such an imbalance of oxygen demand and supply affects the organism’s performance, including growth [10] and reproduction [11].
Heat exposure prior to a high temperature challenge can change thermal performance, including oxygen consumption under acute temperature increases [12]. The metabolic capacity of animals can be adjusted to compensate for the effects of changes in ambient temperature, and metabolic compensation is important for animals to adapt to environmental temperature changes [13,14,15,16,17]. A study on European perch (Perca fluviatilis, L.) living in waters near a nuclear power plant demonstrated that the routine metabolic rate (RMR) was partially compensated during warm acclimation (i.e., a decrease below the rate observed after acute warming). Due to the discharge of cooling water from the nuclear power plant, the water temperature in this area was, on average, 5–10 °C higher than the temperature of adjacent waters, and after more than three decades of adaptation, European perch living in these warm waters had a lower RMR compared to that of controls treated with acute warming [18]. However, the cellular and molecular mechanisms underlying this reduced thermal compensation are unclear. The theory of oxygen- and capacity-limited thermal tolerance (OCLTT) suggests that species-specific thermal parameters are determined by their limitations of aerobic metabolism [9,19]. This theory is mainly based on a series of physiological evidence, such as respiratory metabolic rates [20], cardiac output, and blood pressure changes [21,22,23]; however, the respective cellular and molecular mechanisms remain unclear.
The tolerance of sensitive tissues to extreme temperatures determines the overall thermal tolerance limit of an entire organism; this may remind readers of the Cannikin Law, according to which the shortest stave determines the capacity of a wooden bucket. A study on apoptotic tissues in zebrafish (Danio rerio), tilapia, and grass carp (Ctenopharyngodon idella) exposed to extreme high and low temperatures found that the gill tissue was first apoptotic at 12 °C in cold-sensitive zebrafish and tilapia, followed by the kidney, brain, and other tissues, whereas in cold-resistant grass carp, almost no apoptosis occurred in the gills at 12 °C [24,25]. This indicates that gill tissue is most sensitive to extreme temperatures in intermediate- or narrow-temperature adaptation fishes, such as zebrafish and tilapia. Studying the morphological and gene expression changes of gill tissue in response to temperature changes will help reveal the cellular and molecular basis of the upper limit theory of oxygen and heat tolerance.
The genetically improved farmed tilapia (GIFT) strain was established by a non-commercial breeding program of WorldFish [26]. The objective of the current study was to determine the effects of long-term exposure to high temperatures on routine metabolism rates, hypoxia tolerance, overall survival, gill histomorphology, and gene expression in GIFT, so as to further elucidate the cellular and molecular mechanisms underlying such physiological changes.

2. Materials and Methods

2.1. Ethics

All animal experiments were conducted in accordance with the guidelines of The Scientific Ethic Committee of the Shanghai Ocean University, Shanghai, China (approval number SHOU-DW-20210118).

2.2. Fish Stock and Rearing Conditions

GIFT germplasm parents were procured from the Guangxi Fisheries Institute (Nanning, Guangxi, China) in 2018 and were reared indoors in rectangular glass tanks at the Laboratory of Exploration and Utilization of Aquatic Genetic, Shanghai Ocean University. After one year, one male and one female fish were selected to generate an F1 generation. Before the experiment, 400 F1 larvae were placed in 144-L containers and were fed a commercial diet for six weeks for adaption to the culture conditions. During the adaptation phase, water temperature was maintained at 28 ± 1.0 °C and pH at 7.32–7.60. DO was maintained at approximately 4.5 ± 0.38 mg/L. After acclimation, 270 size-matched fish were assigned to three independent recirculating systems, with temperatures at 28, 32, and 36 °C, respectively. For each temperature treatment, three 72 L water tanks with 30 fish in each were used. The initial body weights (±standard deviation) in the three temperature treatments were 0.146 ± 0.037 g (28 °C), 0.146 ± 0.034 g (32 °C), and 0.146 ± 0.024 g (36 °C). Fish were fed commercial floating pellets until satiation, twice per day for 15 weeks (Table 1). DO levels were maintained by constant aeration. Waste was siphoned from the tanks as needed. At the end of the experimental treatments, fish from each tank were weighed. The final body weight in the 28, 32, and 36 °C treatments were 101.9 ± 10.0, 102.3 ± 12.2, and 95.88 ± 10.1 g, respectively. Blood samples were collected immediately. Heparinized syringes were used for blood collection, and 50 µL whole blood was taken from each sampled fish. The blood was then diluted to 1/500 using PBS (pH 7.4, 10 mM), and 20 µL of the diluted blood was placed on a cell counting plate to determine the number of red cells using a light microscope at 40-fold magnification. Hemoglobin was measured using a commercial biochemical kit (Nanjing Jiancheng Bioengineering Institute, Nanjing, China). For red cell counting and hemoglobin measuring, each temperature treatment was conducted using three independent replicates, with five fish per replicates (n = 15). Gill samples were stored at −80 °C until use.

2.3. Respiratory Metabolism Experiment

Ventilatory frequency was measured according to the frequency of opercular beats. The mean body weights of fish in which ventilatory frequency was tested were 100.8 ± 5.6, 101.7 ± 6.0, and 95.9 ± 4.1 g in the 28, 32, and 36 °C treatments, respectively. The RMR is the average oxygen consumption rate allowing only random activity under still water flow [7]. We measured the RMR in the three treatments using a 30-L acrylic respirometer (n = 15, Loligo Systems, Viborg, Denmark). The respirometer comprised a working box of 14 × 46 × 14 cm (width × length × depth). Fish were weighed, and size-matched fish of the three temperature treatments were selected. The average weights of fish in the three treatments were 102.4 ± 3.3, 101.8 ± 5.4, and 96.4 ± 3.7 g, respectively. Before each experiment, the respirometer was equilibrized at controlled temperatures (28.6 ± 0.2, 30.3 ± 0.1, 32.4 ± 0.1, 34.4 ± 0.2, and 36.1 ± 0.2 °C). Five fish were placed in the respirometer overnight to allow for adaption for 15 h. Thereafter, the respirometer was sealed, and oxygen consumption was measured. The fish were allowed to swim freely in the respirometer. For each oxygen measurement cycle, 180 s flush, 60 s balance, and 660 s measurement periods were used. Oxygen consumption was recorded for at least 18 cycles and was calculated (in mg kg−1h−1) using the soft well AutoResp (Loligo Systems). After the end of each trial, the fish were removed from the respirometer and were returned to their respective treatment tanks. Each temperature treatment was performed using three biological replicates.

2.4. Acute Hypoxia Trial

For hypoxia treatment, the aeration of each of the three 72-L tanks maintained at 28, 32, and 36 °C were interrupted, and nitrogen gas was pumped into the water. DO concentrations were measured using a portable DO meter (YSI Pro20, Yellow Springs, Ohio, USA). Nitrogen gas was bubbled into water to a DO concentration of 0.2 mg/L. The tank was then covered with bubble wrap to prevent oxygen diffusion from the air. For each temperature treatment, fifteen fish were taken from the normoxic tanks and were placed in the hypoxic tanks, using three independent replicates (n = 5 per repeat). The body weights of fish from the three treatments were 99.9 ± 7.2, 101.9 ± 9.1, and 91.7 ± 5.7 g, respectively. The time was recorded from transfer to the hypoxic tanks until the losing of equilibrium (LOE). Acute hypoxic tolerance was assessed by measuring the LOE time. At the LOE, fish were removed and killed. Gills of three fish from each tank were sampled as biological replicates and were stored at −80 °C until use.

2.5. Histological Analysis

Samples from the three temperature treatments were collected at the end of the trial. Before sampling, fish were anesthetized using 0.05% 3-aminobenzoic acid ethyl ester methanesulfonate (MS-222). The first gill containing arch was cut into small pieces and was immediately placed in 4% paraformaldehyde for 24 h. The fixed gills were dehydrated in ascending concentrations of ethanol, made transparent using xylene, and were immersed in paraffin solution. Embedded paraffin blocks were sectioned sagittally (8 µm thickness). The paraffin tape was placed on the glass slides and spread in water at 37 °C and was then dried at 50 °C. The slices were de-waxed using xylene, rehydrated in descending concentrations of ethanol, and were stained using hematoxylin-eosin. Stained slices were examined and photographed using a microscope device Axio Imager2 (Zeiss, Oberkochen, German).

2.6. Transcriptome Analysis

After the three temperature experiment, fish were anesthetized by 0.05% MS-222, and equal amounts of gill tissue were taken from three fish and pooled as one biological replicate. Each temperature treatment was conducted using three biological replicates. Total RNA was extracted from the gill tissue using a TRIzol Reagent, according to the manufacturer’s protocol (Invitrogen, Carlsbad, CA, USA). A Bioanalyzer Chip RNA 7500 series II device (Agilent, Santa Clara, CA, USA) was used to assess RNA quality, and RIN ≥ 7 was considered qualified. A NEBNext UltraTM RNA Library Prep Kit (New England Biolabs, Ipswitch, MA, USA) was used to construct mRNA-Seq libraries for sequencing on an Illumina Novaseq 6000 platform (Illumina, San Diego, CA, USA).
Clean reads were mapped to a tilapia reference genome using HISAT v. 2.0.4 with default settings [27]. The software Cufflinks (v. 2.2.1, Cole Trapnell, ML, USA, http://cufflinks.cbcb.umd.edu/ (accessed on 13 July 2022)) was used for normalizing gene expressions to the quantified transcription levels [28]. Differently expressed genes (DEGs) were identified using the package edgeR [29] in R software (v. 2.13.0., Mark D. Robinson, Darlinghurst, AUS, http://bioconductor.org (accessed on 13 July 2022)). KOBAS 2.1.1 (http://kobas.cbi.pku.edu.cn/home.do, accessed on 8 April 2022) was used to identify DEGs in KEGG pathways using |log2FC| ≥ 1 as the cut-off according to Fisher’s exact test, with P-values adjusted through Benjamini–Hochberg multiple testing correction [30]. Gene functions were annotated using the NCBI non-redundant protein sequence database (Nr), NCBI non-redundant nucleotide sequence database (Nt), Pfam (Protein family), KOG/COG (Clusters of Orthologous Groups of proteins), Swiss-Prot (a manually annotated and reviewed protein sequence database), KO (KEGG Ortholog database), and Gene Ontology (GO). Raw sequence data were submitted to the NCBI sequence read archive under project number PRJNA808671.

2.7. Reverse-Transcription Quantitative Real-Time PCR (RT-qPCR)

Total RNA were extracted as described above, and 1 μg RNA was used for reverse transcription using an M-MLV Reverse Transcriptase (Invitrogen) with gDNA removal using DNase I (RNase-free) (NEB). RT-qPCR analysis was performed using a LightCycler® 480 Probe Master reaction mix (Roche, Basel, Switzerland) and the Roche LightCycler480 (Roche). PCR primers are listed in Table S1. Data from experiment triplicates were subjected to statistical analysis, and the target genes were normalized against the levels of actin beta (Actb) mRNA.

2.8. Statistical Analyses

All statistics were performed using R software (v. 2.13.0, Peter Dalgaard, Copenhagen, Denmark, https://www.r-project.org/, accessed on 14 July 2022). Statistical differences of ventilatory frequency, hypoxia tolerance, red blood cell number, and hemoglobin content among the three temperature treatments were compared by using nest analysis of variance (ANOVA), with the tank been taken as a random factor. For the routine metabolic rate, linear models were fitted to examine the regression of temperature and oxygen consumption in the three temperature treatments, and differences between regressions were compared by covariance analyses. Survival rates and curling rates were tested using a Chi-squared test. Histomorphology in gill and gene expression among the three temperature treatments under normoxia or hypoxia were compared by using one-way ANOVA. Before variance analyses, the normality and homogeneity of variance in the dataset were assessed. After significant differences were confirmed through ANOVA, multiple comparisons were made using Tukey’s HSD test. Statistical differences between normoxia and acute hypoxia within the same temperature treatment were tested using an independent samples t-test.

3. Results

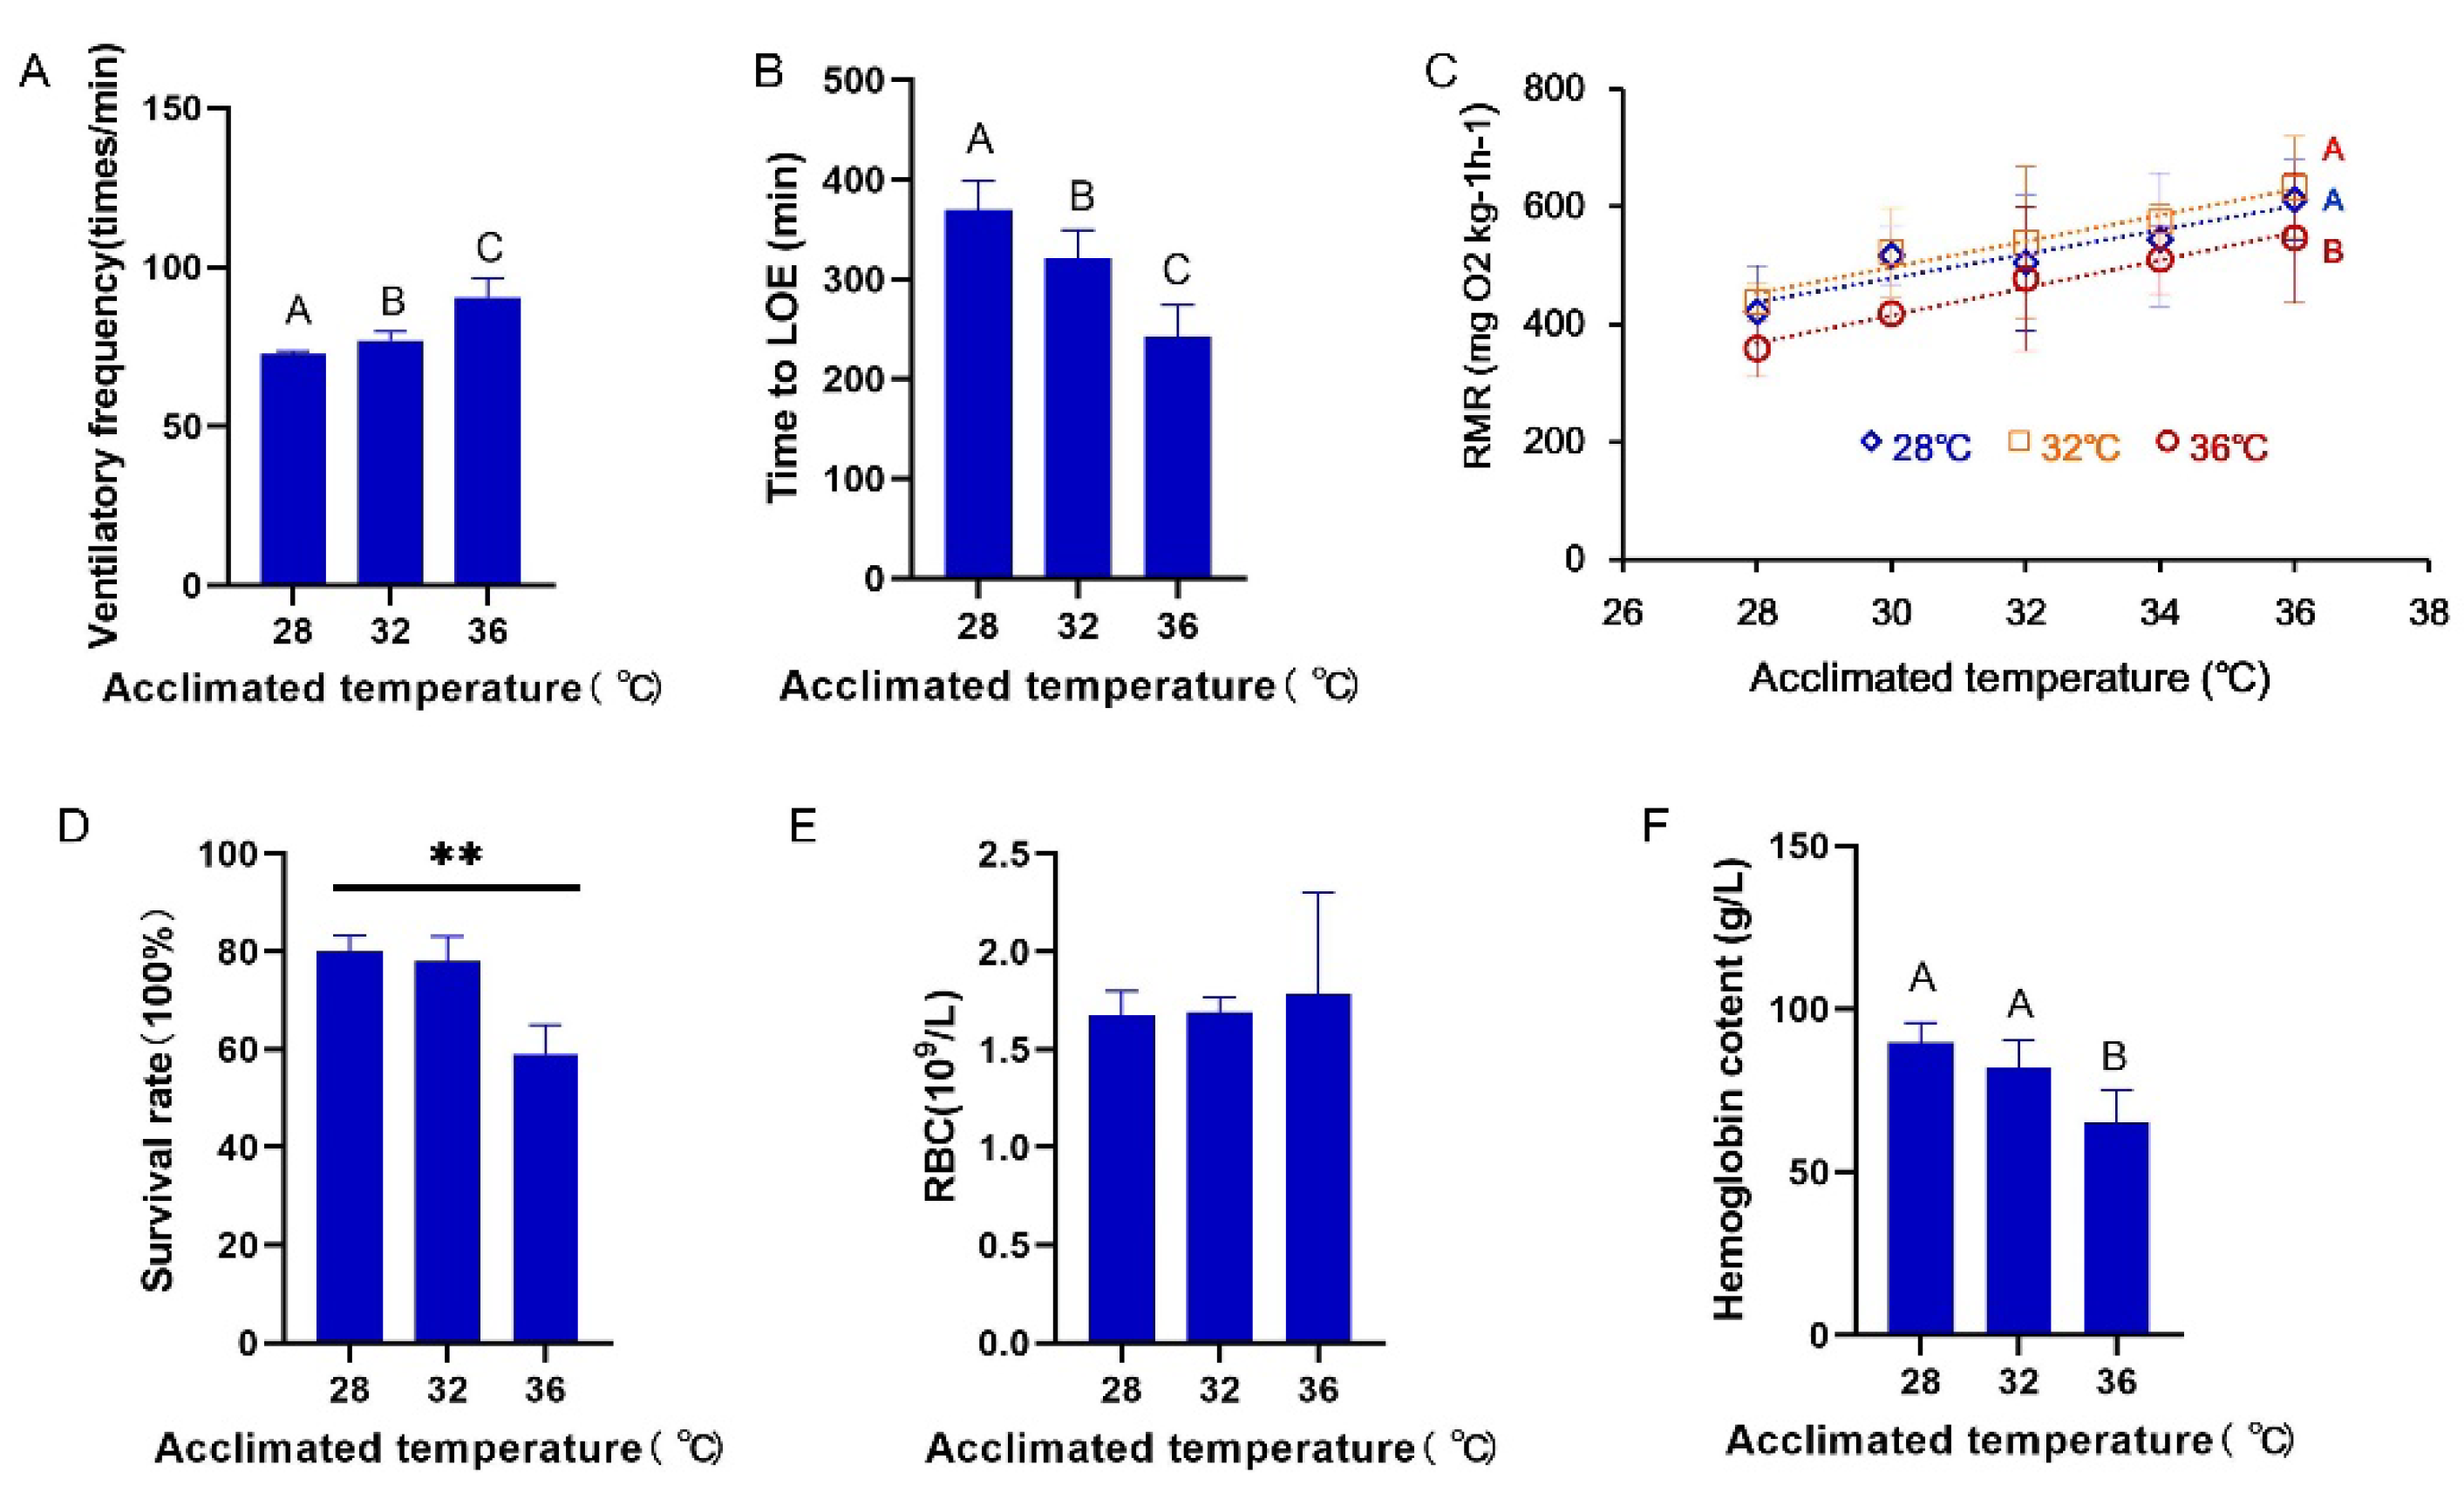
3.1. Ventilatory Frequency, Routine Metabolism, and Survival

Exposure to high temperatures (32 and 36 °C) induced a significant increase in ventilatory frequency, compared to the 28 °C treatment (F(2, 36) = 67.52, p = 6.58 × 10⁻¹³, nest-ANOVA; Figure 1A). Under hypoxia (0.2 mg/L), fish reared at 32 and 36 °C demonstrated a significant decrease in LOE time, compared with the 28 °C treatment (F(2, 36) = 92.45, p = 6.58 × 10⁻¹⁵, nest-ANOVA; Figure 1B). In addition, fish of the high-temperature treatment exhibited a partial compensation of RMR (Figure 1C). The rate-temperature curves displayed a parallel decline, and the RMR of fish kept at 36 °C was lower than that of fish in the 28 °C treatment, whereas no significant difference was observed between the 32 and 28 °C treatments (28 vs. 32 °C, F(1, 1) = 0.151, p = 0.698; 32 vs. 36 °C, F(1, 1) = 17.049, p = 7.12 × 10⁻⁵; 28 vs. 36 °C, F(1, 1) = 12.06, p = 7.57 × 10⁻⁴; covariance analyses on fitting linear model). This decrease in the RMR of fish kept at 36 °C was approximately 15% of that required to bring it to the level of fish kept at 28 °C. Survival also differed significantly between the three temperature groups. The survival rates of fish kept at 28, 32, and 36 °C were 80% ± 3%, 78% ± 5%, and 59% ± 6%, respectively. Survival was highest in the 28 °C group and lowest in the 36 °C group (χ2 (2) = 55.21, p = 1.03 × 10⁻¹², Chi-squared test; Figure 1D). Further, red blood cell (RBC) number and hemoglobin content in RBC were also assessed in each temperature treatment. A non-significant decrease in RBCs (F(2, 36) = 0.664, p = 0.521, nest-ANOVA; Figure 1E) and a significant decrease in hemoglobin (F(2, 36) = 32.91, p = 7.45 × 10⁻⁹, nest-ANOVA; Figure 1F) were observed from the 28 to the 36 °C treatment.

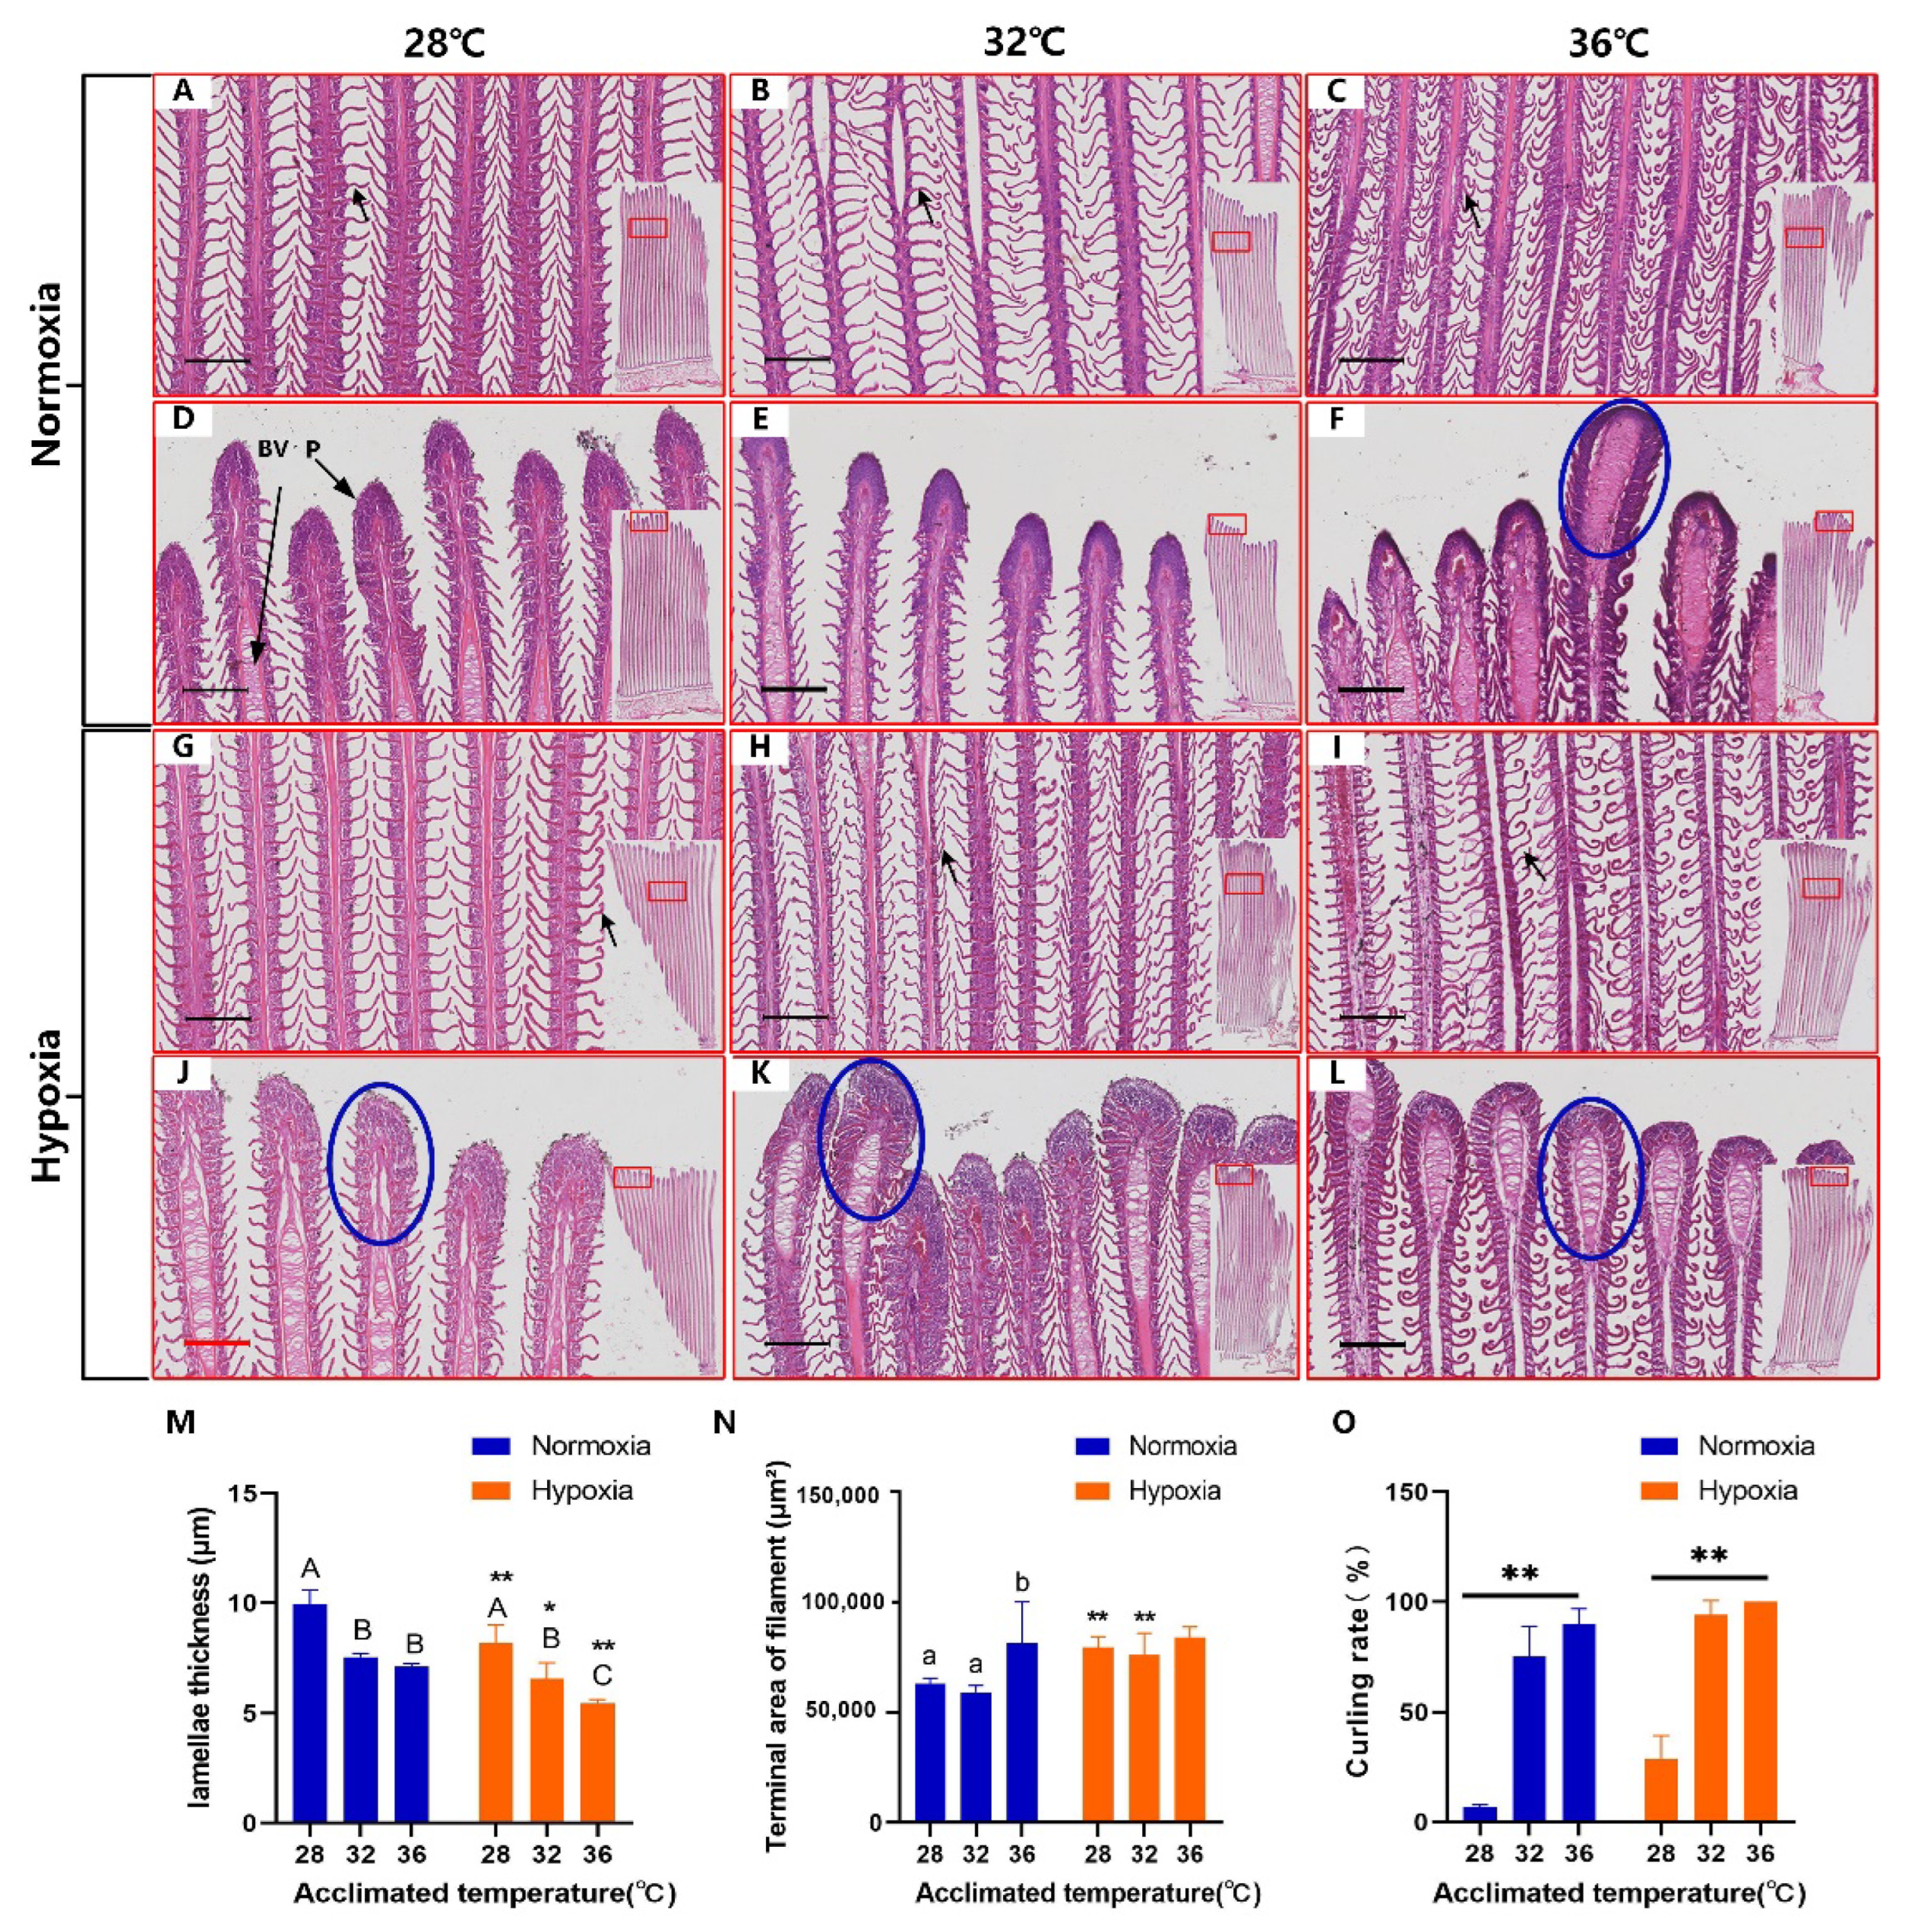
3.2. Gill Deformation in Response to High Temperatures

Fish kept at 28 °C under normoxia displayed normal gills (Figure 2A). The central part of the gill filaments was blood vessels, with a sinus blood cavity. The primary lamella was rounded at the top, while the secondary lamellae were markedly interspaced (Figure 2D). Morphological changes in the gill of 32 and 36 °C normoxia fish included curling (Figure 2B,C,H,I) and thinning of the lamellae (Figure 2M) and swelling of the terminal filament (Figure 2F,K,L). Curling and swelling was also observed at 28 °C under hypoxia (Figure 2G,J). Curling of the lamellae was significantly different between treated temperature at normoxia (χ2 (2) = 52.80, p = 3.42 × 10⁻¹², Chi-squared test; Figure 2O) as well as at hypoxia condition (χ2 (2) = 96.52, p = 2.20 × 10⁻¹⁶, Chi-squared test; Figure 2O).
The thinning of the lamellae also demonstrates a significant difference under normoxia (F (2, 12)= 78.28, p = 1.30 × 10⁻⁷, One-way ANOVA; Figure 2M) and hypoxia conditions (F(2, 12) = 23.58, p = 6.97 × 10⁻⁵, one-way ANOVA; Figure 2M). When comparing normoxia and acute hypoxia within the same temperature treatment, thinning of the lamellae was aggravated by hypoxia (28 °C, t(8) = 3.84, p = 0.0049; 32 °C, t(8) = 2.95, p = 0.0184; 36 °C, t(8)= 17.93, p = 9.59 × 10⁻⁸; t-test, Figure 2M).
The terminal gill filaments were significantly expanded at the 36 °C treatment under normoxia (F(2, 12) = 6.099, p = 0.0149, One-way ANOVA, Figure 2D–F,N). However, in hypoxia, this expansion was not different between temperature treatment (F(2, 12) = 1.68, p = 0.228, One-way ANOVA, Figure 2J–L,N). When comparing terminal expansion in normoxia and acute hypoxia within the same temperature treatment, significant differences were observed at 28 °C (t(8) = −6.67, P = 1.58 × 10⁻⁴, t-test, Figure 2N) and 32 °C (t(8) = −3.66, p = 6.42 × 10⁻³, t-test, Figure 2N), but not at 36 °C (t(8) = −0.292, p = 0.777, t-test, Figure 2N).

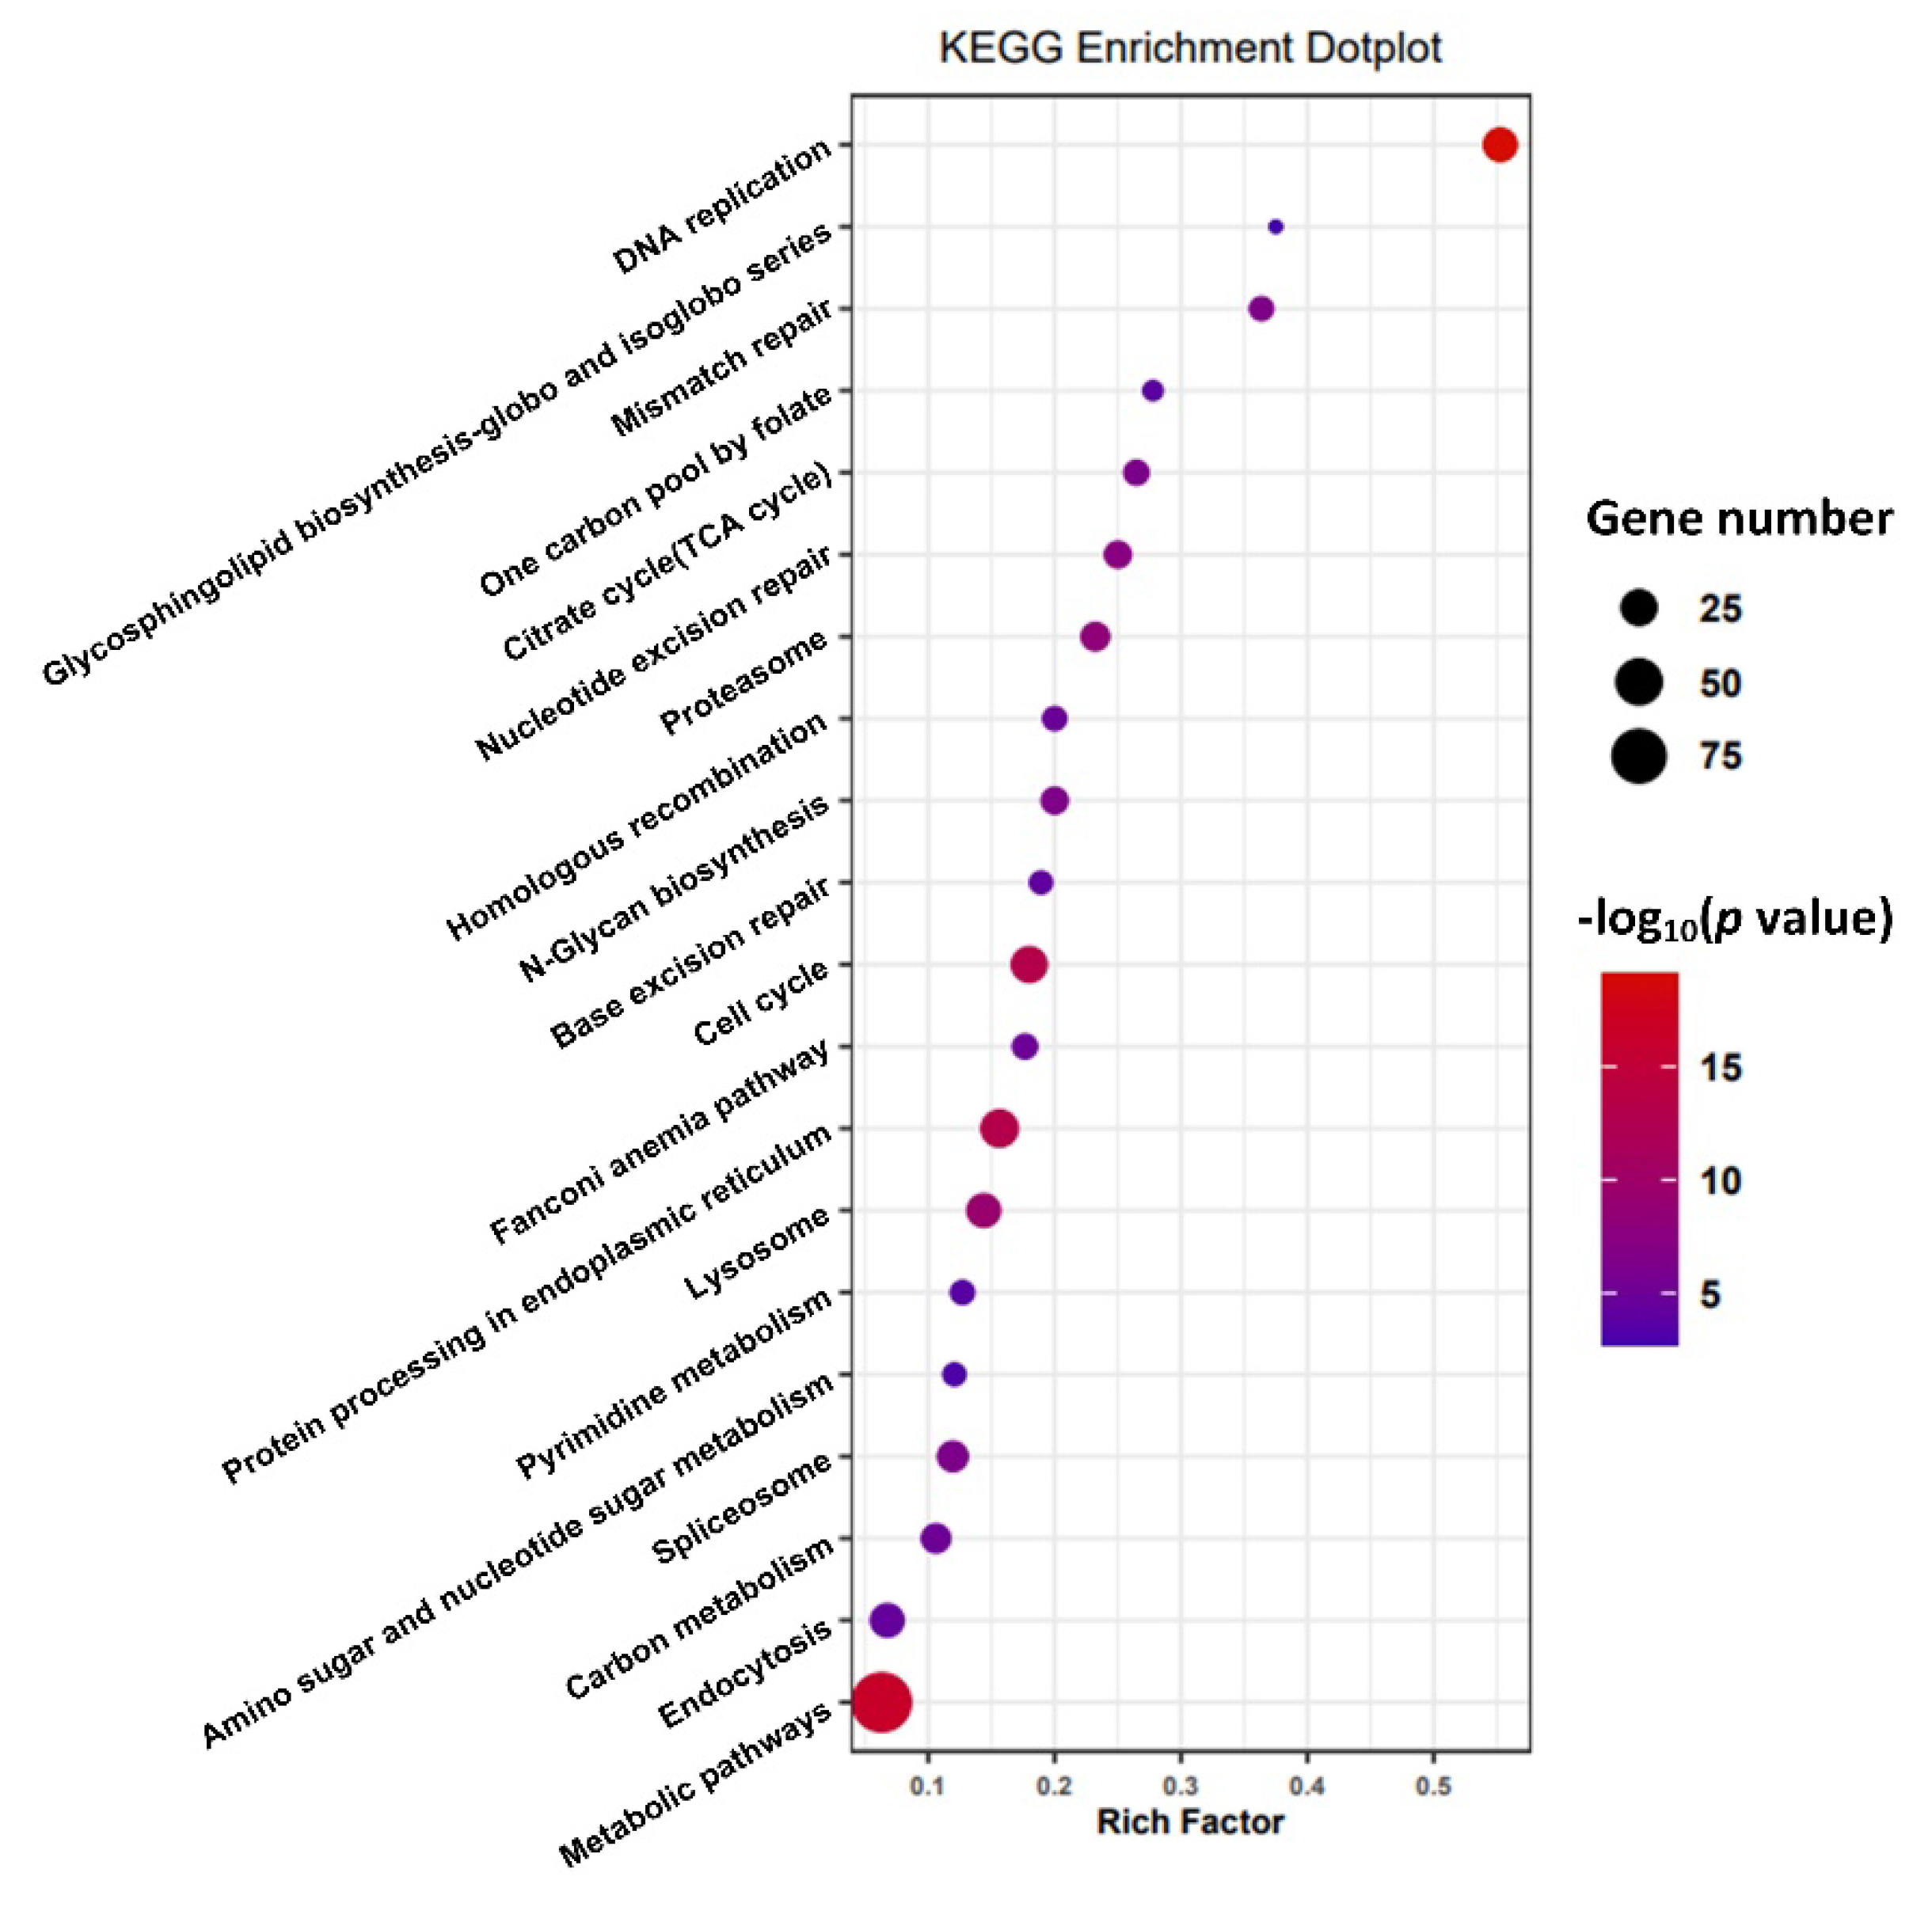
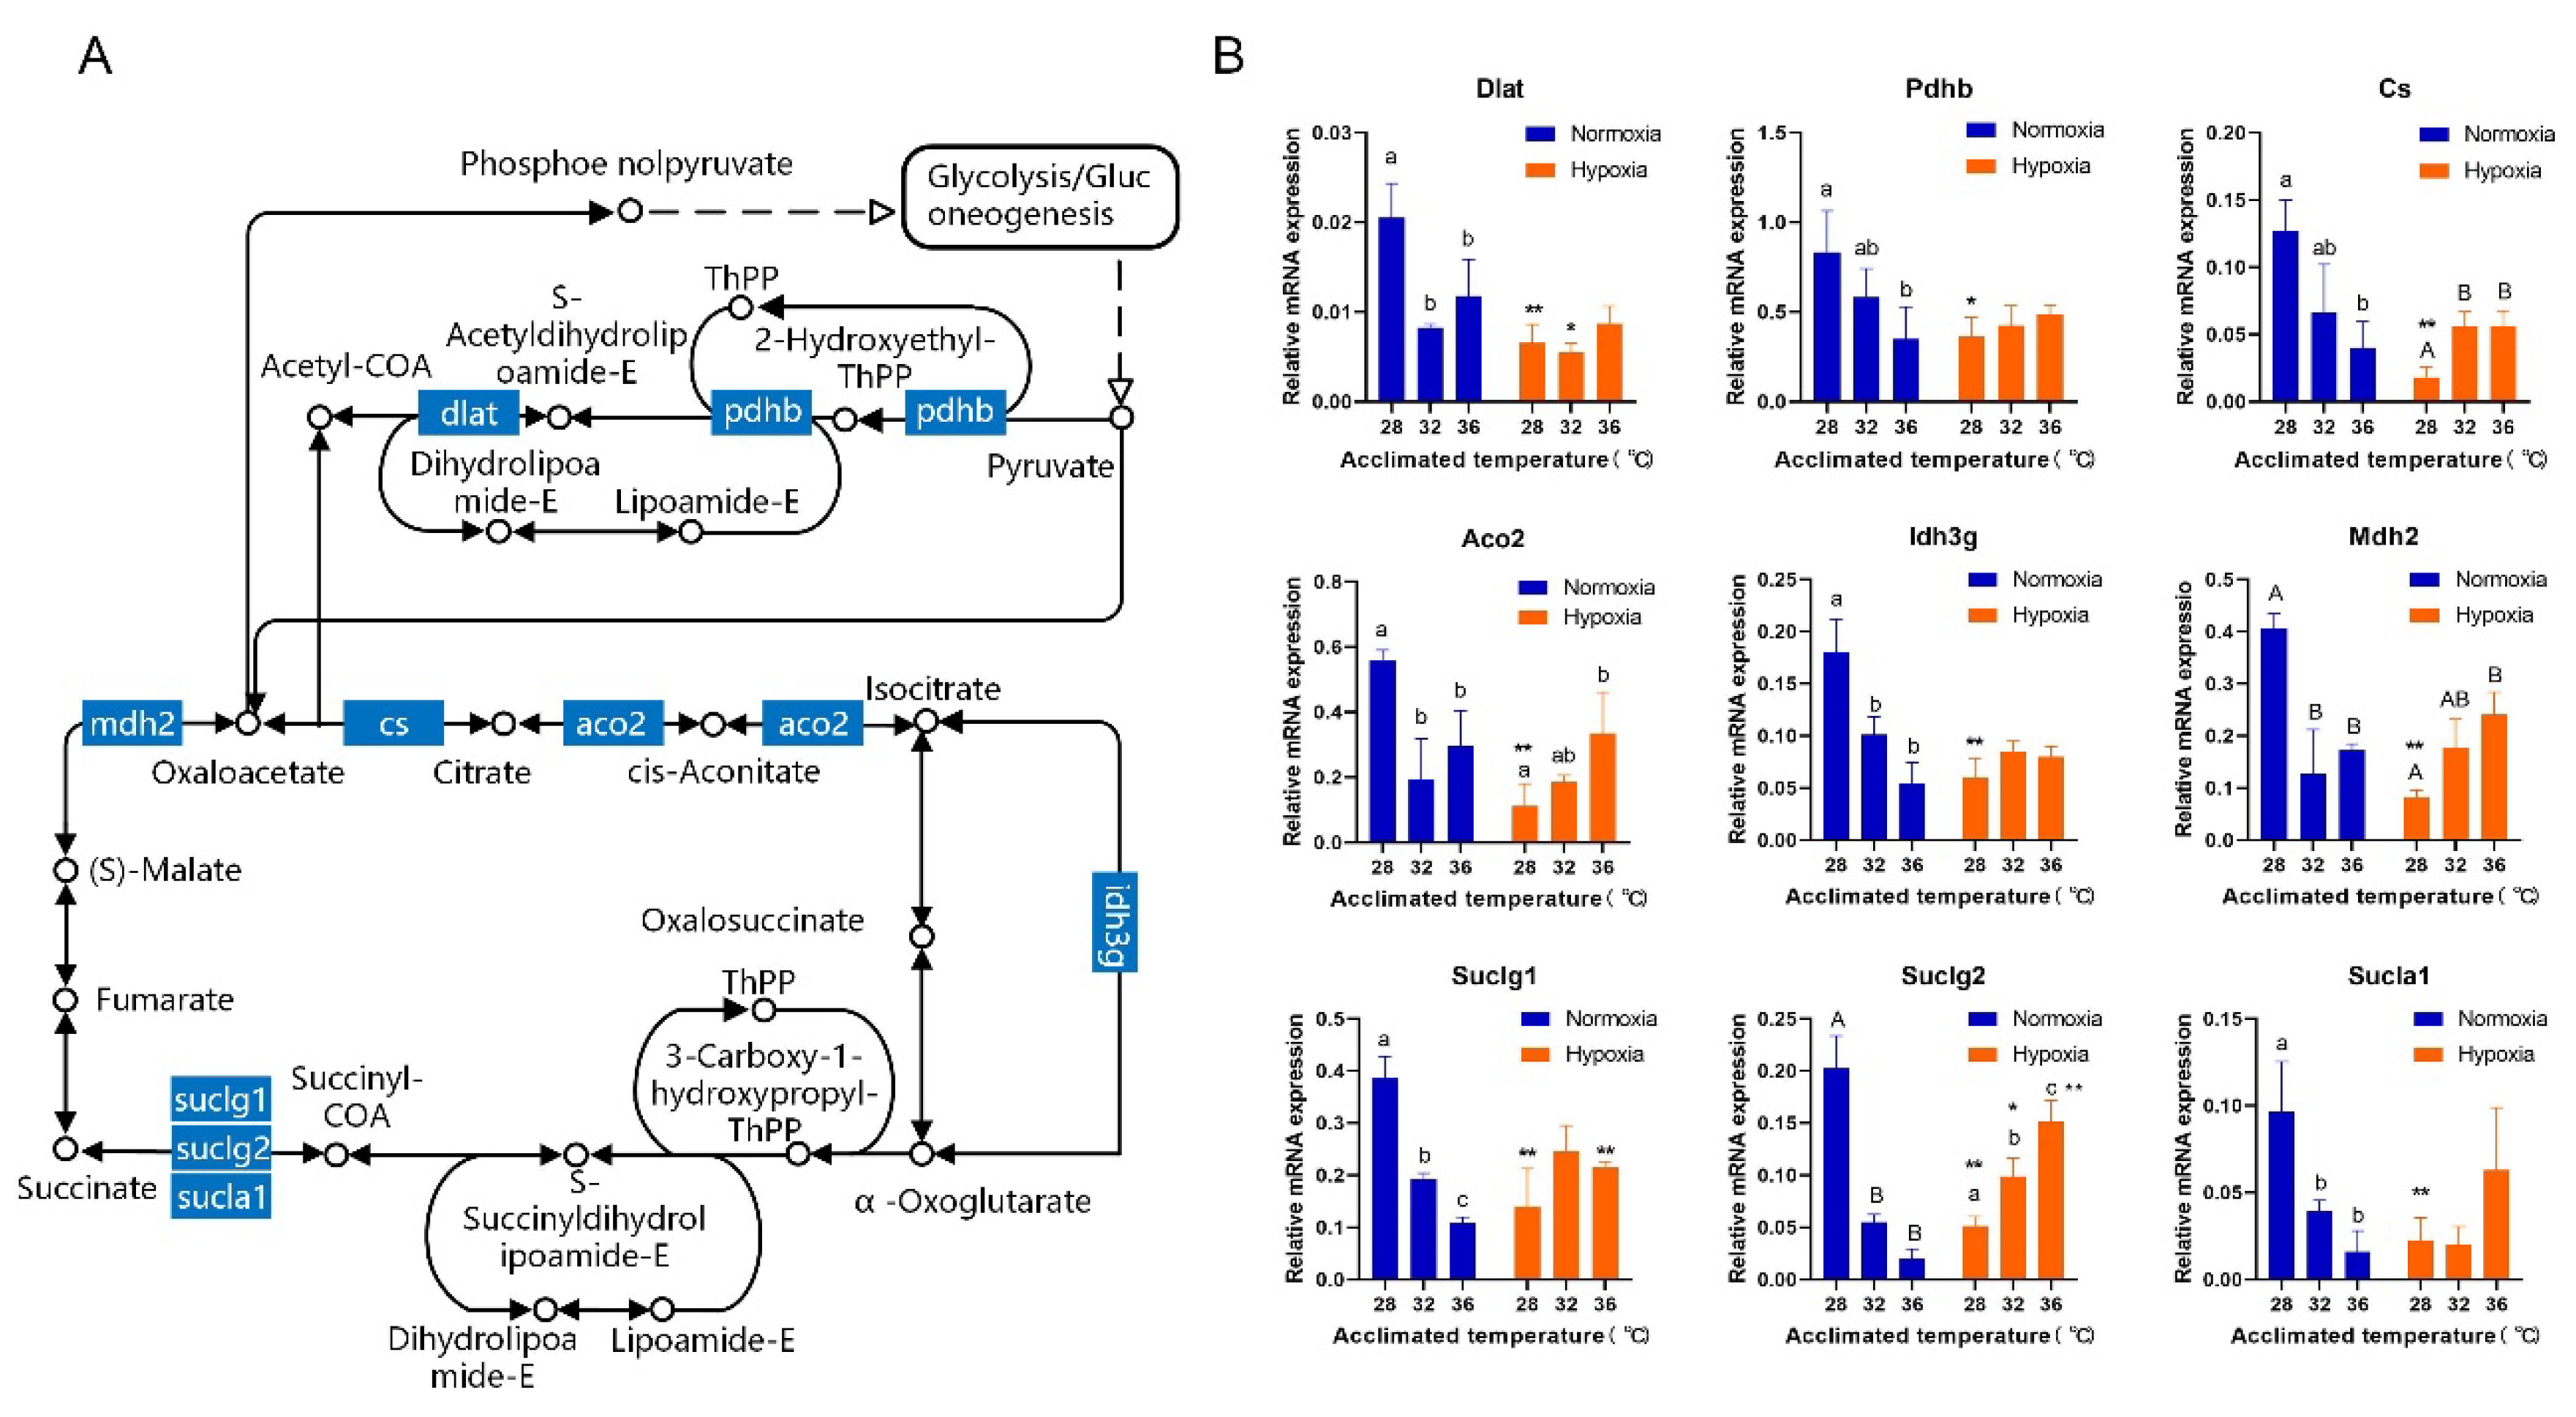
3.3. Gill Transcriptome Analysis

Whole-transcriptome analyses were performed on gills from fish kept at three temperatures under normoxia. In total, 125,049,462 (Q30 92.88%), 116,728,780 (Q30 92.39%), and 125,167,126 (Q30 92.85%) clean reads were generated from the 28, 32, and 36 °C treatments, respectively (Table S2). In total, 663 DEGs were detected between the 28 and 32 °C treatments, of which 404 were up-regulated and 259 were down-regulated (Table S3). Between the 28 and the 36 °C treatment, 2452 DEGs were detected, of which 1217 were up-regulated and 1235 were down-regulated (Table S4). KEGG enrichment analysis was performed on the overlapping DEGs of these two comparisons, with p < 0.05 as a threshold (Table S5). The top significantly enriched signal pathways included DNA replication, nucleotide excision repair, mismatch repair, metabolic pathways, protein processing in endoplasmic reticulum, and the tricarboxylic acid (TCA) cycle (Figure 3). Among these, nine genes involved in the TCA cycle pathway were significantly down regulated at 32 and 36 °C (Figure 4A). Gene expression of Dlat, Pdhb, Cs, Aco2, Idh3g, Mdh2, Suclg1, Suclg2, and Sucla1 in the TCA cycle pathway was significantly different between temperatures at normoxia (F(2, 6) = 11.42, p = 9.02 × 10⁻³; F(2, 6) = 5.907, p = 0.0382; F(2, 6) = 8.072, p = 0.0199; F(2, 6) = 11.27, p = 9.30 × 10⁻³; F(2, 6) = 22.2, p = 1.69 × 10⁻³; F(2, 6) = 25.01, p = 1.23 × 10⁻³; F(2, 6) = 91.49, p = 3.2 × 10⁻⁵; F(2, 6) = 77.27, p = 5.22 × 10⁻⁵; F(2, 6) = 15.41, p = 4.33 × 10⁻³, respectively. One-way ANOVA, Figure 4B). However, at hypoxia, only some of these genes showed significant differences, which were Cs, Aco2, Mdh2 and Suclg2, (F(2, 6) = 14.01, p = 5.5 × 10⁻³; F(2, 6) = 5.418, p = 0.0453; F(2, 6) = 11.28, p = 9.30 × 10⁻³; F(2, 6) = 28.33, p = 8.78 × 10⁻⁴, respectively. One-way ANOVA, Figure 4B).
High temperature inhibited the expression of these genes, so that the potential for further down-regulation of these genes was reduced after acute hypoxia. At 28 °C, the expression of several genes decreased significantly after hypoxia, whereas in the 32 and 36 °C treatments, the difference between hypoxia and normoxia group was not pronounced. This was observed with respect to Pdhb, Cs, Aco2, Idhg, Mdh2, and Sucla1 (t(4) = 3.211, p = 0.033; t(4) = 7.64, p = 1.58 × 10⁻³; t(4) = 10.235, p = 5.14 × 10⁻⁴; t(4) = 5.80, p = 4.39 × 10⁻³; t(4) = 17.88, p = 5.75 × 10⁻⁵; t(4) = 4.08, p = 0.0151; t-test, Figure 4B).

4. Discussion

4.1. Hypoxia Tolerance Is Reduced under Long-Term Exposure to High Temperatures

For aquatic animals, temperature is one of the most important environmental factors, and it directly affects habitat suitability and the geographical range of a species [31,32]. Exposure to temperatures above the optimum for long periods of time reduces aerobic activity potential, weakens physiological and ecological adaptability, and increases mortality of aquatic organisms [8,13,14,33,34].
Long-term high temperature stress can lead to reduced hypoxia tolerance, which decreases overall fitness and viability [4,35]. Jung et al. studied the effects of high temperature acclimation on the hypoxia tolerance of fishes in the Amazon basin, which demonstrated that after more than 10 days of acclimation to high temperatures (33, 35, and 37 °C), hypoxia tolerance was decreased in the 14 tested species [20]. In the present study, we found a correlation between thermal acclimation and hypoxia tolerance. After long-term exposure to high temperatures (36 °C), the hypoxia tolerance of tilapia decreased significantly, and the time during body balance maintained at low oxygen concentrations (0.2 mg/L) was significantly shorter than in the 28 °C treatment (Figure 1B). Thus, risks to the survival of GIFT are considerably higher under high temperatures due to decreased hypoxia tolerance.

4.2. Thinning of the Lamellae in Response to High Temperatures

According to OCLTT theory, the ability of the cardiovascular system to transport sufficient oxygen from the gills to other tissues decreases with increasing temperature, thus limiting the aerobic activity of fishes [9,19]. Under long-term high-temperature stress and increasing hypoxia, tissues and organs of fishes may adjusted to some extent, such as through increasing cardiac output and accelerating ventilation frequency [23,36]. Our results demonstrated curling and thinning of the lamellae in GIFT after long-term exposure to high temperatures (Figure 2B,C). The change of lamellae morphology may be due to the requirement for improved oxygen exchange efficiency under long-term high-temperature stress. For water-breathing species, the gill is the predominant organ for O2 uptake. The width of the lamellae determines the efficiency of O2 diffusion [37], and thinner lamellae reduce diffusion distances between blood and water, thereby enhancing gill diffusing capacity. In the present study, thinning of the lamellae occurred after long-term exposure to 36 °C (Figure 2M). We were unable to determine whether these morphological changes of gill tissue under high temperatures enhanced oxygen absorption efficiency; however, fish exposed to 36 °C exhibited accelerated ventilatory frequency, suggesting a state of hypoxia.

4.3. RMR Is Partially Compensated during Long-Term Warm Exposure

The physiological changes of GIFT in response to high temperatures include not only the morphology of gills, but also changes in the RMR (Figure 1C). The RMR of fish is measured as the mean rate of oxygen uptake under undisturbed and continuous feeding conditions [7]. Our studies focused on the RMR, mainly because this is commonly used as an indicator of the basic energy usage and metabolic status of animals. Compared to the controls (28 °C), significantly elevated RMR occurred at 36 °C, after an acute temperature increase; however, this value decreased after a period of 15 weeks of exposure to 36 °C. This indicated that RMR was partially compensated during long-term warm adaption.
Examples of incomplete compensation for temperature have been reported in Antarctic fish. Sandersfeld et al. measured the acclimation capacity of Trematomus bernacchii at 4 °C and reported a decreased RMR after nine weeks of warm acclimation [38]. Similarly, Strobel et al. found that the RMR of Notothenia rossii was partially compensated during 28–36 days of warm acclimation and decreased below the rate observed after acute warming [39]. These results suggest that acclimation in Antarctic fish occurs between four and nine weeks after exposure to higher temperatures. However, it remains unknown whether the reduced capacities of the RMR are adaptive or would impair population fitness over longer timescales under consistently elevated temperatures. The requirement to increase metabolism under warm temperatures, and the mitochondrial or enzyme level as well as cellular stress responses, are frequently contradictory and may result in trade-offs; however, the exact respective mechanisms remain unclear.
Transcriptomic changes also indicated incomplete temperature compensation, demonstrating that most DEGs between the 28 and 36 °C treatments were associated with metabolism pathways (Figure 3). Nine genes of the TCA cycle were down-regulated in the heat-stress treatment (Figure 4A,B), and these nine genes were also down-regulated in the 28 °C acute hypoxia group, suggesting a similar molecular regulation regarding responses to high temperature and hypoxia stress (Figure 4B). As aerobic metabolic scope is correlated with the upper limit of thermal tolerance of the whole organism [19], one option for fishes to cope with high temperature and hypoxia is to utilize existing phenotypic plasticity to improve tolerance. Decreasing the RMR may be a straightforward strategy for tilapia to cope with high temperature and hypoxia, thus maintaining maximum biological activity [16,35,40,41].

4.4. Threat of Global Warming to Tilapia

The rise of water temperature caused by global warming has become a new challenge for fish survival in recent decades. Fishes are poikilotherms, thus they are directly affected by water temperature. Globally, tilapia are important aquaculture fish, constituting a high-quality source of protein for numerous people. In Asia, tilapia culture is mainly carried out in ponds, rivers, and other natural waters, and industrial culturing is rare. With progressive global warming, the overall fitness and survival of tilapia will be threatened in the near future. Understanding the changes of gill tissue morphology and gene expression in tilapia under high temperatures may help predict and avert negative impacts of long-term high temperature on tilapia.

5. Conclusions

Temperature is probably the most potent factor controlling the metabolism of aquatic organisms. Our results demonstrated that, after 15 weeks of treatment, the mean survival and tolerance of hypoxia were significantly reduced, while the respiratory rate increased in the 36 °C treatment, compared to the 28 and 32 °C treatments. A partial temperature compensation for the RMR was observed after 15 weeks of acclimation at 36 °C. The thinning of the lamellae in gill filaments may contribute to an increase in the oxygen absorption area under high temperatures. Transcriptomics demonstrated that aerobic metabolism-related pathways were down-regulated at 36 °C. The results of this study suggest that the survival of tilapia is at risk due to global warming, and this risk may be exacerbated by associated reduced hypoxia tolerance.

Supplementary Materials

The following supporting information can be downloaded at: https://www.mdpi.com/article/10.3390/fishes7050216/s1, Table S1: The primer pairs used in qPCR are presented together with the amplicon size; Table S2: Transcriptome sequencing quality control; Table S3: Differentially expressed genes (DEGs) with increase and devrease in the comparison between 32 vs. 28 °C-acclimated groups. Gene id, annotation and average FPKM counts (n = 3) is indicated; Table S4: Differentially expressed genes (DEGs) with increase and devrease in the comparison between 36 vs. 28°C-acclimated groups. Gene id, annotation and average FPKM counts (n = 3) is indicated; Table S5: Enriched KEGG pathways of the overlapped DEGs of two the comparisons between 32 °C vs. 28 °C and 36 °C vs. 28 °C, with p < 0.05 as the threshold.

Author Contributions

Conceptualization, Y.Z. (Yan Zhou) and L.C.; data curation, Y.Z. (Yan Zhou) and S.W.; formal analysis, Y.Z. (Yanjie Zhang); funding acquisition, Y.L. and L.C.; investigation, Y.Z. (Yanjie Zhang), W.L. (Wei Li), Z.W. and S.J.; methodology, Y.Z. (Yan Zhou); project administration, Y.Z. (Yan Zhou); software, Y.Z. (Yan Zhou), S.W. and W.L. (Wenhao Li); supervision, L.C.; validation, Y.Z. (Yanjie Zhang); writing—original draft, Y.Z. (Yan Zhou); writing—review & editing, Y.Z. (Yan Zhou), Y.L., Q.X. and L.C. All authors have read and agreed to the published version of the manuscript.

Funding

This study was supported by the National Key Research and Development Program of China (2018YFD0900601 and 2018YFD0900101), and the Natural Science Foundation of China to L. Chen (32130109).

Institutional Review Board Statement

All handling of tilapia fish in this study was conducted in accordance with the guidelines of The Scientific Ethic Committee of Shanghai Ocean University, with approval number of SHOU-DW-20210118.

Informed Consent Statement

Not applicable.

Data Availability Statement

Raw data of transcriptome sequencing was submitted to the National Center for Biotechnology Information (NCBI) Sequence Read Archive (SRA) database under the project number: PRJNA808671 (https://www.ncbi.nlm.nih.gov/sra/PRJNA808671, accessed on 5 August 2022).

Conflicts of Interest

The authors declare that they have no known competing financial interests or personal relationships that could have appeared to influence the work reported in this paper.

References

  1. FAO: Fishery and Aquaculture Statistics. Global Production by Production Source 1950–2019 (FishstatJ); FAO Fisheries Division: Rome, Italy, 2021. [Google Scholar]
  2. Nivelle, R.; Gennotte, V.; Kalala, E.J.K.; Ngoc, N.B.; Muller, M.; Melard, C.; Rougeot, C. Temperature preference of Nile tilapia (Oreochromis niloticus) juveniles induces spontaneous sex reversal. PLoS ONE 2019, 14, e0212504. [Google Scholar]
  3. Barbarossa, V.; Bosmans, J.; Wanders, N.; King, H.; Bierkens, M.F.P.; Huijbregts, M.A.J.; Schipper, A.M. Threats of global warming to the world’s freshwater fishes. Nat. Commun. 2021, 12, 1701–1710. [Google Scholar] [CrossRef]
  4. Rubalcaba, J.G.; Verberk, W.C.E.P.; Hendriks, A.J.; Saris, B.; Woods, H.A. Oxygen limitation may affect the temperature and size dependence of metabolism in aquatic ectotherms. Proc. Natl. Acad. Sci. USA 2020, 117, 31963–31968. [Google Scholar] [CrossRef]
  5. Nilsson, G.E. Respiratory Physiology of Vertebrates; Cambridge University Press: Cambridge, UK, 2010; p. 96. [Google Scholar]
  6. Pörtner, H.O.; Farrell, A.P. Ecology Physiology and Climate Change. Science 2008, 322, 690–692. [Google Scholar] [CrossRef]
  7. Fry, F.E.J.; Hoar, W.S.; Randall, D.J. The Effect of Environmental Factors on the Physiology of Fish, Fish Physiology; Academic Press: New York, NY, USA, 1971; Volume VI, p. 83. [Google Scholar]
  8. Beuvard, C.; Imsland, A.K.D.; Thorarensen, H. The effect of temperature on growth performance and aerobic metabolic scope in Arctic charr, Salvelinus alpinus. J. Therm. Biol. 2022, 104, 103117. [Google Scholar] [CrossRef]
  9. Pörtner, H.O.; Bock, C.; Mark, F.C. Oxygen- and capacity-limited thermal tolerance: Bridging ecology and physiology. J. Exp. Biol. 2017, 220, 2685–2696. [Google Scholar] [CrossRef]
  10. Li, S.N.; Wang, R.J.; Dai, Z.L.; Wang, C.; Wu, Z.L. Dietary supplementation with Yucca schidigera extract alleviated heat stress-induced unfolded protein response and oxidative stress in the intestine of Nile tilapia (Oreochromis niloticus). Ecotoxicol. Environ. Saf. 2021, 219, 112299. [Google Scholar] [CrossRef]
  11. Habibah, A.N.; Pfennig, F.; Wilting, J.; Holtz, W.; Hoerstgen-Schwark, G.; Wessels, S. Germline Development of Genetically Female Nile tilapia (Oreochromis niloticus) Reared under Different Temperature Regimes. Sex. Dev. 2017, 11, 217–224. [Google Scholar] [CrossRef]
  12. Schulte, P.M.; Healy, T.M.; Fangue, N.A. Thermal Performance Curves, Phenotypic Plasticity, and the Time Scales of Temperature Exposure. Integr. Comp. Biol. 2011, 51, 691–702. [Google Scholar] [CrossRef]
  13. Bennett, J.M.; Sunday, J.; Calosi, P.; Villalobos, F.; Martinez, B.; Molina-Venegas, R.; Araujo, M.B.; Algar, A.C.; Clusella-Trullas, S.; Hawkins, B.A.; et al. The evolution of critical thermal limits of life on Earth. Nat. Commun. 2021, 12, 1198–1206. [Google Scholar] [CrossRef]
  14. Qu, Y.F.; Wiens, J.J. Higher temperatures lower rates of physiological and niche evolution. Proc. Biol. Sci. 2020, 287, 823–831. [Google Scholar] [CrossRef]
  15. Whalen, M.A.; Whippo, R.D.B.; Stachowicz, J.J.; York, P.H.; Aiello, E.; Alcoverro, T.; Altieri, A.H.; Benedetti-Cecchi, L.; Bertolini, C.; Bresch, M.; et al. Climate drives the geography of marine consumption by changing predator communities. Proc. Natl. Acad. Sci. USA 2020, 117, 28160–28166. [Google Scholar] [CrossRef]
  16. Servili, A.; Canario, A.V.M.; Mouchel, O.; Munoz-Cueto, J.A. Climate change impacts on fish reproduction are mediated at multiple levels of the brain-pituitary-gonad axis. Gen. Comp. Endocrinol. 2020, 291, 113439–113453. [Google Scholar] [CrossRef]
  17. Seebacher, F.; Brand, M.D.; Else, P.L.; Guderley, H.; Hulbert, A.J.; Moyes, C.D. Plasticity of oxidative metabolism in variable climates: Molecular mechanisms. Physiol. Biochem. Zool 2010, 83, 721–732. [Google Scholar] [CrossRef]
  18. Sandblom, E.; Clark, T.D.; Grans, A.; Ekstrom, A.; Brijs, J.; Sundstrom, L.F.; Odelstrom, A.; Adill, A.; Aho, T.; Jutfelt, F. Physiological constraints to climate warming in fish follow principles of plastic floors and concrete ceilings. Nat. Commun. 2016, 7, 11447. [Google Scholar] [CrossRef]
  19. Pörtner, H.O. Oxygen- and capacity-limitation of thermal tolerance: A matrix for integrating climate-related stressor effects in marine ecosystems. J. Exp. Biol. 2010, 213, 881–893. [Google Scholar] [CrossRef]
  20. Jung, E.H.; Brix, K.V.; Richards, J.G.; Val, A.L.; Brauner, C.J. Reduced hypoxia tolerance and survival at elevated temperatures may limit the ability of Amazonian fishes to survive in a warming world. Sci. Total Environ. 2020, 748, 141349. [Google Scholar] [CrossRef]
  21. Eliason, E.J.; Anttila, K. Temperature and the Cardiovascular System. Fish Physiol. 2017, 36, 235–297. [Google Scholar]
  22. Jorgensen, S.M.; Castro, V.; Krasnov, A.; Torgersen, J.; Timmerhaus, G.; Hevroy, E.M.; Hansen, T.J.; Susort, S.; Breck, O.; Takle, H. Cardiac responses to elevated seawater temperature in Atlantic salmon. BMC Physiol. 2014, 14, 2–12. [Google Scholar] [CrossRef]
  23. Nyboer, E.A.; Chapman, L.J. Cardiac plasticity influences aerobic performance and thermal tolerance in a tropical, freshwater fish at elevated temperatures. J. Exp. Biol. 2018, 221, jeb178087. [Google Scholar] [CrossRef]
  24. Hu, P.; Liu, M.; Zhang, D.; Wang, J.; Niu, H.; Liu, Y.; Wu, Z.; Han, B.; Zhai, W.; Shen, Y.; et al. Global identification of the genetic networks and cis-regulatory elements of the cold response in zebrafish. Nucleic Acids Res. 2015, 43, 9198–9213. [Google Scholar] [CrossRef] [PubMed]
  25. Hu, P.; Liu, M.; Liu, Y.; Wang, J.; Zhang, D.; Niu, H.; Jiang, S.; Wang, J.; Zhang, D.; Han, B.; et al. Transcriptome comparison reveals a genetic network regulating the lower temperature limit in fish. Sci. Rep. 2016, 6, 28952. [Google Scholar] [CrossRef] [PubMed]
  26. Khaw, H.L.; Ponzoni, R.W.; Danting, M.J.C. Estimation of genetic change in the GIFT strain of Nile tilapia (Oreochromis niloticus) by comparing contemporary progeny produced by males born in 1991 or in 2003. Aquaculture 2008, 275, 64–69. [Google Scholar] [CrossRef]
  27. Kim, D.; Langmead, B.; Salzberg, S.L. HISAT: A fast spliced aligner with low memory requirements. Nat. Methods 2015, 12, 357–360. [Google Scholar] [CrossRef] [PubMed]
  28. Trapnell, C.; Williams, B.A.; Pertea, G.; Mortazavi, A.; Kwan, G.; van Baren, M.J.; Salzberg, S.L.; Wold, B.J.; Pachter, L. Transcript assembly and quantification by RNA-Seq reveals unannotated transcripts and isoform switching during cell differentiation. Nat. Biotechnol. 2010, 28, 511–515. [Google Scholar] [CrossRef]
  29. Robinson, M.D.; McCarthy, D.J.; Smyth, G.K. edgeR: A Bioconductor package for differential expression analysis of digital gene expression data. Bioinformatics 2010, 26, 139–140. [Google Scholar] [CrossRef]
  30. Xie, C.; Mao, X.; Huang, J.; Ding, Y.; Wu, J.; Dong, S.; Kong, L.; Gao, G.; Li, C.Y.; Wei, L. KOBAS 2.0: A web server for annotation and identification of enriched pathways and diseases. Nucleic Acids Res. 2011, 39, W316–W322. [Google Scholar] [CrossRef]
  31. Lavender, E.; Fox, C.J.; Burrows, M.T. Modelling the impacts of climate change on thermal habitat suitability for shallow-water marine fish at a global scale. PLoS ONE 2021, 16, e0258184. [Google Scholar]
  32. Carilo Filho, L.M.; de Carvalho, B.T.; Azevedo, B.K.A.; Gutierrez-Pesquera, L.M.; Mira-Mendes, C.V.; Sole, M.; Orrico, V.G.D. Natural history predicts patterns of thermal vulnerability in amphibians from the Atlantic Rainforest of Brazil. Ecol. Evol. 2021, 11, 16462–16472. [Google Scholar] [CrossRef]
  33. Román-Palacios, C.; Wiens, J.J. Recent responses to climate change reveal the drivers of species extinction and survival. Proc. Natl. Acad. Sci. USA 2020, 117, 4211–4217. [Google Scholar] [CrossRef]
  34. Morley, S.; Peck, L.; Sunday, J.; Heiser, S.; Bates, A. Physiological acclimation and persistence of ectothermic species under extreme heat events. Global Ecol. Biogeogr. 2019, 28, 1018–1037. [Google Scholar] [CrossRef]
  35. McArley, T.J.; Hickey, A.J.R.; Herbert, N.A. Hyperoxia increases maximum oxygen consumption and aerobic scope of intertidal fish facing acutely high temperatures. J. Exp. Biol. 2018, 221, jeb189993. [Google Scholar] [CrossRef] [PubMed]
  36. Giomi, F.; Portner, H.O. A role for haemolymph oxygen capacity in heat tolerance of eurythermal crabs. Front Physiol. 2013, 4, 110–121. [Google Scholar] [CrossRef] [PubMed]
  37. Shuang, L.; Su, X.L.; Zheng, G.D.; Zou, S.M. Effects of hypoxia and reoxygenation on gill remodeling, apoptosis, and oxidative stress in hypoxia-tolerant new variety blunt snout bream (Megalobrama amblycephala). Fish Physiol. Biochem. 2022, 48, 263–274. [Google Scholar] [CrossRef]
  38. Sandersfeld, T.; Davison, W.; Lamare, M.D.; Knust, R.; Richter, C. Elevated temperature causes metabolic trade-offs at the whole-organism level in the Antarctic fish Trematomus bernacchii. J. Exp. Biol. 2015, 218, 2373–2381. [Google Scholar] [CrossRef]
  39. Strobel, A.; Bennecke, S.; Leo, E.; Mintenbeck, K.; Portner, H.O.; Mark, F.C. Metabolic shifts in the Antarctic fish Notothenia rossii in response to rising temperature and PCO2. Front Zool 2012, 9, 28–42. [Google Scholar] [CrossRef]
  40. Auer, S.K.; Agreda, E.; Chen, A.H.; Irshad, M.; Solowey, J. Late-stage pregnancy reduces upper thermal tolerance in a live-bearing fish. J. Therm. Biol. 2021, 99, 103022. [Google Scholar] [CrossRef]
  41. Marshall, D.J.; McQuaid, C.D. Warming reduces metabolic rate in marine snails: Adaptation to fluctuating high temperatures challenges the metabolic theory of ecology. Proc. Biol. Sci. 2011, 278, 281–288. [Google Scholar] [CrossRef]
Figure 1. Phenotype statistics of GIFT tilapia exposed to 28, 32, and 36 °C for 15 weeks. (A) Ventilatory frequency (n = 15). (B) Hypoxia tolerance (time to LOE at 0.2 mg/L O2; n = 15). (C) Routine metabolic rate (RMR; n = 15). (D) Survival rates (n = 90). (E) Red blood cell count (n = 15). (F) Hemoglobin content (n = 15). Presented are the means ± SEM. Statistical differences were compared by using nest ANOVA and mutiple comparisons of Tukey’s HSD; significances were illustrated by different capital letters (p < 0.01) (A,B,E,F). Fitting linear models were tested by covariance analyses (p < 0.01) (C). A Chi-squared test was used to examine survival rates (D); ** indicates p < 0.01.
Fishes 07 00216 g001
Figure 2. Morphological changes of gill tissue in GIFT tilapia after exposure to high temperature and hypoxia. Controls (28 °C, normoxia) demonstrated normal gill filaments (A,D). Fish kept at 32 and 36 °C displayed curling of the lamellae under normoxia (B,C) and acute hypoxia (H,I). (G) Curling lamellae in 28 °C hypoxia. The terminal area of the filament was normal at 32 °C normoxia (E), while this area was expanded at 36 °C under normoxia (F) and at 28, 32, and 36 °C under hypoxia (JL), as indicated by the blue oval. The lower right corner of each photo displays the full view of the sagittal section of the gill slice; the red box indicates the enlarged area. Arrows indicate the lamellae. BV, blood vessel; P, primary filament. Bars = 200 µm. (M) Mean thickness of filaments. (N) The terminal area of the filament (area with diameter of 200 µm from the end, as demonstrated in (F). Displayed are the means ± SEM (n = 5). Statistically significant differences between temperature treatments under normoxia or acute hypoxia are tested by one-way ANOVA, respectively, and the multiple comparisons are indicated with different lowercase (p < 0.05) or capital letters (p < 0.01). Significant differences between normoxia and acute hypoxia under the same temperature are indicated with single asterisks (p < 0.05) or double asterisks (p < 0.01). (O) Percentages of curling lamellae (%) at different temperature treatments. Percentage data were tested using Chi-squared tests; ** indicates p < 0.01.
Fishes 07 00216 g002
Figure 3. Bubble map of enriched KEGG pathways of DEGs between 36 and 28 °C, under normoxia. On the x-axis, the Rich factor indicates the ratio of numbers of mapped DEGs to mapped total gene numbers in the pathway. The larger the Rich factor, the more significant is the enrichment. The y-axis displays the first 20 significantly enriched signal pathways. The −log 10 (p-value) indicates statistical significance, coloration from purple to red indicates the degree of significance from low to high.
Fishes 07 00216 g003
Figure 4. Differential expression of genes involved in the tricarboxylic acid (TCA) cycle pathway at different temperature and oxygenation conditions. (A) Inhibition of the TCA cycle in the long-term 36 °C treatment, compared with 28 °C, under normoxia. The black arrow indicates the direction of the reaction, and the gene name in the rectangle illustrates the enzyme that catalyzes the step. The blue shading box indicates down-regulated genes in the 36°C normoxia group (p < 0.05). Compound names are provided next to the corresponding circles. (B) RT-qPCR results of nine genes involved in TCA cycle under different temperature and oxygen content groups. Numbers indicate temperature treatments. Blue and orange coloration indicate normoxia and acute hypoxia, respectively. Provided are the means ± SEM (n = 9). Statistically significant differences between temperature treatments under normoxia or acute hypoxia are tested by one-way ANOVA, respectively, and the multiple comparisons are indicated with different lowercase (p < 0.05) or capital letters (p < 0.01). Statistical differences between normoxia and acute hypoxia under the same temperature are indicated by asterisks; * p < 0.05; ** p < 0.01.
Fishes 07 00216 g004
Table 1. Water quality parameters of temperature, PH, dissolved oxygen, and total ammonia. Data are presented as means ± standard error of mean (SEM). Three biological replicates were set for each temperature treatment.
Treatment Temperature (°C)PHDissolved Oxygen (mg/L)Total Ammonia (mg/L)
27.92 ± 0.29 °C7.32 ± 0.294.28 ± 0.561.57 ± 0.05
31.93 ± 0.26 °C7.60 ± 0.224.13 ± 0.471.30 ± 0.22
35.98 ± 0.34 °C7.45 ± 0.113.97 ± 0.771.67 ± 0.16
Publisher’s Note: MDPI stays neutral with regard to jurisdictional claims in published maps and institutional affiliations.

