Article

Combined Effects of Eco-Substrate and Carbon Addition on Water Quality, Fish Performance and Nutrient Budgets in the Pond Polyculture System

1
Key Open Laboratory of Cold Water Fish Germplasm Resources and Breeding of Heilongjiang Province, Heilongjiang River Fisheries Research Institute, Chinese Academy of Fishery Sciences, Harbin 150070, China
2
Engineering Technology Research Center of Saline-Alkaline Water Fisheries (Harbin), Chinese Academy of Fishery Sciences, Harbin 150070, China
3
Pearl River Fisheries Research Institute, Chinese Academy of Fishery Sciences, Guangzhou 510380, China
*
Authors to whom correspondence should be addressed.
Fishes 2022, 7(5), 212; https://doi.org/10.3390/fishes7050212
Submission received: 17 July 2022 / Revised: 14 August 2022 / Accepted: 23 August 2022 / Published: 23 August 2022
(This article belongs to the Section Sustainable Aquaculture)

Abstract

:
Traditional aquaculture can cause serious environmental pollution. Biofilm and biofloc technology have the potential to limit aquaculture pollution. An outdoor experiment was conducted to evaluate the combined effects of eco-substrates and carbon addition on water quality, fish performance and nutrient budgets in the pond polyculture system. In the treatment group, the total ammonia nitrogen, nitrate nitrogen, nitrite nitrogen, and total nitrogen of the water were significantly lower compared to the control group (p < 0.05). The growth performance of H. molitrix and A. nobilis, including the final individual weight, specific growth rate, weight gain rate, total production and net production, was significantly higher in the treatment groups compared to the control (p < 0.05), while there was no significant difference in those of C. carpio between the two groups. Feed was the main N (>92%) and P (>95%) input during the experiment. Comprehensive accumulation was the main N (>58%) and P (>69%) output. The N and P feed input and comprehensive accumulation output declined in the treatment group. The N utilization efficiency in the experimental group increased slightly (p > 0.05), while the P utilization efficiency in the experimental group was significantly higher compared to the control (p < 0.05). Therefore, the application of eco-substrates and carbon addition can increase water quality, improve fish growth, and promote nutrient utilization efficiency in pond polyculture systems.

1. Introduction

The aquaculture industry remains an important source of inexpensive and healthy animal protein for humans [1,2]. Intensive pond culture is a main method of freshwater aquaculture in China, and the annual output of freshwater pond culture in 2020 reached 22,797,586 t [3]. The drawbacks of traditional pond culture systems include their high water consumption and the production of excessive nitrogen- and phosphorus-rich wastes [4,5]. Research has demonstrated that aquatic animals can assimilate only 15–30% of nitrogen in their feed, while the remainder is discharged into the water as feces and ammonia nitrogen, negatively impacting aquatic ecosystems [6,7,8].
Efficient aquaculture wastewater treatment techniques have been developed and applied in recent years [9,10]. Biofloc technology (BFT) is a highly efficient, eco-friendly aquaculture technique that results in little or no water exchange with the outside environment [11]. The use of BFT promotes water quality due to the growth of microorganisms, which assimilate ammonia for cellular protein generation or oxidize ammonia to nitrite and nitrate [12]. In a BFT culture, additional carbon sources need to be added to maintain the proper C/N ratio of water, promoting the reproduction of heterotrophic bacteria [13]. However, biofloc systems are unstable and vulnerable to factors such as weather, carbon source addition and feeding, in which abundant suspended particles and particle flocculation settle to the pond’s bottom, causing a deterioration in water quality [14]. Eco-substrates are the carrier material of biofilms, which are essentially periphyton substrates [15,16]. Eco-substrates have a large specific surface area, which can capture suspended solids and promote the proliferation of microorganisms [17,18]. Additionally, eco-substrates can improve organic matter degradation and decrease the concentrations of total suspended solids in BFT systems [19,20]. Several studies have removed contaminants from effluent using a combination of biofilm and biofloc technologies [21,22,23]. However, there is a lack of research on the use of biofilm and biofloc technologies in pond polyculture systems.
In the present study, the sources of nutrient gains/losses were quantified based on nitrogen and phosphorus budgets to investigate the nutrient cycling processes that occur in Cyprinus carpio culture ponds with eco-substrate and organic carbon addition. In addition, this study explored the effects of combined eco-substrates and carbon addition on water quality and fish performance. The findings of this study will provide a reference for further optimizing C. carpio modeling and culture conditions.

2. Materials and Methods

2.1. Ethics Statement

All animal procedures in this study were conducted according to the guidelines for the care and use of laboratory animals of Heilongjiang River Fisheries Research Institute, CAFS. The studies in animals were reviewed and approved by the Committee for the Welfare and Ethics of Laboratory Animals of Heilongjiang River Fisheries Research Institute, CAFS.

2.2. Study Site and Experimental Design

The experiment was performed at the Hulan experimental station of the Heilongjiang Fishery Research Institute, Chinese Academy of Fishery Sciences, located in Hulan District, Harbin City, Heilongjiang Province, China. The experiment took place for 140 days, from 21 May to 8 October 2021. Six earthen ponds that were similar in size (≈740 m2 surface area and ≈2 m deep) were selected for the experiment. Prior to the experiment, the ponds were well exposed to sunlight and sterilized with bleaching powder. In the experimental ponds, the eco-substrate was placed, and organic carbon was added regularly. An aquamat (Meridian Aquatic Technology, LLC) was used as the eco-substrate, of which the main material is non-woven fabric, and it has a larger specific surface area than the general substrate and is more conducive to microbial growth. Fifteen aquamats (2.0 m × 1.5 m) were used in each pond. The upper part of each aquamat was fixed on a wire that is parallel to the long side of the pond, with the underneath attached to the bottom to keep it unfolded. Corn starch was used as organic carbon, and 5 kg was added to each pond every 14 days during the experiment. In the control ponds, there was neither an eco-substrate nor corn starch addition. Each treatment had three replicates.

2.3. Fish Stocking and Management

The body weights of individual young bottom-feeder mirror carp (Cyprinus carpiospecularis), filter-feeder silver carp (Hypophthalmichthys molitrix) and big carp (Aristichthys nobilis) at the beginning of the experiment were 193.11 ± 14.17 g, 45.52 ± 5.94 g and 34.11 ± 4.48 g, respectively, on the basis of the general principles of the main culture fish and matching fish in polyculture ponds in the north of China. There were 1000 C. carpio, 70 H. molitrix and 19 A. nobilis, respectively, in each pond. The number and weight of the initial stocking fish in the experimental group and the control group were the same. The carp were supplied with a commercial pellet food (Tongwei Feed Company, Shenyang, China) containing 32% protein three times each day (07:30, 12:00 and 16:30). The amount of food supplied each day was 3% of the body weight of the C. carpio. Feed consumption was closely monitored so that the feed amount could be adjusted regularly. Throughout the entire experimental period, there was no water exchange, aside from compensating for natural evaporation and leakage losses.

2.4. Fish Performance Parameters

At the conclusion of the experiment, the final individual weight (FIW) of the fish was measured (accurate to 0.01 g), and the fish performance was evaluated based on the survival rate (SR), specific growth rate (SGR), weight gain rate (WGR), total production (TP) and net production (NP), according to the following formulas:
Survival rate (%) = 100 × final fish count/initial fish count;
Specific growth rate (%·d−1) = 100 × (Ln (final body weight) − Ln (initial body weight))/experimental duration (days);
Weight gain rate (%) = (final body weight − initial body weight)/initial body weight;
Total production (kg·ha−1) = 10,000 × (final body weight in kg × final fish count)/740, where 740 is the per pond area in m2;
Net production (kg·ha−1) = 10,000 × (final body weight in kg × final fish count − initial body weight in kg × initial fish count)/740, where 740 is the area of each pond in m2.

2.5. Water Quality Parameters

Water quality parameters consisting of the temperature, dissolved oxygen (DO), pH and conductivity (COND) were determined in situ using a multiparameter water quality instrument (YSI Professional Plus, USA). The water samples were collected from each pond at 20-day intervals during the culture period, for a total of five rounds of sampling. The water samples were examined to determine the total ammonia nitrogen (TAN), total nitrogen (TN), total phosphorus (TP), chemical oxygen demand (CODMn), nitrate nitrogen (NO3-N), nitrite nitrogen (NO2-N) and soluble reactive phosphate (PO4-P), following standard methods [24].

2.6. Nitrogen and Phosphorus Budget

The nitrogen and phosphorus mass balances in each pond were estimated on a kg·ha−1 basis according to the following equation:
∑ inputs = ∑ outputs ± unaccounted.
The nutrient inputs consisted of (1) the TN or TP contents in the stocked fish; (2) the TN or TP contents in the feed; (3) the initial TN or TP contents in the water; (4) the TN or TP contents in rain; (5) the TN or TP contents in the added water and (6) the TN or TP contents in the corn starch. The nutrient outputs consisted of (1) the TN or TP contents in the harvested fish; (2) the TN or TP contents in the water at the end of the experiment and (3) the TN lost during the volatilization of NH3-N. Unaccounted nitrogen and phosphorus included (1) the TN or TP accumulated in the sediment; (2) adsorbed TN or TP and (3) TN or TP lost through seepage.
The stocked fish, feed, harvested fish and corn starch were dried at 60 °C to constant weight, crushed and sifted through a 0.15 mm sieve. The fish were treated with tricaine methane sulfonate (MS 222, 200 mg/L) before sampling. The TN and TP concentrations in these samples were obtained using the micro-Kjeldahl method and molybdenum yellow spectrophotometry, respectively [25]. NH3-N volatilization was determined using the method reported by Weiler (2011) [26].

2.7. Nitrogen and Phosphorus Utilization Efficiency

The following formula is used to calculate the nitrogen and phosphorus utilization efficiency of the cultured fish:
UE = (Ea/Ei) × 100,
where Ea is the amount of nitrogen or phosphorus in the net production of the cultured fish, and Ei is the total nitrogen or phosphorus input during the experiment.

2.8. Statistical Analysis

The data are presented as the means with standard deviation (mean ± SD). The values were calculated by independent sample t tests with Originlab 9.0, and the results were considered significant at p < 0.05.

3. Results

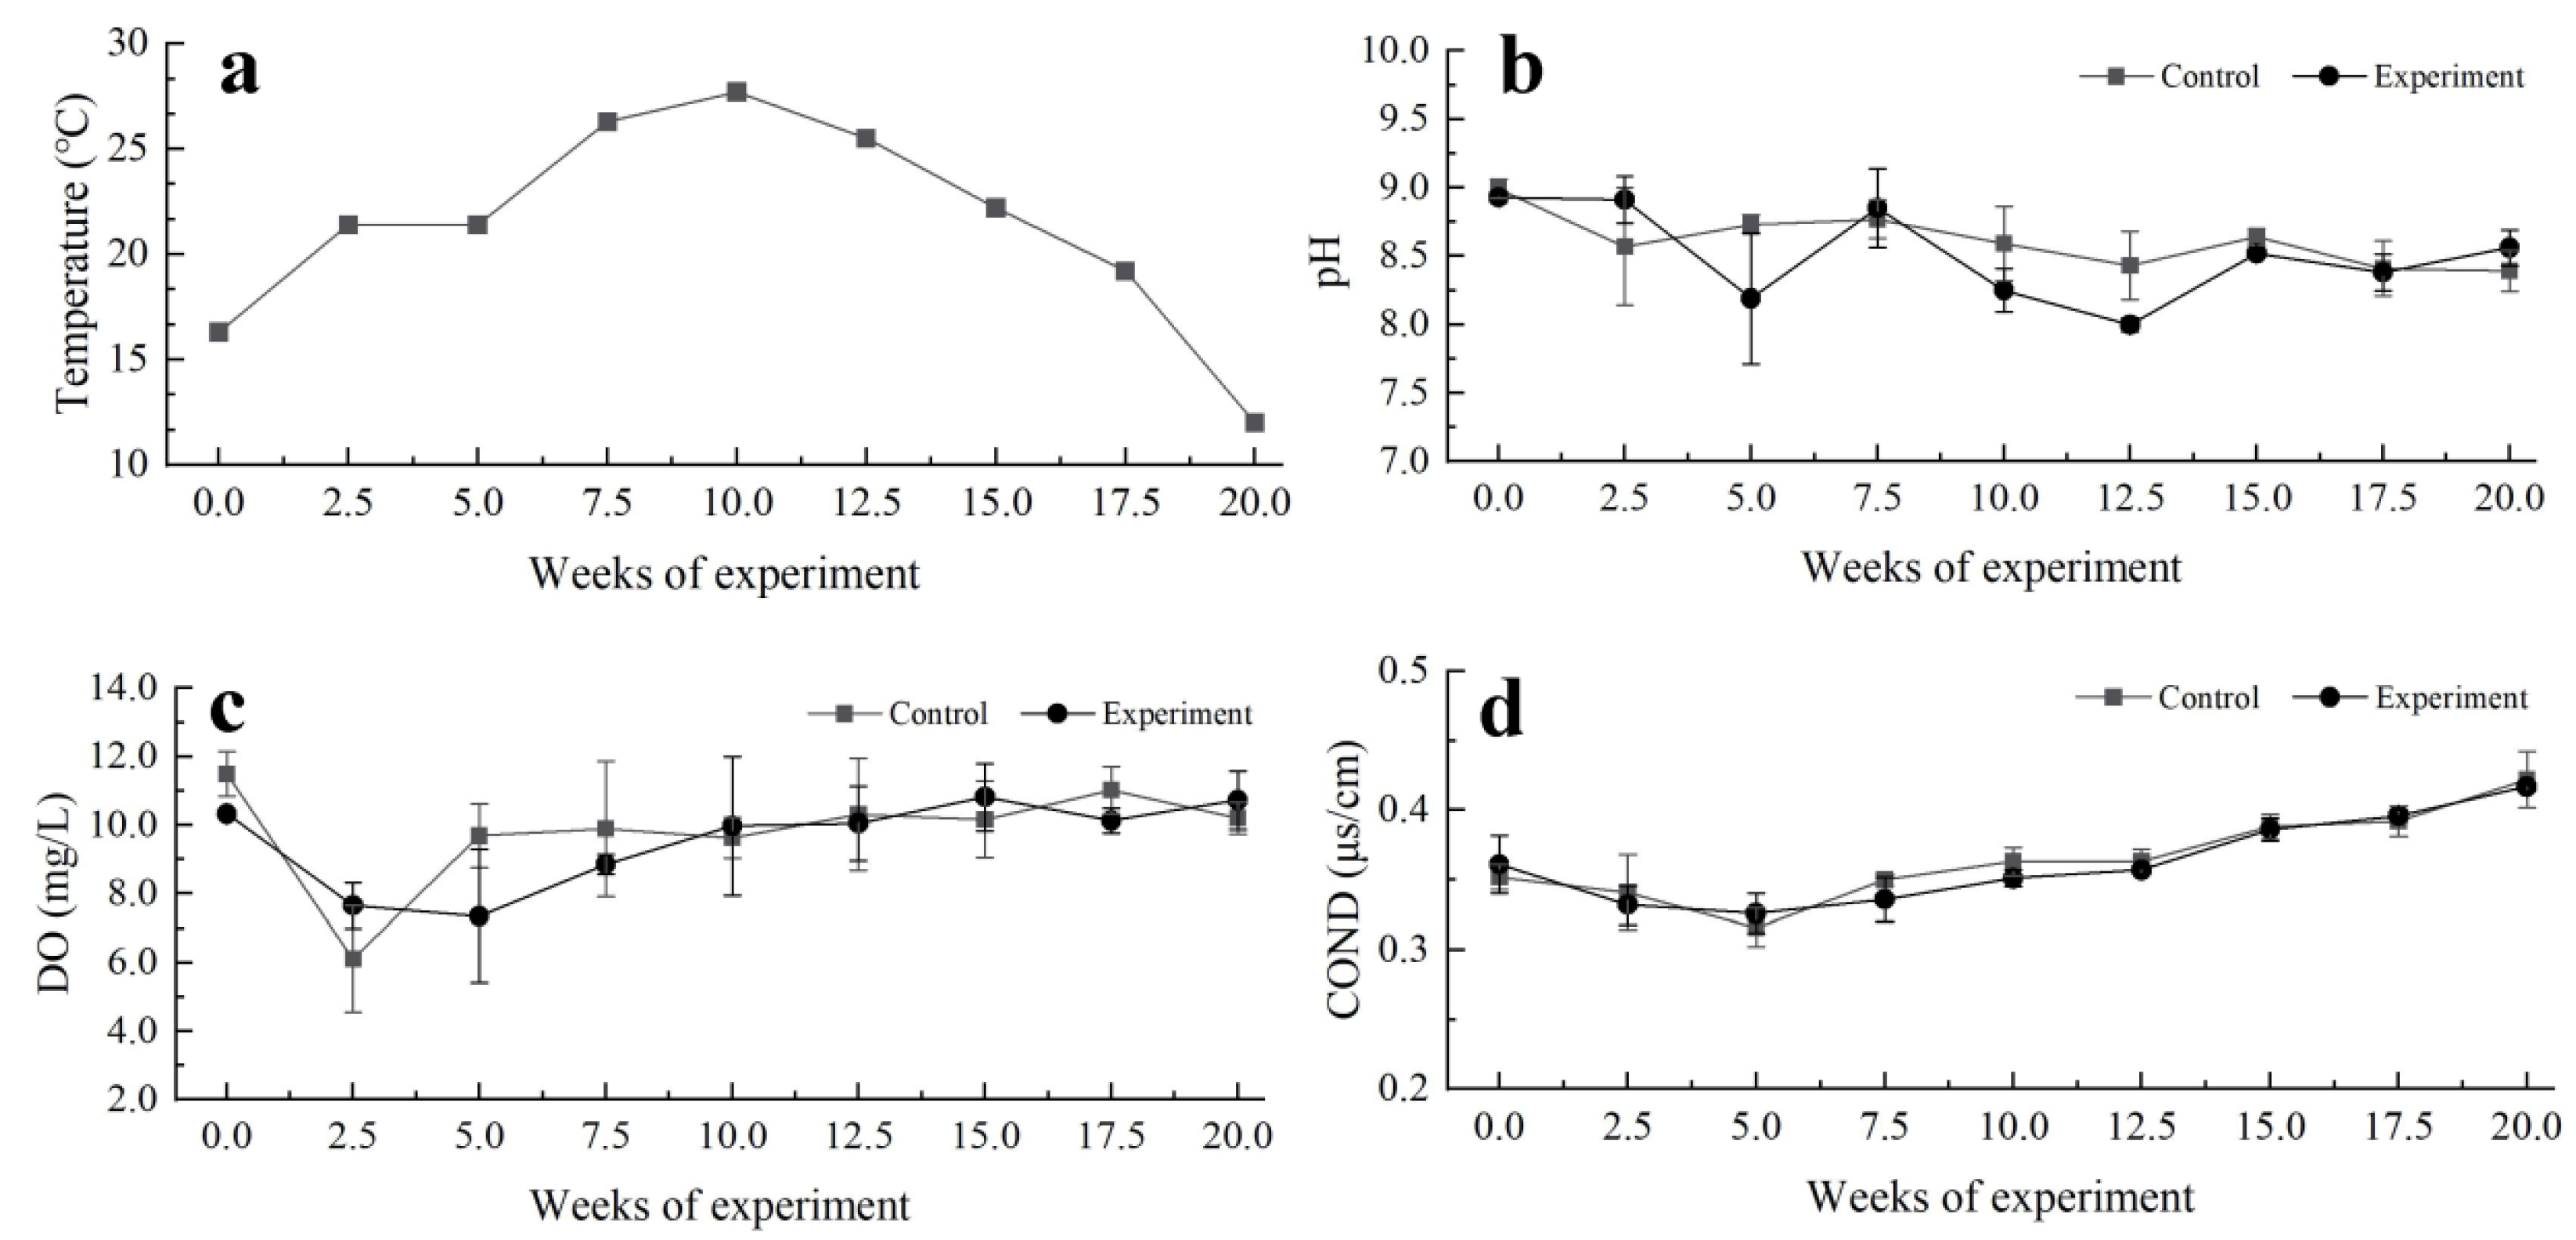
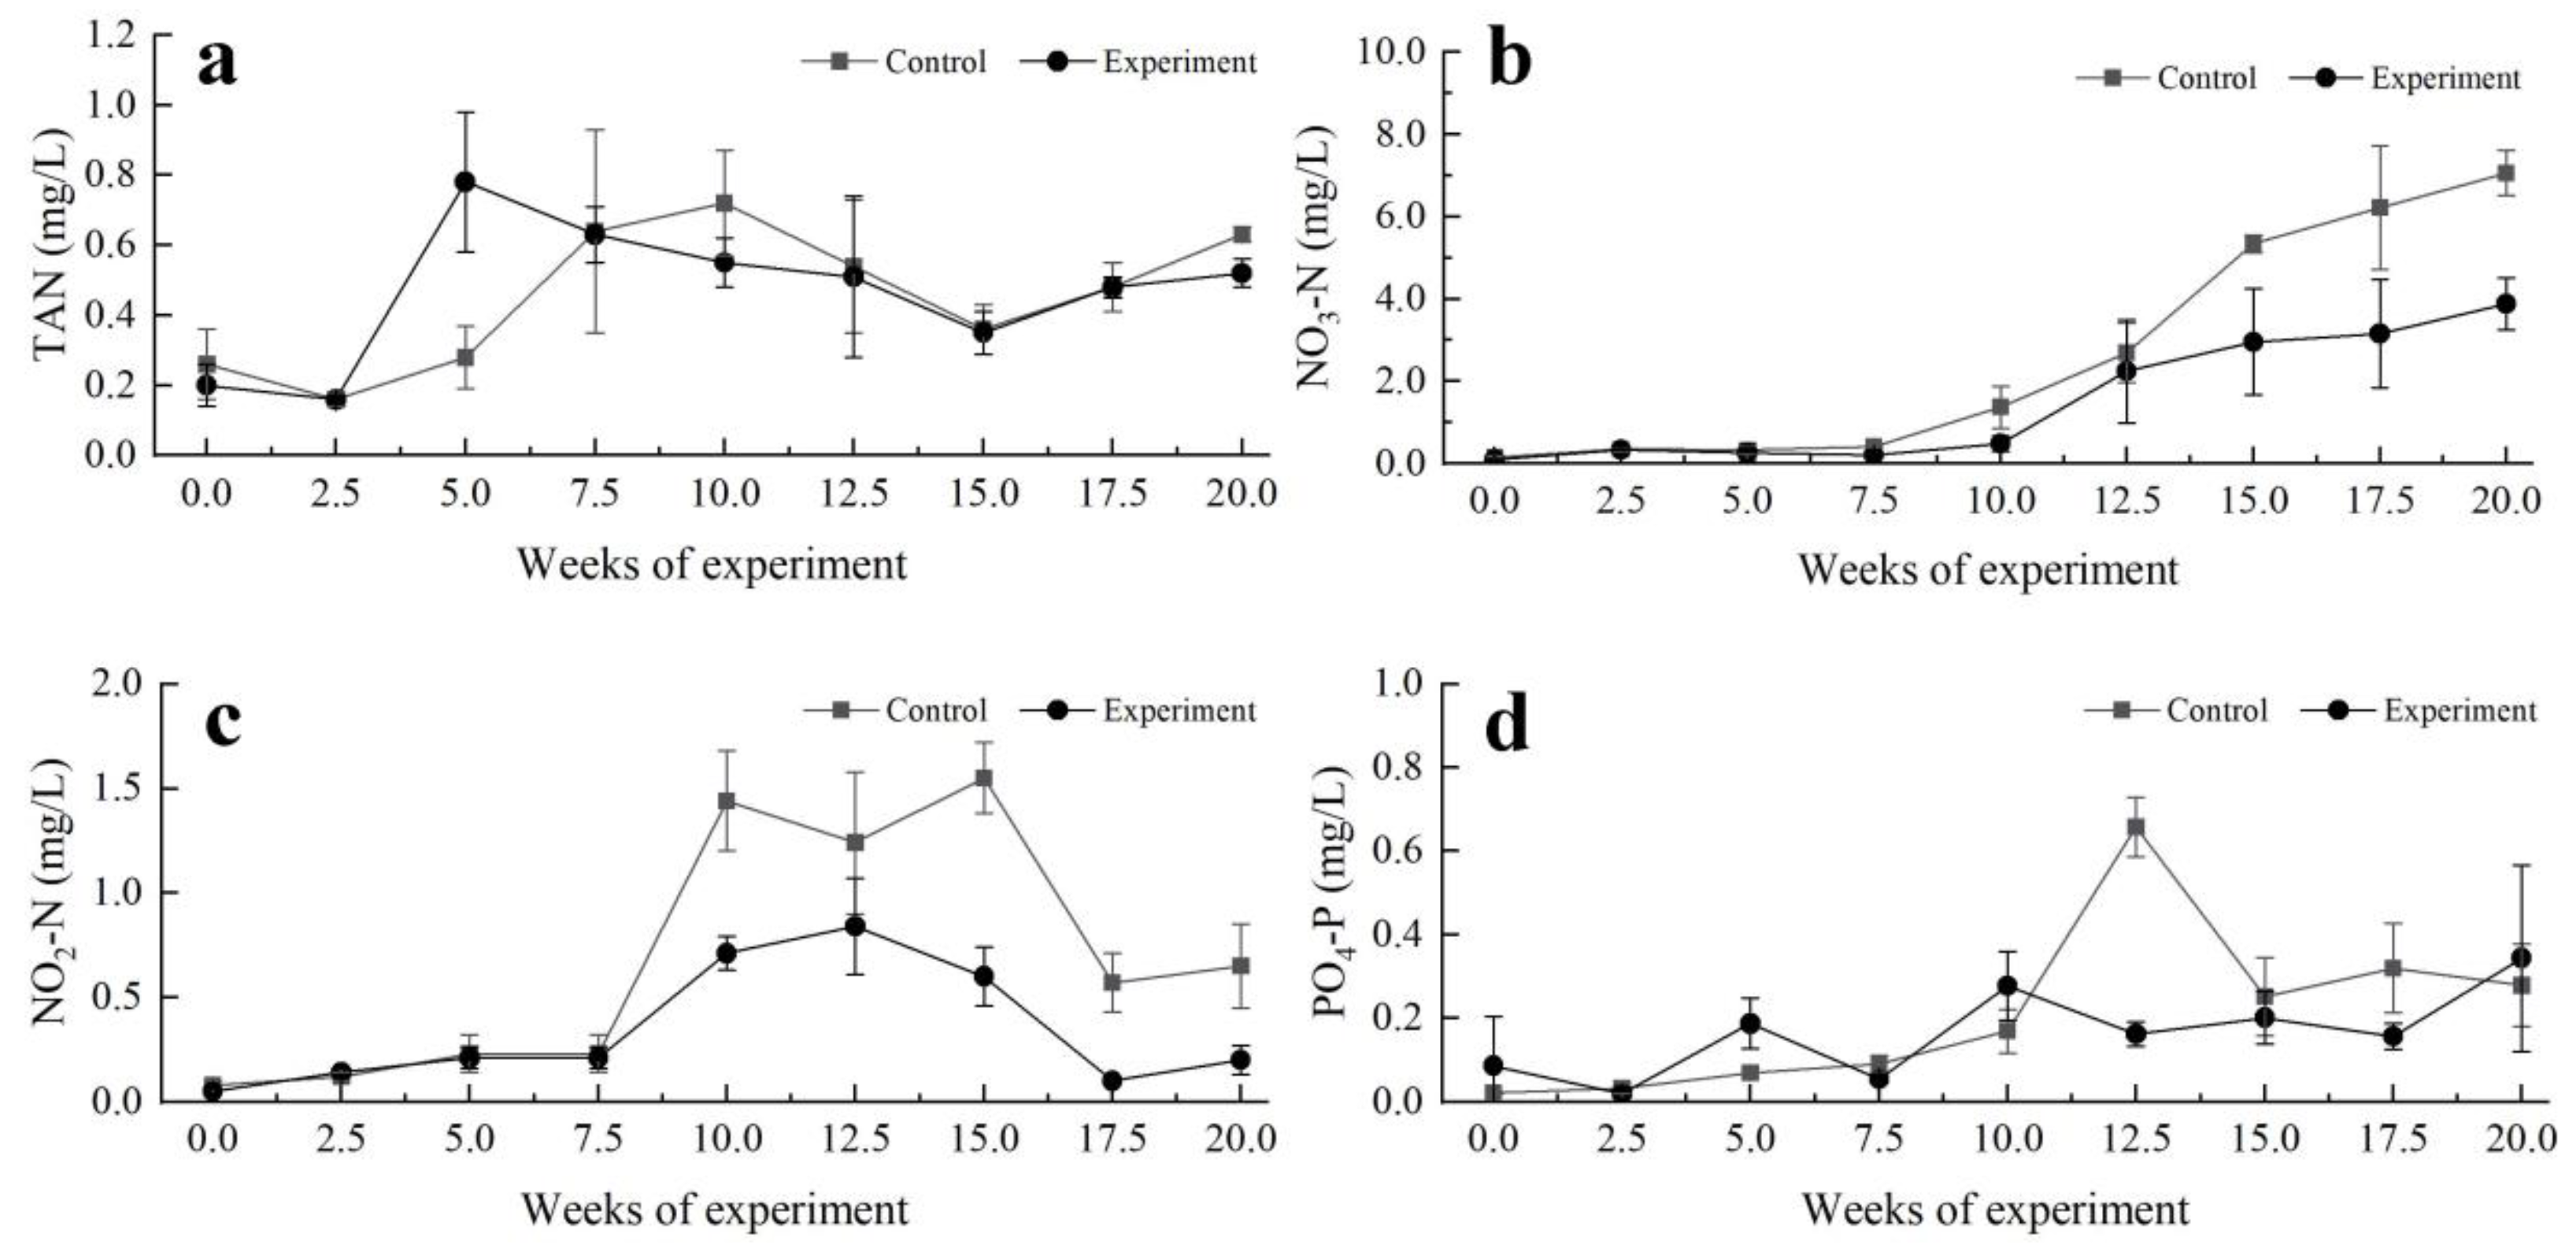
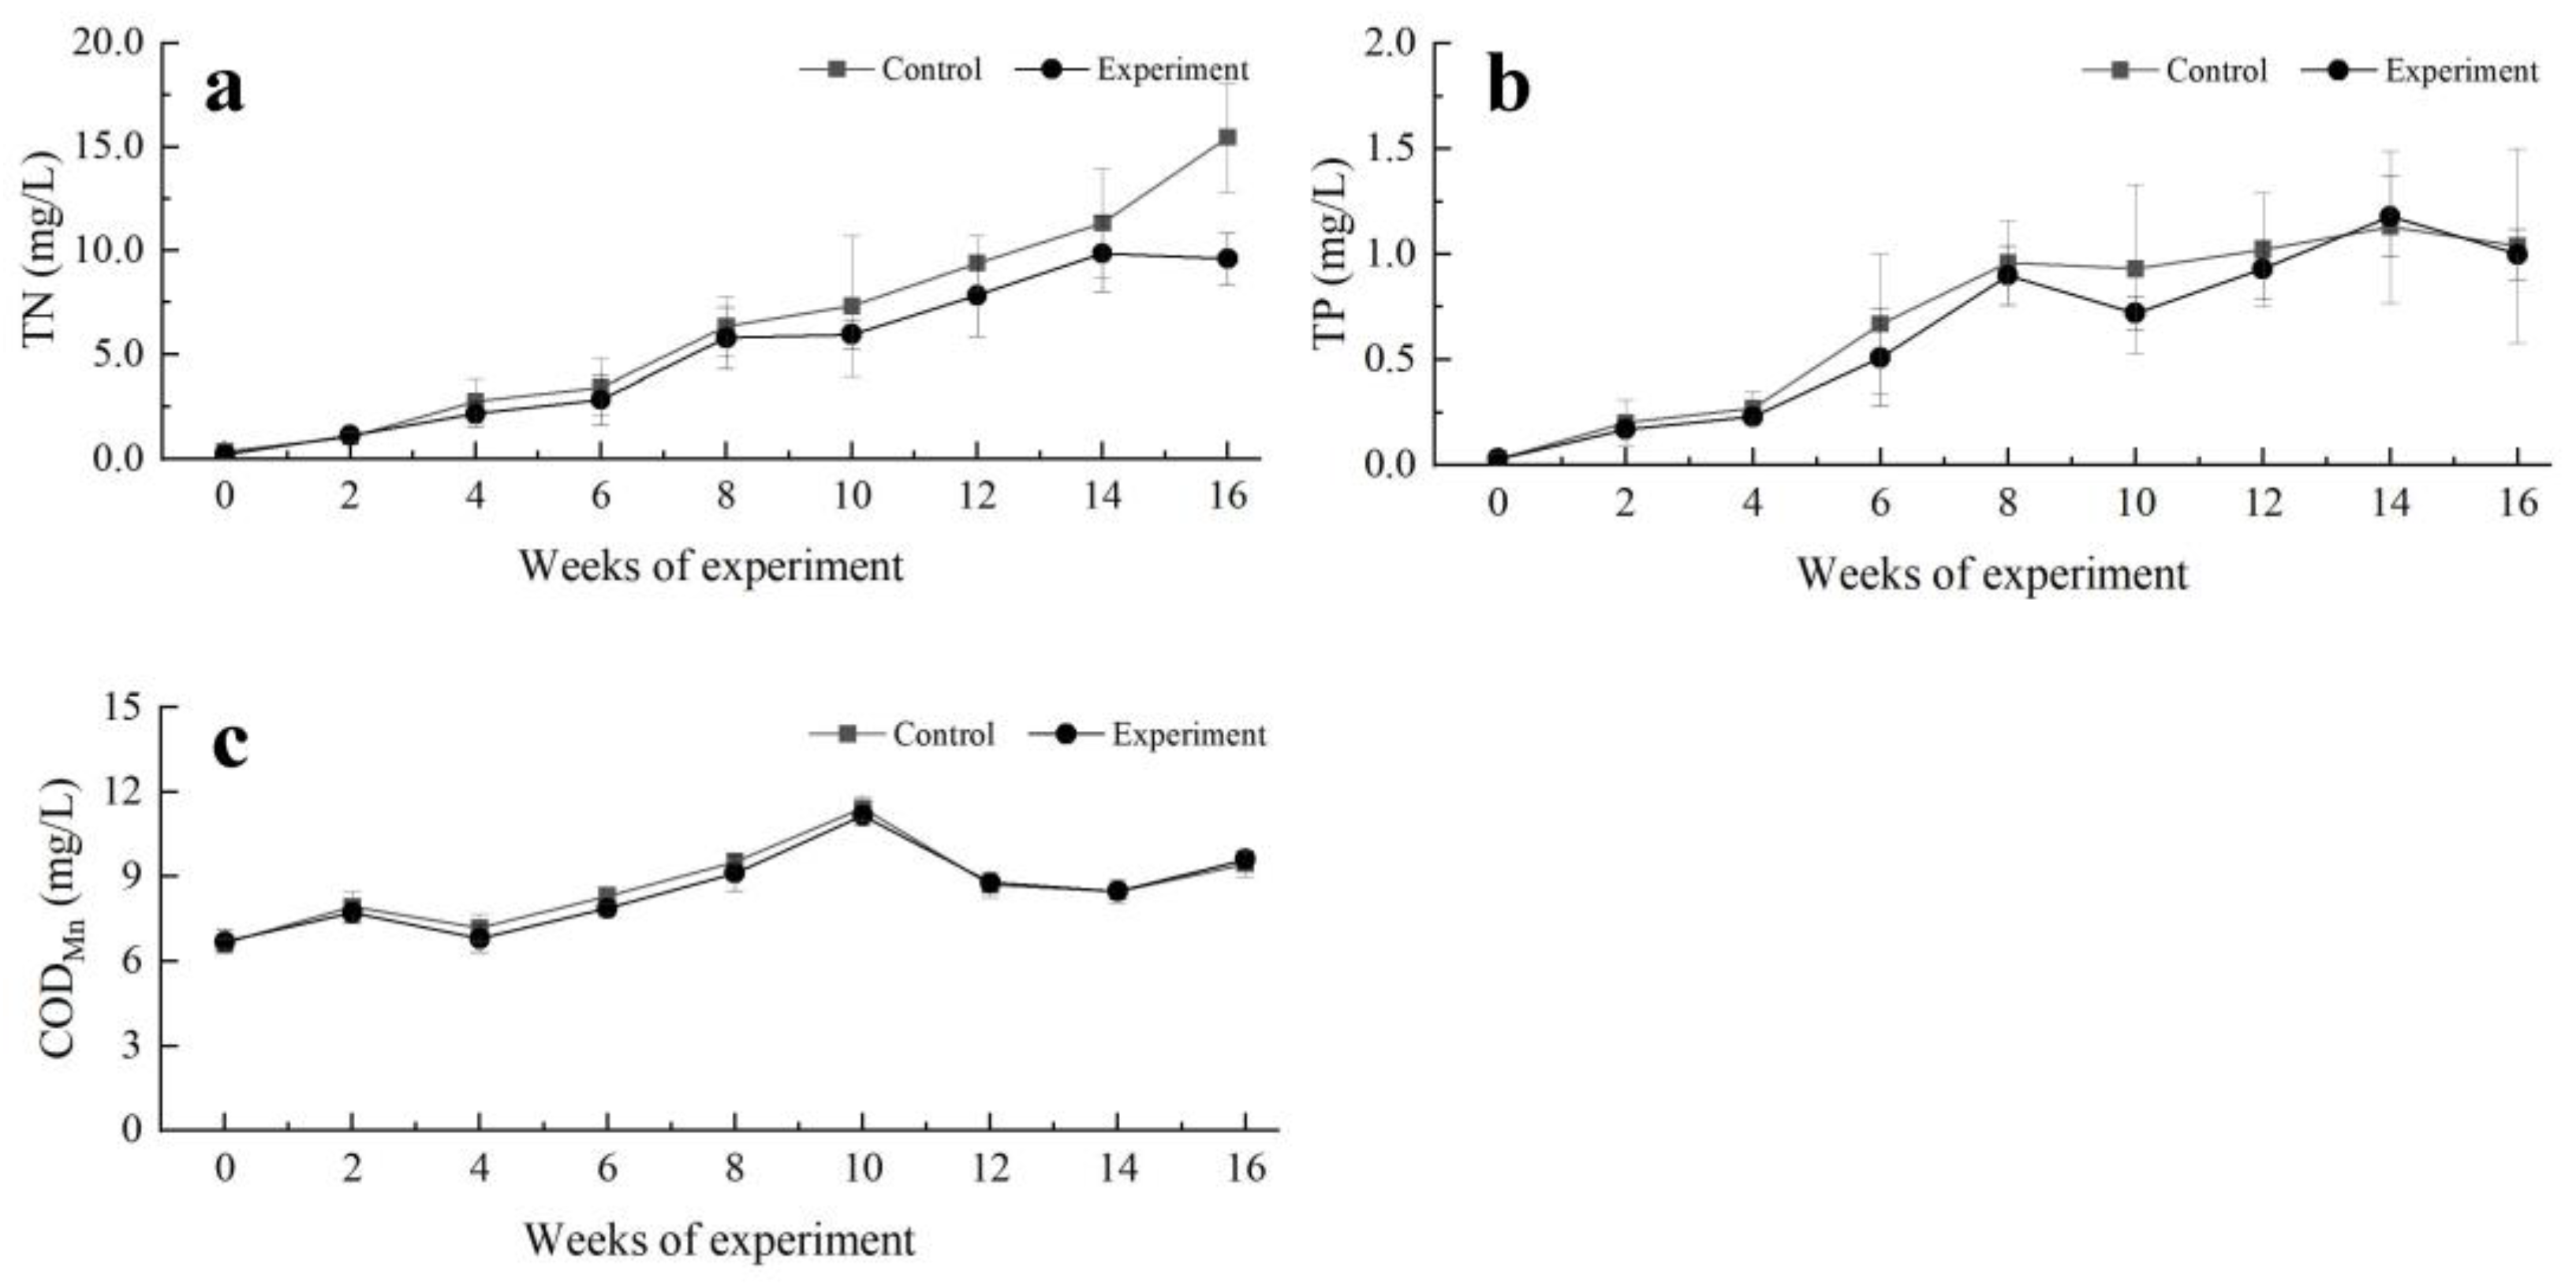
3.1. Water Quality Parameters

Table 1 displays the water quality parameters in the control and treatment groups at the end of the experiment, and the changes in the water quality parameters throughout the experiment are illustrated in Figure 1, Figure 2 and Figure 3. The TAN, NO3-N, NO2-N and TN values in the treatment group were significantly lower than those in the control group (p < 0.05). In contrast, there were no significant differences between the DO, pH, COND, TP, and CODMn values of the treatment and control groups (p > 0.05).

3.2. Growth and Yields

The growth performance and yields of C. carpio, H. molitrix and A. nobilis are shown in Table 2. The FIW, SGR, WGR, SR, TP and NP values of C. carpio in the treatment group were higher compared to those in the control group. However, no significant differences in any of the parameters were detected between the treatment and the control group (p > 0.05). For H. molitrix and A. nobilis, the FIW, SGR, WGR, TP and NP values in the treatment group had significantly higher values compared to those in the control group (p < 0.05).

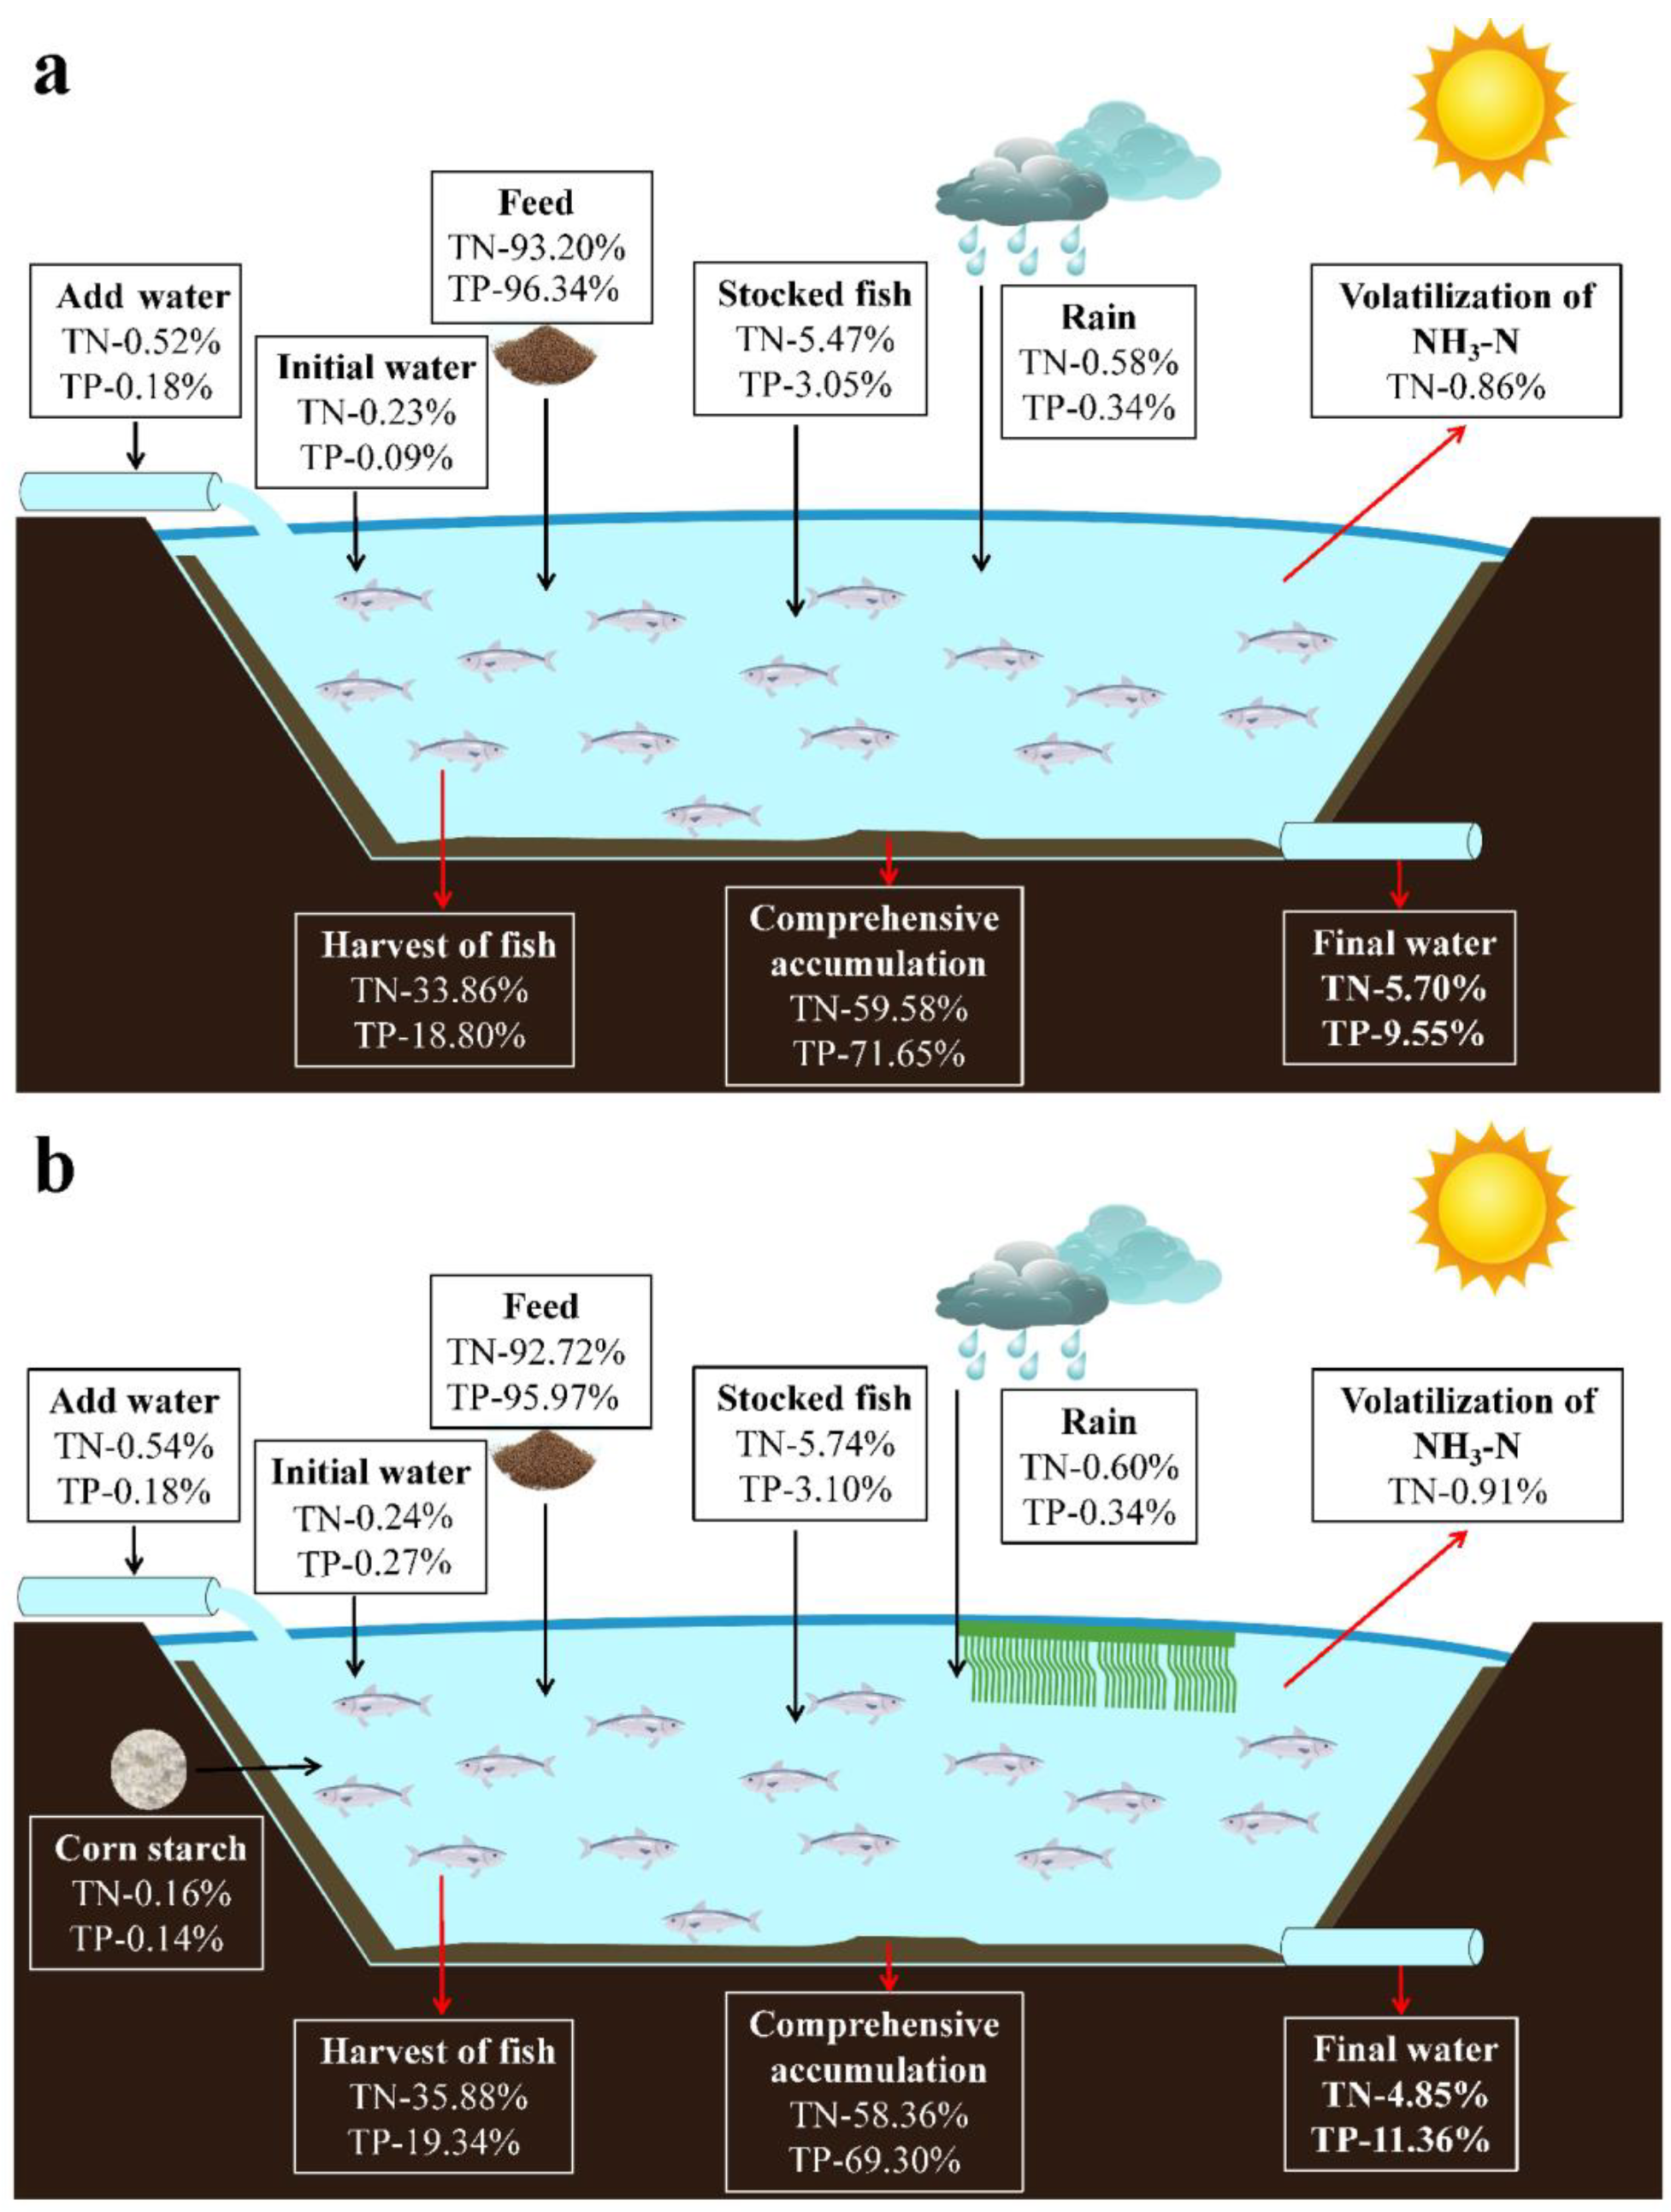
3.3. Nutrient Budgets

The nitrogen and phosphorus budgets in the control and treatment groups are displayed in Table 3. The contributions of each component to the total nutrient input and output for different groups are displayed in Figure 4.
The main source of nitrogen and phosphorus was the feed. The nitrogen and phosphorus feed inputs in the treatment group were both lower than those in the control group (92.72% and 93.20% of the nitrogen, respectively; 95.97% and 96.34% of the phosphorus, respectively). Stocked fish was the second largest pathway of nitrogen and phosphorus inputs in the two groups. The nitrogen and phosphorus inputs in stocked fish in the treatment group were both higher compared to those in the control group (5.74% and 5.47% of the nitrogen, respectively; 3.10% and 3.05% of the phosphorus, respectively). The initial water, rain and added water nitrogen and phosphorus inputs in the treatment and control groups were low, with each input contributing < 1%.
The main nitrogen and phosphorus outputs were through comprehensive accumulation. The comprehensive accumulation nitrogen and phosphorus outputs in the treatment group were both lower than those in the control group (58.36% and 59.58% of the nitrogen, respectively; 69.30% and 71.65% of the phosphorus, respectively). Stocked fish was the second largest pathway of nitrogen and phosphorus outputs in the two groups. The nitrogen and phosphorus inputs through stocked fish in the treatment group were both higher than those in the control group (35.88% and 33.86% of the nitrogen, respectively; 19.34% and 18.80% of the phosphorus, respectively). The nitrogen output from the final water in the treatment group was lower compared to that in the control group (4.85% and 5.70%, respectively), and the phosphorus output from the final water in the treatment group was higher compared to that in the control group (11.36% and 9.55%, respectively). NH3-N volatilization in both groups was low, contributing < 1% in both the treatment and control groups.

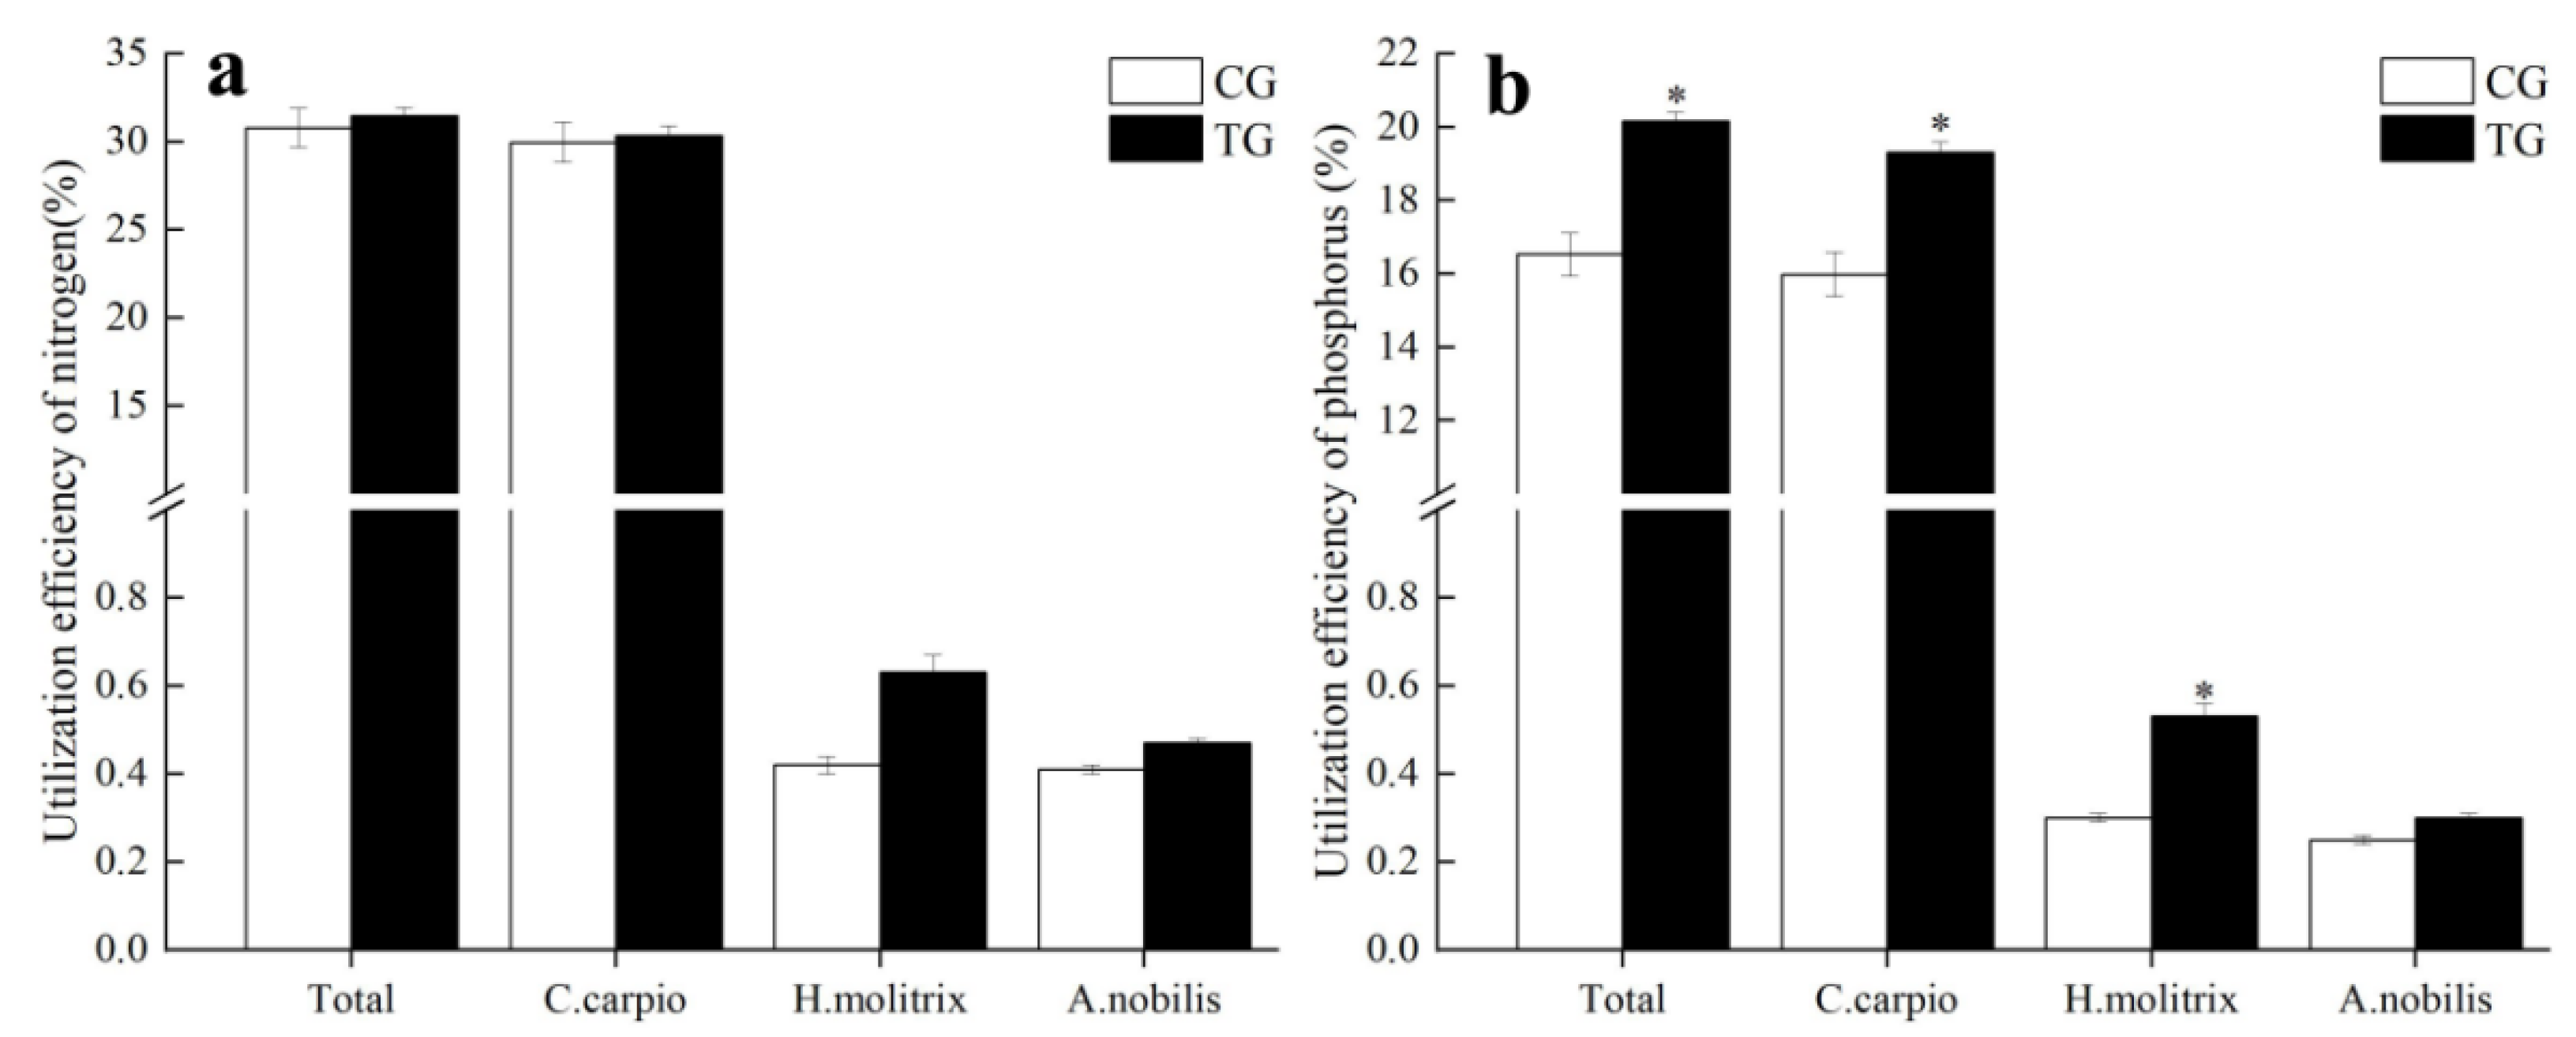
3.4. Nitrogen and Phosphorus Utilization Efficiency by Cultured Fish

The nitrogen and phosphorus utilization efficiencies of the cultured fish, C. carpio, H. molitrix and A. nobilis, are displayed in Figure 5. The nitrogen utilization efficiencies in the treatment group were all higher compared to those in the control group, but no significant differences were detected (p > 0.05). The phosphorus utilization efficiencies were all higher compared to those in the control group, and there were significant differences between them (p < 0.05), except for in H. molitrix.

4. Discussion

Individual substrates or carbon addition based on culture systems are documented to have multiple benefits in aquaculture systems in terms of water quality improvement and growth performance. However, the combined application of these two technologies is lacking. The question of the present study was whether the combination of eco-substrate and carbon addition can improve water quality and the growth performance of fish, and change the nutrient budgets in the pond polyculture system.
In the present study, better water quality was observed in the treatments with eco-substrate and carbon addition than that of the control group. The DO and pH values of the pond water remained within an appropriate range, and no significant differences were observed between the experimental and control groups (p > 0.05). Nitrogenous compounds, including ammonia, nitrite and nitrate, occur naturally in intensive aquaculture systems as metabolites are induced by the mineralization of feed and feces [27]. At high levels, nitrogenous compounds are strong limiting environmental factors that lead to mortality in aquatic animals [28,29]. Ammonia is mainly in the form of NH4+ and NH3, while NH3 is the main toxic substance because it can easily penetrate through the plasma membrane and affect the energy metabolism system of fish [30]. Nitrite and nitrate convert the oxygen-carrying pigment into forms that are unable to carry oxygen, resulting in hypoxia [31]. In the present study, the TAN, nitrite and nitrate concentrations decreased significantly in the experimental groups. The TN content was also significantly lower compared to that in the control group. However, TP and CODMn did not vary significantly between the two groups. Heterotrophic bacteria can assimilate inorganic nitrogen into bacterial components in culture systems that combine BFT with artificial substrates [32]. Nitrogen-cycling bacteria on biofilms can metabolize ammonia, nitrite and nitrate nitrogen into nitrogen [33]. Therefore, the level of inorganic nitrogen decreased in the experimental groups.
Moreover, better growth performance was also observed in the treatment group. Numerous studies have reported that biofloc and artificial substrates are advantageous, providing a food source and significantly improving growth performance in aquatic animals [23,34,35]. H. molitrix and A. nobilis are typical filter-feeding fish that consume food using their gills and rakers [36]. In the present study, the growth performance (FIW, SGR, WGR, TP and NP) of H. molitrix and A. nobilis was significantly higher in the treatment groups compared to the control group, which suggested that biofloc particles were consumed and assimilated by the fish.
Nitrogen and phosphorus are nutrient pollutants of concern that can directly respond to environmental changes. As a result, nitrogen and phosphorus are used as water-quality indicators [37,38]. Quantifying nitrogen and phosphorus budgets can provide an improved understanding of their environmental impacts and allow researchers to develop sustainable aquaculture models [39]. To date, aquaculture nutrient budgets mainly focus on the single substrates or carbon addition technology [18,40]. However, there have been no studies on aquaculture nutrient budgets of combined utilizing eco-substrates and carbon addition. Many studies indicate that feed, fertilizers, stocked animals, added water, rain and biological nitrogen fixation are common sources of nutrients in intensively fed aquaculture systems [41,42,43], in which feed is the major input, accounting for more than 70% of the nitrogen and phosphorus inputs [44,45]. As in the results of previous studies, in the present study, feed provided the greatest inputs of nitrogen (93.07–93.28%) and phosphorus (95.97–96.39%).
Only a small part of the nitrogen and phosphorus nutrients entering the pond are absorbed and utilized by culture organisms, and most of them are suspended in the water in a dissolved or granular state or settled in the sediment [44]. Most research in this area has reported that sediment accumulation makes up the bulk of nutrient outputs in aquaculture systems [18,46]. In the present study, it was determined that comprehensive accumulation, including sediment accumulation, adsorption and loss through seepage, was a major nitrogen and phosphorus output, accounting for 59.20–59.65% and 69.30–71.38% of the nitrogen and phosphorus outputs, respectively. Previous studies have shown that the proportions of adsorption and loss in the seepages of nitrogen and phosphorus are relatively small. In accordance with previous studies, in the present study, it was found that sediment accumulation in the experimental pond was also a major nitrogen and phosphorus pathway. The findings also revealed that the contribution of sediment accumulation to the total phosphorus output was greater than its contribution to nitrogen output in both the experimental and control groups (Figure 4). This may be because the adsorption of phosphorus by sediments is stronger than that of nitrogen [47]. Adding eco-substrates and carbon to the carp aquaculture system affected the nutrient budgets. The nitrogen and phosphorus feed inputs in the treatment group were both lower compared to those in the control group, while the stocked fish nitrogen and phosphorus input in the treatment group were both higher compared to those in the control group, revealing that eco-substrates and added carbon saved feed input and improved the feed utilization rate of fish. This finding was further supported by the observed utilization efficiency (Figure 5).
The nitrogen and phosphorus utilization efficiencies of the cultured fish ranged from 30.79% to 31.44% and 16.53% to 20.15%, respectively. This finding was consistent with the results reported by Zhang et al. [48] and Gao et al. [49], and higher than those reported by Tian et al. [50].

5. Conclusions

The present study determined that the combination of an eco-substrate and carbon addition led to significant decreases in TAN, NO3-N, NO2-N and TN in a pond polyculture system. The eco-substrate and carbon addition also increased the growth performance (FIW, SGR, WGR, TP and NP) of H. molitrix and A. nobilis. In addition, eco-substrate and carbon addition improved the utilization efficiency of nutrients.

Author Contributions

Conceptualization, K.G., Z.Z. and R.Z.; methodology, J.X.; software, K.G.; validation, L.L. and X.H.; formal analysis, W.X.; investigation, S.W.; resources, K.G.; data curation, S.W. and K.G.; writing—original draft preparation, S.W.; writing—review and editing, S.W. and Z.Z.; visualization, S.W.; supervision, W.X. and Z.Z.; project administration, Z.Z.; funding acquisition, Z.Z., W.X. and J.X. All authors have read and agreed to the published version of the manuscript.

Funding

This research was funded by the National Key R&D Program of China (No. 2019YFD0900302, 2020YFD0900304, 2020YED0900402) and the Central Public-Interest Scientific Institution Basal Research Fund, CAFS (NO. 2022XT0501, 2020TD56).

Institutional Review Board Statement

All animal procedures in this study were conducted according to the guidelines for the care and use of laboratory animals of Heilongjiang River Fisheries Research Institute, CAFS. The studies in animals were reviewed and approved by the Committee for the Welfare and Ethics of Laboratory Animals of Heilongjiang River Fisheries Research Institute, CAFS.

Data Availability Statement

The data presented in this study are available on request from the corresponding author.

Acknowledgments

We would like to thank all of the students in our team for their help with the collection of samples.

Conflicts of Interest

The authors declare no conflict of interest.

References

  1. FAO. The State of World Fisheries and Aquaculture 2020. Sustainability in Action; Food and Agriculture Organization of the United Nations: Rome, Italy, 2020. [Google Scholar]
  2. Fiorella, K.J.; Okronipa, H.; Baker, K.; Heilpern, S. Contemporary aquaculture: Implications for human nutrition. Curr. Opin. Biotech. 2021, 70, 83–90. [Google Scholar] [CrossRef] [PubMed]
  3. Bureau of Fisheries and Management, Ministry of Agriculture and Rural Affairs of China. China Fishery Statistical Yearbook of 2021; China Agriculture Press: Beijing, China, 2020. (In Chinese) [Google Scholar]
  4. Páez-Osuna, F. The environmental impact of shrimp aquaculture: Causes, effects, and mitigating alternatives. Environ. Manag. 2001, 28, 131–140. [Google Scholar] [CrossRef] [PubMed]
  5. Yep, B.; Zheng, Y. Aquaponic trends and challenges: A review. J. Clean. Prod. 2019, 228, 1586–1599. [Google Scholar] [CrossRef]
  6. Gross, A.; Boyd, C.E.; Wood, C.W. Nitrogen transformations and balance in channel catfish ponds. Aquac. Eng. 2000, 24, 1–14. [Google Scholar] [CrossRef]
  7. Avnimelech, Y.; Ritvo, G. Shrimp and fish pond soils: Processes and management. Aquaculture 2003, 220, 549–567. [Google Scholar] [CrossRef]
  8. Anh, P.T.; Kroeze, C.; Bush, S.R.; Mol, A.P.J. Water pollution by intensive brackish shrimp farming in south-east Vietnam: Causes and options for control. Agric. Water Manag. 2010, 97, 872–882. [Google Scholar] [CrossRef]
  9. John, E.M.; Krishnapriya, K.; Sankar, T.V. Treatment of ammonia and nitrite in aquaculture wastewater by an assembled bacterial consortium. Aquaculture 2020, 526, 735390. [Google Scholar] [CrossRef]
  10. Santorio, S.; Couto, A.T.; Amorim, C.L.; Rio, A.V.D.; Arregui, L.; Mosquera-Corral, A.; Castro, P.M.L. Sequencing versus continuous granular sludge reactor for the treatment of freshwater aquaculture effluents. Water Res. 2021, 201, 117293. [Google Scholar] [CrossRef]
  11. Pekkoh, J.; Chaichana, C.; Thurakit, T.; Phinyo, K.; Lomakool, S.; Ruangrit, K.; Duangjan, K.; Suwannarach, N.; Kumla, J.; Cheirsilp, B.; et al. Dual-bioaugmentation strategy to enhance the formation of algal-bacteria symbiosis biofloc in aquaculture wastewater supplemented with agricultural wastes as an alternative nutrient sources and biomass support materials. Bioresour. Technol. 2022, 359, 127469. [Google Scholar] [CrossRef]
  12. Zhao, Z.G.; Xu, Q.Y.; Luo, L.; Qiao, G.; Wang, L.S.; Li, J.N.; Wang, C.A. Effect of bio-floc on water quality and the production performance of bottom and filter feeder carp fed with different protein levels in a pond polyculture system. Aquaculture 2021, 531, 735906. [Google Scholar] [CrossRef]
  13. Ebrahimi, A.; Akrami, R.; Najdegerami, E.H.; Ghiasvand, Z.; Koohsari, H. Effects of different protein levels and carbon sources on water quality, antioxidant status and performance of common carp (Cyprinus carpio) juveniles raised in biofloc based system. Aquaculture 2020, 516, 734639. [Google Scholar] [CrossRef]
  14. Gaona, C.A.P.; de Almeida, M.S.; Viau, V.; Poersch, L.H.; Wasielesky, W. Effect of different total suspended solids levels on a Litopenaeus vannamei (Boone, 1931) BFT culture system during biofloc formation. Aquac. Res. 2017, 48, 1070–1079. [Google Scholar] [CrossRef]
  15. Asaduzzaman, M.; Wahab, M.A.; Verdegem, M.C.J.; Huque, S.; Salam, M.A.; Azim, M.E. C/N ratio control and substrate addition for periphyton development jointly enhance freshwater prawn Macrobrachium rosenbergii production in ponds. Aquaculture 2008, 280, 117–123. [Google Scholar] [CrossRef]
  16. Pandey, P.K.; Bharti, V.; Kumar, K. Biofilm in aquaculture production. Afr. J. Microbiol. Res. Rev. 2014, 8, 1434–1443. [Google Scholar] [CrossRef]
  17. Uddin, M.S.; Azim, M.E.; Wahab, M.A.; Verdegem, M.C.J. Effects of substrate addition and supplemental feeding on plankton composition and production in tilapia (Oreochromis niloticus) and freshwater prawn (Macrobrachium rosenbergii) polyculture. Aquaculture 2009, 297, 99–105. [Google Scholar] [CrossRef]
  18. Zhang, K.; Yu, D.G.; Li, Z.F.; Xie, J.; Wang, G.J.; Gong, W.B.; Yu, E.M.; Tian, J.J. Influence of eco-substrate addition on organic carbon, nitrogen and phosphorus budgets of intensive aquaculture ponds of the Pearl River, China. Aquaculture 2020, 520, 734868. [Google Scholar] [CrossRef]
  19. Arnold, S.J.; Coman, F.E.; Jackson, C.J.; Groves, S.A. High-intensity, zeroexchange production of juvenile tiger shrimp, Penaeus monodon: An evaluation of artificial substrates and stocking density. Aquaculture 2009, 293, 42–48. [Google Scholar] [CrossRef]
  20. Kumar, V.S.; Pandey, P.K.; Anand, T.; Bhuvaneswari, R.; Kunmar, S. Effect of periphyton (aquamat) on water quality, nitrogen budget, microbial ecology, and growth parameters of Litopenaeus vannamei in a semi-intensive culture system. Aquaculture 2017, 479, 240–249. [Google Scholar] [CrossRef]
  21. Kumar, S.; Anand, P.S.S.; De, D.; Ghoshal, T.K.; Alavandi, S.V.; Vijayan, K.K. Integration of substrate in biofloc based system: Effects on growth performance, water quality and immune responses in black tiger shrimp, Penaeus monodon culture. Aquac. Res. 2019, 50, 2986–2999. [Google Scholar] [CrossRef]
  22. Ortiz-Estrada, Á.M.; Gollas-Galván, T.; Martínez-Córdova, L.R.; Burgos-Hernández, A.; Scheuren-Acevedo, S.M.; Emerenciano, M.; Martínez-Porchas, M. Diversity and bacterial succession of a phototrophic biofilm used as complementary food for shrimp raised in a super-intensive culture. Aquac. Int. 2019, 27, 581–596. [Google Scholar] [CrossRef]
  23. Addo, F.G.; Zhang, S.H.; Manirakiza, B.; Ohore, O.E.; Yuan, S.D. The impacts of straw substrate on biofloc formation, bacterial community and nutrient removal in shrimp ponds. Bioresour. Technol. 2021, 326, 124727. [Google Scholar] [CrossRef] [PubMed]
  24. SEPA. Monitoring and Analytical Method of Water and Wastewater, 4th ed.; Environmental and Scientific Press of China: Beijing, China, 2002. (In Chinese) [Google Scholar]
  25. GB/T 6437; Determination of Phosphorus in Feed-Spectphotometry. National Standardization Management Council of China: Beijing, China, 2018. (In Chinese)
  26. Weiler, R.R. Rate of loss of ammonia from water to the atmosphere. J. Fish. Res. Board Can. 2011, 36, 685–689. [Google Scholar] [CrossRef]
  27. Ebeling, J.M.; Timmons, M.B.; Bisogni, J.J. Engineering analysis of the stoichiometry of photoautotrophic, autotrophic, and heterotrophic removal of ammonia-nitrogen in aquaculture systems. Aquaculture 2006, 257, 346–358. [Google Scholar] [CrossRef]
  28. Lin, Y.C.; Chen, J.C. Acute toxicity of nitrite on Litopenaeus vannamei (Boone) juveniles at different salinity levels. Aquaculture 2003, 224, 193–201. [Google Scholar] [CrossRef]
  29. Esam, F.; Khalafalla, M.M.; Gewaily, M.S.; Abdo, S.; Hassan, A.M.; Dawood, M.A.O. Acute ammonia exposure combined with heat stress impaired the histological features of gills and liver tissues and the expression responses of immune and antioxidative related genes in Nile tilapia. Ecotox. Environ. Saf. 2022, 231, 113187. [Google Scholar] [CrossRef]
  30. Foss, A.; Imsland, A.K.; Roth, B.; Schram, E.; Stefansson, S.O. Effects of chronic and periodic exposure to ammonia on growth and blood physiology in juvenile turbot (Scophthalmus maximus). Aquaculture 2009, 296, 45–50. [Google Scholar] [CrossRef]
  31. Jensen, F.B. Nitrite disrupts multiple physiological functions in aquatic animals. Comp. Biochem. Physiol. A 2003, 135, 9–24. [Google Scholar] [CrossRef]
  32. Lezama-Cervantes, C.; Paniagua-Michel, J. Effects of constructed microbial mats on water quality and performance of Litopenaeus vannamei post-larvae. Aquac. Eng. 2010, 42, 75–81. [Google Scholar] [CrossRef]
  33. Collos, Y.; Vaquer, A.; Bibent, B.; Souchu, P.; Slawyk, G.; Garcia, N. Response of coastal phytoplankton to ammonium and nitrate pulses: Seasonal variations of nitrogen uptake and regeneration. Aquat. Ecol. 2003, 37, 227–236. [Google Scholar] [CrossRef]
  34. Azim, M.E.; Little, D.C. The biofloc technology (BFT) in indoor tanks: Water quality, biofloc composition, and growth and welfare of Nile Tilapia (Oreochromis niloticus). Aquaculture 2008, 283, 29–35. [Google Scholar] [CrossRef]
  35. Audelo-Naranjo, J.M.; Martínez-Córdova, L.R.; Voltolina, D.; Gómez-Jiménez, S. Water quality, production parameters and nutritional condition of Litopenaeus vannamei (Boone, 1931) grown intensively in zero water exchange mesocosms with artificial substrates. Aquac. Res. 2011, 42, 1371–1377. [Google Scholar] [CrossRef]
  36. Dong, S.L.; Li, D.S. Comparative studies on the feeding selectivity of silver carp Hypophthalmichthys molitrix and bighead carp Aristichthys nobilis. J. Fish Biol. 1994, 44, 621–626. [Google Scholar] [CrossRef]
  37. Li, H.; Song, C.L.; Cao, X.Y.; Zhou, Y.Y. The phosphorus release pathways and their mechanisms driven by organic carbon and nitrogen in sediments of eutrophic shallow lakes. Sci. Total Environ. 2016, 572, 280–288. [Google Scholar] [CrossRef]
  38. Cao, L.; Wang, W.M.; Yang, Y.; Yang, C.T.; Yuan, Z.H.; Xiong, S.B.; Diana, J. Environmental impact of aquaculture and countermeasures to aquaculture pollution in China. Environ. Sci. Pollut. Res. 2007, 14, 452–462. [Google Scholar] [CrossRef]
  39. Teichert-Coddington, D.R.; Martinez, D.; Ramırez, E. Partial nutrient budgets for semi-intensive shrimp farms in Honduras. Aquaculture 2000, 190, 139–154. [Google Scholar] [CrossRef]
  40. Jackson, C.; Preston, N.; Thompson, P.J.; Burford, M. Nitrogen budget and effluent nitrogen components at an intensive shrimp farm. Aquaculture 2003, 218, 397–411. [Google Scholar] [CrossRef]
  41. Thakur, D.P.; Lin, C.K. Water quality and nutrient budget in closed shrimp (Penaeus monodon) culture systems. Aquac. Eng. 2003, 27, 159–176. [Google Scholar] [CrossRef]
  42. Cao, B.X.; Abakari, G.; Luo, G.Z.; Tan, H.X.; Wu, X. Comparative analysis of nitrogen and phosphorus budgets in a bioflocs aquaculture system and recirculation aquaculture system during over-wintering of tilapia (GIFT, Oreochromis niloticus). Aquac. Eng. 2020, 89, 102026. [Google Scholar] [CrossRef]
  43. David, F.S.; ProencA, D.C.; Valenti, W.C. Nitrogen budget in integrated aquaculture systems with Nile tilapia and Amazon river prawn. Aquac. Int. 2017, 25, 1733–1746. [Google Scholar] [CrossRef]
  44. Sahu, B.C.; Adhikari, S.; Dey, L. Carbon, nitrogen and phosphorus budget in shrimp (Penaeus monodon) culture ponds in eastern India. Aquac. Int. 2013, 21, 453–466. [Google Scholar] [CrossRef]
  45. Alarcón-Silvas, S.G.; León-Cañedo, J.A.; Fierro-Sañudo, J.F.; Ramírez-Rochín, J.; Fregoso-López, G.; Frías-Espericueta, M.G.; Osuna-Martínez, C.C.; Páez-Osuna, F. Water quality, water usage, nutrient use efficiency and growth of shrimp Litopenaeus vannamei in an integrated aquaponic system with basil Ocimum basilicum. Aquaculture 2021, 543, 737023. [Google Scholar] [CrossRef]
  46. Adhikari, S.; Sahu, B.C.; Dey, L. Nutrients budget and effluents characteristics in polyculture of scampi (Macrobrachium rosenbergii) and Indian major carps ponds using organic inputs. Water Sci. Technol. 2012, 66, 1540–1548. [Google Scholar] [CrossRef] [PubMed]
  47. Briggs, M.R.P.; Funge-Smith, S.J. A nutrient budget of some intensive marine shrimp ponds in Thailand. Aquac. Res. 1994, 25, 789–811. [Google Scholar] [CrossRef]
  48. Zhang, K.; Xie, J.; Yu, D.G.; Wang, G.J.; Yu, E.M.; Gong, W.B.; Li, Z.F.; Wang, C.C.; Xia, Y. A comparative study on the budget of nitrogen and phosphorus in polyculture systems of snakehead with bighead carp. Aquaculture 2018, 483, 69–75. [Google Scholar] [CrossRef]
  49. Gao, X.L.; Zhang, M.; Li, X.; Wu, F.C.; Liu, Y. Nitrogen and phosphorus budget of a Haliotis discus hannai and Apostichopus japonicus polyculture system. Aquac. Res. 2019, 50, 1005–1019. [Google Scholar] [CrossRef]
  50. Tian, X.L.; Li, D.S.; Dong, S.L.; Yan, X.Z.; Qi, Z.X.; Liu, G.C.; Lu, J. An experimental study on closed-polyculture of penaeid shrimp with tiapia and constricted tagelus. Aquaculture 2001, 202, 57–77. [Google Scholar] [CrossRef]
Figure 1. Changes of water quality parameters in the control and treatment group during the experiment. (a) Temperature; (b) pH; (c) DO; (d) COND. Vertical bars represent the mean ± SD (n = 3).
Fishes 07 00212 g001
Figure 2. Changes of water quality parameters in the control and treatment group during the experiment. (a) TAN; (b) NO3-N; (c) NO2-N; (d) PO4-P. Vertical bars represent the mean ± SD (n = 3).
Fishes 07 00212 g002
Figure 3. Changes of water quality parameters in the control and treatment group during the experiment. (a) TN; (b) TP; (c) COD. Vertical bars represent the mean ± SD (n = 3).
Fishes 07 00212 g003
Figure 4. Nutrient budget in the control (a) and treatment groups (b).
Fishes 07 00212 g004
Figure 5. Utilization efficiency of nitrogen and phosphorus by the cultured animals in different groups. (a) Nitrogen; (b) phosphorus. The data with different letters in the same item showed significant differences (* p < 0.05).
Fishes 07 00212 g005
Table 1. Water quality parameters in different groups at the end of the experiment.
Water Quality ParametersControl GroupTreatment Group
DO (mg/L)10.2 ± 0.4710.72 ± 0.86
pH8.39 ± 0.158.56 ± 0.13
COND (μs/cm)0.422 ± 0.0200.417 ± 0.003
TAN (mg/L)0.63 ± 0.020.52 ± 0.02 *
NO3-N (mg/L)7.06 ± 0.553.88 ± 0.63 *
NO2-N (mg/L)0.65 ± 0.200.20 ± 0.07 *
TN (mg/L)15.46 ± 2.639.60 ± 1.24 *
TP (mg/L)1.04 ± 0.461.00 ± 0.12
CODMn (mg/L)9.69 ± 0.259.80 ± 0.12
Note: Data presented as mean ± standard deviation (SD; n = 3). Significant differences between control and treatment group are indicated with “*” (p < 0.05).
Table 2. Growth performance of C. carpio, H. molitrix and A. nobilis in different groups.
IndicatorControl GroupTreatment Group
C. carpio
Final individual weight (g/ind)1214.60 ± 24.191226.09 ± 21.46
Specific growth rate (%/d)1.41 ± 0.021.42 ± 0.02
Weight gain rate (%)5.29 ± 0.135.35 ± 0.11
Survival rate (%)97.06 ± 0.9597.64 ± 0.13
Total production (kg/ha)16,116.94 ± 433.6916,321.38 ± 240.94
Net production (kg/ha)11,987.19 ± 384.6312,186.68 ± 228.67
H. molitrix
Final individual weight (g/ind)255.00 ± 7.07360.75 ± 8.36 *
Specific growth rate (%/d)1.33 ± 0.021.59 ± 0.02 *
Weight gain rate (%)4.60 ± 0.166.93 ± 0.18 *
Survival rate (%)100.00 ± 0.00100.00 ± 0.00
Total production (kg/ha)188.87 ± 6.16232.80 ± 22.99 *
Net production (kg/ha)145.44 ± 6.16176.30 ± 5.55 *
A. nobilis
Final individual weight (g/ind)729.33 ± 23.80848.48 ± 21.43 *
Specific growth rate (%/d)2.36 ± 0.032.47 ± 0.02 *
Weight gain rate (%)20.38 ± 0.7023.87 ± 0.63 *
Survival rate (%)100.00 ± 0.00100.00 ± 0.00
Total production (kg/ha)695.83 ± 22.70809.51 ± 20.44 *
Net production (kg/ha)686.99 ± 22.70800.68 ± 20.44 *
Note: Data presented as mean ± standard deviation (SD; n = 3). Significant differences between control and treatment group are indicated with “*” (p < 0.05).
Table 3. TN and TP budget for different groups.
ItemsTN (kg/ha)TP (kg/ha)
Control GroupTreatment GroupControl GroupTreatment Group
InputsFeed1083.96 ± 39.951037.84 ± 24.46169.37 ± 6.24162.16 ± 7.64
Stocked fish63.59 ± 1.5164.13 ± 0.235.36 ± 0.135.40 ± 0.02
Corn starch-1.82 ± 0.00-0.24 ± 0.00
Initial water2.64 ± 0.0022.64 ± 0.0010.15 ± 0.0010.15 ± 0.003
Rain6.74 ± 0.0036.74 ± 0.0020.60 ± 0.0020.60 ± 0.002
Add water6.08 ± 0.0016.08 ± 0.0040.32 ± 0.0020.32 ± 0.001
Total1163.01 ± 39.361119.24 ± 48.69173.99 ± 0.12162.16 ± 0.06
OutputsHarvest of fish393.45 ± 7.05401.29 ± 5.1933.03 ± 0.8233.67 ± 0.42
Final water66.42 ± 7.8457.69 ± 7.1516.77 ± 1.3817.83 ± 3.75
Volatilization of NH3-N10.05 ± 0.759.94 ± 0.54--
Comprehensive accumulation681.72 ± 9.31688.44 ± 0.47124.20 ± 1.67120.98 ± 1.57
Note: Data presented as mean ± standard deviation (SD; n = 3). Significant differences between control and treatment group are indicated with “*” (p < 0.05).
Publisher’s Note: MDPI stays neutral with regard to jurisdictional claims in published maps and institutional affiliations.

