Article

Effect of Ultrafine Bubbles on Various Stocking Density of Striped Catfish Larviculture in Recirculating Aquaculture System

1
Department of Biotechnology, Post Graduate School, Universitas Padjadjaran, Jalan Dipati Ukur No. 35, Bandung 40132, Indonesia
2
Functional Nano Powder University Center of Excellence (FiNder U CoE), Universitas Padjadjaran, Jalan Raya Bandung-Sumedang KM 21, Jatinangor, Sumedang 45363, Indonesia
3
Department of Fisheries, Faculty of Fisheries and Marine Science, Universitas Padjadjaran, Jalan Raya Bandung-Sumedang KM 21, Jatinangor, Sumedang 45363, Indonesia
4
Department of Physics, Faculty of Mathematics and Natural Sciences, Universitas Padjadjaran, Jalan Raya Bandung-Sumedang KM 21, Jatinangor, Sumedang 45363, Indonesia
*
Author to whom correspondence should be addressed.
Fishes 2022, 7(4), 190; https://doi.org/10.3390/fishes7040190
Submission received: 28 June 2022 / Revised: 26 July 2022 / Accepted: 26 July 2022 / Published: 29 July 2022
(This article belongs to the Section Sustainable Aquaculture)

Abstract

:
The effects of ultrafine bubbles on the high stock density of striped catfish larvae in a recirculating aquaculture system (RAS) are described in this research (UFBs-RAS). In this study, the various stock densities of striped catfish were investigated regarding the effect of oxygen saturation on the yolk sac absorption rate, length growth rate, and yolk sac utilization efficiency at the endogenous stage. The survival rate, the specific growth rate (weight, length, and biomass), and the gross feeding efficiency were examined at an exogenous stage. The results showed that the ultrafine bubbles generator in the recirculating aquaculture system (UFBs-RAS) provide the dissolved oxygen concentration up to 128.97%sat. The oxygen saturated state in FBs-RAS at the stock density 100 fish/L (D100) provided high yolk sac utilization efficiency in the endogenous stage and high survival, specific growth rate, and gross feeding efficiency in the exogenous stage. It was emphasized that the performance was possible due to surplus oxygen up to 1.58 mg/L at the stock density of 100 fish/L and accomplished minimum ammonia (NH3-N) content much lower than the limit (0.12 µg/L). Thus, the striped catfish larviculture with UFBs-RAS-provided oxygen balance subsequently improved the production rate significantly with cost-effective production.

1. Introduction

The culture of striped catfish (Pangasianodon hypophthalmus) is one of the essential aquaculture commodities worldwide. As of 2018, global striped catfish production, according to Food and Agriculture Organization was about 2,359,500 tons [1]. In the Asian region, significant production levels resulted in Vietnam [2] and other countries such as Myanmar, Bangladesh, India, and Indonesia [3]. Based on the report of the Ministry of Marine Affairs and fisheries of Indonesia, the production of striped catfish was around 319,966 tons, contributing to 3% of the total aquaculture production [4], and an increased production of about 426,475 tons was reported in 2020 [5]. However, certain factors need to be addressed in sustaining the quality and quantity of striped catfish larviculture.
With increasing stock density in larviculture, it becomes challenging to address the extremely high mortality (e.g., 60–70%) at the early larvae stages in order to achieve economic efficiency [6,7]. In addition, striped catfish larviculture has complications that lead to a low survival rate within hours after hatching [8]. Cannibalistic behavior occurs when the water quality is poor in the rearing media, owing to the production of ammonia due to inadequacy of dissolved oxygen (hypoxia), resulting in frequent larval stress [9]. Furthermore, poor water quality with ammonia content above the upper threshold certainly causes toxicity to larva, which subsequently elevates their mortality. Slembrouck et al. [10] reported the upper threshold of ammonia to be 0.22 mg/L for the striped catfish larva at a density of 90 fish/L with a feeding level 9 (the number of artemia nauplii delivered per meal for a fish stocked, e.g., 9 artemia nauplii per fish), while the lower threshold of oxygen content should be 4.4 mg/L.
Conventional techniques were implemented to manage the exceptionally high mortality rate, mainly by introducing a low stock density. However, this approach requires utilization of large unit area, which is extremely expensive with a low production rate. Increasing stock density in larvae media is an alternative approach to develop the production rate by means of appropriate water treatment and air pumping to uphold the prerequisite dissolved oxygen, since water exchange is critical to conserve the water quality and dissolved oxygen in high stock density. However, both techniques are expensive in maintaining the water quality since it entails the use of additional electrical energy requirement. Certainly, larvae media without water treatment or exchange may breakdown to fulfill the water quality requirement, instigating stress in the cultured species, retarded growth, low survival, and loss in yield [10]. Hence, water quality is the most imperative factor that affects the growth and welfare of cultured organisms in high stock density.
The Recirculating Aquaculture System (RAS) is introduced as a solution in larviculture to preserve the water quality and improve the cost efficiency. Moreover, RAS confirms high-quality, safe, and healthy larvae products [11]. Aeration generation becomes mandatory to deliver adequate biological oxygen demand (BOD) and suitable water treatments when RAS is used in high-density larviculture [12]. Thus, to deliver sufficient dissolved oxygen, larva media should be in a saturated condition, but saturated dissolved oxygen does not affect physiological or metabolic activities of larvae [13]. Liquid oxygen is usually employed through an aeration system to create larva media in saturated conditions [11]. However, this technique suffers from the disadvantages of low efficiency, high energy consumption, and the use of complex devices, and it requires sophisticated management systems [11].
The aeration technology was established using a bubble generator with average size of 500 nm (ultrafine bubbles) in recirculating aquaculture system (RAS) for the development of striped catfish larvae in saturated conditions [14]. This is feasible due to the formation of ultrafine bubble (submicron and nanobubbles, ISO 20480-1:2017) with high concentration of dissolved oxygen, since smaller-sized bubbles effectively escalate the oxygen transfer rate and enhance the residence time in the media [15]. An ultrafine bubble generator (UFBs) with controlled the air flow rate in the mixing chamber of the generator to deliver reserved oxygen potential which can eradicate ammonia [14,16]. However, there is no report on the effect of ultrafine bubble application for the production of high larvae density. In addition, ultrafine bubbles are expected to reduce the water dynamic that may cause stress to the larvae that usually occurs under a conventional aeration process. The present study aims to investigate the effect of saturated oxygen on the high stock density of striped catfish larviculture using recirculating aquaculture systems (RAS) by means of UFBs. The various stock density was investigated in correlation to the saturated condition with observed feeding efficiency and mortality [17] at both the endogenous (utilizing yolk sac reserves) and exogenous stages (relying on external feeds). The UFBs has been introduced to balance oxygen distribution of larvae media to allow high stock density of striped catfish larviculture. These performances potentially provide cost-effective and sustainable aquaculture production.

2. Materials and Methods

2.1. Larvae Description and Experimental Design

The larvae used in this experiment were obtained from fishpond production of catfish larvae at North Marine and Fisheries (NMF) Cijengkol Subang, West Java, Indonesia (6.35503S; 107.66292E). The best practice of NMF on artificial spawning and egg fertilization was performed according to the Indonesian National Standard [18]. The fertilized eggs in the morula stage were transported in a closed packaging system using a plastic bag filled with pure oxygen to the laboratory for aquaculture and water treatment, at Functional Nano Powder Centre of Excellence, Universitas Padjadjaran Indonesia (6.920410S; 107.773969E). Then, the fertilized eggs were incubated for 20–26 h, at 26–27 °C, in an aquarium of (100 × 50 × 50) cm3 filled with 200 L of water with stocking density of 10 eggs/cm3 [18]. After incubation, the larvae were transferred into rearing media for four different treatments using various stock densities. The stock densities were varied as follows: 40 fish/L (D40C), 80 fish/L (D80), 100 fish/L (D100), and 120 fish/L (D120), respectively, and four replications were performed in rearing media (15 L), making it a completely randomized experimental design. The treatment with a stock density of 40 fish/L was considered as control; this density refers to the optimal density in conventional rearing, according to the Indonesian National Standard [18]. The four treatments were carried out in the UFBs-RAS system, where the experimental units were assigned to each of the four treatments with similar water quality including saturated oxygen water supply and temperature.

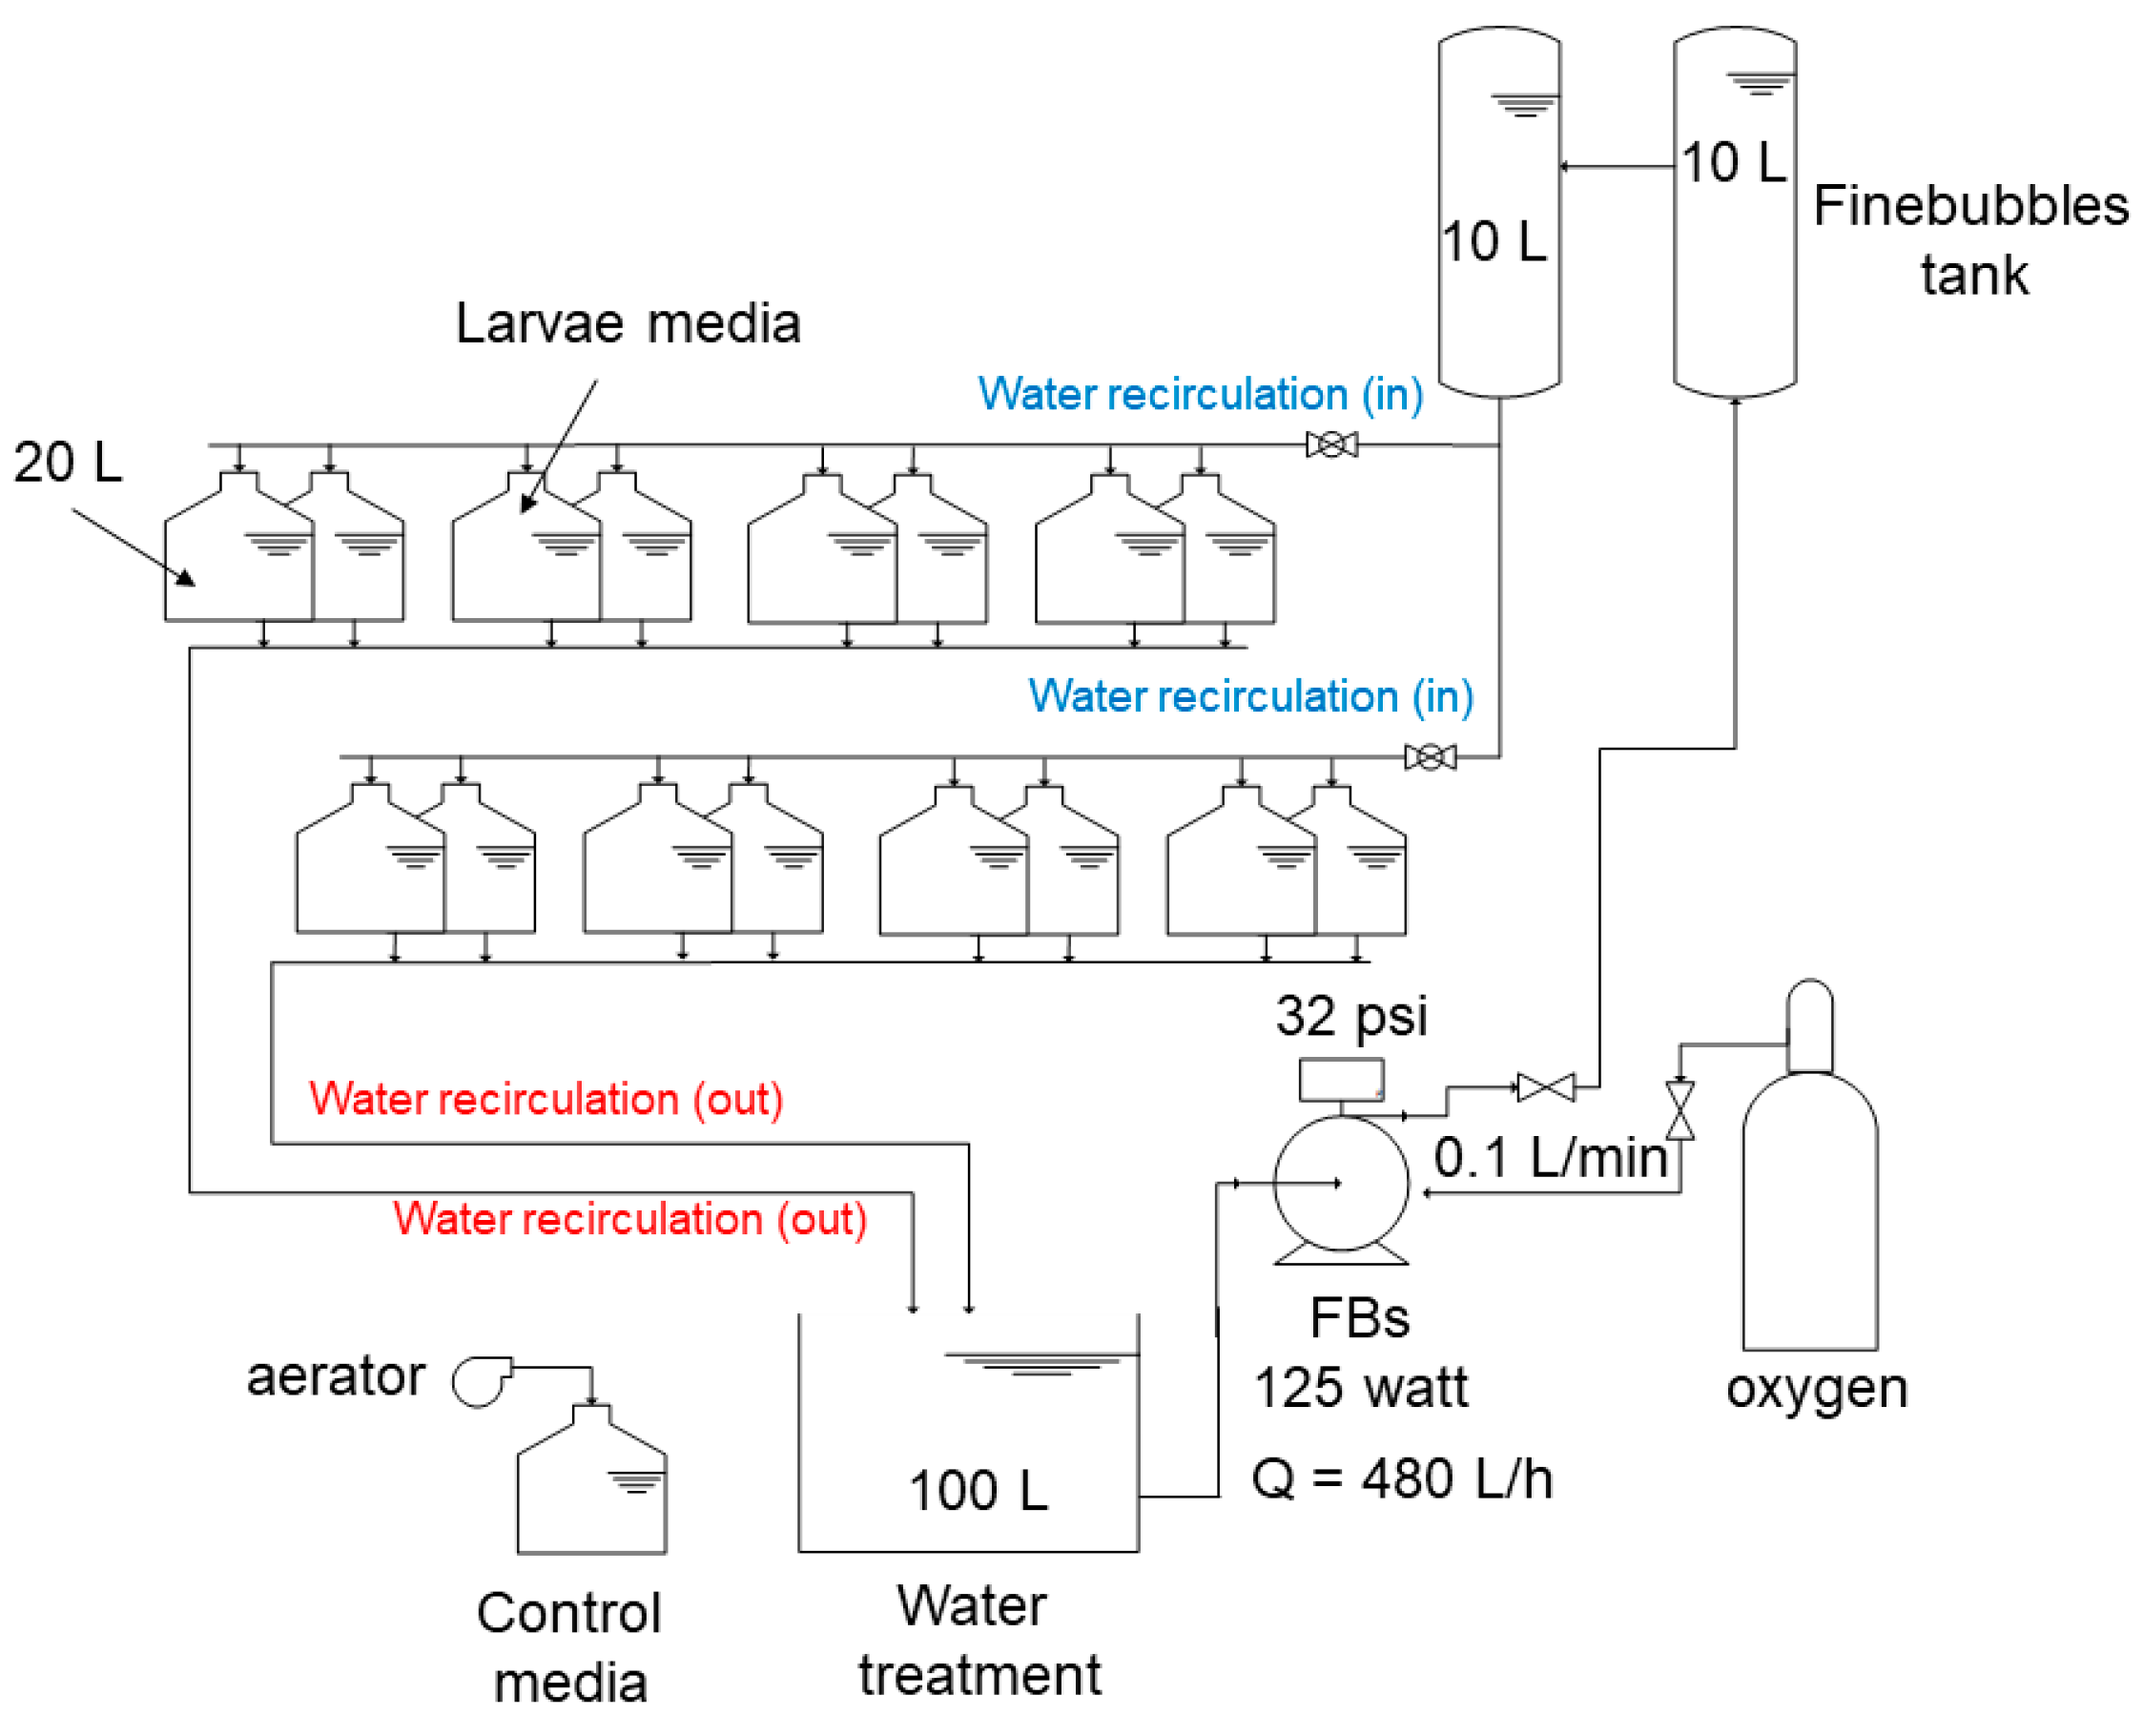
2.2. RAS Design and Operation

The experimental equipment of UFBs-RAS larviculture striped catfish was set up according to design as shown in Figure 1. The installation consists of two primary containers intended for ultrafine bubbles tanks (20 L capacity), 16 cylindrical tanks (20 L capacity), and a container (100 L) designed individually for larvae media and water treatment. The aeration in UFBs-RAS utilizes UFBs generator (125-Watt) connected to the ultrafine bubbles tank with oxygen flow rate of 0.1 L/min [14], while the water flow rate in the RAS system was adjusted to 0.5 L/min, and the larvae media were filled with 15 L of freshwater. The water treatment box consists of a filter mat, japmat, and mineral filter (zeolite). Additionally, the water temperature of the UFBs-RAS system was maintained at a constant temperature of 26–27 °C using a thermostat heater (150-Watt).

2.3. Ultrafine Bubbles and Water Quality Analysis

The size distribution and zeta potential of bubbles from the ultrafine bubbles tank were measured using Horiba Nanoparticle analyzer SZ 100 series instrument. The water quality parameters were determined based on observed dissolved oxygen, temperature, pH, and ammonia content. The water quality profile was measured in the ultrafine bubbles tank and inlet of the water treatment box. The dissolved oxygen and temperature were measured using a dissolved oxygen portable meter of Milwaukee M1605. The pH and ammonia contents were measured correspondingly using Milwaukee MW 101 and a commercial test kit (Sera Aqua Test Box).

2.4. Larvae Performances

2.4.1. Percent Volume of the Yolk Sac

The percent volume of the yolk sac of larvae during the endogenous stage was determined based on the yolk sac length and height. Initially, five samples of larvae were taken from each larva media after 36 h hatching (hah) with 3 h intervals. The larva samples were anesthetized by a fish stabilizer (1 mL/4 Lwater) and the yolk sac photograph was captured using a binocular microscope (Olympus CX 23). The yolk sac length and height were analyzed by ImageJ software (version 1.53k) to obtain the yolk sac volume using Equation (1), according to [19].
V = π 6 L H 2
where:
  • V = yolk sac volume (mm3)
  • L = yolk sac length (mm)
  • H = yolk sac height (mm)

2.4.2. Yolk Sac Absorption Rate

The rate of yolk absorption was determined by the change in yolk sac volume from that in the initial endogenous stage (V0) to that in the final volume (Vt) using Equation (2), according to [20].
g = ( l n V 0 l n V t t i ) 100 %
where:
  • g = yolk sac absorption rate (%)
  • V0 = early volume of the yolk sac (mm3)
  • Vt = final volume of the yolk sac at 36 hah (mm3)
  • ti = time (hours)

2.4.3. Length Growth Rate

The length of larvae was measured by collecting five samples of larvae from each tank at the beginning and the end of the sampling period (36 hah). The larvae samples were prepared in Petri dish and then captured images were obtained using a binocular microscope (Olympus CX 23). The images of larvae samples were analyzed using ImageJ software (version 1.53k) to obtain the length of larvae. The length growth rate was calculated using Equation (3), according to [20].
α = ( l n L t l n L 0 t i ) 100 %
where:
  • α = length growth rate (%)
  • Lt = average length of fish at the end of the sampling period (mm)
  • L0 = average length of fish at the beginning of the sampling period (mm)
  • ti = time (hours)

2.4.4. Yolk Sac Utilization Efficiency

Yolk sac utilization efficiency is the amount of body tissue formed from yolk sac absorption. The yolk sac utilization efficiency was calculated based on the length growth rate and yolk sac absorption rate from 5 samples of larvae for each tank using Equation (4), according to [20].
E P = α g × 100 %
where:
  • EP = yolk sac utilization rate (%)
  • α = length growth rate (%)
  • g = yolk sac absorption rate (%)

2.4.5. Survival Rate

Survival rate was calculated using Equation (5), based on the percentage ratio of the number of fish harvested divided by the number of fish stocked after the exogenous stage period (192 hah) [10].
S R = ( N t n N t 0 ) × 100 %
where:
  • SR = survival rate (%)
  • Ntn = total fish at end exogenous stage (fish)
  • Nt−0 = total fish at the initial exogenous stage (fish)

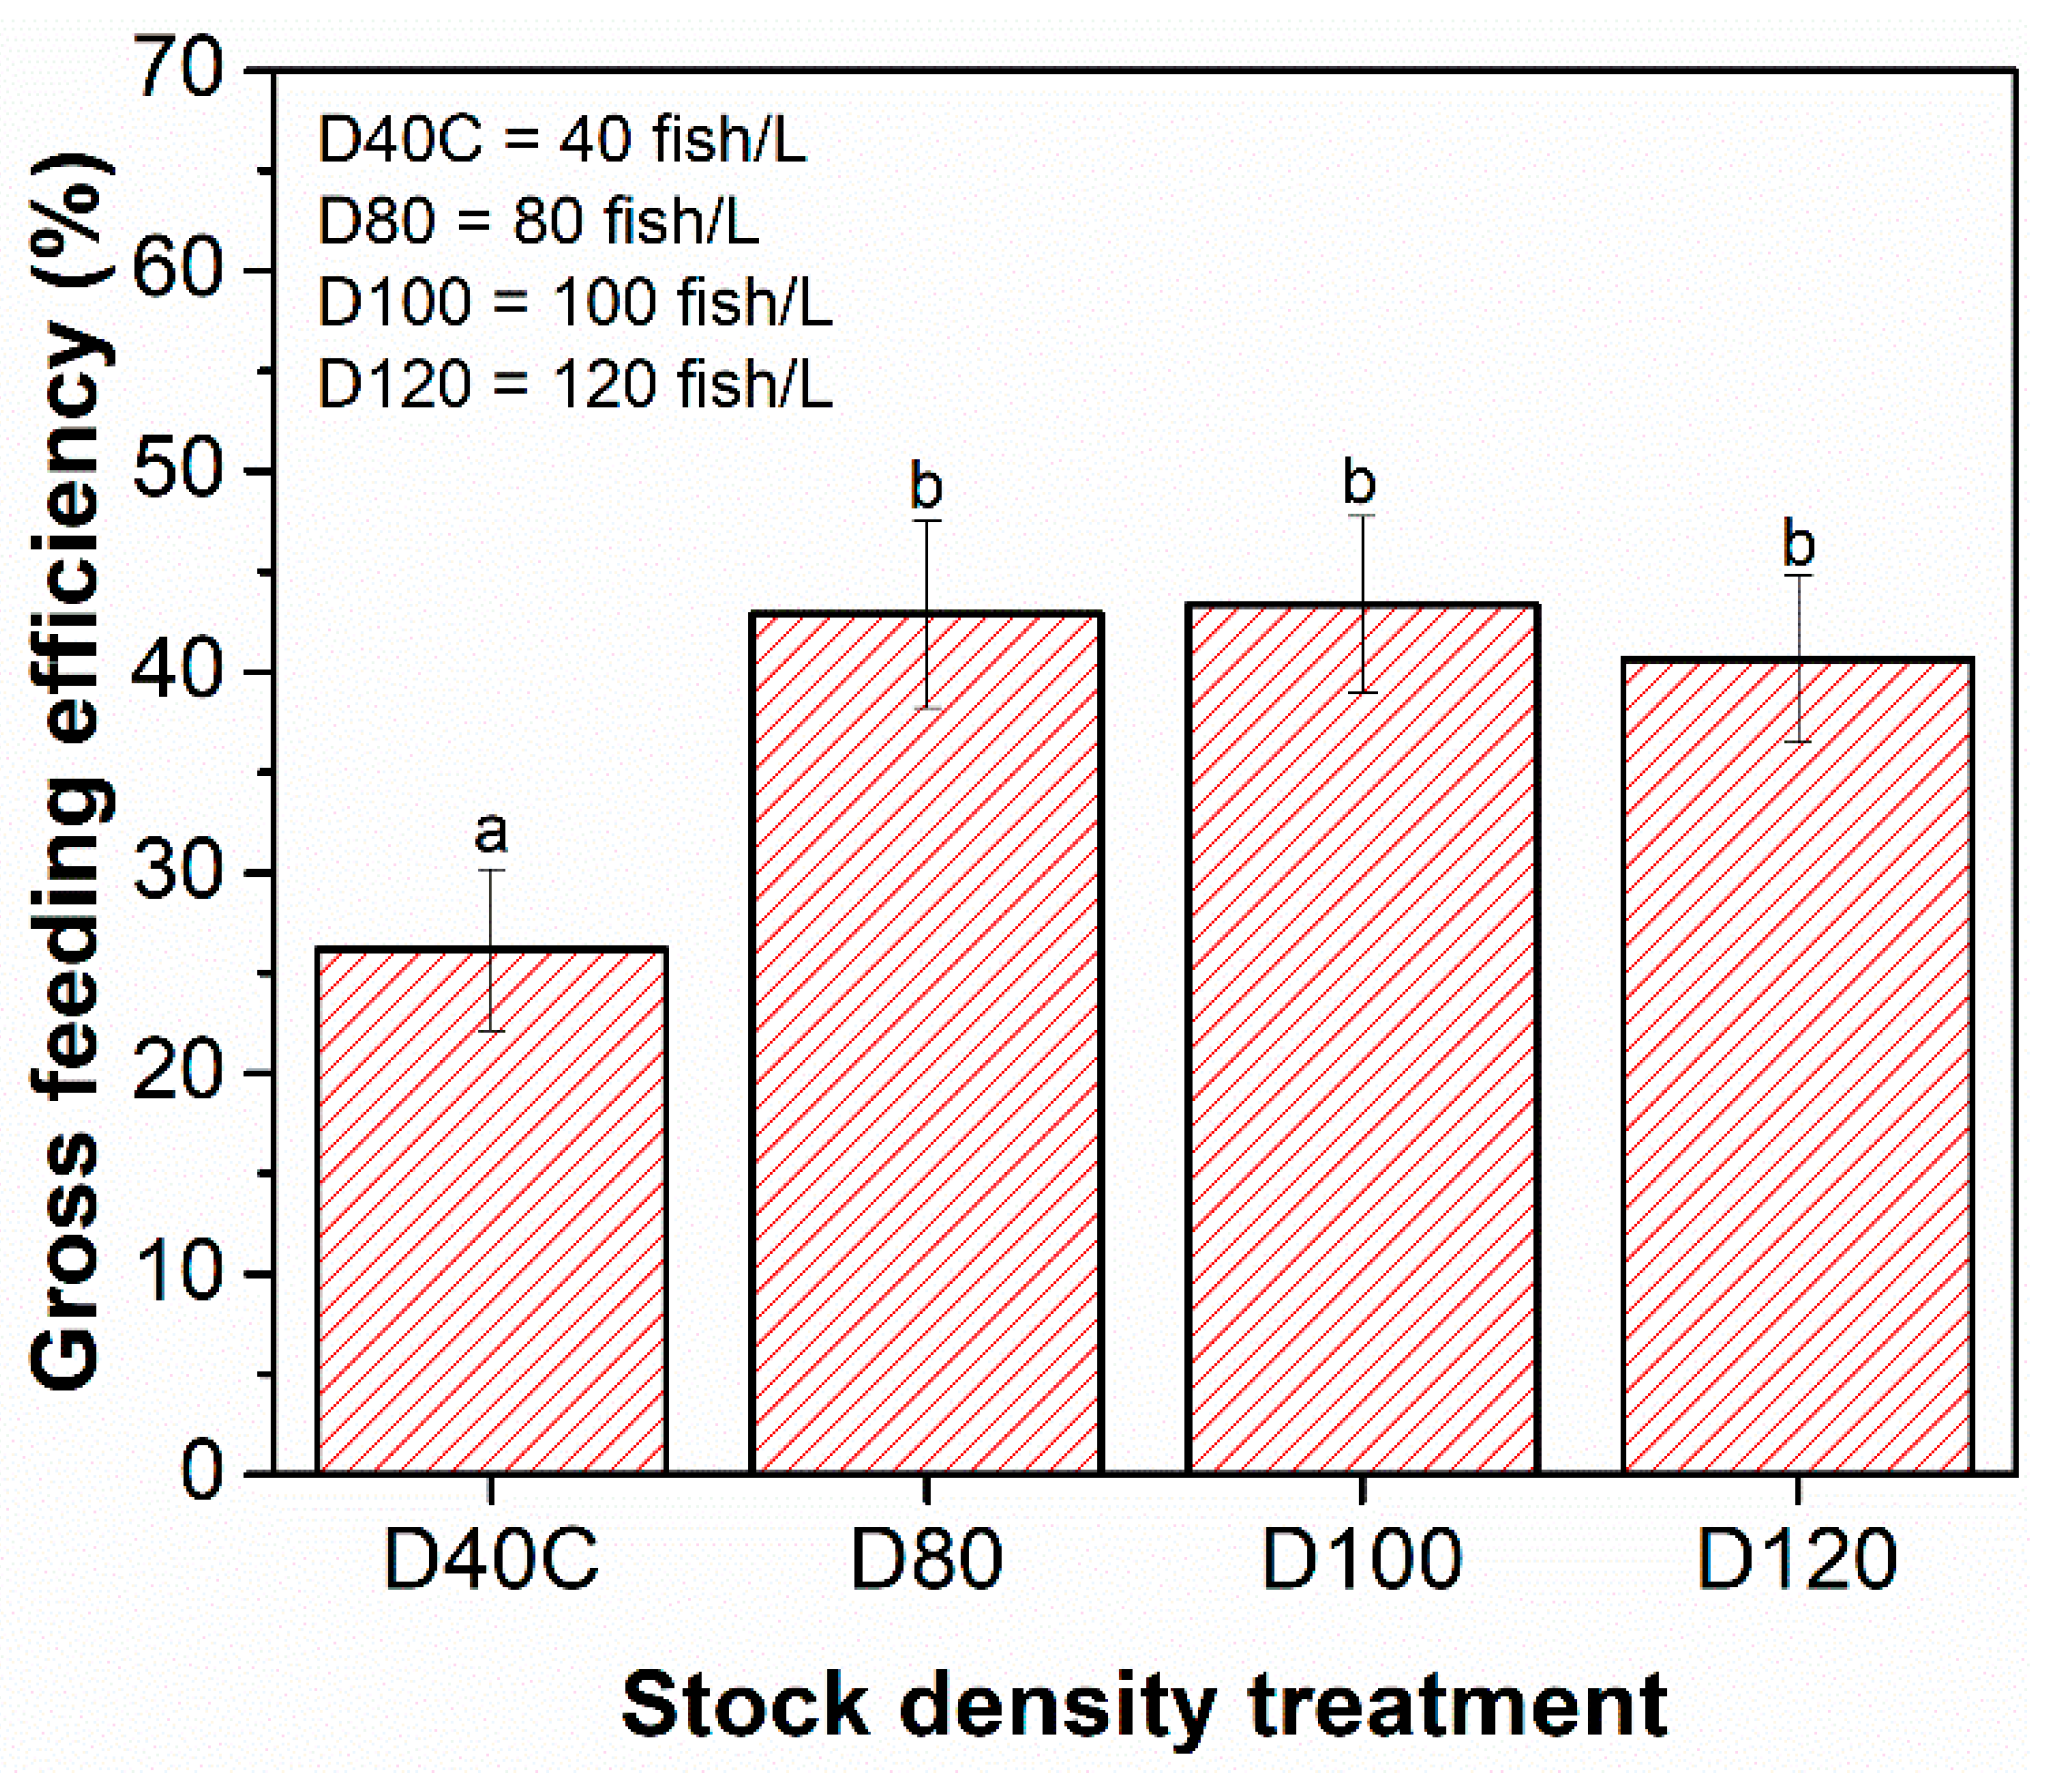
2.4.6. Gross Feeding Efficiency

Gross feeding efficiency (GFE) is calculated using Equation (6), based on the biomass different from the final and initial exogenous stage divided by total feed intake (artemia nauplii) [21].
G F E = ( W f W i F i ) 100 %
where:
  • Wf = final weight of exogenous stage (mg)
  • Wi = initial weight of exogenous stage (mg)
  • Fi = feed intake of artemia nauplii (mg)

2.4.7. Specific Growth Rate

The performance of larvae production is determined in terms of the specific growth rate (SGR) with respect to weight, length, and biomass per day using Equations (7)–(9).
S G R = ( l n W f l n W i t   ( d a y s ) ) × 100 %
where:
  • Wf = average final weight of fish (mg)
  • Wi = average initial weight of fish (mg)
  • t = exogenous stage periods (5 days)
S G R = ( l n L f l n L i t   ( d a y s ) ) 100 %
where:
  • Lf = final length of exogenous stage (mm)
  • Li = initial length of exogenous stage (mm)
  • t = exogenous stage periods (5 days)
S G R = ( l n W b i o . f l n W b i o . i t   ( d a y s ) ) × 100 %
where:
  • Wbio.f = average final weight of biomass (g)
  • Wbio.i = average initial weight of biomass (g)
  • t = exogenous stage periods (5 days)

2.5. Statistical Analysis

The data were analyzed to identify the inconsistent values and tested for the normality using Shapiro–Wilk test, since the number of data is less than 50. If the data were not normally distributed, the data were transformed for normalization and application of an additional square root test. The One-Way ANOVA at the endogenous stage was conducted on yolk sac absorption rate, length growth rate, and yolk sac utilization efficiency, and was followed by Tukey’s test. While at the exogenous stage, One-Way ANOVA was conducted on the survival rate, specific growth rate based on weight, length, and biomass, and also gross feeding efficiency, followed by Tukey’s test. Differences were considered statistically significant at p < 0.05.

2.6. Water Balance Analysis (WBA)

It is necessary to correlate the results of statistical analysis of UFBs-RAS performances against various treatment with the water quality due to oxygen saturation, i.e., water balance analysis (WBA). The WBA aims to evaluate the oxygen consumption/demand in relation to the oxygen supply as the result of ultrafine bubbles at various stock densities. Water balance analysis was conducted on the oxygen and ammonia distribution, mass balance, and oxygen demand. The ammonia distribution was calculated using yolk sac utilization in the exogenous stage and gross feeding efficiency in the exogenous stage. Oxygen distribution was calculated from oxygen transfer to larva media obtained from the dissolved oxygen in the ultrafine bubbles tank and transferred volume (flow rate) at constant water recirculating flow rate. The oxygen demand was obtained from the yolk sac biomass, nitrifying bacteria, and direct oxidation of unionized ammonia at endogenous stage, while at exogenous stage, the yolk sac biomass was replaced by artemia nauplii biomass. Those water balance analyses (WBA) indicators at saturated dissolved oxygen were discussed regarding the growth performances. Furthermore, the calculated WBA was evaluated in correlation to the projection of oxygen demands due to variation in stock density, and it also predicted the reserved oxygen in larva media due to the oxygen saturation condition.

2.6.1. Oxygen Production

The total flowrate (Q) in the recirculating system was 480 L/h, and consequently, each larva media received an equal amount of water supply for each 16-larva media (30 L/h).
The oxygen production for each larvae density per h (Poxygen, mg/h) for each larvae media was calculated based on the dissolved oxygen concentration (CDO) at a recirculating flowrate (Q) 30 L/h as follows:
P o x y g e n   ( mg / h ) =   Q   × C D O   t a n k

2.6.2. Ammonia Production at Endogenous and Exogenous Stages

The ammonia production was mainly contributed by the feed diet of the yolk sac at endogenous stage and external feed (artemia nauplii) at exogenous stage of larviculture. Therefore, for the endogenous stage, it is necessary to know the total yolk sac as feed input for each larvae media at particular stock density. In the first step, the initial weight was calculated using length-to-weight relationship to define the initial weight of larva [22]. The length-to-weight relationship is expressed as follows:
W t 0 = K × ( L t 0 ) n
where Wt0 = weight of larvae at initial period (0 hah) in endogenous stage, K = condition factor (5.16 × 10⁻⁶), n = 3.11, and Lt0 = length of larvae at initial period (0 h) in endogenous stage for each density. Furthermore, the total length at the end of endogenous stage was calculated using the length growth rate for larvae in each stock density using Equation (12).
L t 36 ( mm ) = L t 0 + ( A ve .   L r a t e × L t 0 ) × t
where Lt36 = length of larvae at endogenous stage (36 hah), Lt0 = length of larvae at initial times (hah) of endogenous stage, Ave.Lrate = average length growth rate for stock density D40C, D80, D100, and D120, and t = times of endogenous stage (36 h).
The weight of larvae at the end of the endogenous stage (36 hah) (Wt36) was calculated using Equation (11), by substituting Lt0 to Lt36. Thus, the weight biomass was calculated using Equation (13) for each larva media at a particular stock density (D40C–D120), where the observed survival rate was 100% at the endogenous stage. Now, the total weight of biomass was calculated as follows:
W b i o m a s s ( g ) = W t 36 × ( total   fish × survival   rate )
where Wbiomass = total weight of biomass in each larva media at particular stock density.
Knowing the total biomass, the weight of the yolk sac as feeding input for each larva media was calculated based on the data of average yolk sac feeding efficiency using Equation (14).
W f e e d ( g ) = W b i o m a s s / Feed e f f
where Wfeed = total weight of yolk sac as feeding input in each larva media at particular stock density, and Feedeff. = average yolk sac efficiency for the stock density D40C, D80, D100, and D120, respectively.
Assuming the protein content in the yolk sac was 17% [23], Total Ammonia Nitrogen production (PTAN acc.) in each larvae media at a particular stock density during the endogenous stage (36 hah) was calculated as follows:
P T A N   a c c . ( mg ) =   % protein   × ( W f e e d × 1000 ) ×   CF
where PTAN acc. = production of accumulation total ammonia nitrogen (TAN) during endogenous stage of each larvae media at a particular stock density, %protein = 17%, CF = condition factor of protein-to-TAN conversion (0.092) [24].
The TAN production per hour (PTAN) was obtained by dividing PTAN over the total period of endogenous stage (t = 36 h).
P T A N   ( mg / h ) =   P T A N a c c . / t 36
To determine the concentration of TAN (CTAN) for each stock density, the PTAN was divided by the total recirculating flow rate per hour.
C T A N   ( mg / L ) =   P T A N / Q
where Q = recirculating flow rate each larva media (30 L/h). Now, the conversion of CTANto the concentration of unionized ammonia (NH3-N) was (Cun−N), as referred to in ref. [25]. The production of unionized ammonia per hour (Pun-N) was estimated using the values of Cun−N multiplied by recirculating flow rate per hour (30 L/h).
P u n N ( mg / h ) =   C u n N ×   Q
In the exogenous stage, the calculation of the ammonia distribution at each larva media at a particular stock density was possible by determining the weight of larvae at the end of exogenous stage (Wt120). The Wt120 was obtained using Equation (19), by inserting the average specific growth weight rate A ve .   W r a t e .
W t 120 ( mm ) = W t 0 + ( A ve .   W r a t e × W t 0 ) × t
The percentage of protein 6.49 was used to calculate PTAN acc. (Equation (15)) at exogenous stage [26,27], and CF = condition factor of protein-to-TAN conversion (0.092) [24].

2.6.3. The Oxygen Demand and Reserved Oxygen

The oxygen demand at endogenous and exogenous stages in each larva media at a particular stock density was calculated after determining oxygen supply and unionized ammonia production in each larva media. The obtained oxygen distribution was required to examine the response of the larva in correlation to their environmental conditions. Furthermore, the oxygen demand for the endogenous stage was determined using Equations (20)–(22). The determination of oxygen demand for each larva media at a particular stock density was considered for larvae metabolism, nitrifying bacteria, and direct oxidation for unionized ammonia during the endogenous stage.
Oxy d e m a n d   m e t a b o l i s m   ( mg / h ) = CF f e e d × ( W f e e d × 1000 ) / t )
Oxy d e m a n d   N .   b a c t e r i a   ( mg / h ) =   CF N . b a c t e r i a × ( W f e e d × 1000 ) / t )  
Oxy d e m a n d   D . o x y d a t i o n   ( mg / h ) =   CF D . o x y d a t i o n × P u n N  
where Oxydemand metabolism = oxygen demand for larvae metabolism, Oxydemand N.bacteria = oxygen demand for nitrifying bacteria, Oxy.demand D.oxydation = oxygen demand for direct oxidation of unionized ammonia (NH3-N), CFfeed = conversion factor for oxygen demand per mg of yolk sac feed consumed by fish larvae (0.25 mg O2/mg yolk sac), CFN.bacteria = conversion factor for oxygen demand per mg of feed consumed by nitrifying bacteria (0.12 mg O2/mg yolk sac), CFD.oxydation = conversion factor for oxygen demand to oxidize per mg ammonia (117 mg O2/mg NH3-N), t = total period of endogenous stage (36 hah), and Pun−N = production of unionized ammonia from each larva media at a particular stock density of larvae at endogenous stage. At the exogenous stage, similar equations (Equations (20)–(22)) were applied to calculate the oxygen demand for a total time period of 120 h and the production of unionized ammonia from each larva media at a particular stock density of larvae at the exogenous stage (Pun−N).
Now, the above calculation provides the total oxygen supply and oxygen demand per larva media for each larva media at various stock densities for both the endogenous and exogenous stages. Thus, we were able to calculate the total reserved oxygen (Res.Oxy, mg/h) from the oxygen supply by subtracting the oxygen demand and the measured dissolved oxygen at the water treatment box, as expressed in Equation (23).
Res . Oxy .   ( mg / h ) =   P o x y g e n Oxy d e m a n d   m e t a b b o l i s m Oxy d e m a n d   N . b a c t e r i a       Oxy d e m a n d   D   o x y d a t i o n Oxy t r e a t m e n t   b o x

3. Results and Discussion

3.1. Ultrafine Bubbles Characteristics and Water Quality

The size distribution of bubbles in the ultrafine bubbles tank is tabulated in Table 1. The mean bubble size was around (482.9 ± 38.3) nm, and the zeta potential was −23.6 mV. The results indicate that the UFBs generated ultrafine particles size improve saturated dissolved oxygen (258.2%) in the ultrafine bubbles tank, which is considered as a hyperoxia condition [13]. Additionally, the negative zeta potential stabilizes the ultrafine bubbles and perhaps develops reserve oxygen potential (ROP) which has the capability to remove ammonia waste in accordance with our previous study [14]. Furthermore, the performance of ultrafine bubbles was subjected to evaluation for mass balance in the upcoming section. The effect of saturated dissolved oxygen on the water quality (DO, nitrate, nitrite, and temperature) of the entire outlet of larva media or inlet of the water treatment box is given in Table 2. It can be noted that the saturated dissolved oxygen reduced from 258.2% to around 128% (mild hyperoxia) around pH 7.6 and temperature of ±27 °C for both endogenous and exogenous stages. Thus, the saturated condition significantly reduced due to the oxygen transfer rate from the ultrafine bubbles tank to the larva media. The percentage of oxygen saturation remains high for the stock density under investigation. The UFBs-RAS system offers the possibility of recirculating the water media and maintaining acceptable dissolved oxygen in the larva media, although nitrogen waste loading was produced during larviculture. This becomes the focus for evaluation in the next water balance analysis section. It can be highlighted that the nitrogen compounds in the endogenous stage contain lower nitrite as a consequence of the yolk sac metabolism in comparison to the exogenous stage ((1.75 ± 2.82) mg/L). In contrast, the nitrate at the endogenous stage was higher ((5 ± 0.05) mg/L) compared to the exogenous stage ((3.50 ± 2.60) mg/L), where artemia nauplii was used as larva feed. The nitrogenous metabolites of the artemia nauplii may affect the oxygen balance in the rearing media. The accumulation of nitrogen in recirculating systems has a high impact on the survival of fish, especially at high density. Thus, the analysis of water balance is essential in the UFBs-RAS system.

3.2. Larvae Performances at Endogenous Stage

The photographs of catfish larvae samples in the endogenous stage at various hours after hatching (hah) are depicted in Figure 2 and the percentage volume of the yolk sac and total length of catfish larvae are illustrated in Figure 3. The observed data were normally distributed, as per the Shapiro–Wilk test, and homogenously distributed, according to the Levene test. Next, One-Way ANOVA was conducted on the survival rate, specific growth rate based on weight, length, and biomass, and also gross feeding efficiency, followed by Tukey’s test with statistical significance at p < 0.05.
The visual observation shows no substantial change in the percentage volume of yolk sac in the initial 0–9 hah at all stock densities, but changes appear at 12–21 hah. However, the percentage volume of yolk sac was not clearly observed at different stock densities. Therefore, additional analysis from Figure 2 would be beneficial in perceiving the percentage volume of yolk sac at various stock densities. It was observed that at stock density D120, a slow decrease in the percentage volume of yolk sac was observed compared to the stock density D40–D100. This might be due to several factors including higher oxygen demand for the metabolism process at higher stock density required for yolk sac absorption. Thus, it was suggested that more efficient metabolism occurs at lower stock density, as highlighted in Figure 3.
Figure 4a–c show the yolk sac utilization rate, length growth rate, and yolk sac utilization efficiency of catfish larvae at various stock densities (D40C–D120) where the stock density of 40 fish/L was considered as the control. The performances of the yolk sac utilization rate, length growth rate, and yolk sac utilization efficiency displayed no significant difference at the higher stock densities (D80–D120) compared to D40C. This indicates that saturated dissolved oxygen in UFBs-RAS larviculture offers a good environment and yolk sac utilization efficiency for the highest stock density (D120).

3.3. Larvae Performances at Exogenous Stage

All the observed data were identified as normally distribution under Shapiro–Wilk test and homogenous using Levene test, except for the observed data of everyday weight of biomass. For normal distributed data, One-Way ANOVA was conducted on the survival rate, specific growth rate based on weight, length, and gross feeding efficiency, followed by Tukey’s test with statistical significance at p < 0.05. On the other hand, the everyday weight of biomass data follows the square root transformation method. The data were not normally distributed after transformation. Thus, the data were analyzed using nonparametric Kruskal–Wallis ANOVA.
The survival rate of larvae after 192 hah at the end of exogenous stage is depicted in Figure 5. The larva survival rate in FBs-RAS larviculture at various stock densities (D40C–D120) are in the range of (26.79 ± 0.59)–(42.12 ± 1.86)%. In contrast, the survival rate of stock densities D80–D120 revealed a significant difference compared to D40C. There is no significant difference in the survival rate among the stock density D80, D100, and D120, respectively. The effect of the oxygen saturation on the survival rate at various stock densities will be addressed in the upcoming sub-section when the water balance analyses were obtained.
Figure 6 shows the specific growth rate in terms of weight and length of larvae at the exogenous stage. High specific growth rates are obtained for all treatment (D40C–D120) for both weight and length. Interestingly, there is no significant difference in specific growth rate D80–D120 compared to D40C. The specific weight and length growth rate for the highest density (D120) are correspondingly (32.26 ± 1.67)% mg/day and (6.01 ± 0.86)% mm/day. These results indicated that the oxygen saturation condition was still able to support the growth rate process even at highest stock densities [13]. It is emphasized that at the highest stock density, more surviving larva with high growth rates were obtained.
The everyday weight of biomass under all treatment conditions is depicted in Figure 7. The results show that the biomass growth rate at D40C, D80, D100, and D120 is (4.74 ± 2.97), (14.69 ± 2.24), (14.93 ± 2.03), and (13.07 ± 2.06)% gram/day, respectively. The Kruskal–Wallis post hoc test showed at least one of the mean rank group (D40C) was different from the other group (D100). This means that the environmental system using the ultrafine bubbles application (UFBs-RAS) with the oxygen saturation improved the everyday weight of biomass at high stock density (D100).
The gross feeding efficiency (GFE) is an important indicator in aquaculture to determine the profitability and production efficiency. In this study, the gross feeding efficiency (GFE) for all treatments at the end of the exogenous stage is given in Figure 8. The GFE at larvae density at 80, 100, and 120 fish/L (D80–D120) was obtained in the range around (40.65 ± 4.18–43.36 ± 4.40)% and was significantly different (p < 0.005) from D40C (26.17 ± 4.01)%. The corresponding GFE values are mainly contributed by biomass and feed intake. Lower GFE of D1 means lower biomass with high feed intake. Contrarily, at higher stock density (D80–D120), higher GFE was obtained, suggesting higher biomass at similar feed intake. Therefore, our proposed method of striped catfish provides high GFE at high stock density (D120). It also proved that the proposed FBs-RAS is able to retain the environmental conditions for growth, providing potentially cost-effective larviculture.

3.4. Water Balance Analysis (WBA)

3.4.1. Oxygen Production

The oxygen concentration in the ultrafine bubbles tank, water treatment tank at endogenous and exogenous stages were obtain from measured percentage oxygen saturation from Table 1 and Table 2. The oxygen production in the ultrafine bubbles tank and water treatment tank were calculated using Equation (24). However, the oxygen production in each larvae media was obtained after determining the oxygen concentration by considering OTE as 63.75% from ultrafine bubbles tank [14]. Therefore, oxygen concentration in all larvae media was calculated using the equation as follows:
C D O   m e d i a   ( mg / L ) = C D O   t a n k × OTE
where CDOmedia (mg/L) = concentration of oxygen in each larvae media, CDO tank(mg/L) = concentration of oxygen in ultrafine bubbles tank, OTE (%) = oxygen transfer efficiency from ultrafine bubbles tank to larvae media. The results of oxygen production for the oxygen supply and production at all UFBs-RAS units are summarized in Table 3.

3.4.2. Ammonia Production

The weight of larvae at the initial period (0 hah) (Wt0) in the endogenous stage was calculated using Equation (11) by implanting the length of larvae at initial period (Lt0) before rearing (3.31 ± 0.21 mm) for each density. The length of larvae at end endogenous stage (36 hah) (Lt36) was calculated using Equation (12) by adding the length data, growth rate for larvae in each stock density (from Figure 4b, D40C–D120). The average growth length rate was (2.00 ± 0.09), (2.02 ± 0.13), (2.03 ± 0.15), and (1.98 ± 0.08)% for stock density D40C, D80, D100, and D120, respectively. The weight of larvae at the end of the endogenous stage (36 hah) (Wt36) was calculated using Equation (11), by substituting Lt0 to Lt36, and the total fish amount was 600, 1200, 1500 and 1800 fish corresponding to stock density D40C, D80, D100, and D120 (with survival rate 100%), respectively. The weight of the yolk sac as feed input for each larva was calculated using Equation (14) by inserting average yolk sac efficiency (Feedeff.) from Figure 4c, D40C–D120. The average yolk sac efficiency was (50.63 ± 2.82), (52.03 ± 4.75), (53.00 ± 3.35) and (50.04 ± 3.21)% for the stock density D40C, D80, D100, and D120, respectively.
Similarly for the exogenous stage, the weight of larvae at the end of exogenous stage (Wt120) was calculated using Equation (19) by inserting the average specific growth weight rate (Ave.Wrate) from Figure 6 and weight of larvae during the initial period in exogenous stage (Wt0). All calculated variables and terms for calculating the ammonia production in UFBs-RAS of striped catfish (Pangasianodon hypophthalmus) are presented in Table 4 for both endogenous and exogenous stages.
Total ammonia nitrogen production (PTAN acc.) in each larvae media at a particular stock density during the endogenous stage (36 hah) was calculated using Equation (15) by inserting the weight of the yolk sac as feeding input for each larva, considering % protein (17%) and condition factor (CF) of protein-to-TAN conversion (0.092) [24]. The TAN production per hour (PTAN) was obtained by dividing PTAN acc. by the total period of endogenous stage (t = 36 h). The concentration of TAN (CTAN) for each stock density was determined by dividing PTAN over the total recirculating flow rate per hour (Q = 30 L/h). The conversion of CTAN to the concentration of unionized ammonia (NH3-N) was (Cun−N) taken from reference. [25]. Finally, the production of unionized ammonia per hour (Pun-N) was estimated using Equation (18) by inserting the values of Cun−N and the recirculating flow rate per hour (30 L/h). The result of unionized ammonia production at endogenous stage for each stock density is summarized in Table 5. Similarly, the ammonia production calculation at exogenous stage using Equation (15) was performed by considering the percentage of protein (6.49%) and condition factor (CF) of protein-to-TAN conversion (0.092). The results of unionized ammonia production at exogenous stage for each stock density are also summarized in Table 5.

3.4.3. The Oxygen Demand and Reserved Oxygen

The results of oxygen demand for each stock densities for both endogenous and exogenous stages were obtained using Equations (20)–(22) by inserting the corresponding total oxygen supply from (Table 3) and unionized ammonia production in each larva media at a particular stock density (Table 5). Moreover, the reserved oxygen was calculated using Equation (23) by introducing the oxygen supply and oxygen demand values. The results of oxygen demand and reserved oxygen for each stock density for both endogenous and exogenous stages are presented in Table 6.

3.4.4. Effect of Water Balance on the Striped Catfish (Pangasianodon hypophthalmus) Larviculture Performance

The water balance analysis to the ammonia and oxygen demand influences the larvae growth performances [28]. The water quality (oxygen supply versus reserved oxygen at larva media) affected the percentage volume of the yolk sac and total length of larvae, as shown in Figure 3. Thus, reserved oxygen strongly depends on the stock density, where higher unionized ammonia was produced, and mass balance generated improved oxygen demands at higher stock density. This condition caused the larvae to respond relatively slower, as is required to acclimate the water environment, due to minimal dissolved oxygen [29]. Interestingly, our results showed that at all stock densities, there was no significant deference in the total length growth and yolk sac absorption at the endogenous stage. This indicated that the water supply for larvae media at all stock densities provided enough surplus oxygen, as given in Table 6. However, upon increasing the stock density, a reduction in the surplus oxygen was noticed. It was emphasized that the ultrafine bubbles technology provided saturated dissolved oxygen to maintain surplus oxygen at the highest stock density (120 fish/L) with very efficient yolk sac utilization [30]. This provided the opportunity for the larvae to develop without stress conditions and for efficient growth length, leading to the development of healthy larvae in the proceeding stage (exogenous). Other researchers reported the performances of other species (Barbus barbus, Carassius carassius, Aspius aspius, etc.), finding that in applying large stocks, there was no negative effect on the growth rate and individual development of larval rearing under controlled conditions of temperature, photoperiod, and additional water aeration [31,32,33].
The significant difference in the survival rate of stock density D40C compared to the other higher stock densities (D80–D120) suggests the presence of higher reserved oxygen content in rearing media of D40C, which disturbs the larvae metabolic process [34]. At the same time, the larvae possessed the active movement to target artemia nauplii. In this condition, the larvae did not support the total artemia nauplii produced per unit volume, i.e., at stock density D40C = 40 fish/L, and the feed density became 120 artemia nauplii/L. The feed density for stock density D40C was much lower compared to the stock density D120 = 120 fish/L (360 artemia nauplii/L). The lower feed density was the origin of feed limitation leading to larval starvation, which triggered higher mortality for lower stock density [35]. In contrast, the artemia nauplii per unit volume at higher larvae density (D80–D120) increased in the larvae media. Therefore, this condition led the larvae to efficiently target the artemia nauplii and probably elevated the survival rate. Thus, at high stock density or high feed density and appropriate rearing media of saturated oxygen, the reserved oxygen was able to adequately prevent the aggressive nature of larvae. Moreover, the surplus oxygen resolved the ammonia condition below <0.05 mg/L, as tabulated in (Table 6), which would have been difficult to achieve in the recirculation system without the incorporation of ultrafine bubbles [10].
A high specific growth rate was possible due to the ability of UFBs-RAS to maintain the oxygen supply, resulting in a low production of ammonia and providing surplus oxygen (Table 6). The increase in the growth rate might be due to the improvement in the blood flow [36] and fish metabolic process [37]. Moreover, the high dissolved oxygen content led to a boost in the antioxidant activity and enzymatic digestion, and a reduction in the glucose and lactic acid content [38]. Remarkably, the high dissolved oxygen content improved the immune response performance of the sea bass, as evidenced from the treatment with 12–13 mg/L of oxygen [39], which was similar to the current oxygen level in this study. This oxygen concentration has induced a modification in the distribution of T- and B-cells, which experienced an increment in specific myelopoietic sites, which was probably responsible for enhancing the immune response performance. Many researchers were interested to know the deleterious effect associated with many stressful conditions including hypoxia and hyperoxia on the larval skin, since this organ plays an decisive the role in osmoregulation of striped catfish larva. Burggren et al. [40] reported that the deleterious effect or chronic hyperoxia, unlike chronic hypoxia, has no significant variations in the skin morphology of larval Rana catesbeiana. Therefore, in this study, the high dissolved oxygen content provides less energy for the larvae to respond under environmental stress.
Moreover, the high oxygen saturation condition in the UFBs-RAS offered enough surplus oxygen in the larva media that may affect the nitrogen digestibility of larvae to transform artemia nauplii into biomass growth. Consequently, it increased the gross feeding efficiency (GFE). For example, larviculture at stock density of D120 produced a GFE of 40.60%. Hence, a 100 g artemia nauplii was converted into 40.60 g of larvae biomass, assuming the nitrogen weight % of artemia nauplii and larvae were 7.5 and 9.17% (at dry basis), respectively [41,42]. The nitrogen in larvae body tissues was improved around 49%. Thus, the GFE of 40.60% corresponds to 49% nitrogen digestion. In contrast, other study reported that the nitrogen digestion of catfish larva was found at 25% of larviculture in pond system [43]. It was suggested that the UFBs-RAS with the integration of ultrafine bubbles for catfish larviculture enhanced nitrogen digestion. Moreover, the accumulation of nitrogen digestion reduced the ammonia waste in larviculture media. It can be highlighted that the UFBs-RAS system unveiled effective striped catfish larviculture resulting in the high GFE and survival rate, as evidenced from high stock density.

4. Conclusions

The application of ultrafine bubbles in RAS created saturated dissolved oxygen condition that offered reserved oxygen up to 1.58 mg/L and reduced ammonia (NH3-N) until 0.12 µg/L. The proposed striped catfish larviculture at stock density 100 fish/L (D100) provide high yolk sac utilization efficiency in the endogenous stage and enhanced specific biomass growth rate in the exogenous stage. By evaluating the overall performances of UFBs-RAS at the stock density 100 fish/L (D100), the gross feeding efficiency was improved. WBA calculation enabled oxygen demand predictions as the stock density increased in larva media under saturated oxygen conditions, thereby preventing the aggressive behavior of larvae. It can be concluded that UFBs-RAS with stock density of 100 fish/L (D100) with good growth performances resolved crucial issues by maintaining the sustainability of the striped catfish industry with a positive effect on the production.
The recent investigation no sign of larvae feeding behavior was observed in the exogenous stage due to oxygen saturation, which was reiterated by submersible camera observation and the cannibalism behavior under high stock density. It is recommended that future investigations include the experimental setup of the recirculating system (RAS) equipped with separated ultrafine bubbles aeration and water treatment supply for each larvae media at various densities, which allows the contribution from each treatment.

Author Contributions

Conceptualization, I.M.J., C.P. and U.S.; methodology, U.S., I.M.J., Z. and I.; validation, I.M.J., Z. and I.; writing—original draft preparation, U.S.; writing—review and editing, I.M.J., C.P., Z. and I.; funding acquisition, C.P. and I.M.J. All authors have read and agreed to the published version of the manuscript.

Funding

The author acknowledges the scholarship for Ph.D. students given to Ujang Subhan from Riset Disertasi Doktor Unpad (RDDU) with contract no 1595/UN6.3.1/PT.00/2021 and the research was financially supported from World Class Research Grand Directorate of Higher Education, Kementerian Pendidikan, Kebudayaan, Riset dan Teknologi, Indonesia, with contact no (1207/UN6.3.1/PT.00/2021).

Institutional Review Board Statement

Ethical review and approval were waived for this study, due to the observation in larvae stage of common fish with very low risk.

Data Availability Statement

Not applicable.

Conflicts of Interest

The authors declare no conflict of interest.

References

  1. FAO. The State of World Fisheries and Aquaculture, Sustainability in Action; FAO: Rome, Italy, 2020. [Google Scholar]
  2. Belton, B.; Haque, M.M.; Little, D.C.; Sinh, L.X. Certifying Catfish in Vietnam and Bangladesh: Who Will Make the Grade and Will It Matter? Food Policy 2011, 36, 289–299. [Google Scholar] [CrossRef]
  3. Ali, H.; Haque, M.M.; Belton, B. Striped Catfish (Pangasianodon Hypophthalmus, Sauvage, 1878) Aquaculture in Bangladesh: An Overview. Aquac. Res. 2013, 44, 950–965. [Google Scholar] [CrossRef]
  4. Nainggolan, H.; Rahmantya, K.F.; Asianto, A.D.; Wibowo, D.; Wahyuni, T.; Zunianto, A.; Ksatrya, S.P.; Malika, R. Kelautan dan Perikanan dalam Angka Tahun 2018; Pusat Data; Statistik dan Informasi: Jakarta, Indonesia, 2018; pp. 1–386. [Google Scholar]
  5. Kementerian Kelautan dan Perikanan. Laporan Tahunan Kementerian Kelautan Dan Perikanan 2020; Kementerian Kelautan dan Perikanan: Jakarta, Indonesia, 2020; pp. 1–171. [Google Scholar]
  6. Fairchild, E.A.; Howell, W.H. Optimal Stocking Density for Juvenile Winter Flounder Pseudopleuronectes Americanus. J. World Aquac. Soc. 2001, 32, 300–308. [Google Scholar] [CrossRef]
  7. Subagja, J.; Slembrouck, J.; Hung, L.T.; Legendre, M. Larval Rearing of an Asian Catfish Pangasius Hypophthalmus (Siluroidei, Pangasiidae): Analysis of Precocious Mortality and Proposition of Appropriate Treatments. Aquat. Living Resour. 1999, 12, 37–44. [Google Scholar] [CrossRef]
  8. De Barros, I.B.A.; Villacorta-Correa, M.A.; Carvalho, T.B. Stocking Density and Water Temperature as Modulators of Aggressiveness, Survival and Zootechnical Performance in Matrinxã Larvae, Brycon Amazonicus. Aquaculture 2019, 502, 378–383. [Google Scholar] [CrossRef]
  9. Wajsbrot, N.; Gasith, A.; Krom, M.D.; Popper, D.M. Acute Toxicity of Ammonia to Juvenile Gilthead Seabream Sparus Aurata under Reduced Oxygen Levels. Aquaculture 1991, 92, 277–288. [Google Scholar] [CrossRef]
  10. Slembrouck, J.; Baras, E.; Subagja, J.; Hung, L.T.; Legendre, M. Survival, Growth and Food Conversion of Cultured Larvae of Pangasianodon Hypophthalmus, Depending on Feeding Level, Prey Density and Fish Density. Aquaculture 2009, 294, 52–59. [Google Scholar] [CrossRef]
  11. Xiao, R.; Wei, Y.; An, D.; Li, D.; Ta, X.; Wu, Y.; Ren, Q. A Review on the Research Status and Development Trend of Equipment in Water Treatment Processes of Recirculating Aquaculture Systems. Rev. Aquac. 2019, 11, 863–895. [Google Scholar] [CrossRef]
  12. Xiao, G.; Cheng, X.; Xie, J.; Zhu, D. Assessment of Aeration Plug-Flow Devices Used with Recirculating Aquaculture Systems on the Growth of Tilapia Oreochromis Niloticus. Aquac. Eng. 2020, 91, 102116. [Google Scholar] [CrossRef]
  13. Thorarensen, H.; Gústavsson, A.; Gunnarsson, S.; Árnason, J.; Steinarsson, A.; Björnsdóttir, R.; Imsland, A.K.D. The Effect of Oxygen Saturation on the Growth and Feed Conversion of Juvenile Atlantic Cod (Gadus morhua L.). Aquaculture 2017, 475, 24–28. [Google Scholar] [CrossRef]
  14. Subhan, U.; Iskandar; Zahidah; Joni, I.M. Detection of Reserve Oxygen Potential in the Present of Fine Bubbles and Its Ammonia Removal for Aquaculture Effluent. Mater. Sci. Forum 2021, 1044, 103–111. [Google Scholar] [CrossRef]
  15. Patel, A.K.; Singhania, R.R.; Chen, C.W.; Tseng, Y.S.; Kuo, C.H.; Wu, C.H.; Dong, C. Di Advances in Micro- and Nano Bubbles Technology for Application in Biochemical Processes. Environ. Technol. Innov. 2021, 23, 101729. [Google Scholar] [CrossRef]
  16. Subhan, U.; Muthukannan, V.; Azhary, S.Y.; Mulhadi, M.F.; Rochima, E.; Panatarani, C.; Joni, I.M. Development and Performance Evaluation of Air Fine Bubbles on Water Quality of Thai Catfish Rearing. AIP Conf. Proc. 2018, 1927, 0300431–0300435. [Google Scholar] [CrossRef]
  17. Stejskal, V.; Matousek, J.; Sebesta, R.; Nowosad, J.; Sikora, M.; Kucharczyk, D. Stocking Density Effect on Survival and Growth of Early Life Stages of Maraena Whitefish, Coregonus Maraena (Actinopterygii: Salmoniformes: Salmonidae). Acta Ichthyol. Piscat. 2021, 51, 139–144. [Google Scholar] [CrossRef]
  18. SNI: 01-6483.4; Produksi Benih Ikan Patin Siam (Pangasius Hyphthalmus) Kelas Benih Sebar. Badan Standar Nasional: Jakarta, Indonesia, 2000; pp. 1–10.
  19. Heming, T.A.; Buddington, R.K. Yolk Absorption in Embryonic and Larval Fishes. Fish Physiol. 1988, 11, 407–446. [Google Scholar] [CrossRef]
  20. Watanabe, W.O.; Ellis, S.C.; Ellis, E.P.; Feeley, M.W. Temperature Effects on Eggs and Yolk Sac Larvae of the Summer Flounder at Different Salinities. N. Am. J. Aquac. 1999, 61, 267–277. [Google Scholar] [CrossRef]
  21. Cadorin, D.I.; da Silva, M.F.O.; Masagounder, K.; Fracalossi, D.M. Interaction of Feeding Frequency and Feeding Rate on Growth, Nutrient Utilization, and Plasma Metabolites of Juvenile Genetically Improved Farmed Nile Tilapia, Oreochromis Niloticus. J. World Aquac. Soc. 2022, 53, 500–515. [Google Scholar] [CrossRef]
  22. Huguenin, J.E.; Colt, J. Design and Operating Guide for Aquaculture Seawater Systems, 2nd ed.; Elsevier B.V.: Amsterdam, The Netherlands, 2002; Volume 33, ISBN 9789896540821. [Google Scholar]
  23. Sink, T.D.; Lochmann, R.T.; Pohlenz, C.; Buentello, A.; Gatlin, D. Effects of Dietary Protein Source and Protein-Lipid Source Interaction on Channel Catfish (Ictalurus Punctatus) Egg Biochemical Composition, Egg Production and Quality, and Fry Hatching Percentage and Performance. Aquaculture 2010, 298, 251–259. [Google Scholar] [CrossRef]
  24. Ebeling, J.M. Recirculating Acuaculture; Cayuga Aqua Ventures: Ithaca, NY, USA, 2010; ISBN 9780971264625. [Google Scholar]
  25. Emerson, K.; Russo, R.C.; Lund, R.E.; Thurston, R.V. Aqueous Ammonia Equilibrium Calculations: Effect of PH and Temperature. J. Fish. Res. Board Canada 1975, 32, 2379–2383. [Google Scholar] [CrossRef]
  26. Peykaran Mana, N.; Vahabzadeh, H.; Seidgar, M.; Hafezieh, M.; Pourali, H.R. Proximate Composition and Fatty Acids Profiles of Artemia Cysts, and Nauplii from Different Geographical Regions of Iran. Iran. J. Fish. Sci. 2014, 13, 761–775. [Google Scholar]
  27. Ownagh, E.; Agh, N.; Noori, F. Comparison of the Growth, Survival and Nutritional Value of Artemia Using Various Agricultural by-Products and Unicellular Algae Dunaliella Salina. Iran. J. Fish. Sci. 2015, 14, 358–368. [Google Scholar]
  28. Nowosad, J.; Żarski, D.; Biłas, M.; Dryl, K.; Krejszeff, S.; Kucharczyk, D. Dynamics of Ammonia Excretion in Juvenile Common Tench, Tinca tinca (L.), during Intensive Rearing under Controlled Conditions. Aquac. Int. 2013, 21, 629–637. [Google Scholar] [CrossRef]
  29. Roman, M.R.; Brandt, S.B.; Houde, E.D.; Pierson, J.J. Interactive Effects of Hypoxia and Temperature on Coastal Pelagic Zooplankton and Fish. Front. Mar. Sci. 2019, 6, 139. [Google Scholar] [CrossRef] [Green Version]
  30. Palińska-Żarska, K.; Żarski, D.; Krejszeff, S.; Nowosad, J.; Biłas, M.; Trejchel, K.; Kucharczyk, D. Dynamics of Yolk Sac and Oil Droplet Utilization and Behavioural Aspects of Swim Bladder Inflation in Burbot, Lota lota L., Larvae during the First Days of Life, under Laboratory Conditions. Aquac. Int. 2014, 22, 13–27. [Google Scholar] [CrossRef] [Green Version]
  31. Biłas, M.; Zarski, D.; Palińska, K.; Wiszniewska, K.; Kupren, K.; Targońska, K.; Krejszeff, S.; Furgała-Selezniow, G.; Kucharczyk, D. Effect of Stocking Density in Relationship to Bottom Area Sonthe Growth and Survival of Common Barbel Barbus Barbus (L.) Larvae. Polish J. Nat. Sci. 2012, 27, 315–325. [Google Scholar]
  32. Żarski, D.; Targońska, K.; Krejszeff, S.; Kwiatkowski, M.; Kupren, K.; Kucharczyk, D. Influence of Stocking Density and Type of Feed on the Rearing of Crucian Carp, Carassius carassius (L.), Larvae under Controlled Conditions. Aquac. Int. 2011, 19, 1105–1117. [Google Scholar] [CrossRef] [Green Version]
  33. Kupren, K.; Zarski, D.; Krejszeff, S.; Kucharczyk, D.; Targońska, K. Effect of Stocking Density on Growth, Survival and Development of Asp Aspius aspius (L.), Ide Leuciscus idus (L.) and Chub Leuciscus cephalus (L.) Larvae during Initial Rearing under Laboratory Conditions. Ital. J. Anim. Sci. 2011, 10, 178–184. [Google Scholar] [CrossRef]
  34. Zhang, W.; Cao, Z.D.; Peng, J.L.; Chen, B.J.; Fu, S.J. The Effects of Dissolved Oxygen Level on the Metabolic Interaction between Digestion and Locomotion in Juvenile Southern Catfish (Silurus Meridionalis Chen). Comp. Biochem. Physiol. A Mol. Integr. Physiol. 2010, 157, 212–219. [Google Scholar] [CrossRef] [PubMed]
  35. Purcell, J.; Grover, J. Predation and Food Limitation as Causes of Mortality in Larval Herring at a Spawning Ground in British Columbia. Mar. Ecol. Prog. Ser. 1990, 59, 55–61. [Google Scholar] [CrossRef]
  36. Ohnari, H. Today’s subjects of microbubble technology. Cem. Eng. Jpn. 2001, 71, 154–159. [Google Scholar] [CrossRef] [Green Version]
  37. Ebina, K.; Shi, K.; Hirao, M.; Hashimoto, J.; Kawato, Y.; Kaneshiro, S.; Morimoto, T.; Koizumi, K.; Yoshikawa, H. Oxygen and Air Nanobubble Water Solution Promote the Growth of Plants, Fishes, and Mice. PLoS ONE 2013, 8, e65339. [Google Scholar] [CrossRef] [PubMed] [Green Version]
  38. Li, J.; Huang, K.; Huang, L.; Hua, Y.; Yu, K.; Liu, T. Effects of Dissolved Oxygen on the Growth Performance, Haematological Parameters, Antioxidant Responses and Apoptosis of Juvenile GIFT (Oreochromis Niloticus). Aquac. Res. 2020, 51, 3079–3090. [Google Scholar] [CrossRef]
  39. Romano, N.; Scapigliati, G.; Abelli, L. Water Oxygen Content Affects Distribution of t and b Lymphocytes in Lymphoid Tissues of Farmed Sea Bass (Dicentrarchus Labrax). Fishes 2017, 2, 16. [Google Scholar] [CrossRef] [Green Version]
  40. Burggren, W.; Mwalukoma, A. Respiration during Chronic Hypoxia and Hyperoxia in Larval and Adult Bullfrogs (Rana Catesbeiana). I. Morphological Responses of Lungs, Skin and Gills. J. Exp. Biol. 1983, 105, 191–203. [Google Scholar] [CrossRef] [PubMed]
  41. Nimura, Y.; Miah, M.I.S. Nitrogen Excretion by Artemia Franciscana. Nippon. Suisan Gakkaishi Jpn. Ed. 1991, 57, 837–844. [Google Scholar] [CrossRef]
  42. Gross, A.; Boyd, C.E.; Wood, C.W. Nitrogen Transformations and Balance in Channel Catfish Ponds. Aquac. Eng. 2000, 24, 1–14. [Google Scholar] [CrossRef]
  43. Brune, D.E.; Schwartz, G.; Eversole, A.G.; Collier, J.A.; Schwedler, T.E. Intensification of Pond Aquaculture and High Rate Photosynthetic Systems. Aquac. Eng. 2003, 28, 65–86. [Google Scholar] [CrossRef]
Figure 1. Schematic diagram of recirculating aquaculture system (UFBs-RAS) for striped catfish (Pangasianodon hypophthalmus) larviculture.
Fishes 07 00190 g001
Figure 2. The photographs of striped catfish (Pangasianodon hypophthalmus) larvae samples at various stock density treatment levels and hours after hatching in endogenous stage, at mean temperature of 26.08 °C.
Fishes 07 00190 g002
Figure 3. The percentage volume of the yolk sac and total length of striped catfish (Pangasianodon hypophthalmus) larvae samples at various stock density treatment levels and hours after hatching in endogenous stage, at mean temperature of 26.08 °C.
Fishes 07 00190 g003
Figure 4. (a) Yolk sac absorption rate, (b) length growth rate, and (c) yolk sac utilization efficiency of striped catfish (Pangasianodon hypophthalmus) larvae at various stock density treatment levels in endogenous stage, at a mean temperature of 26.08 °C. Vertical bars indicate standard error, the same letters “a” denote no different (p > 0.05).
Fishes 07 00190 g004
Figure 5. The survival rate of striped catfish (Pangasianodon hypophthalmus) larvae at various stock density treatment levels in exogenous stage, at mean temperature of 27 °C. Vertical bars indicate standard error. Different letters denote significant differences between groups (p < 0.05).
Fishes 07 00190 g005
Figure 6. The specific growth rate of weight and length of striped catfish (Pangasianodon hypophthalmus) larvae at various stock density treatment levels in exogenous stage, at mean temperature of 27 °C. Vertical bars indicate standard error. Different letters denote significant differences between groups (p < 0.05).
Fishes 07 00190 g006
Figure 7. The specific growth rate of biomass striped catfish (Pangasianodon hypophthalmus) larvae at various stock density treatment levels in exogenous stage, at mean temperature of 27 °C. Vertical bars indicate standard error. Different letters denote significant differences between groups (p < 0.05).
Fishes 07 00190 g007
Figure 8. Gross feeding efficiency (GFE) of striped catfish (Pangasianodon hypophthalmus) larvae at various stock density treatment levels in exogenous stage, at mean temperature of 27 °C. Vertical bars indicate standard error. Different letters denote significant differences between groups (p < 0.05).
Fishes 07 00190 g008
Table 1. The bubbles characteristic and water quality profile in the ultrafine bubbles tank.
ParameterValue
Bubbles size distribution means (nm)482.9 ± 38.3
Polydispersity Index1.342
Zeta potential (mV)− 23.6 ± 8.20
Electrophoretic mobility (cm2/Vs)− 0.000183 ± 0.00006
Dissolved oxygen (%sat.)255.31 ± 3.90
Temperature (°C)26.2 ± 0.15
Table 2. The water quality profile in the water treatment box.
Water QualityEndogenous StageExogenous Stage
Dissolved oxygen (% sat.)128.97 ± 6.69128.73 ± 6.17
Temperature (°C)26.08 ± 0.1927 ± 0.10
pH7.60 ± 0.107.60 ± 0.10
Total Ammonia Nitrogen (mg/L)0.25 ± 0.340.25 ± 0.34
Ammonia nitrogen, NH3-N (mg/L)0.006 ± 0.000.007 ± 0.00
Ammonium nitrogen, NH4+-N (mg/L)0.244 ± 0.000.243 ± 0.00
Nitrite, NO2-N (mg/L)0.01.75 ± 2.82
Nitrate, NO3-N (mg/L)5 ± 0.053.50 ± 2.60
Table 3. The oxygen supply and production in UFBs-RAS.
TankRecirculating Flow Rate (Q)Oxygen SaturationConcentration (CDO)Oxygen Production (Poxygen)
(L/h)(Sat%)(mg/L)(mg/h)
Ultrafine bubbles tank480255.3119.119172.8
Water treatment tank (endogenous stage)480128.979.464540.8
Water treatment tank (exogenous stage)480128.739.444531.2
Each larva media30166.0312.18365.4
Table 4. The variable and terms for calculating the unionized ammonia production in FBs-RAS at the endogenous and exogenous stages of striped catfish (Pangasianodon hypophthalmus).
TermStock Density Treatment
D40CD80D100D120
Endogenous Stage
Lt0 (mm)Length of larvae at initial period (0 h) in endogenous stage 3.31 ± 0.213.31 ± 0.213.31 ± 0.213.31 ± 0.21
Survival rate (%)The survival rate of each stock density at endogenous stage 100100100100
Ave.Lrate (%)Average lengths growth rate (Figure 4b)2.00 ± 0.092.02 ± 0.132.03 ± 0.151.98 ± 0.08
Feedeff. (%)Average yolk sac efficiency (Figure 4c)50.63 ± 2.8252.03 ± 4.7553.00 ± 3.3550.04 ± 3.21
Wt0 (g), (Equation (12))Weight of larvae at initial period0.000210.000210.000210.00021
Lt36 (mm), (Equation (13))Length of larvae at end endogenous stage (36 hah)5.695.725.735.67
Wt36 (g), (Equation (12))Weight of larvae at the end of the endogenous phase (36 hah)0.001150.001170.001180.00114
Wfeed (g), (Equation (15))Weight of the yolk sac1.372.693.334.09
Exogenous Stage
Lt0 (mm)Length of larvae at initial period (0 h) in exogenous stage 8.38 ± 0.337.72 ± 0.157.70 ± 0.147.87 ± 0.35
Survival rate (%)The survival rate of each stock density at endogenous stage (Figure 5)26.79 ± 2.7438.27 ± 0.5942.12 ± 1.8841.38 ± 5.69
Ave.Wrate (%)Average specific growth weight rate per hour for each stock density (Figure 6)1.41 ± 0.081.30 ± 0.051.34 ± 0.051.25 ± 0.06
Feedeff. (%)Average Gross Feeding Efficiency (GFE) of larvae for each stock density (Figure 8)26.17 ± 4.0142.87 ± 4.6743.36 ± 4.4040.65 ± 4.18
Wt0 (g), (Equation (12))Weight of larvae at initial period in exogenous stage0.003840.002970.002950.00316
Wt120 (g), (Equation (20))Weight of larvae at the end of the exogenous stage (120 hah)0.010350.007610.007710.00825
Wfeed (g), (Equation (15))Weight of the external feed (artemia nauplii)6.368.1511.2315.11
Table 5. Unionized ammonia production (NH3-N) in each striped catfish (Pangasianodon hypophthalmus) larva media at various stock densities in UFBs-RAS.
StagesStock Density TreatmentRecirculating Flow Rate (Q)Concentration of Unionized Ammonia (Cun-N)Production of Unionized Ammonia (Pun-N)
(L/h)(mg/L)(µg/L)(mg/h)
EndogenousD40C300.00050.50.014
D80300.00090.90.027
D100300.00111.10.034
D120300.00141.40.041
ExogenousD40C300.000060.060.002
D80300.000080.080.003
D100300.000120.120.003
D120300.000150.150.005
Table 6. Mass balance, oxygen demand, and oxygen reserved in UFBs-RAS used for striped catfish (Pangasianodon hypophthalmus).
StagesStock Density TreatmentRecirculating Flow RateOxygen Supply in Each Larvae MediaMeasured Oxygen in Water
Treatment Box
Oxygen Demand for MetabolismOxygen Demand for Nitrifying BacteriaOxygen Demand for Direct Oxidation Unionized Ammonia (NH3-N)Reserved Oxygen
(L/h)(mg/h)(mg/h)(mg/h)(mg/h)(mg/h)(mg/h)(mg/L)
EndogenousD40C30365.48283.809.494.551.6266.022.20
D8030365.48283.8018.718.983.1850.811.69
D10030365.48283.8023.1111.093.9343.551.45
D12030365.48283.8028.4313.654.8434.771.16
ExogenousD40C30365.48283.2013.256.360.2362.442.08
D8030365.48283.2016.988.150.2956.861.90
D10030365.48283.2023.3911.230.4047.261.58
D12030365.48283.2031.4815.110.5435.151.17
Publisher’s Note: MDPI stays neutral with regard to jurisdictional claims in published maps and institutional affiliations.

