Article

Population Genetic Diversity and Differentiation of Mitten Crab, Genus Eriocheir, Based on Microsatellite Markers

1
Key Open Laboratory of Cold Water Fish Germplasm Resources and Breeding of Heilongjiang Province, Heilongjiang River Fisheries Research Institute, Chinese Academy of Fishery Sciences, Harbin 150070, China
2
Engineering Technology Research Center of Saline-Alkaline Water Fisheries (Harbin), CAFS, Harbin 150070, China
*
Author to whom correspondence should be addressed.
Fishes 2022, 7(4), 182; https://doi.org/10.3390/fishes7040182
Submission received: 29 June 2022 / Revised: 21 July 2022 / Accepted: 21 July 2022 / Published: 22 July 2022
(This article belongs to the Special Issue Recent Advances in Crab Aquaculture)

Abstract

:
Mitten crab, Eriocheir sensu stricto, is an important indigenous aquatic species and food source in Eastern Asia. Genetic diversity is an important prerequisite for the conservation and utilization of germplasm resources. However, the genetic diversity and differentiation of Eriocheir s. s. remains unclear. This study evaluated population genetic diversity and genetic differentiation of three Eriocheir s. s. populations from Suifenhe (SFH), Liaohe (LH), and Nanliujiang (NLJ), China, based on 19 microsatellite markers. The mean observed number of alleles (Na) was 22.84 alleles, and the mean polymorphism information content (PIC) was 0.86, which demonstrated high genetic diversity. The allele frequency distribution showed an “L” shape, ranging from 0.01 to 0.74. The genetic diversity parameter values of the LH population were higher than those of the other two populations. All pairwise FST values showed significant differences among the three Eriocheir s. s. populations (p < 0.01). The value of Nei’s genetic distance (DS) varied from 0.31 (between SFH and NLJ populations) to 0.33 (between SFH and LH populations). Overall, The results illustrate that the three wild Eriocheir s. s. populations have high genetic diversity and high genetic differentiation. This study provides the basis for Eriocheir s. s. utilization in China.

1. Introduction

The mitten crab, Eriocheir sensu stricto, belongs to the Class Crustacea, Order Decapoda, and Family Syringidae, and inhabits the coastal rivers and estuaries from Heilongjiang Province to Guangxi Zhuang Autonomous Region along the coast of China [1,2]. The Chinese mitten crab (Eriocheir sinensis), as one of the most widely developed and utilized mitten crabs, is an economically important species for freshwater aquaculture in China because of its delicate flavor and high nutritional value [3,4]. The aquaculture yield of E. sinensis has increased steadily during the past two decades and stabilized at an annual yield between 750,000 and 800,000 tons in the past four years [5]. In the wild, the major natural habits for E. sinensis are in the Liaohe (LH) and Yangtze (YZ) rivers in China [6], forming the LH and YZ populations of E. sinensis [7]. The LH population of E. sinensis is mainly cultured in paddies, lakes, and a few ponds in northern China. However, YZ populations of E. sinensis are mainly cultured in earth ponds, lakes, and a few paddies in southern China [8]. Of these two populations, the YZ population of E. sinensis is considered more popular for aquaculture practitioners because of larger adult size and good flavor [9]. However, the shortage of wild juveniles from the YZ river basin caused by over-exploitation drove frequent stock transfer among the different geographical populations (mainly transport from the Rivers LH and Oujiang (OJ) to the YZ river basin) in the 1990s [6]. This transport has caused the YZ population of E. sinensis to become a mixed gene pool of LH and OJ E. sinensis. Little is known about transport from the YZ or OJ populations to the LH delta for culture. Meanwhile, combined with the previous studies [10], the LH population of E. sinensis is a relatively pure gene pool of Eriocheir s. s. compared with the YZ population in the Yangtze delta.
Currently, the majority of Eriocheir s. s. derived from the respective river basins have definite species names. The Eriocheir s. s. derived from river basin Tumenjiang (TMJ) in the northeast of China comprises overlapping distributions or a genetically mixed population of E. sinensis and E. japonicus based on morphometrics analysis [11]. Eriocheir s. s. derived from the river basins LH, Yellow (YL), and YZ are treated as E. sinensis based on mitochondrial and microsatellite markers [12,13], because only slight differences in morphological and molecular characteristics were previously observed [14,15]. Eriocheir s. s. derived from the river basins OJ and Minjiang (MJ) are classified into a mixed population of E. sinensis and E. hepuensis based on mitochondrial and microsatellite markers [12,16]. The Eriocheir s. s. derived from the river basin Nanliujiang (NLJ) is classified as E. hepuensis based on morphometrics and microsatellite marker analysis [12,17].
The Eriocheir s. s. derived from river basin SFH is indigenous and distributed in the southeast of Heilongjiang Province, China. According to previous reports [18], the SFH population of Eriocheir s. s. is considered as E. japonicus because Eriocheir s. s. is a migratory aquatic animal, and the megalopa migrate upstream to the river basin SFH from the Sea of Japan. However, based on landmark-based morphometric analysis, the Eriocheir s. s. in the SFH river basin, has closer morphological characteristics that more closely resemble E. sinensis [19]. Currently, there are no studies in the literature that report the genetic diversity and differentiation of Eriocheir s. s. in the SFH river basin from the perspective of genetics. Hence, we used microsatellite loci to explore the genetic diversity and differentiation of Eriocheir s. s. in the SFH river basin.
Previous studies have demonstrated the genetic diversity and differentiation of E. sinensis and E. hepuensis [6,10,12,17,20]. Due to the relatively pure germplasm of Eriocheir s. s. in the LH river basin, we selected the LH population of Eriocheir s. s. as the representative E. sinensis in this study. Likewise, the NLJ population is a representative population of E. hepuensis. This study was conducted using classical population genetics to assess the genetic diversity and differentiation of these three wild Eriocheir s. s. populations (especially the SFH population) and to provide appropriate guidelines for the conservation and utilization of germplasm resources.

2. Materials and Methods

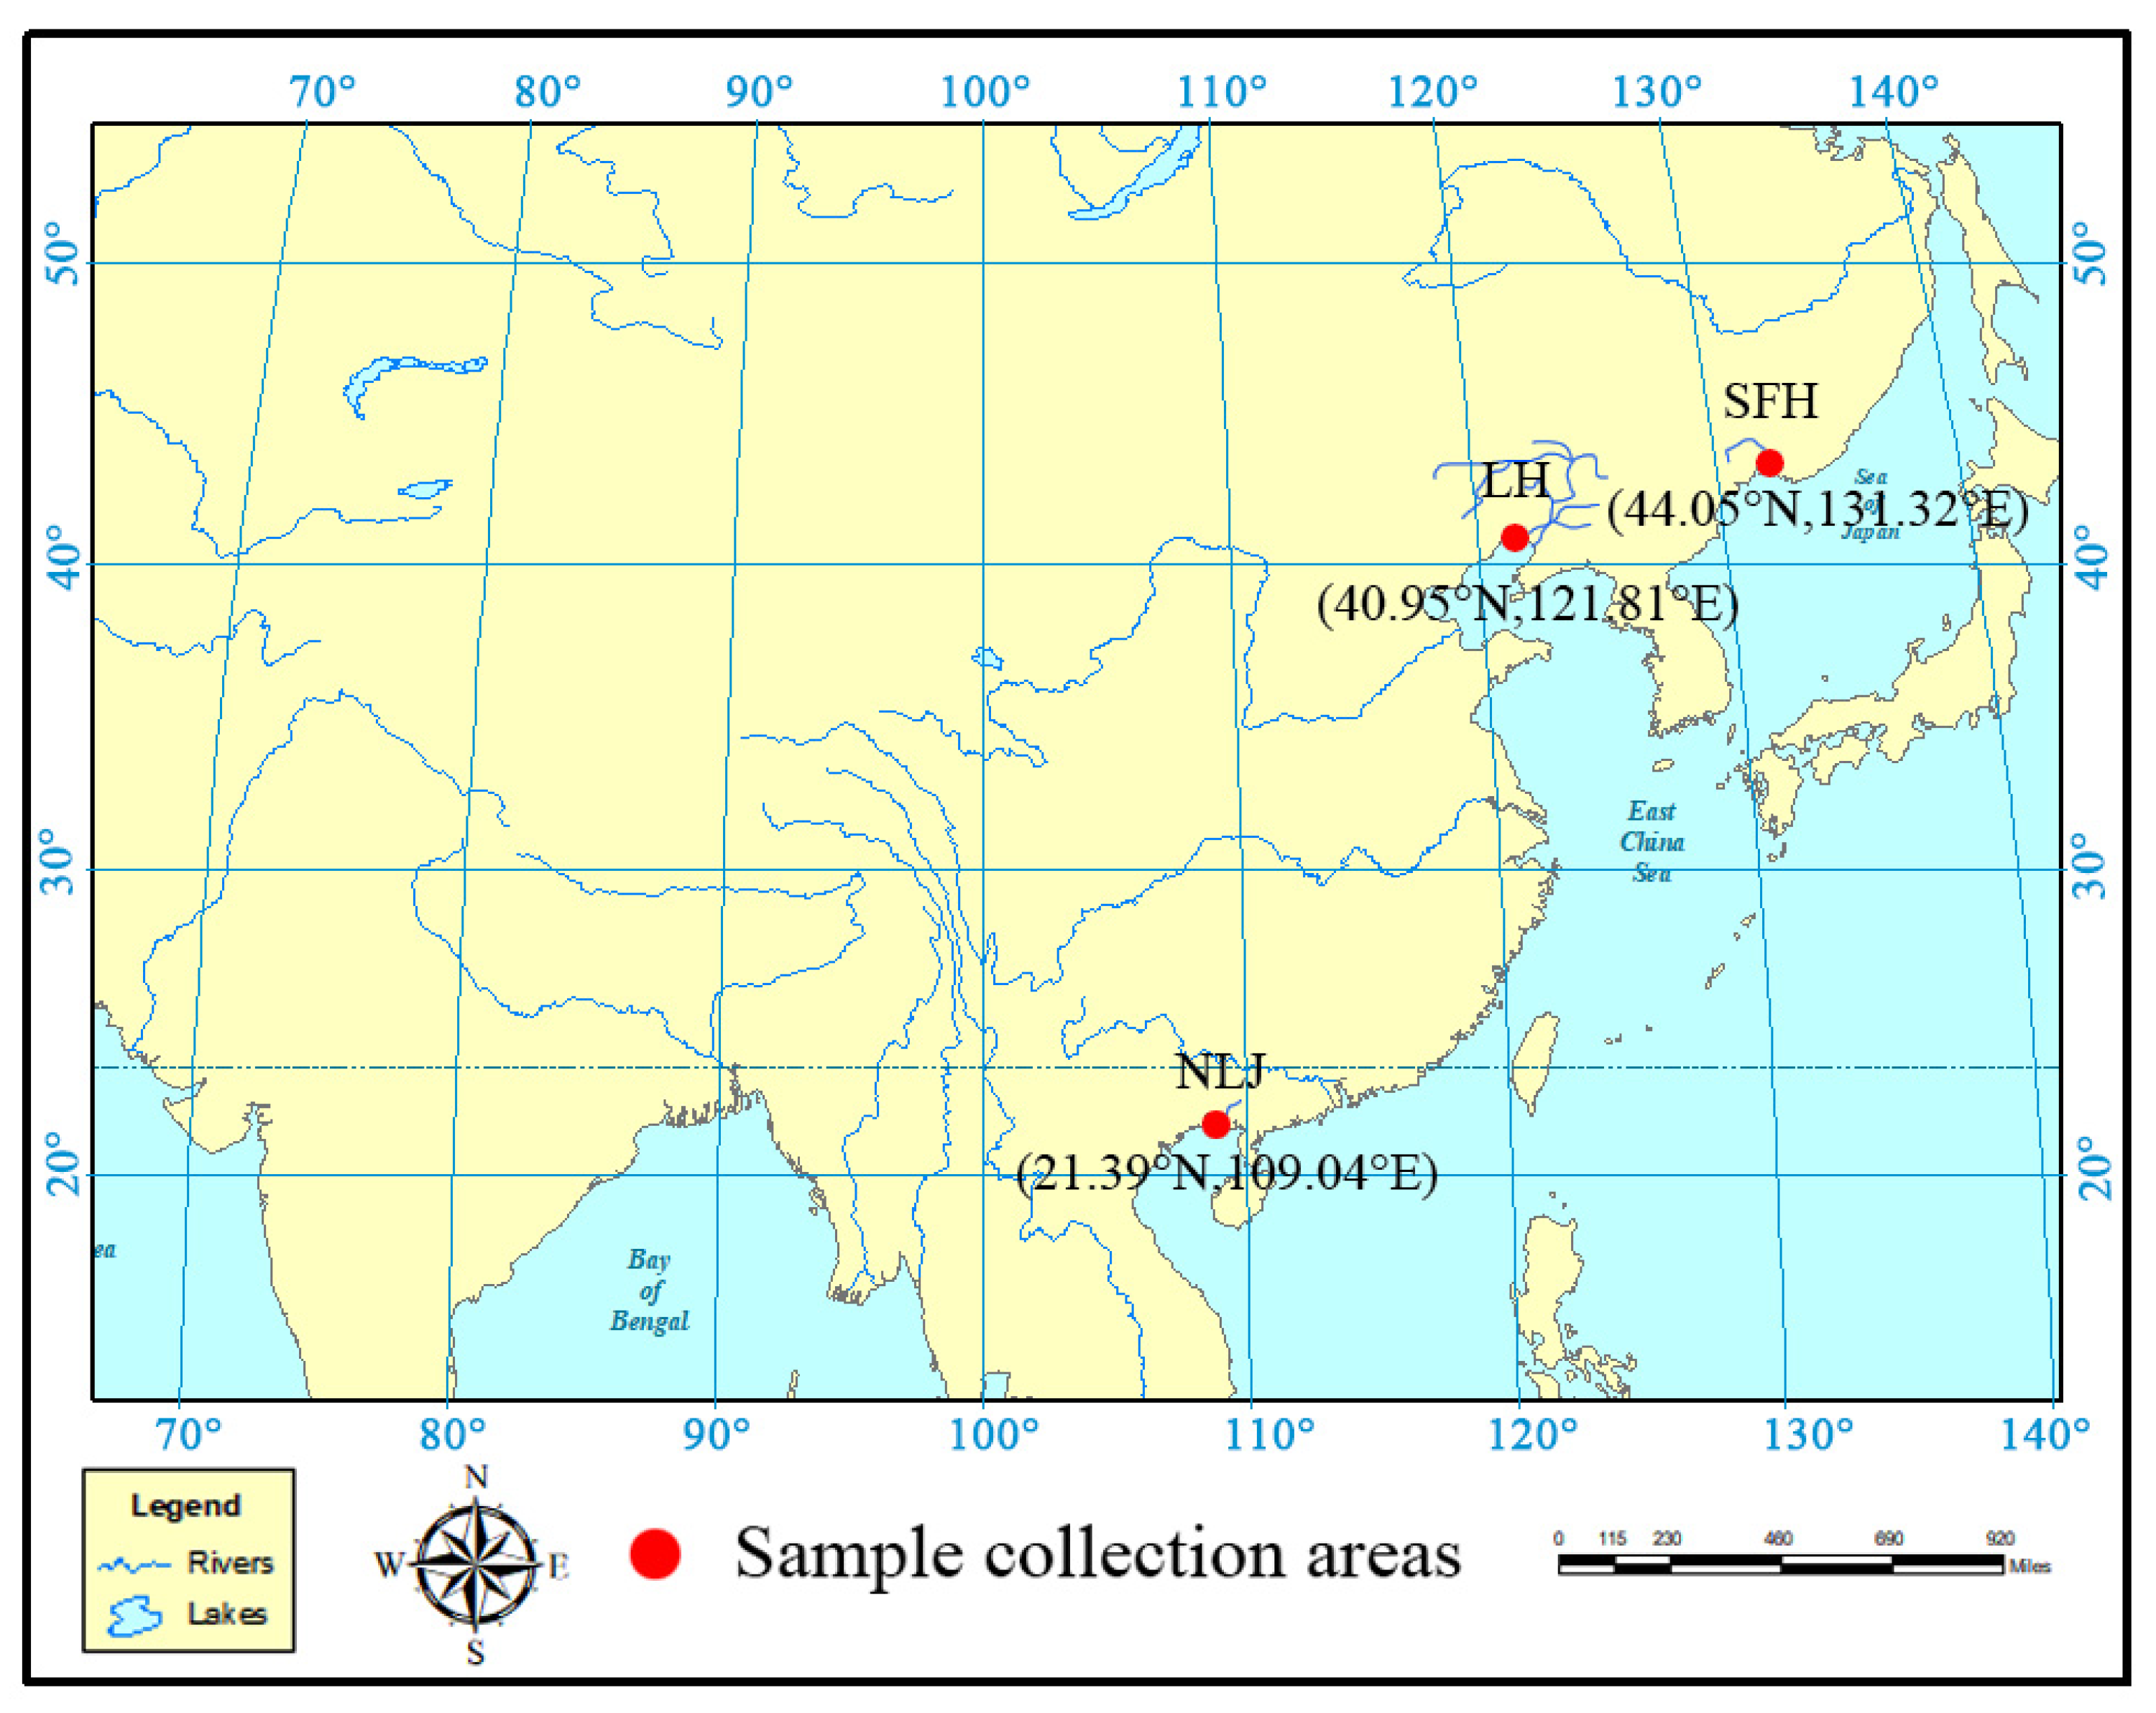
2.1. Sample Collection

Wild Eriocheir s. s. samples were captured from September to November 2021 in the SFH (131.32° E, 44.05° N, Mudanjing City, Heilongjiang Province, China), LH (121.81° E, 40.95° N, Panjin City, Liaoning Province, China), and NLJ (109.04° E, 21.39° N, Beihai City, Guangxi Province, China) river basins. The geographic locations of Eriocheir s. s. populations are shown in Figure 1. The sample size of each basin was 60 adult individuals, including 30 females and 30 males with a weight range of 80–100 g. Subsequently, all live individuals were transported to the Key Open Laboratory of Cold Water Fish Germplasm Resources and Breeding of Heilongjiang Province, Heilongjiang Fisheries Research Institute (CAFS), Harbin, China. According to the guidelines for the care and use of laboratory animals of Heilongjiang River Fisheries Research Institute (CAFS), Eriocheir s. s. were anesthetized, and the sampled pleopod muscles from the legs of each individual were stored at −80 °C before DNA extraction.

2.2. DNA Extraction

Total genomic DNA was extracted from leg muscle tissue using the Magnetic Animal Tissue Genomic DNA Kit produced by Tiangen Biotech (Beijing, China) Co., Ltd. (DP341-2). After extraction, the gel was dyed with ethidium bromide replacement, and captured by GeneSnap with the Syngene System (Bio-Rad, Hercules, CA, USA). Subsequently, DNA concentration was measured using a spectrophotometer (Quawell, San Jose, CA, USA). The genomic DNA samples were diluted to 50 ng/μL and stored at −20 °C before use.

2.3. Microsatellite Markers and PCR Amplification

A total of 20 loci (Table 1) was screened with information regarding microsatellite primers obtained from the previous literature [21,22,23,24,25]. The primer sequences and allele size ranges are listed in Table 2. All forward primers (5′ end) were fluorescently labeled with either an FAM or HEX tag, and all reverse primers were ordinary primers. These primers were synthesized by Sangon Biotech Co., Ltd. (Shanghai, China).
A total volume of 20 µL was used for each reaction, including 1 µL genomic DNA (50 ng/µL), 0.5 µL forward primer (10 mmol/L), 0.5 µL reverse primer (10 mmol/L), 2 × Es Taq Master Mix (CW Biotech Co., Ltd., Beijing, China), and 8 µL ddH2O. PCR products were obtained with a PCR instrument (Bio-Rad, Hercules, CA, USA). The PCR amplification conditions were as follows: firstly, pre-denaturation, 94 °C for 2 min; secondly, a total of 35 cycles including denaturation at 94 °C for 30 s, optimal annealing temperature (listed in Table 1) for 30 s, and 72 °C for 30 s; and finally, an extension step at 72 °C for 10 min. After all the PCR products were detected by agarose gel electrophoresis, the PCR products of each FAM and HEX primer were mixed together, and then sent to Sangon Biotech Co., Ltd. (Shanghai, China) for short tandem repeat (STR) sequencing. Formamide denaturation was used, ROX-500 was used as the internal standard, and an ABI-3730XL automatic DNA sequencer (ABI, Waltham, MA, USA) was used for detection and analysis. The peak map was scanned by Genemapper version 3.5 software (Thermo, MA, USA) and the length of allele fragment represented by the target peak was read. All data were imported into Microsoft Excel 2017 for further analysis [13,26].

2.4. Statistical Analysis

According to the size and quantity of each locus gene fragment, the genotype of each sample was determined. The measured genetic diversity, genetic differentiation, and genetic structure parameters were according to the method of Wang et al. [16], which included observed number of alleles (Na), expected number of alleles (Ne), observed heterozygosity (Ho), expected heterozygosity (He), Shannon Wiener index (I), polymorphic information content (PIC), inbreeding coefficient (FIS), total departure of genotype frequencies from HWE (FIT), genetic differentiation coefficient (FST), gene flow (Nm), Ewens–Watterson test for neutrality (EWTN), test of departure for Hardy–Weinberg equilibrium (HWE, p < 0.05), Nei’s genetic distance (DS), neighbor-joining phylogenetic tree, population pairwise FST, and analysis of molecular variance (AMOVA) of Eriocheir s. s. species were calculated by POPGEN version 3.2 (San Jose, CA, USA), PIC_CALC version 0.6, MEGA version 5.0 (Mega Limited, Auckland, New Zealand), and ARLEQUIN version 3.5 (University of Berne, Swiss).
The values (mean ± SE) of Na, Ne, Ho, He, I, PIC, and Nm of each population were calculated using Microsoft Excel 2017 based on values of per locus.

3. Results

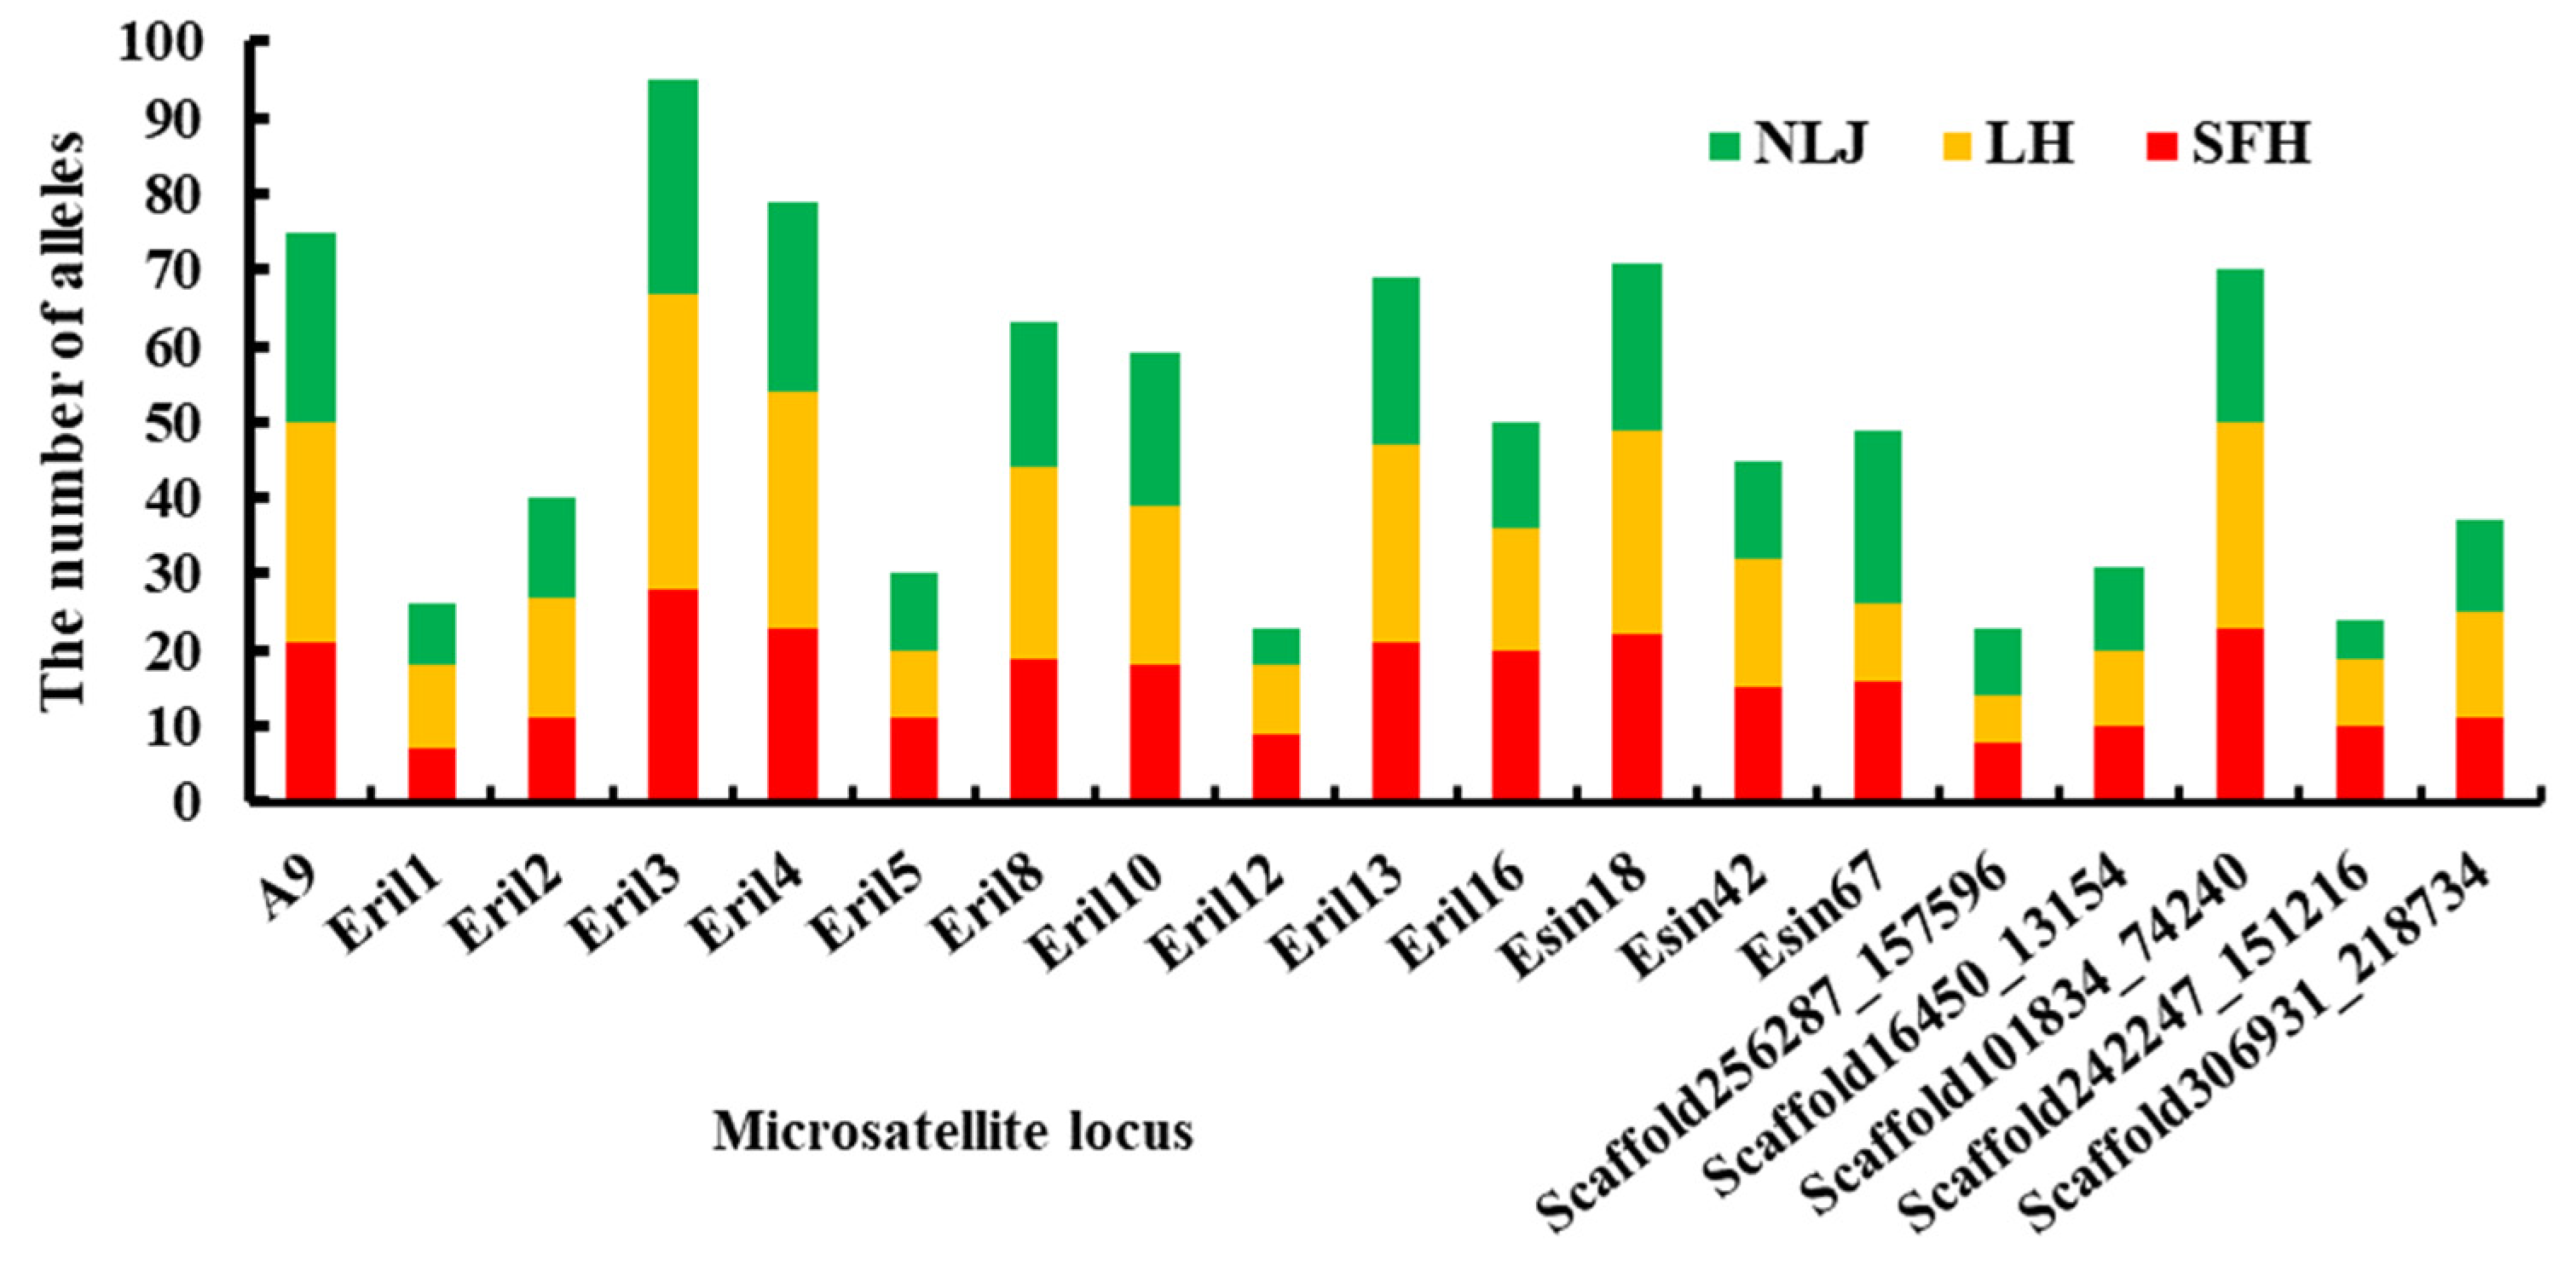
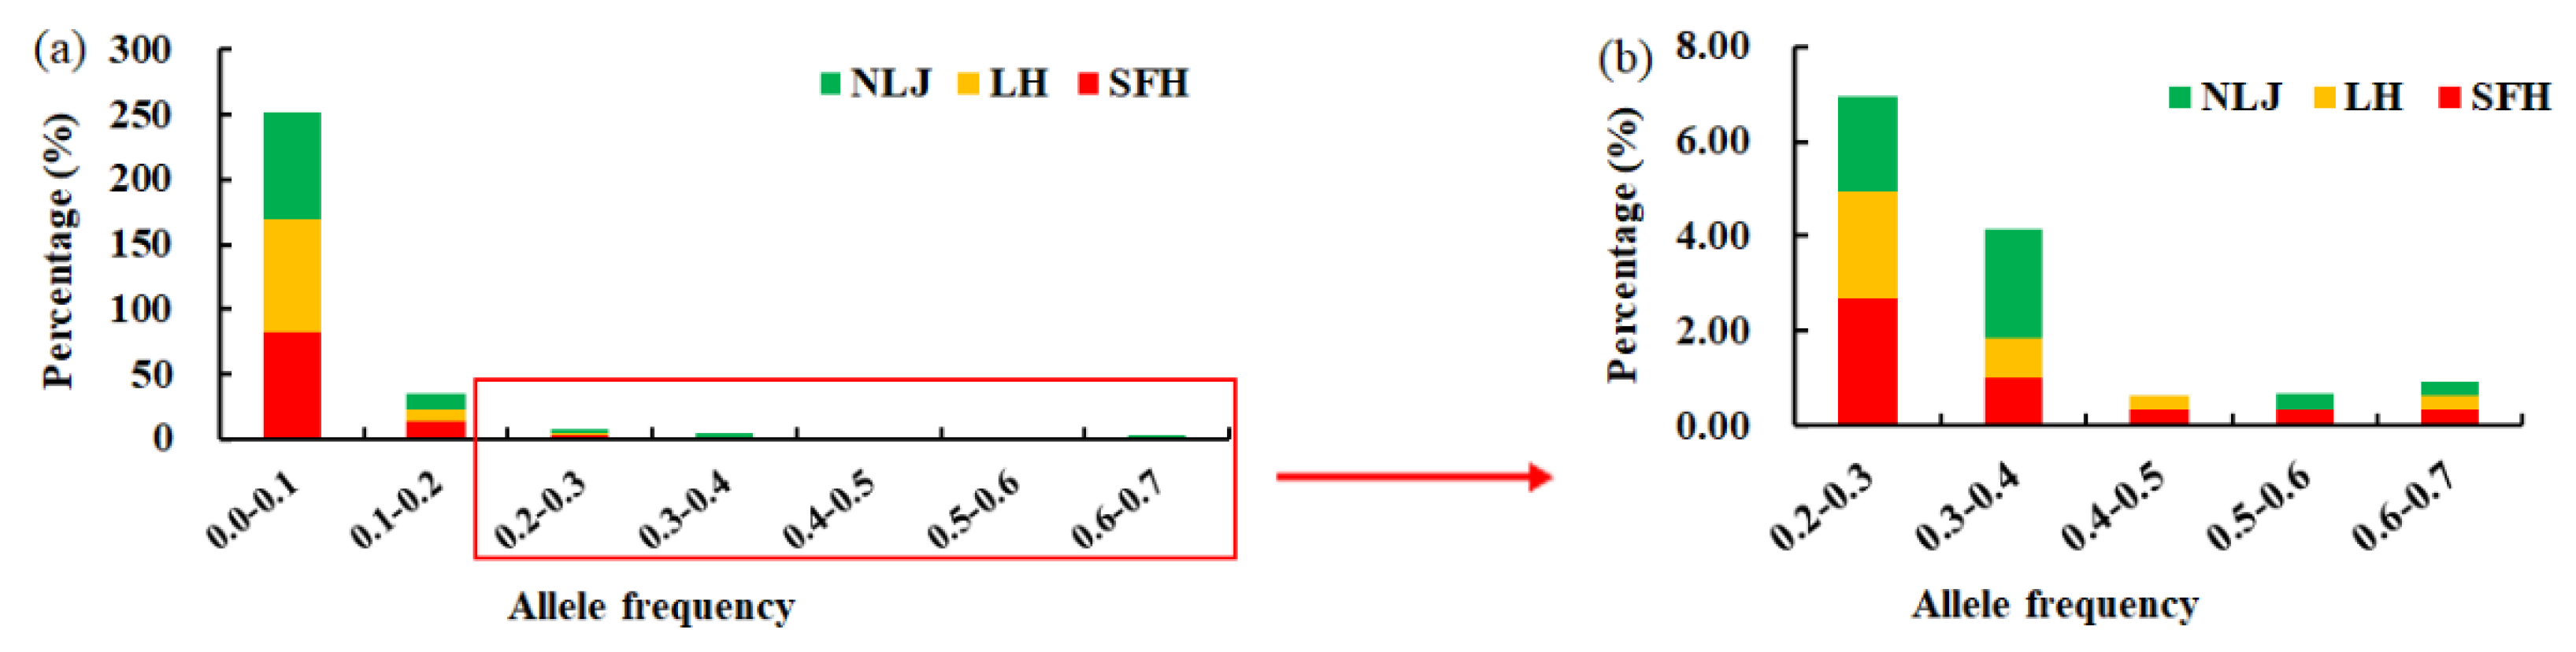
3.1. Genetic Diversity of Microsatellite Loci

The genetic diversity parameters of 19 microsatellite loci in three Eriocheir s. s. populations are shown in Table 2. A total number of 434 alleles was observed in 180 individuals of three wild Eriocheir s. s. populations, with an overall mean of 22.84 alleles per locus and a range from 9 (Scaffold242247_157596) to 46 (Eril13) (Figure 2). The Ne values ranged from 3.73 (Scaffold242247_151216) to 26.62 (Eril3), with a mean of 12.21 alleles per locus. The Ho values varied from 0.46 (Scaffold242247_151216) to 0.99 (Eril3) with a mean of 0.77, while He values ranged from 0.73 (Scaffold242247_151216) to 0.97 (Eril3) with a mean of 0.88. The I values lay in the range from 1.62 (Scaffold242247_151216) to 3.49 (Eril3) with a mean of 2.55 per locus, respectively. The PIC values were all more than 0.5, ranging from 0.66 (Eril5) to 0.96 (Eril3), with an overall mean of 0.86, and indicated a high degree of polymorphism at each locus. The FIS values ranged from −0.04 (Eril3) to 0.34 (Eril2), with an average of 0.09, while the FIT values ranged from −0.02 (Eril3) to 0.37 (Eril2), with a mean of 0.12. The FST values lay in the range from 0.01 (Scaffold256287_157596) to 0.04 (Eril5) with a mean of 0.03. Except for the FST value of the locus (Scaffold242247_151216) of 0.19, which exceeded the threshold of 0.05, the FST values of the remaining loci were all less than 0.05. The Nm values ranged from 1.08 (Scaffold242247_151216) to 20.80 (Scaffold242247_157596), with an average of 7.31. The EWTN values per locus were 0.18 on average, ranging from 0.06 (Eril3) to 0.36 (Scaffold242247_157596). Heterozygosity excess or deficiency was detected by multi-locus tests for HWE; in total, 13 out of 19 loci revealed significant deviation from HWE (p < 0.01), including 11 loci with a heterozygosity deficiency, and 2 loci with a heterozygosity excess.
The allele frequency distribution is shown in Figure 3. The allele frequency distribution showed an “L” shape, ranging from 0.01 to 0.74. The proportion between 0.0 and 0.1 was the highest, reaching more than 80%, followed by 0.1~0.2, accounting for approximately 10% of the total. The remaining allele frequencies accounted for lower proportions.

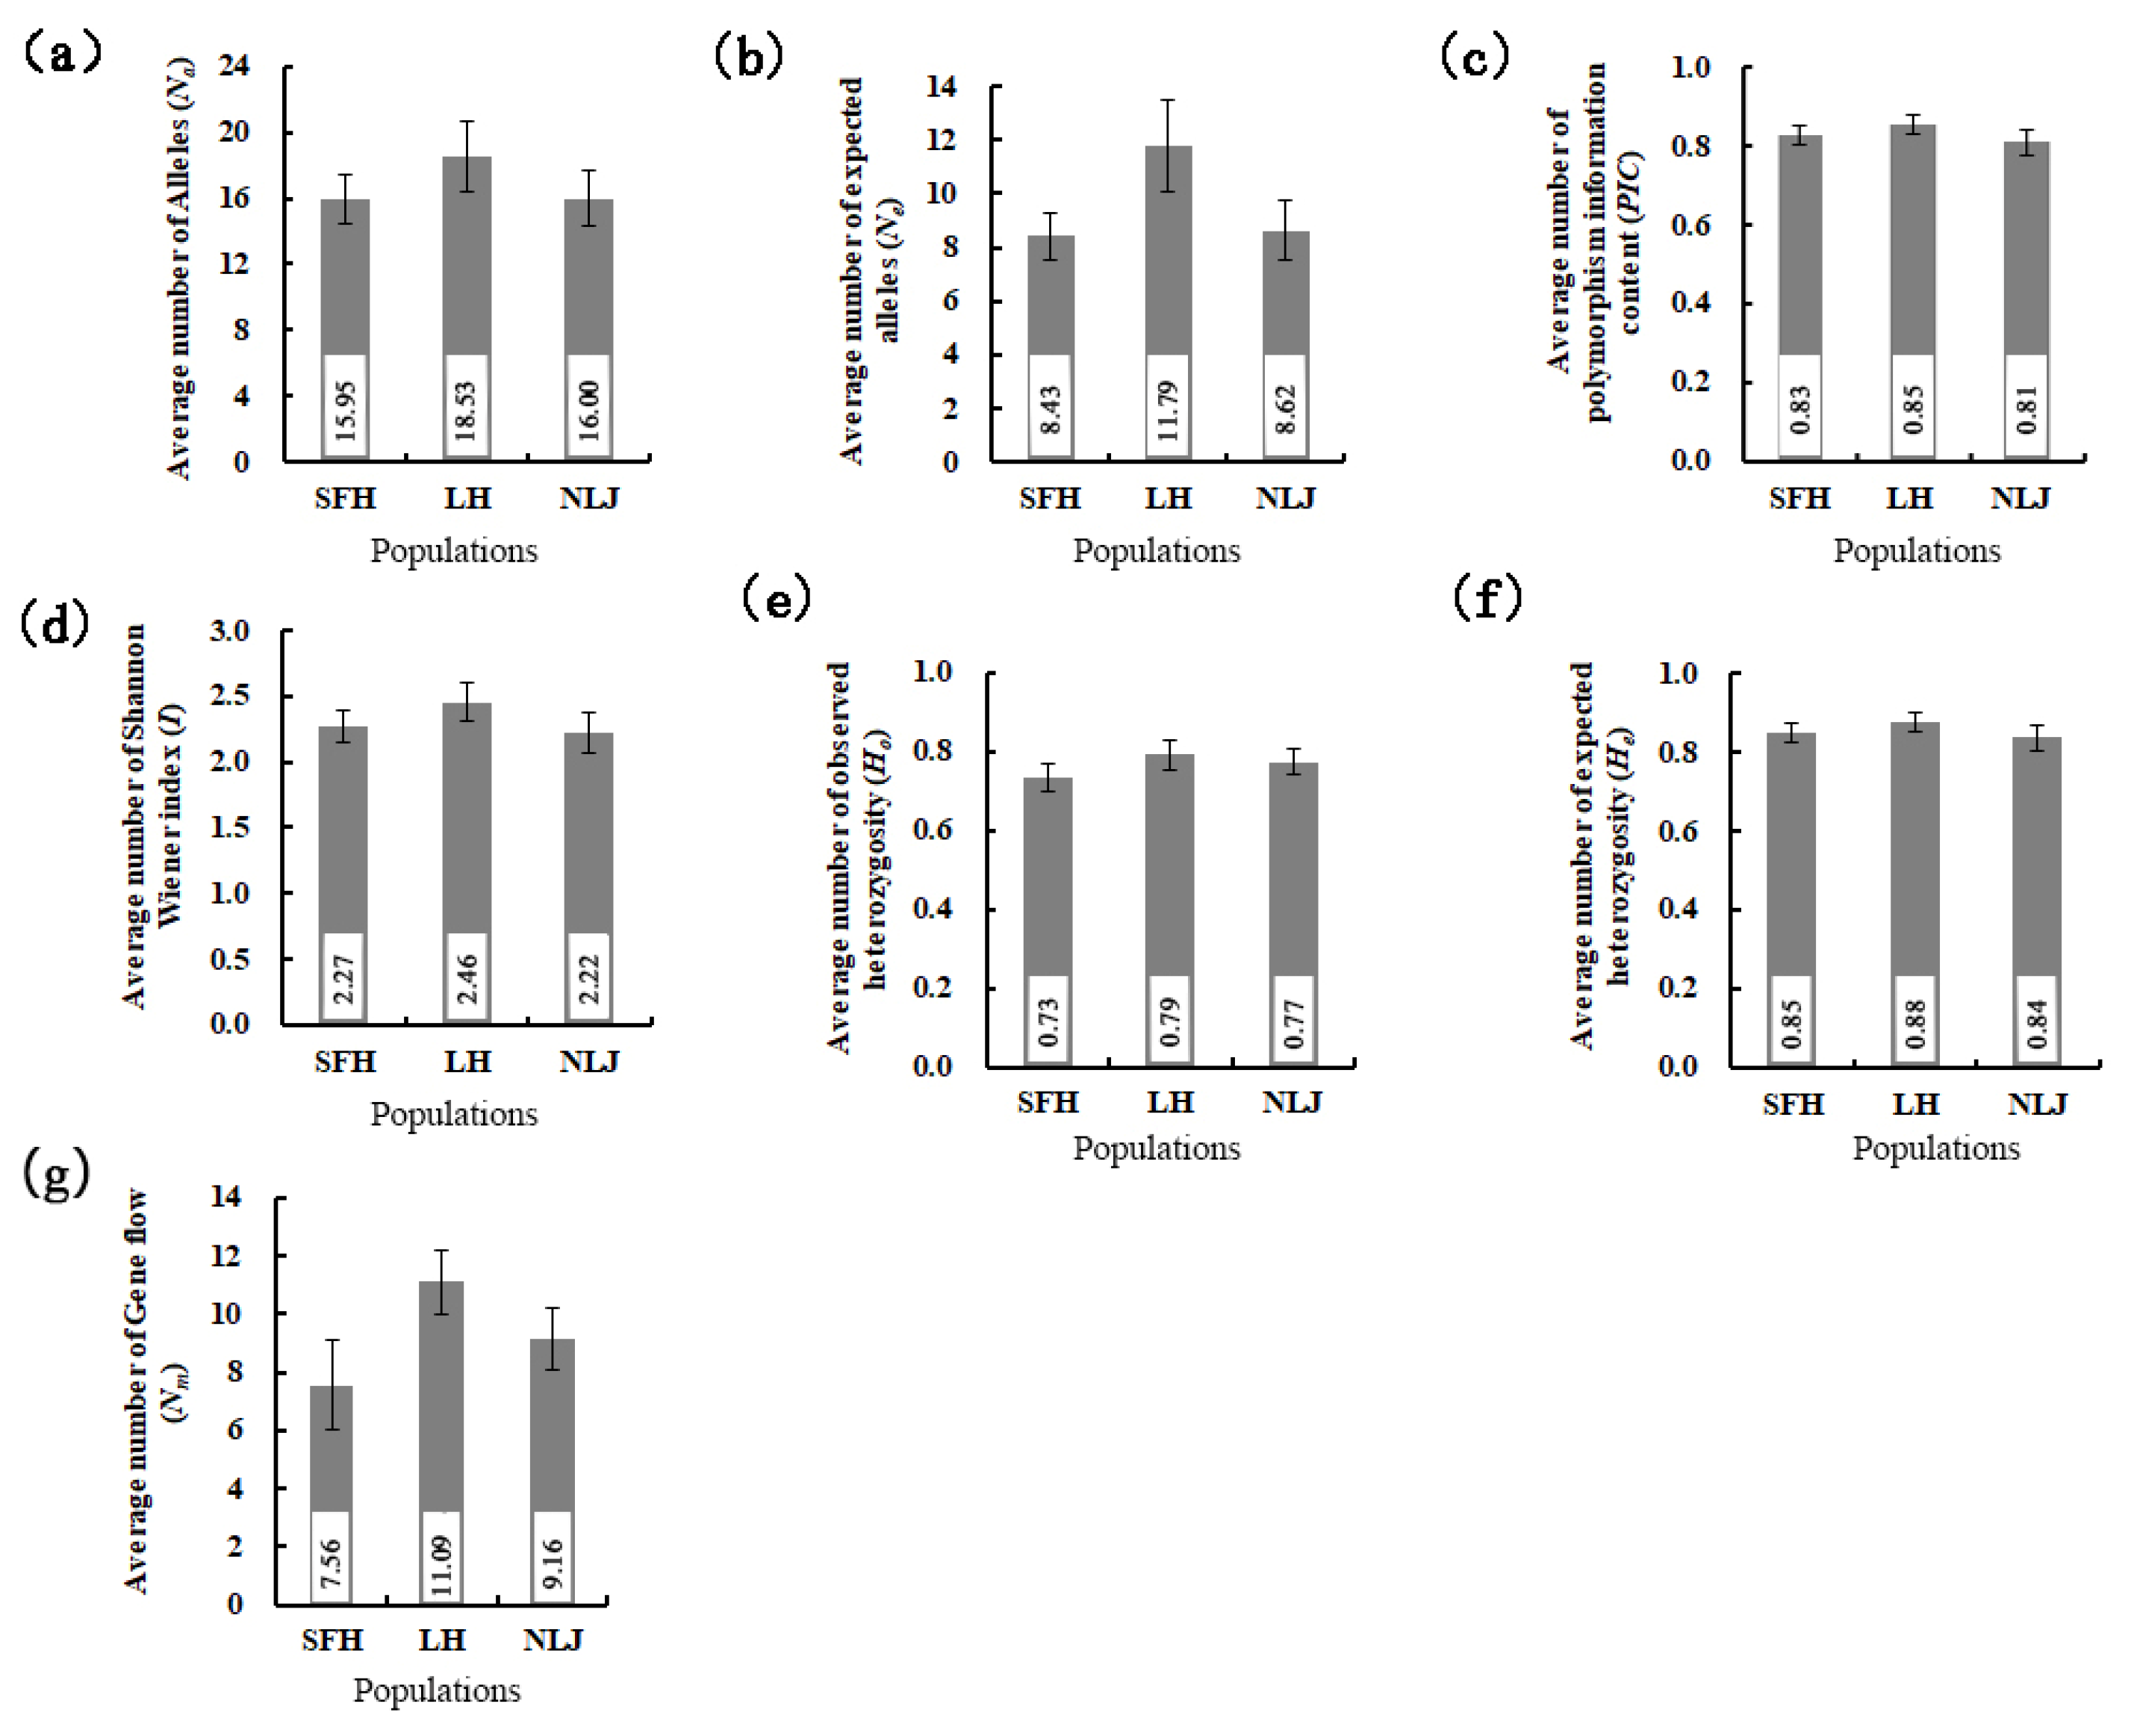
3.2. Genetic Diversity of Eriocheir s. s. Populations

The genetic diversity parameters for Eriocheir s. s. populations are shown in Figure 4. The mean Na values varied from 15.95 ± 1.43 (SFH) to 18.53 ± 2.16 (LH) (Figure 4a). Like-wise, the mean Ne values ranged from 8.43 ± 0.88 (SFH) to 11.79 ± 1.72 (LH) (Figure 4b). The mean PIC values varied from 0.81 ± 0.03 (NLJ) to 0.85 ± 0.03 (LH) (Figure 4c), while the average I values ranged from 2.22 ± 0.15 (NLJ) to 2.46 ± 0.15 (LH) (Figure 4d). The average Ho values ranged from 0.73 ± 0.04 (SFH) to 0.79 ± 0.04 (LH) (Figure 4e), while the average He values varied from 0.84 ± 0.03 (NLJ) to 0.88 ± 0.02 (LH) (Figure 4f). The mean Nm values varied from 7.56 ± 1.54 (SFH) to 11.09 ± 1.11 (LH) (Figure 4g). Overall, the parameter values for the LH population were higher than those of the remaining two populations. However, no significant differences were observed for these populations among these three wild populations (p > 0.05).

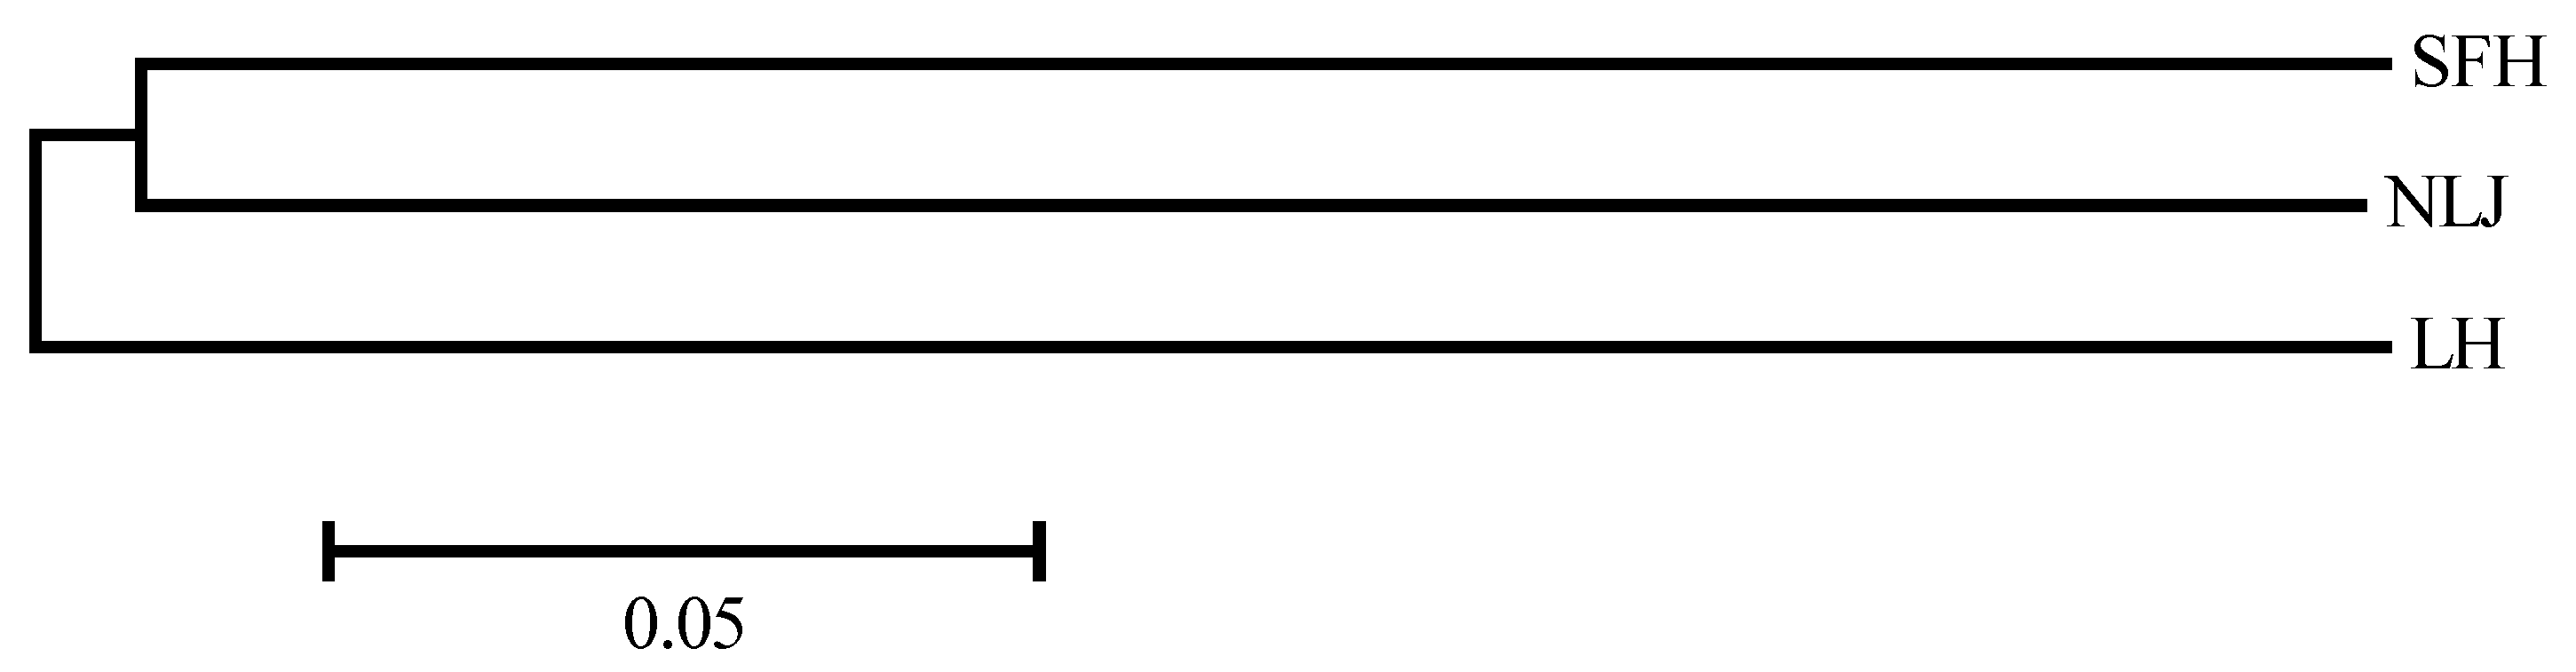
3.3. Genetic Differentiation of Eriocheir s. s. Populations

All pairwise FST values between populations, i.e., indices of population differentiation, were significantly different among these three Eriocheir s. s. populations (p < 0.01; Table 3 above the diagonal). The pairwise FST value ranged from 0.0352 (between SFH and LH) to 0.0409 (between SFH and NLJ). A significant pattern of differentiation was observed over all three Eriocheir s. s. populations (FST = 0.03822, p < 0.01; Table 4). Results of AMOVA showed significant differences both among and within populations (p < 0.01; Table 4), and 3.82% of the genetic variation was among populations and 96.18% within populations (Table 4). Unbiased genetic distances (Table 3 below the diagonal) over 19 microsatellite loci were estimated. The DS value varied from 0.3144 (between SFH and NLJ populations) to 0.3310 (between SFH and LH populations). The genetic relationships among Eriocheir s. s. populations were further assessed based on DS values by the reconstruction of phylogenetic trees. The neighbor-joining phylogenetic tree result is shown in Figure 5. SFH and NLJ populations were grouped together, and they then clustered together with the LH population.

4. Discussion

4.1. Genetic Diversity

The higher the genetic diversity, the greater the potential response to natural selection in the population, and the stronger the ability to adapt to the environment, which is conducive to the survival and evolution of the population [27]. In this study, 19 out of 20 highly polymorphic loci were screened to assess the genetic diversity of 180 wild Eriocheir s. s. individuals from three river basins, SFH, LH, and NLJ. The numbers of samples and loci in this study are sufficient to evaluate the genetic diversity parameters, because 30 samples and 10 loci are usually enough for genetic diversity analysis, while larger numbers of samples and loci have a great impact in terms of improving the accuracy of the genetic diversity parameters Na, Ne, and Ho [28]. In this study, the Na value was relatively high at Esin18, Esin42, and Esin67 loci within individuals compared with earlier studies [6,13,16,29]; this value represented the high number of alleles in our sampled individuals. These Na values, either low or high, may be determined by the numbers of samples or electrophoretic typing techniques [16]. All the average values of the Ne and I parameters at 19 loci showed high genetic diversity within individuals, and the results are similar to those of previous studies [13,30,31]. Polymorphism information content (PIC), i.e., a metric of genetic diversity, was not lower than 0.5, which illustrated high genetic diversity per locus. Through comparison with the literature, both wild or cultured Eriocheir s. s. were found to have high genetic diversity, unlike wild Cyprinus carpio [32], Ctenopharyngodon idellus [33], Pelteobagrus fulvidraco [34], Portunus trituberculatus [35], and Litopenaeus vannamei [36]. The allele frequencies of the three wild Eriocheir s. s. populations in this study displayed an “L” shape, indicating that the wild populations did not experience a recent bottleneck effect in their allele frequency distribution [37]. The heterozygosity in a population can reflect the level of genetic variation of that population. The higher the proportion of heterozygotes in the population, the greater the genetic variation [38]. The Ho and He values in this study illustrated high genetic variation, suggesting that the population can easily adapt to the changing environment. If the individuals are in HWE, the Ho and He values are close to each other at the locus. Otherwise, the individuals exhibit an excess or deficiency of heterozygotes [39]. In this study, 13 out of 19 microsatellite loci deviated from HWE, and 11 out of 13 deviated microsatellite loci showed heterozygote deficiency.
This study showed that the genetic diversity parameters of Na, Ne, PIC, I, and Nm values in the LH Eriocheir s. s. population were slightly higher than the other two Eriocheir s. s. populations, SFH and NLJ, indicating that the wild LH Eriocheir s. s. population had higher genetic diversity. Two reasons may explain this result. First, the LH Eriocheir s. s. population is an important species cultured in paddies and lakes in northeastern China, with a large population size, accompanied by proliferation and release. On the other hand, wild germplasm of the SFH and NLJ rivers has not been developed and utilized, and there are few river branches in its basin, which inhibits inter-population migration. Second, SFH and NLJ Eriocheir s. s. may not be the same species as LH E. sinensis. The microsatellite markers were specific primers for E. sinensis, but not for other Eriocheir s. s.; therefore, the microsatellite markers may not be absolutely precise for SFH and NLJ Eriocheir s. s. population analysis [16]. This may explain why genetic diversity parameters of the SFH and NLJ Eriocheir s. s. populations are lower than those of the LH Eriocheir s. s. population. To analyze the population genetic diversity of the SFH and NLJ Eriocheir s. s. populations, it is urgent to conduct screenings using genetic markers appropriate for evolutionary studies of this lineage.

4.2. Genetic Differentiation

Gene flow (Nm) and the genetic differentiation coefficient (FST) are two important parameters used to analyze the degree of genetic differentiation [32]. This study demonstrated a relatively high Nm value (7.31) and low FST value (0.0330) among populations at all loci, which implied low genetic differentiation. Pairwise FST values indicated genetic differentiation among the SFH, LH, and NLJ Eriocheir s. s. populations. Previous studies also demonstrated genetic differentiation, although the pairwise FST value between populations LH and NLJ was 0.0324 [6], which is very close to the pairwise FST value (0.0385) in this study. Likewise, the pairwise FST values among SFH, LH, and NLJ in this study were higher than those in earlier studies [13,16], e.g., 0.0050 (between LH and YZ) and 0.0105 (between YZ and MJ). Although the pairwise FST values (0.0352, 0.0385, and 0.0409) in this study were lower than 0.05, the values still suggest considerable genetic differentiation for Eriocheir s. s. Pairwise estimations of Nei’s DS exhibited a similar result. The DS values (0.3144, 0.3292, and 0.3310) were higher than in previous studies [13,16,23,29,40], which showed a relatively great genetic distance among SFH, LH, and NLJ Eriocheir s. s. populations. Based on Nei’s DS, the neighbor-joining phylogenetic tree was constructed among these three wild Eriocheir s. s. populations. This study illustrated that populations SFH and NLJ were closer to each other than to the LH population, which was consistent with results from a previous study [41] but contradicted those from Jiang et al.’s study [19]. In Jiang et al.’s study, the SFH population was clustered with the YZ population (E. sinensis) rather than the NLJ population. However, the NLJ population clustered with E. japonicus was sampled in Hyogo, Japan. Two reasons may explain the difference. First, microsatellite analysis is more accurate from the perspective of genetics, while a morphological method was used in Jiang et al.’s work. Second, E. japonicus was sampled in Hyogo, Japan (35.62° N, 134.48° E), which is far from the SFH population. Therefore, the authors maintained that E. japonicus should have many different geographical populations, just like E. sinensis, including the LH, YL, and YZ populations. The Hyogo population of E. japonicus is located in the south of Japan’s islands.
Results of AMOVA analysis revealed that total variation among populations was 3.82%, whereas 96.18% of variation was observed within populations. Low variation among populations may be caused by the Eriocheir s. s. lifecycle. Eriocheir s. s. has a catadromous lifecycle and travels through many different habitats during migration. Therefore, it was interpreted that Eriocheir s. s. probably loses local environmental adaptability [16].

5. Conclusions

Three wild Eriocheir s. s. populations (SFH, LH, and NLJ) had high genetic diversity and significant genetic differentiation. The study will provide important support for the conversation and management of Eriocheir s. s. populations.

Author Contributions

Conceptualization, S.W., W.X. and Z.Z.; methodology, S.W.; software, S.W.; validation, W.X. and Z.Z.; formal analysis, L.L.; investigation, R.Z.; resources, K.G.; data curation, S.W. and K.G.; writing—original draft preparation, S.W.; writing—review and editing, S.W. and Z.Z.; visualization, S.W.; supervision, W.X. and Z.Z.; project administration, L.L.; funding acquisition, S.W., W.X. and Z.Z. All authors have read and agreed to the published version of the manuscript.

Funding

This research was funded by Central Public-interest Scientific Institution Basal Research Fund, HRFRI (Grant No. HSY202008Q), Central Public-interest Scientific Institution Basal Research Fund, CAFS (Grant No. 2021XT05 and 2020TD56).

Institutional Review Board Statement

The studies on Eriocheir sensu stricto were reviewed and approved by the Committee for the Welfare and Ethics of Laboratory Animals of Heilongjiang River Fisheries Research Institute (Approval numbers: 20210901-001 (approved on 1 September 2021)).

Data Availability Statement

The data presented in this study are available on request from the corresponding author.

Acknowledgments

We would like to thank all the students in our team for their help in the collection of samples.

Conflicts of Interest

The authors declare no conflict of interest.

References

  1. Xu, J.W.; Chu, K.H. Genome scan of the mitten crab Eriocheir sensu stricto in East Asia: Population differentiation, hybridization and adaptive speciation. Mol. Phylogenet. Evol. 2012, 64, 118–129. [Google Scholar] [CrossRef] [PubMed]
  2. Wang, S.H.; Luo, L.; Guo, K.; Zhang, R.; Zhang, X.B.; Kong, L.J.; Zhao, Z.G. Body weight profile and proximate composition of adult Suifenhe Eriocheir sensu stricto. Prog. Fish. Sci. 2022, 43, 61–69. (In Chinese) [Google Scholar] [CrossRef]
  3. Wu, X.G.; Cheng, Y.X.; Sui, L.Y.; Zeng, C.S.; Southgate, P.C.; Yang, X.Z. Effect of dietary supplementation of phospholipids and highly unsaturated fatty acids on reproductive performance and offspring quality of Chinese mitten crab, Eriocheir sinensis (H. Milne-Edwards), female broodstock. Aquaculture 2007, 273, 602–613. [Google Scholar] [CrossRef]
  4. Chen, K.; Li, E.C.; Yu, N.; Du, Z.Y.; Chen, L.Q. Biochemical composition and nutritional value analysis of Chinese mitten crab, Eriocheir sinensis, grown in pond. Glo. Adv. Res. J. Agric. Sci. 2013, 2, 164–173. [Google Scholar]
  5. Bureau of Fisheries; Ministry of Agriculture and Rural Affairs. PRC.; National Fisheries Technology Extension Center; China Society of Fisheries. 2021 China Fishery Statistical Yearbook; China Agriculture Press: Beijing, China, 2021; p. 36. (In Chinese) [Google Scholar]
  6. Sui, L.Y.; Zhang, F.M.; Wang, X.M.; Bossier, P.; Sorgeloos, P.; Hänfling, B. Genetic diversity and population structure of the Chinese mitten crab Eriocheir sinensis, in its native range. Mar. Biol. 2009, 156, 1573–1583. [Google Scholar] [CrossRef]
  7. Zhang, L.S.; Zhai, J.J.; Wang, D.D. Ecological and morphological characteristics of populations of Chinese mitten crab (Eriocheir sinensis) from Changjiang, Oujiang and Liaohe Rivers and the quality identification of their young crabs. Fish. Sci. Tech. Info. 2000, 27, 200–205. (In Chinese) [Google Scholar] [CrossRef]
  8. Wang, S.H.; Zhao, Z.G.; Luo, L.; Zhang, R.; Guo, K.; Xu, W. A Comprehensive study of growth performance of Chinese mitten handed crab (Eriocheir sinensis) and water quality in rice-juveniles co-culture in Heilongjiang Province. Chin. J. Fish. 2022, 35, 86–92. (In Chinese) [Google Scholar]
  9. Li, Y.S.; Li, S.F.; Xu, G.Y.; Ling, W.H. Comparison of growth performance of Chinese mitten crab (Eriocheir sinensis) in pen culture from the Yangtze and Liaohe river systems. J. Shanghai Fish. Univ. 2000, 9, 189–193. (In Chinese) [Google Scholar] [CrossRef]
  10. Xu, J.W.; Chan, T.Y.; Tsang, L.M.; Chu, K.H. Phylogeography of the mitten crab Eriocheir sensu stricto in East Asia: Pleistocene isolation, population expansion and secondary contact. Mol. Phylogenet. Evol. 2009, 52, 45–56. [Google Scholar] [CrossRef] [PubMed]
  11. Kang, W.; Wu, L.; Liu, J.S.; Zhang, C.Y.; Lin, M.X.; Wang, J.; Wang, C.H. Morphological differences and genetic admixture in mitten crabs in the Tumenjiang River. J. Fish. Sci. China. 2016, 23, 555–564. (In Chinese) [Google Scholar] [CrossRef]
  12. Wang, C.H.; Li, C.H.; Li, S.F. Mitochondrial DNA-inferred population structure and demographic history of the mitten crab (Eriocheir sensu stricto) found along the coast of mainland China. Mol. Ecol. 2008, 17, 3515–3527. [Google Scholar] [CrossRef] [PubMed]
  13. Liu, Q.; Liu, H.; Wu, X.G.; He, J.; Dong, P.S.; Wang, Y.P.; Cheng, Y.X. Genetic variation of wild and cultured populations of chinese mitten crab Eriocheir sinensis from the Yangtze, Huanghe, and Liaohe river basins using microsatellite marker. Oceanol. Limnol. Sin. 2015, 46, 958–968. (In Chinese) [Google Scholar] [CrossRef]
  14. Li, C.H.; Li, S.F. Phylogenesis of populations of mitten crabs (Eriocheir sinesis, Eriocheir japonicus) in six river systems of mainland China: Morphology discriminant analysis. J. Fish. Sci. China 1999, 23, 337–342. (In Chinese) [Google Scholar]
  15. Li, S.F.; Zou, S.M. Phylogenesis of populations of mitten crabs (Eriocheir sinesis, Eriocheir japonicus) in six river systems of mainland China: RAPD fingerprinting marker. J. Fish. Sci. China 1999, 23, 325–330. (In Chinese) [Google Scholar]
  16. Wang, S.H.; Zhang, C.; Shang, M.; Wu, X.G.; Cheng, Y.X. Genetic diversity and population structure of native mitten crab (Eriocheir sensu stricto) by microsatellite markers and mitochondrial COI gene sequence. Gene 2019, 693, 101–113. [Google Scholar] [CrossRef]
  17. Guo, J.Y.; Ng, N.K.; Dai, A.; Ng, P.K.L. The taxonomy of three commercially important species of mitten crabs of the genus Eriocheir de Hann, 1835 (Crustacea: Decapod: Brachyura: Grapsidae). Raffles Bull. Zool. 1997, 45, 445–476. [Google Scholar]
  18. Yang, X.; Kong, L.J.; Zhang, Z.H.; Wang, X.Y.; Zhang, X.B. Experiment report on artificial propagation of Suifen River crab. Fish. Eco. Res. 2006, 3, 42–45. (In Chinese) [Google Scholar] [CrossRef]
  19. Jiang, X.D.; Cheng, Y.X.; Yang, Y.H.; Wu, X.G. Landmark-based morphometric identification of mitten crab Eriocheir from Suifen River. Fish. Sci. 2021, 40, 501–507. (In Chinese) [Google Scholar]
  20. Xu, J.W. Population Genetics of Mitten Crabs in Eriocheir sensu stricto. Ph.D. Thesis, Chinese University of Hong Kong, Hong Kong, China, 2005. [Google Scholar]
  21. Ma, H.T.; Chang, Y.M.; Yu, D.M.; Sun, X.W. Microsatellite variations among four populations of Eriocheir sinensis. Zool. Res. 2007, 28, 126–133. [Google Scholar] [CrossRef]
  22. Xiong, L.W.; Wang, Q.; Qiu, G.F. Large-scale isolation of microsatellites from Chinese mitten crab Eriocheir sinensis via a Solexa genomic survey. Int. J. Mol. Sci. 2012, 13, 16333–16345. (In Chinese) [Google Scholar] [CrossRef] [Green Version]
  23. Wang, Z.Q.; Huang, S.; Mao, H.C.; Zhou, L.; Wang, C.H. Genetic differentiation analysis of the even and odd year populations of Chinese mitten crab. J. Shanghai Ocean Univ. 2013, 22, 657–664. [Google Scholar]
  24. Xiong, L.W.; Liu, Z.Q.; Yan, Y.L.; Qiu, G.F. The segregation patterns of 37 polymorphism tri-nucleotide microsatellite markers in an F1 family of the Chinese mitten crab (Eriocheir sinensis). J. Fish. China 2015, 39, 174–181. (In Chinese) [Google Scholar] [CrossRef]
  25. Qiu, G.F.; Xiong, L.W.; Liu, Z.Q.; Yan, Y.L.; Shen, H. A first generation microsatellite-based linkage map of the Chinese mitten crab Eriocheir sinensis and its application in quantitative trait loci (QTL) detection. Aquaculture 2016, 451, 223–231. [Google Scholar] [CrossRef]
  26. Ma, X.X.; Wang, K.; Guo, W.Z.; Zhang, T.Z. Multiple SSR-PCR techniques and their application in cotton. Mol. Plant Breed. 2007, 5, 648–654. (In Chinese) [Google Scholar] [CrossRef]
  27. Teng, S.S.; Hu, G.Y.; Fan, J.X.; Chai, X.L.; Xiao, G.Q. Genetic diversity and genetic differentiation analysis of Sinonovacula constricta populations revealed by SNP markers. Acta Hydrobiol. Sin. 2021, 45, 861–870. (In Chinese) [Google Scholar] [CrossRef]
  28. Wang, S.H.; Luo, L.; Zhang, R.; Guo, K.; Xu, W.; Zhang, X.B.; Zhao, Z.G. Optimization of genetic diversity analysis parameters of mitten handed crab in Suifen River. Chin. J. Fish. 2022. accepted (In Chinese) [Google Scholar]
  29. Li, Q.Q.; Wu, X.G.; He, J.; Liu, Q.; Cheng, Y.X. Can genetic diversity be maintained during mass selection of the Chinese mitten crab, Eriocheir sinensis? Aquac. Res. 2018, 49, 1606–1615. [Google Scholar] [CrossRef]
  30. Hänfling, B.; Weetman, D. Characterization of microsatellite loci for the Chinese mitten crab, Eriocheir sinensis. Mol. Ecol. Notes 2003, 3, 15–17. [Google Scholar] [CrossRef]
  31. Zhu, Z.Y.; Shi, Y.H.; Le, G.W. Isolation and characterization of polymorphic microsatellites from Chinese mitten crab, Ericheir sinensis. Mol. Ecol. Notes 2006, 6, 838–839. [Google Scholar] [CrossRef]
  32. Yan, C.M.; Zhang, Y.B.; Zheng, W.; Sun, X.W.; Chang, Y.M.; Mao, R.X.; Liu, H.J.; Li, Z.Q.; Xiao, Z.G. Genetic relationship in wild carps using microsatellite markers. J. Northeast Agric. Univ. 2011, 42, 102–106. (In Chinese) [Google Scholar] [CrossRef]
  33. Zhou, P.; Zhang, Y.; Xu, P.; Lu, C.Y.; Sun, X.W. Genetic analysis of grass carp populations from three major watersheds based on 26 microsatellite markers. J. Fish. Sci. China 2011, 18, 1011–1020. (In Chinese) [Google Scholar] [CrossRef]
  34. Hu, Y.T.; Jiang, H.; Duan, G.Q.; Zhou, H.X.; Ling, J.; Wang, H. Genetic diversity analysis of Pelteobagrus fulvidraco from two major drainage systems in Anhui Province based on microsatellite markers. South China Fish. Sci. 2020, 16, 33–41. (In Chinese) [Google Scholar] [CrossRef]
  35. Han, Z.K.; Liu, P.; Li, J.; Gao, B.Q.; Chen, P. SSR analysis of selected populations of inbred Portunus trituberculatus. J. Fish. China 2012, 36, 25–31. (In Chinese) [Google Scholar] [CrossRef]
  36. Huang, X.S.; Xu, Y.; Hu, X.J.; Xu, W.J.; Su, H.C.; Wen, G.L.; Yang, K.; Cao, Y.C. Genetic diversity analysis of first filial generation of seven introduced Litopenaeus vannamei populations using microsatellite DNA markers. South China Fish. Sci. 2019, 15, 54–62. (In Chinese) [Google Scholar] [CrossRef]
  37. Zhao, X.C.; Jia, Z.Y.; Li, C.T.; Shi, L.Y. Study on the genetic structure of F3 common carp in the quality breeding population. Genom. Appl. Biol. 2015, 34, 90–95. [Google Scholar]
  38. Leberg, P.L. Estimating allelic richness: Effects of sample size and bottlenecks. Mol. Ecol. 2002, 11, 2445–2449. [Google Scholar] [CrossRef]
  39. Quan, Y.C.; Sun, X.W.; Liang, L.Q. Genetic popymorphism of microsatellite DNA in two populations of nothern sheatfish (Silurus soldatovi). Acta Genet. Sin. 2006, 33, 908–916. (In Chinese) [Google Scholar] [CrossRef]
  40. Tang, L.X.; Xu, Z.Q.; Ge, J.C.; Chen, Y.R.; Zhao, M.Z.; Yang, J.X. Microsatellite analysis on the genetic structure of three breeding stocks of Eriocheir sinensis. J. Nanjing Norm. Univ. Nat. Sci. Ed. 2013, 36, 84–90. (In Chinese) [Google Scholar] [CrossRef]
  41. Wang, W.; Xu, C.; Zhang, W.B.; Ma, X.Z. Comparative studies on morphological differences among four local populations of mitten crab. Chin. Agric. Sci. Bull. 2007, 23, 648–653. (In Chinese) [Google Scholar] [CrossRef]
Figure 1. Sampling locations of Eriocheir s. s. populations. The sampling locations, from north to south, were Suifenhe River (SFH), Liaohe River (LH), and Nanliujiang River (NLJ), respectively.
Fishes 07 00182 g001
Figure 2. Number of alleles for each microsatellite locus in Eriocheir s. s. populations. Green, yellow, and red colors represent the Nanliujiang River (NLJ), Liaohe River (LH), and Suifenhe River (SFH) populations, respectively.
Fishes 07 00182 g002
Figure 3. Allele frequency distribution of Eriocheir s. s. populations. (a) The percentage contents of 0.0–0.7 allele frequency distribution; (b) the percentage contents of 0.2–0.7 allele frequency distribution. Green, yellow, and red colors represent the Nanliujiang River (NLJ), Liaohe River (LH), and Suifenhe River (SFH) populations, respectively.
Fishes 07 00182 g003
Figure 4. Genetic diversity parameters for three Eriocheir s. s. populations. (a) Average number of observed alleles (Na); (b) average number of expected alleles (Ne); (c) average number of polymorphic information content (PIC); (d) average number of Shannon Wiener index (I); (e) average number of observed heterozygosity (Ho); (f) average number of expected heterozygosity (He); and (g) average number of gene flow (Nm) estimated after screening 19 microsatellite loci in three wild Eriocheir s. s. populations.
Fishes 07 00182 g004
Figure 5. Neighbor-joining phylogenetic tree of Eriocheir s. s. based on Nei’s genetic distance. SFH, LH, and NLJ represent the Eriocheir s. s. from Suifenhe, Liaohe, and Nanliujiang river basins, respectively.
Fishes 07 00182 g005
Table 1. Characterization of E. sinensis microsatellites.
Locus NamePrimer Sequences (5′–3′)Core SequenceTemperatureAllele Size Range
A9F: GCAATGAGACTCAACAGGAGA(GA)7(GT)760200–282
R: AATGTGGCTCACCTGACGT
Eril1F: GATAGACCGTAAATGAGACGGCTG(GGA)965151–174
R: GGACGGAGAAAACTAGAGACCACA
Eril2F: GGATTTACTTAAGTTGGGGCTCGT(GAG)865119–161
R: CGACGCAGTTTTGTCTAGAGACCT
Eril3F: CAGCGAAAAACAGGAAGCATTTAG(AC)1165140–212
R: GGAAAGGGAAAGTGAAGGATGAAT
Eril4F: TTCTTTGAGCGACATGCAAAAGT(TG)2965132–192
R: AGACAGACAGACAAAAACGCTCCT
Eril5F: TAGGGGGTTTTAGGTGTGGTGATA(TGA)965125–167
R: ATTTATGTGGAGGGAATGGGAGAT
Eril8F: TGTTGAGTGTGATGTTTGTGATGC(GT)1265160–226
R: TAATAGCGGCCAAACTTTGTTGAT
Eril10F: TACCTTTTTCAGGGTGAGTGAAGG(GT)2365138–208
R: AAGGACAGGAGGGAAAATGAGAGT
Eril12F: ACCCATCTCAAGTCCAGACTCATC(CCT)865152–170
R: AGAGGATGCAAGGGAAATAAGGAG
Eril13F: AAGGAAGGCAGTTAGGAGGGTATG(AC)1165189–259
R: TTATTATTGTGGCGACGAAGGGT
Eril16F: TCCTCCCTATGCTCTTTGTAGGTG(AC)1165150–192
R: AAGGCCCAGGAGTATGGTGAAC
Esin18F: CACCGTAAGGTTCCGTAA(GT)2658170–225
R: AAGCACCCATAAGTCAATGTA
Esin42F: GCACCGCAGTGATAATGTAGTGG(AC)1953235–275
R: GATCCTCGTGTGGGCGTGCTTAC
Esin67F: TTTGGGATTCACCTTGTCAACTT(GT)1153105–170
R: CGACGCACGACAGAGGAGAGG
Scaffold256287_157596F: CACGAAAGGGTAAAAGGGGTACAT(AGG)963102–126
R: TCTTCTGTTTCATCCTCGTCTTCC
Scaffold16450_13154F: TATTTTCTCCCCCTCCATCCTTTA(GGA)855147–189
R: GCATCGCCTACACCGTTTATTATC
Scaffold387247_202848F: TCCTCCTCCTCATCCTCATCA(AG)4055134–173
R: CTCGTGACTGGAAAATGCGAC
Scaffold101834_74240F: TGTTCCTCTTGTTCTGTTTTGTTCC(CTA)1053112–235
R: GGTTGCTTAATGGTGGCTTATGAA
Scaffold242247_151216F: TCCATAACAGTCCTCTGAGTTCCC(CTC)856133–175
R: AGGAGAGAGTGTTGGCATGGTAAG
Scaffold306931_218734F: CAATTTGCGCTAAATAGATGTCCC(AGT)963235–301
R: CCTCGAAGTTTGGGGTTAAAGGTA
Table 2. Genetic diversity of 19 microsatellite loci in three Eriocheir s. s. populations.
LocusNaNeHoHeIPICFISFITFSTNmEWTN
A934.0020.340.850.953.200.950.080.100.0212.010.09
Eril112.003.980.74 **0.751.710.71−0.010.020.037.970.28
Eril217.006.980.54 **0.862.320.850.340.370.046.380.20
Eril346.0026.620.99 **0.973.490.96−0.04−0.020.0214.300.06
Eril439.0023.520.69 **0.963.350.960.260.270.0212.270.08
Eril512.003.150.69 **0.681.630.66−0.05−0.010.045.980.29
Eril828.0017.820.84 **0.953.090.940.080.110.037.230.12
Eril1026.0015.380.910.942.910.930.010.030.0210.050.13
Eril1210.005.200.73 **0.811.860.780.070.090.0210.970.34
Eril1329.0017.530.940.953.040.94−0.020.010.039.610.11
Eril1624.007.170.78 **0.862.440.850.060.090.039.180.14
Esin1829.0018.560.68 **0.953.070.940.260.280.0216.150.11
Esin4218.0010.340.860.912.520.900.020.050.038.160.19
Esin6725.0012.980.83 **0.932.790.920.060.100.046.420.13
Scaffold256287_1575969.004.610.63 **0.791.750.760.190.200.0120.800.36
Scaffold16450_1315412.006.780.800.862.070.840.040.060.0210.970.28
Scaffold101834_7424034.0019.670.84 **0.953.200.950.090.120.037.830.09
Scaffold242247_15121612.003.730.46 **0.731.620.690.230.370.191.080.28
Scaffold306931_21873418.007.700.750.872.310.860.110.130.039.730.19
Average22.8412.210.770.882.550.860.090.120.037.310.18
Note: ** means extremely significant deviation from Hardy–Weinberg equilibrium (p < 0.01); EWTN: Ewens–Watterson test for neutrality.
Table 3. Nei’s genetic distance (DS, below the diagonal) and genetic differentiation coefficient (pairwise FST values, above the diagonal) for Eriocheir s. s. populations.
PopulationsSFHLHNLJ
SFH——0.0352 **0.0409 **
LH0.3310——0.0385 **
NLJ0.31440.3292——
Note: ** denotes significant difference (p < 0.01). SFH, LH, and NLJ represent the Eriocheir s. s. from Suifenhe, Liaohe, and Nanliujiang river basins, respectively.
Table 4. AMOVA results for Eriocheir s. s. populations.
Source of Variationd. f.Sum of SquaresVariance ComponentsPercentage of Variation (%)FSTp
Among populations277.0800.31807 Va3.820.038220.00000
Within populations2852281.4388.00504 Vb96.18
Total2872358.5178.32312100.00
Publisher’s Note: MDPI stays neutral with regard to jurisdictional claims in published maps and institutional affiliations.

