Abstract
Information on the biological parameters of exploited fish stocks facilitates the objective assessment and management of these living resources. The sardine (Sardina pilchardus) is considered as overexploited in northwest Africa. It is a key species of the Canaries current large marine ecosystem (CCLME) of the Atlantic Ocean due to its socioeconomic importance, as well as being a key intermediary species in marine food web. A massive decline in caught fish for Senegal over half a century is also reported (61,648 t in 1994 to 7486 t in 2017). Here, we analyzed the age and growth parameters of sardines in the Exclusive Economic Zone of northern Senegal. Maximum body size was 31 cm total length (TL). A growth performance index (φ′) and a growth rate coefficient (K) of 2.65 and 0.85, respectively, were determined, with this being the first record for this country. Sardines had higher asymptotic length (L∞, 30.5 cm TL) and age (6 years) in northern Senegal compared with Morocco (Atlantic Ocean) and the Mediterranean Sea. The asymptotic length found in Northern Senegal was also higher than in other part of the CCLME and Mediterranean Sea. This difference might be attributed to differences in the pelagic habitat, environmental factors, and/or fishing pressure. This study provides new insights towards establishing management measures, especially in data-poor fisheries and should act as an advocacy to increase sub-regional collaborations.
1. Introduction
The rate at which fish grow is a parameter that influences how individuals respond to various physiological stressors [1,2]. Growth parameters vary in time and space, depending on parental condition (e.g., weight and condition), food availability (abundance and quality), environmental parameters (temperature and salinity), and evolutionary stressors (e.g., density, fishing pressure) [3,4,5]. Thus, information obtained from growth parameters could help identify the adaptation strategies and environmental conditions of a given species [6], facilitating the modeling of population dynamics and impacts of anthropogenic factors for many fisheries considered poor in data [7].
The species Sardina pilchardus inhabits subtropical regions (8° N–14° N, 32° W–43° E), occurring in fish schools [8] at high concentrations along the northwest coast of Africa, Mediterranean Sea, Atlantic coast of the Iberian Peninsula and Bay of Biscay [9]. Plasticity in the growth performance, survival, and other life-history characteristics of this species is the key to their dynamics. Their sensitivity to environmental fluctuations makes them good targets for evaluating how climatic variability is impacting marine ecosystems [2,4]. If species fail to adapt or adjust to climate change, this issue could impact food security [2]. In northwest Africa (including Morocco, Mauritania, and Senegal), S. pilchardus remains the dominant fish species in commercial fisheries, constituting about 45% in biomass for all catches in small pelagic species in 2017. The total sardine catch in the sub-region (Morocco, Mauritania, Senegal) in 2017 increased by 14 percent from 2016, from about 1,068,000 tonnes (t) to more than 1,220,000 t [10]. Sardina pilchardus is overexploited in the waters of the Mediterranean [11,12] and Atlantic Ocean off west Africa [10]. Fréon and Stéquert [13] recorded S. pilchardus catches of 653.5 t in Senegal in 1979, and the FAO [14] documented an increase to 3391 t in 2011. Sardina pilchardus are almost exclusively caught by artisan fishers using motorized canoes with purse seines (400 m to 1000 m long) as fishing gear in Senegal (see ref. [15]).
Sardina pilchardus has been extensively studied in the Mediterranean waters [9,16,17], Atlantic coast of the Iberian Peninsula [18,19], Bay of Biscay [20,21,22,23], and Atlantic Ocean off northwest Africa [24,25,26]. However, most data on the growth of this species are dated and/or confined to the Morocco waters, where most sardines are caught (more than 90% [27]). Given the low catches of this species in Senegal, data on the growth of S. pilchardus in this country are rare. In particular, fish stocks for which little or no data are available present a serious problem for stock assessments [28].
Stock assessment is about providing fisheries managers with possible management choices and their consequences [29]. Commercial fish species have substantial data sets that can be incorporated by complex stock assessment models [30]. These data may include time series of total removals, catch-at-length or catch-at-age, relative or absolute abundance data, fishing effort, and information on life history parameters. These data sets are generally unavailable for most fisheries. Fisheries and stocks lacking these multiple types of data are referred to as data poor or “data limited” fisheries [31,32,33]. However, data-limited stock assessment is a broad field that includes several families of models [34]. These models have been developed to meet the demand for management of unassessed and data-limited fisheries, stocks, and species [32,35]. In such data-limited situations, two main quantitative approaches, based on data availability, can be used to assess the exploitation status of data-poor fisheries. These are the Length-Based Bayesian (LBB; [36]) and Length Based Integrated Mixed Effects (LIME; [37]) models, both length-based models applicable when only information on the catch size composition is available. Size frequency data [3] represent key information in species ecological processes. Due to the rapid availability of length data for many stocks, a number of length-based stock assessment methods have been developed and applied to estimate biological parameters and understand fish population dynamics [36,38,39]. Simple size-based assessments can be carried out for many stocks considered too data poor to assess [36] and allow estimating fish growth and mortality rates (e.g., refs. [40,41]). It is possible to apply generic management procedures, which are not necessarily the best practice for a given fishery, but better than taking no action [42]. Prince et al. [43] stated that the extension of the meta-analysis of species combined with general knowledge in the strategy of target species could be used to predict the life cycle characteristic ratios of highly exploited populations. Simple size-based assessments could be conducted on many stocks currently considered data poor for evaluation [43]. In the context of change in environmental conditions, fisheries managers must respond, by applying adaptive management strategies, to achieve sustainable and efficient management, even for data-poor stock [44] as in Senegal.
The current study aimed to provide estimates of the growth parameters of S. pilchardus in northern Senegal. The acquired growth parameters were then compared with those found in the literature off northwest Africa (e.g., Morocco), in the northeast Atlantic (Bay of Biscay and Iberian Peninsula) and the Mediterranean Sea (e.g., Greece, Italy, Spain). The results of this study are expected to contribute baseline information for the development of appropriate management measures.
2. Materials and Methods
2.1. Study Area
The northern part of Senegal (Figure 1) extends from Saint-Louis (16°04′ N) northwards to the tip of the Cap-Vert peninsula (14°36′ N, Dakar). This region is characterized by the presence of strong swells, a succession of dunes on the coast. A large mudflat of 20 to 80 m in depth is located on either side of the mouth of the Senegal River (15°15′ N–16°30′ N). From October, this area is characterized by cold (15 to 16 °C) [45,46,47], salty waters (35 to 36.5‰) that extend over the entire continental shelf by January [48,49]. The Senegal River contributes to the structuring of the marine area for a limited period (during periods of heavy river flows), during which time a stratified thin superficial lens of less saline water that does not reach the bottom forms [50,51]. This area forms a convergence zone, where the orientation of the coast facilitates the accumulation of water (upwelling) or downwelling [48]. The northern area supports very important fishing centers, including Saint-Louis, Fass Boye, Mboro, and Kayar [15], which correspond to the present ecological conditions. Traditional fishing communities have a strong presence [52].
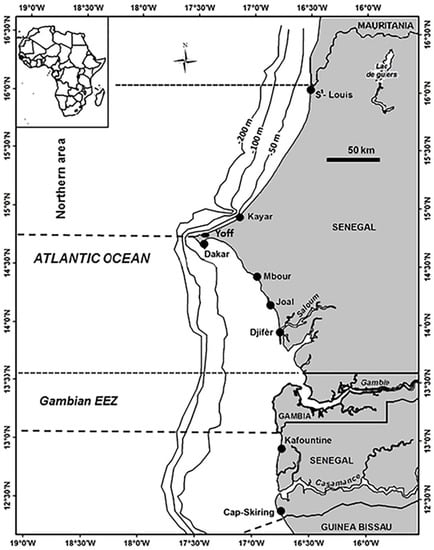
Figure 1.
Map of the study area with the localization of sampling stations corresponding to the main landing ports along the Senegal coast. The Northern section includes Saint-Louis, Kayar, and Yoff.
2.2. Biological Data
The data used in our study were collected during artisanal fisheries surveys in 2015 (987 specimens) over keys artisanal landing sites (Kayar, Saint-Louis, and Yoff) located on the north coast of Senegal (from 16°04′ N to 14°36′ N; Figure 1). Surveys carried out by the fishery research vessel (FRV) Dr Fridtjof Nansen [53] in 2007 (2153 specimens) and 2008 (811 specimens) were also included (Table 1). These fish surveys were conducted from November to December, with a few surveys during the June- to-July period (2007, 2008 and 2015). Samples consisted of random collections of individuals from survey hauls and landings. The method of capture deployed by the FRV Fridtjof Nansen was dependent on the size of the catch. Either the entire catch was sorted and measured or only sub-samples. At all trawl hauls, the catch was sorted according to species, and number and weight measurements were taken for all fish species. Key species length and weight are recorded using an electronic fish meter connected to a customized data acquisition system (Fish2Data and Biotic Editor; Version 1.9) running on the server of the vessel. Outlier data were excluded from the analyses. A total of 3951 fish samples were recorded during surveys (Table 1). Total length (TL in cm) of fish samples was measured to the nearest 1 mm. Sampled individuals were grouped into 1 cm interval size classes to calculate size–frequency distributions and to estimate growth parameters.

Table 1.
Size distribution of Sardina pilchardus (unsexed, expressed in centimeter) specimens (n = 3951) collected in Northern Senegal in landing sites (2015; n = 987) and during scientific cruises at sea (2007, n = 2153; 2008, n = 811).
2.3. Estimation of Growth Parameters
Von Bertalanffy growth parameters (K and L∞) were estimated from monthly length frequency data using the ‘TropFishR’ (Tropical Fisheries Analysis with R; Version 1.6.3) package [39]. These software packages contain many promising new features, but still include the Powell-Wetherall (P-W) method [54,55] as a central component of the proposed analyses [39]. The P-W method allows estimateing L∞ from a linearized transformation of the annual length frequency data (LFD) (i.e., the “catch curve”) of S. pilchardus. To do this, the mean lengths (Lmean) of all fish larger than the catch length (Lc) are calculated (Figure 2). This curve is plotted from a regression analysis of the results obtained (Lmean − Lc) using a simple linear function of the form L∞ = a/−b. The parameters L∞ and K (with standard errors) can be obtained from this method using manual selection of data points for regression [39,56,57].
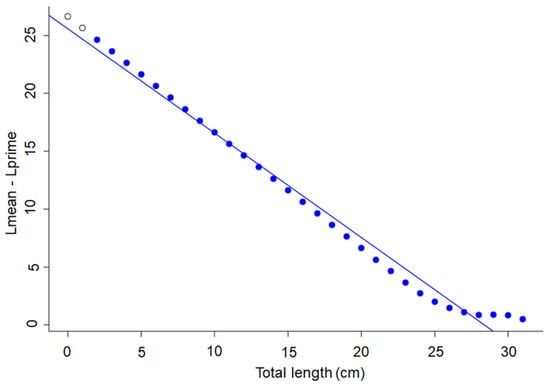
Figure 2.
Powell–Wetherall plot to derive an estimate of L∞ for Sardina pilchardus in Northern Senegalese waters. Lmean is the mean length of the cohort; Lprime is any length equal and above the length under full exploitation. The regression line identifies the first length at full exploitation, coinciding with the largest size grouping in the length-frequency data (blue circle).
There is broad acceptance that L∞ can be easily estimated, and that it is always close to Lmax (i.e., the length of largest individual in a given sample) in fisheries science, especially when studying data-poor fisheries and tropical stocks [39]. The largest size classes tend to be deselected, which appears to be beneficial, because it seems to solve the problem of the unbalanced influence of large-size classes. A unique procedure applied to the length–frequency data provides stock age composition and growth parameters. This procedure uses the length–frequency data to determine the percentage of fish at each age. The growth curve was plotted using the von Bertalanffy equation [58] as follows:
Lt is the fish size at time ‘t’ (in year); L∞ is the mean asymptotic length; ‘K’ is a constant of dimension year−1, expressing the rate at which L∞ is approached; ‘t’ is the age; and t0 is a theoretical age corresponding to zero length.
The growth performance index of a species was captured by the growth index (φ′) [59], and was computed from L∞ and K:
Because t0 cannot be estimated from length–frequency data, a very approximate value of t0 was estimated by substituting L∞ (in cm) and K (year −1) in the following equation [40]:
The growth performance index (φ′) was used to compare growth rates among S. pilchardus, and to evaluate growth performance potential under different environmental constraints [4]. According to Pauly [60], it is possible to compare the different growth parameters obtained from a length frequency distribution with parameters based on scales and otoliths. Thus, the growth parameters of S. pilchardus from different stocks (Mediterranean sea versus Atlantic Ocean off northwest Africa) (Table 2) were used to construct an auximetric double logarithmic plot of an individual’s coefficient of growth rate (K) against an estimate of its mean asymptotic length (L∞). All growth parameters were converted to total length (TL) based on the relationship given by Fréon and Stéquert [13]:
where ‘FL’ is fork length; ‘SL’ is standard length; and ‘TL’ is total length (in cm).
Table 2.
Growth parameters of Sardina pilchardus (unsexed) estimated in Northern Senegal (present study) and in Northwest Africa, Iberian Peninsula, Bay of Biscay, and the Mediterranean Sea. The growth parameters were estimated according to three different methods, i.e., scale, otoliths, or length frequencies as in the present study (size expressed in cm and Total length). Lmax: maximum recorded length (cm); L∞: Lt value when the growth rate is zero; K: coefficient of growth rate, t0: theoretical time “t” when the fish length is zero, φ′: growth performance index. NR: not reported, LF: Length–Frequencies.
2.4. Statistical Analysis
Statistical analyses were performed using “stats” and “Hmisc” R packages [73,74]. Significance was set to α < 0.05. We used analyses of variance (ANOVAs) to compare total length distributions, followed by Kruskal–Wallis tests. Estimated growth parameters (Table 2) of sardine stocks in the Mediterranean and Atlantic Ocean off northwest Africa were used to construct an auximetric plot of the K parameter against the corresponding estimate of asymptotic length L∞. This graph was used to compare intra-species and inter-species growth performance [4]. The growth performance index (φ′) of different oceanic regions (Mediterranean and Atlantic Ocean off northwest Africa) was tested by Kruskal–Wallis tests. The growth performance index (φ′) was used to compare growth rates, and to assess the potential for growth under different environmental stresses, such as overexploitation and climate change.
3. Results
3.1. Population Structure
The size distribution of S. pilchardus in the sea off northern Senegal peaked at 26 ± 1 cm. The maximum length (Lmax) of samples recorded was 31 cm. Comparison of monthly variability of the size distribution showed a significant difference in S. pilchardus (ANOVA: F-value = 11.86, p-value < 0.001; Kolmogorov–Smirnov: D = 0.13162, p-value < 0.001; Figure 3).
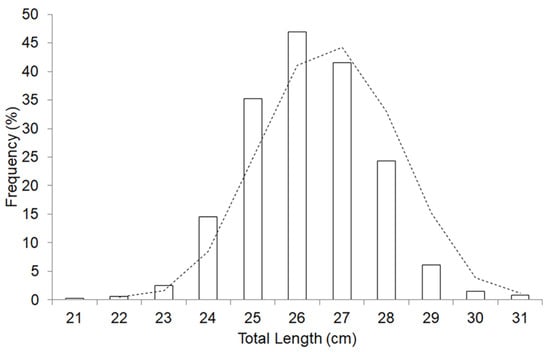
Figure 3.
Size frequency distributions for Sardina pilchardus caught off the Northern Senegalese waters. The total length was used (in cm); mode at 26 cm (n = 3951). The observed distribution (bars) and a trend curve (polynomial).
3.2. Growth Parameters
Growth parameters were estimated as (Figure 4) L∞ = 30.5 cm (i.e., closer Lmax); t0 = −0.58; K = 0.85. Our results showed that S. pilchardus grew rapidly during the first and second year of life, and then growth slowed down gradually until it was almost negligible after five years (Figure 4). More than 60% of maximum length was achieved during the second year of life (Figure 4). The estimated values of L∞ and K were plotted on an auximetric plot (Figure 4).
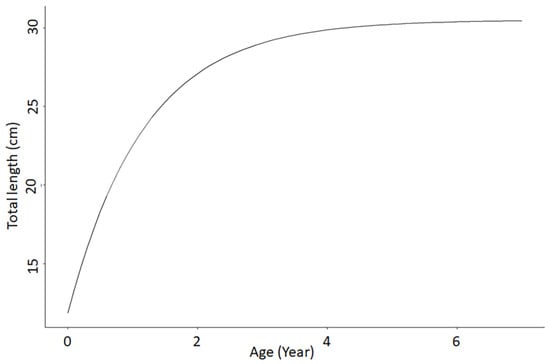
Figure 4.
The Sardina pilchardus von Bertalanffy growth curves fitted to monthly mean length-at-age data in Northern Senegalese waters. Data collected in 2015 (987 specimens), 2007 (2153 specimens), and 2008 (811 specimens).
No statistical differences was found between the growth performance index (φ′) of historical data collected off the coast of Senegal and data collected from other areas off Northwest Africa (Kruskal–Wallis; chi-squared = 2, df = 1, p-value = 0.1573; Table 2). The growth performance of stocks off Northwest Africa, Iberian Peninsula, Bay of Biscay, and the Mediterranean Sea did not differ significantly (Kruskal–Wallis; chi-squared = 7.7877, df = 4, p-value = 0.09967). The growth parameters (L∞, K and φ′) of S. pilchardus were higher off northwest Africa compared with the Iberian Peninsula, the Bay of Biscay, and the Mediterranean Sea (Figure 5). Asymptotic length (L∞) was also higher in the present study compared with those found off Morocco (ANOVA: p < 0.05; Table 2). Sardina pilchardus inhabiting the ocean off northwest Africa were characterized by longer lifespans (tmax), higher maximum lengths (Lmax), and longer asymptotic lengths (L∞) compared with those inhabiting the Iberian Peninsula, the Bay of Biscay, and the Mediterranean Sea (Kruskal–Wallis; chi-squared = 5.901, df = 4, p-value = 0.2067; Table 2).
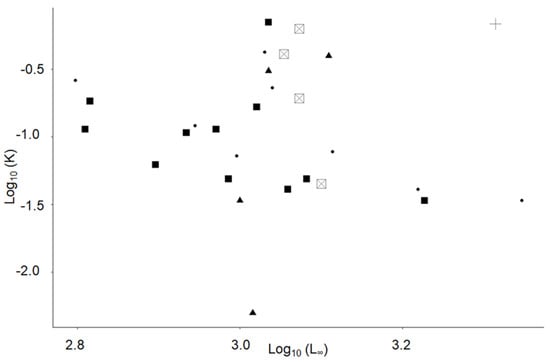
Figure 5.
Auximetric plot for Sardina pilchardus in Northern Senegalese waters using data from Table 1. Data in this study were from Senegal (plus) and from a literature review of Mediterranean Sea (square), Iberian Peninsula (triangle), Bay of Biscay (circle), and Northwest Africa (square with cross). Abbreviations: L∞: (asymptotic length, in cm) and K: (coefficient of growth rate (per year)).
4. Discussion
This work has a major disadvantage to consider. Indeed, the study of the biological parameters of the sardine, which is a species shared with neighboring countries, cannot be isolated and any exploitation may occur outside the maritime borders of Senegal [3,52]. Several large individuals were found in the waters off northern Senegal (21 to 31 cm). Fréon and Stéquert [13] suggested that such individuals occur when living conditions are more favorable in the northern Senegal (temperature, food availability). Of note, because these fish are planktivorous, variation in the intensity of upwelling directly affects the distribution and abundance of phytoplankton [75]. In turn, phytoplankton condition the dynamics of primary consumers, including zooplankton [76] and small pelagic fish [1].
The biological parameters of small pelagic fishes are expected to differ with habitat, environment factors, and overfishing [3,4,6]. The current study showed that the asymptotic length (L∞) of S. pilchardus was 30.5 cm maximum at six years, and that this value differed significantly to other countries in northwest Africa (Table 2). In particular, L∞ was much larger compared with previous results obtained in the same study area (northwest Africa, i.e., Morocco). However, interpretation of S. pilchardus growth is influenced by the seasonal variation knowing that seasonal differences in growth were reported [3,52]. Moreover, for fish migratory species, such as S. pilchardus, the input data in growth studies is often biased (some elements could be missing because the entire cohort is not present in the sampling area). The difference in L∞ reported was also reflected in the maximum length of S. pilchardus observed in Senegal (31.1 cm in the present study), which was higher compared with Morocco (Table 2). This difference could be explained by the existence of different stocks or meta populations. Genetic differences for S. pilchardus was reported along the Moroccan coast (Comm Pers Malika Chlaida, INRH), and Fréon and Stéquert [13] recorded two subspecies. Based on meristic studies, Silva [77] also showed that sardines in the southern Iberian Peninsula and Morocco were distinct to sardines in the rest of the western Mediterranean Sea. Genetic studies carried out by Atarhouch et al. [78] also showed differences between the population of Pasajes (Bay of Biscay in the northern Atlantic), the Mediterranean Sea, and the Moroccan coast (Atlantic Ocean). However, the differences reported in growth parameters may be related to the types of data used (e.g., length frequency, otolith). All datasets require representative length frequency information, covering the full length range of the species [79,80,81]. The use of a limited length range may lead to a bias in the estimation of growth parameters. However, this approach of length frequency is more suitable for young, fast-growing fish where length patterns for each age group are easily distinguished. The suitability for length frequency analysis depends on the structure of the data. Whereas, the results obtained from the otolith studies are known to provide uncertainties with respect to aging errors. Indeed, the growth medium can have a considerable impact on the formation of the false ring and thus on the results [82,83]. Environmental factors, such as sea water temperature, can affect fish growth. Hammers et al. [83] indicated that measurement errors may be related to difficulty in locating the exact center of the scale focus or core of the otolith and in identifying the margin of the annuli or the location where faster growth has resumed [83].
Within the same fish population, there may be a series of biometric and meristic characteristics that change according to the environment [1,84,85,86]. Indeed, the early life stages and spatial distribution of S. pilchardus in the Mediterranean Sea are strongly linked to environmental changes. Compared with the waters off northwest Africa, prey availability and seawater temperature were lower in the Mediterranean Sea [76], which could explain the difference and lower L∞ found with the Senegalese S. pilchardus.
According to Hattab et al. [87] and Basilone et al. [88,89], environmental changes may have impacts on the size and fecundity of small pelagic species. These results were also confirmed by Baldé et al. [4,6] in West Africa. Indeed, growth is strongly influenced by environmental variations which lead to a decrease or increase in fecundity of small pelagics in Senegal. Analysis based on the size and shape of fish indicates that sardines in northern Morocco were distinct to those in southern Morocco [90] which reflect contrasted environmental conditions. Fréon and Stéquert [13] suggested that the Senegal stock belongs to the Mauritanian stock, which is separate from Moroccan stocks. This stock difference is strongly linked to the intensification of upwelling in the Senegal–Mauritanian area [91]. A low intensity phase of upwelling and global warming in the Senegal–Mauritanian zone could lead to the northward regression of the southern limit of S. pilchardus stock [92].
A moderate increase in favorable (North East) wind speed enhances plankton production in Northwest Africa upwelling ecosystem, which improves the growth performance of S. pilchardus [93]. The growth parameters and asymptotic length for this short-lived species tend to be higher in more productive areas such as the Atlantic Ocean off northwest Africa compared with the Iberian Peninsula, the Bay of Biscay, or the Mediterranean Sea.
In addition to environmental factors, high rates of fishing mortality alter population structure and growth rates of many pelagic fishes [4,6,9]. Voulgaridou and Stergiou [9] showed that a decrease in S. pilchardus body size from 1996 to 2000 corresponded to a sharp increase in sardine landings from 1992 to 1997 in the Mediterranean Sea (Greece). In northwest Africa (Senegal), Sardinella aurita and Ethmalosa fimbriata exhibit similar behaviors. Baldé et al. [94] and Baldé et al. [3,4] hypothesized that there would be a relationship between increased in catches and decrease in growth performance for both species. Fishing generally affects the length structure of fishing stocks (e.g., Baldé et al. [3]). Indeed, there was an increase in S. pilchardus catches in 1975, 1980, 1984, 1990, 1992, 1996, 2007, 2010, and 2017 in the northern waters of Senegal (Figure 6). This relationship between growth and exploitation has also been observed for other sardine species (Sardinops melanostictus; e.g., ref. [95]). The relationship between fishing mortality and growth performance might ultimately be the result of the fishing gear selectivity change of fishing practice and adaptation of artisanal fishermen, e.g., refs. [3,94], leading to an evolutionary change in growth through the continuous removal of larger individuals from populations. However, insufficient data were available on S. pilchardus, preventing our ability to establish a clear direct relation of growth parameters (including growth rates) with environmental factors.
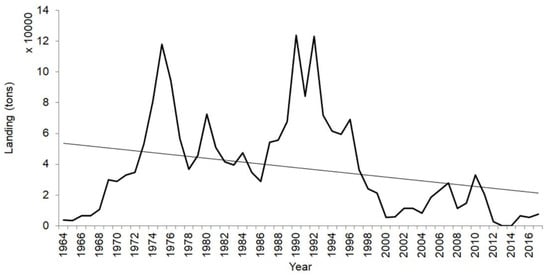
Figure 6.
Landing of Sardina pilchardus of the artisanal fishery of Senegal (1964 to 2017). Data source: Centre de Recherches Océanographiques de Dakar-Thiaroye (ISRA/CRODT, Dakar, Senegal).
5. Conclusions
This work has provided results to improve scientific advices for sustainable management of S. pilchardus in the Senegalese waters. Based on their length frequency data, we hypothesize that the growth performance of S. pilchardus is strongly dependent on environmental conditions and fishing pressure. Indeed, environmental characteristics (e.g. thermal preferendum, availability of prey) and the level of fishing pressure exerted on S. pilchardus could exert a balanced impact on growth parameters and asymptotic length, and should therefore be considered as phenotypic parameters. At methodological level, the approach used in this study could contribute to the sustainable management of various small pelagic species that inhabit the sub-region and over, in a context of data poor fisheries. The results of this study encourage for more collaborative work at sub-regional level on S. pilchardus to improve management purposes, especially in the context of climate change and over exploitation.
Author Contributions
Conceptualization: B.S.B., P.B. and S.F.; Data curation: B.S.B., P.D. and S.F.; Formal analysis: B.S.B. and P.D.; Methodology: B.S.B. and P.D.; Project administration: B.S.B. and P.B.; Resources: B.S.B. and S.F.; Software: B.S.B. and P.D.; Validation: P.B.; Supervision: P.B.; Visualization: B.S.B.; Writing—original draft: B.S.B., P.D. and S.F.; Writing—review and editing: B.S.B., P.D. and P.B.; The manuscript was written through contributions of all authors. All authors have read and agreed to the published version of the manuscript.
Funding
Data analysis was done inside the AWA project funded by IRD and the BMBF (grant 01DG12073E), and the Preface project funded by the European Commission’s Seventh Framework Program (2007–2013) under Grant Agreement number 603521. Paper redaction was done within the MAVA foundation for OAP8 actions in West Africa including AGD-pelagic project (SRFC/CSRP) and the TriAtlas European project (grant agreement number 817578). The data for this study were collected through the CRODT (Senegal) fisheries information system. We are thankful to all CRODT technicians for their professionalism during the data collection on the field all the year around.
Institutional Review Board Statement
No specific authorization was required for any activities undertaken during this work at any of the sites visited. The study was conducted in the waters of the Senegalese State. Threatened or protected species have not been involved in any part of the field studies. No approval was required from the Institutional Animal Care and Use Committee, and no field license was required during any part of the experiment.
Conflicts of Interest
The authors declare no conflict of interest.
References
- Baldé, B.S. Dynamique des Petits Poissons Pélagiques (Sardinella aurita et Ethmalosa fimbriata) au Sénégal dans un Contexte de Changement Climatique: Diagnostic et Synthèse Bioécologiques. Ph.D. Thesis, Université Cheikh Anta Diop, Dakar, Senegal, 2019. [Google Scholar]
- Checkley, D.; Alheit, J.; Oozeki, Y.; Roy, C. Climate Change and Small Pelagic Fish; Cambridge University Press: Cambridge, UK, 2009. [Google Scholar]
- Baldé, B.S.; Fall, M.; Kantoussan, J.; Sow, F.N.; Diouf, M.; Brehmer, P. Fish-Length Based Indicators for Improved Management of the Sardinella Fisheries in Senegal. Reg. Stud. Mar. Sci. 2019, 31, 100801. [Google Scholar] [CrossRef]
- Baldé, B.S.; Sow, F.N.; Ba, K.; Ekau, W.; Brehmer, P.; Kantoussan, J.; Fall, M.; Diouf, M. Variability of Key Biological Parameters of Round Sardinella Sardinella aurita and the Effects of Environmental Changes. J. Fish Biol. 2019, 94, 391–401. [Google Scholar] [CrossRef] [PubMed] [Green Version]
- Puerta, P.; Hunsicker, M.E.; Quetglas, A.; Álvarez-Berastegui, D.; Esteban, A.; González, M.; Hidalgo, M. Spatially Explicit Modeling Reveals Cephalopod Distributions Match Contrasting Trophic Pathways in the Western Mediterranean Sea. PLoS ONE 2015, 10, e0133439. [Google Scholar] [CrossRef] [PubMed]
- Baldé, B.S.; Döring, J.; Ekau, W.; Diouf, M.; Brehmer, P. Bonga Shad (Ethmalosa fimbriata) Spawning Tactics in an Upwelling Environment. Fish. Oceanogr. 2019, 28, 686–697. [Google Scholar] [CrossRef] [Green Version]
- Froese, R.; Winker, H.; Coro, G.; Demirel, N.; Tsikliras, A.C.; Dimarchopoulou, D.; Scarcella, G.; Probst, W.N.; Dureuil, M.; Pauly, D. On the Pile-up Effect and Priors for Linf and M/K: Response to a Comment by Hordyk et al. on A New Approach for Estimating Stock Status from Length Frequency Data. ICES J. Mar. Sci. 2019, 7, 461–465. [Google Scholar] [CrossRef]
- Brehmer, P.; Gerlotto, F.; Laurent, C.; Cotel, P.; Achury, A.; Samb, B. Schooling Behaviour of Small Pelagic Fish: Phenotypic Expression of Independent Stimuli. Mar. Ecol. Prog. Ser. 2007, 334, 263–272. [Google Scholar] [CrossRef] [Green Version]
- Voulgaridou, P.; Stergiou, K.I. Trends in Various Biological Parameters of the European Sardine, Sardina pilchardus (Walbaum, 1792), in the Eastern Mediterranean Sea. Sci. Mar. 2003, 67, 269–280. [Google Scholar] [CrossRef] [Green Version]
- FAO. Report of the FAO Working Group on the Assessment of Small Pelagic Fish off Northwest Africa. Banjul, the Gambia, 26 June–1 July 2018. Rapport Du Groupe de Travail de La FAO Sur l’évaluation Des Petits Pélagiques Au Large de l’Afrique Nord-Occidentale. Banjul, Gambie, 26 Juin–1 Juillet 2018; FAO: Rome, Italy, 2020; p. 321. [Google Scholar]
- ICES. Report of the Working Group on Biological Parameters; ICES: Ghent, Belgium, 2018; p. 186. [Google Scholar]
- ICES. Report of the Working Group on Southern Horse Mackerel, Anchovy and Sardine (WGHANSA); ICES: Lisbon, Portugal, 2018. [Google Scholar]
- Fréon, P.; Stéquert, B. Note Sur La Présence de Sardina pilchardus (Walb.) Au Sénégal: Étude de La Biométrie et Interprétation. Cybium 1979, 6, 65–90. [Google Scholar]
- FAO. Report of the FAO Working Group on the Assessment of Small Pelagic Fish off Northwest Africa. Casablanca. Morocco, 24–28 May 2011; FAO: Casablanca, Maroc, 2013; p. 267. [Google Scholar]
- Diankha, O.; Demarcq, H.; Fall, M.; Thiao, D.; Thiaw, M.; Sow, B.A.; Gaye, A.T.; Brehmer, P. Studying the Contribution of Different Fishing Gears to the Sardinella Small-Scale Fishery in Senegalese Waters. Aquat. Living Resour. 2017, 30, 27. [Google Scholar] [CrossRef] [Green Version]
- Colloca, F.; Cardinale, M.; Maynou, F.; Giannoulaki, M.; Scarcella, G.; Jenko, K.; Bellido, J.M.; Fiorentino, F. Rebuilding Mediterranean Fisheries: A New Paradigm for Ecological Sustainability. Fish Fish. 2013, 14, 89–109. [Google Scholar] [CrossRef]
- Laskaridis, K. Study of the Biology of the Sardine (Clupea pilchardus Walb.) in Greek Waters. Prakt. Ell.’Udrobiol. Inst 1948, 2, 83–87. [Google Scholar]
- López-Jamar, E.; Coombs, S.H.; García, A. The Distribution and Survival of Larvae of Sardine Sardina pilchardus (Walbaum, 1792) off the North and North-Western Atlantic Coast of the Iberian Peninsula, in Relation to Environmental Conditions. Oceanogr. Lit. Rev. 1998, 7, 1234. [Google Scholar]
- Guisande, C.; Vergara, A.R.; Riveiro, I.; Cabanas, J.M. Climate Change and Abundance of the Atlantic-Iberian Sardine (Sardina pilchardus). Fish. Oceanogr. 2004, 13, 91–101. [Google Scholar] [CrossRef]
- Borja, A.; Fontan, A.; Sáenz, J.O.N.; Valencia, V. Climate, Oceanography, and Recruitment: The Case of the Bay of Biscay Anchovy (Engraulis encrasicolus). Fish. Oceanogr. 2008, 17, 477–493. [Google Scholar] [CrossRef]
- Chouvelon, T.; Chappuis, A.; Bustamante, P.; Lefebvre, S.; Mornet, F.; Guillou, G.; Violamer, L.; Dupuy, C. Trophic Ecology of European Sardine Sardina pilchardus and European Anchovy Engraulis encrasicolus in the Bay of Biscay (North-East Atlantic) Inferred from Δ13C and Δ15N Values of Fish and Identified Mesozooplanktonic Organisms. J. Sea Res. 2014, 85, 277–291. [Google Scholar] [CrossRef] [Green Version]
- Laurent, V.; Planes, S. Effective Population Size Estimation on Sardina pilchardus in the Bay of Biscay Using a Temporal Genetic Approach. Biol. J. Linn. Soc. 2007, 90, 591–602. [Google Scholar] [CrossRef] [Green Version]
- Planque, B.; Bellier, E.; Lazure, P. Modelling Potential Spawning Habitat of Sardine (Sardina pilchardus) and Anchovy (Engraulis encrasicolus) in the Bay of Biscay. Fish. Oceanogr. 2007, 16, 16–30. [Google Scholar] [CrossRef]
- Belveze, H. Observations Complémentaires Sur Le Stock Sardinier de l’Atlantique Maroccain de 1968 à 1971 et Estimation de Quelques Paramètres.(Supplementary Observations on the Sardine Stock along the Moroccan Atlantic Coast from 1968 to 1971 and Estimation of Some Parameters). Bull. Inst. Pêches Marit. Maroco 1972, 20, 5–69. [Google Scholar]
- Erzini, K. An Empirical Study of Variability in Length-at-Age of Marine Fishes. J. Appl. Ichthyol. 1994, 10, 17–41. [Google Scholar] [CrossRef]
- Idrissi, M. Note Sur La Pecherie Des Espéces Pélagiques En Méditerranée. FAO Fish. Rep. 1987, 395, 133–139. [Google Scholar]
- FAO. Report of the FAO Working Group on the Assessment of Small Pelagic Fish off Northwest Africa Casablanca, Morocco, 20–25 July 2015/ Rapport du groupe de travail de la FAO sur l’évaluation des petits pélagiques au large de l’Afrique Nord-Occidentale Casablanca, Maroc, 20-25 Juillet 2015 (Casablanca, Maroc: FAO); FAO: Casablanca, Maroc, 2016; p. 243. [Google Scholar]
- Hordyk, A.; Ono, K.; Valencia, S.; Loneragan, N.; Prince, J. A Novel Length-Based Empirical Estimation Method of Spawning Potential Ratio (SPR), and Tests of Its Performance, for Small-Scale, Data-Poor Fisheries. ICES J. Mar. Sci. 2015, 72, 217–231. [Google Scholar] [CrossRef] [Green Version]
- Hilborn, R.; Walters, C.J. Quantitative Fisheries Stock Assessment: Choice, Dynamics and Uncertainty. Rev. Fish Biol. Fish. 1992, 2, 177–178. [Google Scholar]
- Methot, R.D., Jr.; Wetzel, C.R. Stock Synthesis: A Biological and Statistical Framework for Fish Stock Assessment and Fishery Management. Fish. Res. 2013, 142, 86–99. [Google Scholar] [CrossRef]
- Alemany, J. Development of a Bayesian Framework for Data Limited Stock Assessment Methods and Management Scenarios Proposal. Case Studies of Cuttlefish (Sepia officinalis) and Pollack (Pollachius pollachius). Ph.D. Thesis, Normandie Université, Le Havre, France, 2017. [Google Scholar]
- Costello, C.; Ovando, D.; Hilborn, R.; Gaines, S.D.; Deschenes, O.; Lester, S.E. Status and Solutions for the World’s Unassessed Fisheries. Science 2012, 338, 517–520. [Google Scholar] [CrossRef] [PubMed] [Green Version]
- Dowling, N.A.; Dichmont, C.M.; Haddon, M.; Smith, D.C.; Smith, A.D.M.; Sainsbury, K. Empirical Harvest Strategies for Data-Poor Fisheries: A Review of the Literature. Fish. Res. 2015, 171, 141–153. [Google Scholar] [CrossRef]
- Chrysafi, A.; Kuparinen, A. Assessing Abundance of Populations with Limited Data: Lessons Learned from Data-Poor Fisheries Stock Assessment. Environ. Rev. 2016, 24, 25–38. [Google Scholar] [CrossRef]
- Chrysafi, A.; Cope, J.M.; Kuparinen, A. Eliciting Expert Knowledge to Inform Stock Status for Data-Limited Stock Assessments. Mar. Policy 2019, 101, 167–176. [Google Scholar] [CrossRef]
- Froese, R.; Winker, H.; Coro, G.; Demirel, N.; Tsikliras, A.C.; Dimarchopoulou, D.; Scarcella, G.; Probst, W.N.; Dureuil, M.; Pauly, D. A New Approach for Estimating Stock Status from Length Frequency Data. ICES J. Mar. Sci. 2018, 75, 2004–2015. [Google Scholar] [CrossRef]
- Rudd, M.B.; Thorson, J.T. Accounting for Variable Recruitment and Fishing Mortality in Length-Based Stock Assessments for Data-Limited Fisheries. Can. J. Fish. Aquat. Sci. 2017, 75, 1019–1035. [Google Scholar] [CrossRef]
- Froese, R.; Winker, H.; Gascuel, D.; Sumalia, U.R.; Pauly, D. Minimizing the Impact of Fishing. Fish Fish. 2016, 17, 785–802. [Google Scholar] [CrossRef]
- Mildenberger, T.K.; Taylor, M.H.; Wolff, M. TropFishR: An R Package for Fisheries Analysis with Length-Frequency Data. Methods Ecol. Evol. 2017, 8, 1520–1527. [Google Scholar] [CrossRef] [Green Version]
- Pauly, D. Some Simple Methods for the Assessment of Tropical Fish Stocks; Fisheries Report; FAO: Rome, Italy, 1982; Volume 234, ISBN 92-5-101333-0. [Google Scholar]
- McQuinn, I.H.; Cleary, L.; O’Boyle, R.N. Estimation de La Mortalité Naturelle. In Méthodes d’évaluation des Stocks Halieutiques; Projet CIEO-860060; Centre International d’Exploitation des Oceans: Halifex, NS, Canada, 1990; Volume 1, pp. 441–464. [Google Scholar]
- Bentley, N.; Stokes, K. Contrasting Paradigms for Fisheries Management Decision Making: How Well Do They Serve Data-Poor Fisheries? Mar. Coast. Fish. Dyn. Manag. Ecosyst. Sci. 2009, 1, 391–401. [Google Scholar] [CrossRef]
- Prince, J.; Hordyk, A.; Valencia, S.R.; Loneragan, N.; Sainsbury, K. Revisiting the Concept of Beverton–Holt Life-History Invariants with the Aim of Informing Data-Poor Fisheries Assessment. ICES J. Mar. Sci. 2015, 72, 194–203. [Google Scholar] [CrossRef] [Green Version]
- Pilling, G.M.; Apostolaki, P.; Failler, P.; Floros, C.; Large, P.A.; Morales-Nin, B.; Reglero, P.; Stergiou, K.I.; Tsikliras, A.C. Assessment and Management of Data-Poor Fisheries. Adv. Fish. Sci. 2008, 50, 280–305. [Google Scholar] [CrossRef]
- Gningue, I.D.; Gueye, P. Recueil Des Données Physico-Chimiques Enregistrées Au Niveau Des Stations Côtières Du Sénégal de 1987 à 1993; Centre de Recherches Océanographiques de DakarThiaroye: Dakar, Senegal, 1994; p. 141. [Google Scholar]
- Ndoye, S.; Capet, X.; Estrade, P.; Sow, B.; Dagorne, D.; Lazar, A.; Gaye, A.; Brehmer, P. SST Patterns and Dynamics of the Southern Senegal-Gambia Upwelling Center. J. Geophys. Res. Oceans 2014, 119, 8315–8335. [Google Scholar] [CrossRef] [Green Version]
- Diankha, O.; Thiaw, M.; Sow, B.A.; Brochier, T.; GAyE, A.T.; Brehmer, P. Round Sardinella (Sardinella aurita) and Anchovy (Engraulis encrasicolus) Abundance as Related to Temperature in the Senegalese Waters. Thalassas 2015, 31, 9–17. [Google Scholar]
- Faye, S.; Lazar, A.; Sow, B.A.; Gaye, A.T. A Model Study of the Seasonality of Sea Surface Temperature and Circulation in the Atlantic North-Eastern Tropical Upwelling System. Front. Phys. 2015, 3, 76. [Google Scholar] [CrossRef] [Green Version]
- Capet, X.; Estrade, P.; Machu, É.; Ndoye, S.; Grelet, J.; Lazar, A.; Marié, L.; Dausse, D.; Brehmer, P. On the Dynamics of the Southern Senegal Upwelling Center: Observed Variability from Synoptic to Superinertial Scales. J. Phys. Oceanogr. 2017, 47, 155–180. [Google Scholar] [CrossRef]
- Hamerlynck, O.; Duvail, S. The Rehabilitation of the Delta of the Senegal River in Mauritania: Fielding the Ecosystem Approach; Starr Pirot; International Union for Conservation of Nature: Gland, Switzerland, 2003; ISBN 2-8317-0751-X. [Google Scholar]
- Hamerlynck, O.; Duvail, S. Crues Artificielles et Gestion Intégrée Des Basses Vallées Des Fleuves Africains Les Exemples Du Fleuve Sénégal (Afrique de l’Ouest) et Du Fleuve Rufiji (Afrique de l’Est). In Pêche et Aquaculture: Pour une Exploitation Durable des Ressources Vivantes de la Mer et du Littoral; Espace et Territoires; Presses Universitaires de Rennes: Rennes, France, 2006; pp. 471–485. ISBN 2-7535-0222-6. [Google Scholar]
- Thiaw, M.; Auger, P.-A.; Sow, F.N.; Brochier, T.; FAYE, S.; Diankha, O.; Brehmer, P. Effect of Environmental Conditions on the Seasonal and Inter-Annual Variability of Small Pelagic Fish Abundance off North-West Africa: The Case of Both Senegalese Sardinella. Fish. Oceanogr. 2017, 26, 583–601. [Google Scholar] [CrossRef]
- Charouki, N.; Sarré, A.; Serghini, M.; Ebaye, O.S.; Krakstad, J.O. Contribution to Acoustic Targets Identification in Northwest Africa by Statistical Schools Properties. In Science and Management of Small Pelagics. Symposium on Science and the Challenge of Managing Small Pelagic Fisheries on Shared Stocks in Northwest Africa; FAO: Rome, Italy, 2011; Volume 18, pp. 285–294. [Google Scholar]
- Wetherall, J.A. A New Method for Estimating Growth and Mortality Parameters from Length Frequency Data. Fishbyte 1986, 4, 12–14. [Google Scholar]
- Wetherall, J.A.; Polovina, J.J.; Ralston, S. Estimating Growth and Mortality in Steady-State Fish Stocks from Length-Frequency Data. In Proceedings of the ICLARM Conference Proceeding; ICLARM: Manila, Philippines, 1987; Volume 13, pp. 53–74. [Google Scholar]
- Sparre, P.; Venema, S.C. Introduction to Tropical Fish Stock Assessment. Food and Agriculture Organization of the United Nations. Part 1; Manual Fisheries Technical Paper; FAO: Rome, Italy, 1996; Volume 306. [Google Scholar]
- Schwamborn, R. How Reliable Are the Powell–Wetherall Plot Method and the Maximum-Length Approach? Implications for Length-Based Studies of Growth and Mortality. Rev. Fish Biol. Fish. 2018, 28, 587–605. [Google Scholar] [CrossRef] [Green Version]
- von Bertalanffy, L. A Quantitative Theory of Organic Growth (Inquiries on Growth Laws. II). Hum. Biol. 1938, 10, 181–213. [Google Scholar]
- Munro, J.L.; Pauly, D. A Simple Method for Comparing the Growth of Fishes and Invertebrates. Fishbyte 1983, 1, 5–6. [Google Scholar]
- Pauly, D. Growth Performance in Fishes: Rigorous Description of Patterns as a Basis for Understanding Causal Mechanisms. ICLARM Aquabyte 1991, 4, 3–6. [Google Scholar]
- Pauly, D. A Preliminary Compilation of Fish Length Growth Parameters; Ber. Inst. Meereskd; Christian-Albrechts-Univ: Kiel, Germany, 1978; p. 200. [Google Scholar]
- Tserpes, G. Evaluation of Growth Rate Differences in Populations of Sardina pilchardus (Walbaum, 1792) from the Aegean and Ionian Seas. Cybium 1991, 15, 15–22. [Google Scholar]
- Antonakakis, K.; Giannoulaki, M.; Machias, A.; Somarakis, S.; Sanchez, S.; Ibaibarriaga, L.; Uriarte, A. Assessment of the Sardine (Sardina pilchardus Walbaum, 1792) Fishery in the Eastern Mediterranean Basin (North Aegean Sea). Mediterr. Mar. Sci. 2011, 12, 333–357. [Google Scholar] [CrossRef] [Green Version]
- Stergiou, K.I. Biology, Ecology and Dynamics of Cepola macrophthalma (L., 1758)(Pisces: Cepolidae) in the Euboikos and Pagassitikos Gulfs. Ph.D. Thesis, Aristotle University of Thessaloniki, Thessaloniki, Greece, 1991. [Google Scholar]
- Erzini, K. A Compilation of Data on Variability in Length-Age in Marine Fishes; Collaborative Research Support Program; University of Rhode Island: Kingston, RI, USA, 1991; p. 36. [Google Scholar]
- Silva, A.V.; Meneses, I.; Silva, A. Predicting the Age of Sardine Juveniles (Sardina pilchardus) from Otolith and Fish Morphometric Characteristics. Sci. Mar. 2015, 79, 35–42. [Google Scholar] [CrossRef] [Green Version]
- Silva, A.; Carrera, P.; Massé, J.; Uriarte, A.; Santos, M.B.; Oliveira, P.B.; Soares, E.; Porteiro, C.; Stratoudakis, Y. Geographic Variability of Sardine Growth across the Northeastern Atlantic and the Mediterranean Sea. Fish. Res. 2008, 90, 56–69. [Google Scholar] [CrossRef] [Green Version]
- Pertierra, J.P.; Morales-Nin, B. Sardine Growth in the Catalan Sea (NW Mediterranean) Determined by Means of Otolith Interpretation and Length Frequency Data. Sci. Mar. 1989, 53, 821–826. [Google Scholar]
- Froese, R. Estimating Somatic Growth of Fishes from Maximum Age or Maturity. Acta Ichthyol. Piscat. 2022, 52, 125–133. [Google Scholar] [CrossRef]
- Alemany, F.; Alvarez, F. Growth Differences among Sardine (Sardina pilchardus Walb.) Populations in Western Mediterranean. Sci. Mar. 1993, 57, 229–234. [Google Scholar]
- Belveze, H.; Erzini, K. The Influence of Hydroclimatic Factors on the Availability of the Sardine (Sardina pilchardus Walbaum) in the Moroccan Atlantic Fishery. In Proceedings of the Expert Consultation to Examine Changes in Abundance and Species Composition of Neritic Fish Resources; Fisheries Report; FAO: Rome, Italy, 1983; Volume 2, pp. 285–327. ISBN 92-5-001447-3. [Google Scholar]
- Bouchereau, J.L.; Djabali, F.; Do Chi, T.; Mouhoub, R.; Pastor, X.; Tomasini, J.A. Essais d’evaluation de l’etat d’exploitation Des Stocks de Sardines Dans Les Divisions Statistiques Baléares et Golfe Du Lion, Par Quelques Méthodes Analytiques Simples. FAO Fish. Rep. 1985, 347, 163–185. [Google Scholar]
- McDonald, J.H. Handbook of Biological Statistics; Sparky House Publishing: Baltimore, MD, USA, 2009; Volume 2. [Google Scholar]
- Harrell, F.E., Jr. With Contributions from Charles Dupont and Many Others: Hmisc: Harrell Miscellaneous; R Package Version 3.17-2; 2017. [Google Scholar]
- Bakun, A. Patterns in the Ocean; California Sea Grant, in cooperation with Centro de Investigaciones Biologicas del Noroeste: La Paz, Mexico; San Diego, CA, USA, 1996; ISBN 1-888691-01-8. [Google Scholar]
- Auger, P.-A.; Gorgues, T.; Machu, E.; Aumont, O.; Brehmer, P. What Drives the Spatial Variability of Primary Productivity and Matter Fluxes in the North-West African Upwelling System? A Modelling Approach and Box Analysis. Biogeosciences 2016, 13, 6419–6440. [Google Scholar] [CrossRef] [Green Version]
- Silva, A. Morphometric Variation among Sardine (Sardina pilchardus) Populations from the Northeastern Atlantic and the Western Mediterranean. ICES J. Mar. Sci. 2003, 60, 1352–1360. [Google Scholar] [CrossRef]
- Atarhouch, T.; Rüber, L.; Gonzalez, E.G.; Albert, E.M.; Rami, M.; Dakkak, A.; Zardoya, R. Signature of an Early Genetic Bottleneck in a Population of Moroccan Sardines (Sardina pilchardus). Mol. Phylogenet. Evolut. 2006, 39, 373–383. [Google Scholar] [CrossRef] [Green Version]
- Morales-Nin, B. Growth Determination of Tropical Marine Fishes by Means of Otolith Interpretation and Length Frequency Analysis. Aquat. Living Resour. 1989, 2, 241–253. [Google Scholar] [CrossRef]
- Francis, M.P.; Francis, R. Growth Rate Estimates for New Zealand Rig (Mustelus Lenticulatus). Mar. Freshw. Res. 1992, 43, 1157–1176. [Google Scholar] [CrossRef]
- Campana, S.E. Accuracy, Precision and Quality Control in Age Determination, Including a Review of the Use and Abuse of Age Validation Methods. J. Fish Biol. 2001, 59, 197–242. [Google Scholar] [CrossRef]
- Lux, F.E. Age Determination of Fishes; National Marine Fisheries Service; Fishery Leaflet: Seattle, WA, USA, 1971. [Google Scholar]
- Hammers, B.E.; Miranda, L.E. Comparison of Methods for Estimating Age, Growth, and Related Population Characteristics of White Crappies. N. Am. J. Fish. Manag. 1991, 11, 492–498. [Google Scholar] [CrossRef]
- Basilone, G.; Guisande, C.; Patti, B.; Mazzola, S.; Cuttitta, A.; Bonanno, A.; Kallianiotis, A. Linking Habitat Conditions and Growth in the European Anchovy (Engraulis encrasicolus). Fish. Res. 2004, 68, 9–19. [Google Scholar] [CrossRef]
- Brosset, P.; Fromentin, J.-M.; Van Beveren, E.; Lloret, J.; Marques, V.; Basilone, G.; Bonanno, A.; Carpi, P.; Donato, F.; Keč, V.Č. Spatio-Temporal Patterns and Environmental Controls of Small Pelagic Fish Body Condition from Contrasted Mediterranean Areas. Prog. Oceanogr. 2017, 151, 149–162. [Google Scholar] [CrossRef] [Green Version]
- Bonanno, A.; Barra, M.; Basilone, G.; Genovese, S.; Rumolo, P.; Goncharov, S.; Popov, S.; Buongiorno Nardelli, B.; Iudicone, D.; Procaccini, G. Environmental Processes Driving Anchovy and Sardine Distribution in a Highly Variable Environment: The Role of the Coastal Structure and Riverine Input. Fish. Oceanogr. 2016, 25, 471–490. [Google Scholar] [CrossRef]
- Hattab, T.; Gucu, A.; Ventero, A.; de Felice, A.; Machias, A.; Saraux, C.; Gašparević, D.; Basilone, G.; Costantini, I.; Leonori, I. Temperature Strongly Correlates with Regional Patterns of Body Size Variation in Mediterranean Small Pelagic Fish Species. Mediterr. Mar. Sci. 2021, 22, 800. [Google Scholar] [CrossRef]
- Basilone, G.; Ferreri, R.; Mangano, S.; Pulizzi, M.; Gargano, A.; Barra, M.; Mazzola, S.; Fontana, I.; Giacalone, G.; Genovese, S. Effects of Habitat Conditions at Hatching Time on Growth History of Offspring European Anchovy, Engraulis encrasicolus, in the Central Mediterranean Sea. Hydrobiologia 2018, 821, 99–111. [Google Scholar] [CrossRef]
- Basilone, G.; Ferreri, R.; Barra, M.; Bonanno, A.; Pulizzi, M.; Gargano, A.; Fontana, I.; Giacalone, G.; Rumolo, P.; Mazzola, S. Spawning Ecology of the European Anchovy (Engraulis encrasicolus) in the Strait of Sicily: Linking Variations of Zooplankton Prey, Fish Density, Growth, and Reproduction in an Upwelling System. Prog. Oceanogr. 2020, 184, 102330. [Google Scholar] [CrossRef]
- Baibai, T.; Oukhattar, L.; Quinteiro, J.V.; Mesfioui, A.; Rey-Mendez, M. First Global Approach: Morphological and Biological Variability in a Genetically Homogeneous Population of the European Pilchard, Sardina pilchardus (Walbaum, 1792) in the North Atlantic Coast. Rev. Fish Biol. Fish. 2012, 22, 63–80. [Google Scholar] [CrossRef]
- Diogoul, N.; Brehmer, P.; Demarcq, H.; El Ayoubi, S.; Thiam, A.; Sarre, A.; Mouget, A.; Perrot, Y. On the Robustness of an Eastern Boundary Upwelling Ecosystem Exposed to Multiple Stressors. Sci. Rep. 2021, 11, 1908. [Google Scholar] [CrossRef]
- Sarré, A.; Krakstad, J.-O.; Brehmer, P.; Mbye, E.M. Spatial Distribution of Main Clupeid Species in Relation to Acoustic Assessment Surveys in the Continental Shelves of Senegal and The Gambia. Aquat. Living Res. 2018, 31, 9. [Google Scholar] [CrossRef]
- Sedykh, K.A. Etude de l’upwelling Pres de La Cote de l’Afrique Du Nord-Ouest Part l’Institut Atlantique de Recherches Scientifiques de La Pêche et de l’Oceanographie (Atlan. NIRO). Rapp. Groupe Trav. Poisson. Pelagiques Cotiers Ouest Afr. Maurit. Liberia (26 N-5 N) COPACE/PACE/Series 1979, 78, 93–99. [Google Scholar]
- Baldé, B.S.; Brehmer, P.; Sow, F.N.; Ekau, W.; Kantoussan, J.; Fall, M.; Diouf, M. Population Dynamics and Stock Assessment of Ethmalosa fimbriata in Senegal Call for Fishing Regulation Measures. Reg. Stud. Mar. Sci. 2018, 24, 165–173. [Google Scholar] [CrossRef]
- Hiyama, Y.; Nishida, H.; Goto, T. Interannual Fluctuations in Recruitment and Growth of the Sardine, Sardinops melanostictus, in the Sea of Japan and Adjacent Waters. Res. Popul. Ecol. 1995, 37, 177–183. [Google Scholar] [CrossRef]
Publisher’s Note: MDPI stays neutral with regard to jurisdictional claims in published maps and institutional affiliations. |
© 2022 by the authors. Licensee MDPI, Basel, Switzerland. This article is an open access article distributed under the terms and conditions of the Creative Commons Attribution (CC BY) license (https://creativecommons.org/licenses/by/4.0/).