Article

Molecular Cloning and Characterization of tlr1, tlr5s, tlr5m, and tlr14 Genes in the Swamp Eel, Monopterus albus

1
School of Animal Science, Yangtze University, Jingzhou 434020, China
2
Hubei Key Laboratory of Waterlogging Disaster and Agricultural Use of Wetland, Yangtze University, Jingzhou 434020, China
3
Engineering Research Center of Ecology and Agricultural Use of Wetland, Ministry of Education, Jingzhou 434020, China
*
Author to whom correspondence should be addressed.
Fishes 2022, 7(4), 177; https://doi.org/10.3390/fishes7040177
Submission received: 16 June 2022 / Revised: 17 July 2022 / Accepted: 19 July 2022 / Published: 20 July 2022

Abstract

:
Toll-like receptors (TLRs) are a critical family of pattern recognition receptors (PRRs) that are tightly regulated by complex mechanisms involving many molecules to ensure a good response to foreign invaders. In this study, we identified and analyzed the sequence characteristics and homology of four TLR genes (tlr1, tlr5s, tlr5m, and tlr14) from the swamp eel. Sequence similarity analysis, functional domain prediction, and phylogenetic analysis supported their annotation and orthologies. Their relative expression levels in different tissues were assessed. The four TLRs were expressed in all tested tissues. tlr5m was highly expressed in the spleen, whereas tlr5s was highly expressed in the kidney and spleen. High expression levels of tlr1 and tlr14 were detected in the spleen and muscle. These results indicated that the TLRs are related to host immunity. Moreover, the differential expression of TLRs was examined after Aeromonas veronii infection, which showed that all the TLR genes were induced with diverse patterns. tlr1 was significantly downregulated in the spleen after A. veronii challenge. In the kidneys and intestines, tlr1 expression decreased initially and then increased, with its lowest level at 4 h. tlr5s expression was upregulated significantly in three tissues at 1, 4, and 12 h, with the maximum expression at 1 h, indicating that tlr5s actively responded to bacterial invasion in the early stage of the challenge. tlr5m showed tissue specific expression: it was slightly upregulated in the intestines and spleen and downregulated in the kidneys. The expression pattern of tlr14 was similar to that of tlr5s, and both reached maximum expression at 1 h after infection. Collectively, our results indicated that TLRs might play important roles in the innate immune response against Gram negative bacteria in the swamp eel.

1. Introduction

The innate immune system is the first line of defense against pathogen invasion, and also considered to be the main defense mechanism in lower vertebrates [1]. The innate immune response is initiated by danger signals mediated by pattern recognition receptors (PRRs) [2]. There are three main families of PRRs, including Toll-like receptors (TLRs), retinoic acid inducible gene I (RIG-I)-like receptors (RLRs), and Nod-like receptors (NLRs) [3]. Among these proteins, TLRs are the most important and the most well studied family. TLRs are type I transmembrane proteins with extracellular leucine-rich repeat (LRR) domains, a transmembrane domain, and an intracellular Toll/interleukin-1 receptor (TIR) domain [4]. The LRR domain and TIR domain are involved in pathogen recognition and the stimulation of downstream signal transduction, respectively [5]. TLRs can recognize a variety of pathogen-associated molecular patterns (PAMPs), such as lipopolysaccharide (LPS), flagellin, bacterial DNA, and single-stranded or double-stranded viral RNA [6,7,8]. After recognizing PAMPs, TLRs transmit downstream signals to the cytoplasm and activate two important adaptor proteins, Toll-like receptor adaptor molecule 1 (TICAM1, also known as TRIF) and the myeloid differentiation primary response gene (88) (MyD88), which can induce various cytokines, such as interleukin (IL)-12, IL-8, tumor necrosis factor alpha (TNF-α), and interferon (IFN) [9,10]. Different TLRs exhibit different ligand specificities and affect different signaling pathways.
To date, 13 types of TLRs (tlr1–13) have been isolated and identified in mammals, with 10 types in humans (tlr1–10) and 12 types in mice (tlr1–9, tlr11–13). At least 20 TLRs have been found in bony fishes. According to their recognizable sequence and natural ligand type, they are divided into six TLR families tlr1 (tlr1, tlr2, tlr14, tlr18, tlr25, tlr26, tlr27, tlr28), tlr3, tlr4, tlr5, tlr7 (tlr7, tlr8, tlr9) and tlr11 (tlr11, tlr12, tlr13, tlr19, tlr20, tlr21, tlr22, tlr23) [11]. Among them, tlr5s, tlr18–20, tlr22, tlr23, and tlr25-28 are considered to be unique to fish [12,13]. Recently, a gene with sequence structure and function highly similar to mammalian tlr10 was discovered in black rockfish (Sebastes schlegelii), which is considered to be tlr10 in fish [14]. Bony fish TLRs are structurally highly similar to mammalian TLRs; however, they exhibit distinct features and large diversity, which might correlate with their aquatic habitat and diverse evolutionary history [15].
The swamp eel is an important freshwater economic fish in China, with an annual output value of over CNY 10 billion. In recent years, large-scale greenhouse aquaculture and cage aquaculture have become a developing trend. High-density aquaculture has also created problems, such as an increase in the types of bacterial diseases and an increase in the incidence of disease, which has caused serious economic losses. A. veronii is a predominant pathogen that was isolated from the diseased swamp eels by our team. This bacterium is ubiquitous in the aquatic environment and is a common pathogen for many aquatic organisms [12]. The special biological characteristics of the swamp eel meant that previous research on this species focused mainly on its sexual reversal and reproductive biology. There has been little research on swamp eel disease and immunity. The present study aimed to further identify and characterize TLRs from the swamp eel. Four TLR genes were identified in the swamp eel genome and transcriptome database, and their expression patterns in the normal tissues and tissues after infection by A. veronii were determined. Our findings provide basic information to support the determination of the molecular mechanism of swamp eel-related disease resistance and provide guidance for the prevention and control of swamp eel disease.

2. Materials and Methods

2.1. Animals

The swamp eels (60 ± 20 g) in this experiment were provided by the swamp eel breeding base of Yangtze University. All fish were reared in a plastic bucket (60 L) at 26 ± 1 °C for one week, and the ammonia nitrogen concentration and nitrite concentration of water were lower than 0.02 mg/L and 0.10 mg/L, respectively. Moreover, the dissolved oxygen of the water was higher than 4 mg/L and the pH of the water was kept at 6.5–7.4. No clinical symptoms of disease were observed during this period. During this period (1 week), the fish were fed at 6:00 p.m. every day, and the feeding amount accounted for 2–5% of the fish weight. The one third of the water was replaced every morning. The experimental procedures were conducted in accordance with the guidelines for the ethical examination of animal experiments of Yangtze University, China.

2.2. Acquisition of cDNA Sequences

The gene sequences of swamp eel TLRs was obtained from the NCBI swamp eel genome (https://www.ncbi.nlm.nih.gov/genome/?term=swamp%20eel, accessed on 15 July 2021) and from the swamp eel transcriptome constructed in our laboratory.

2.3. Sequence Analysis

The network tool ORF-Finder was used to predict the amino acid sequences of the TLRs (https://www.ncbi.nlm.nih.gov/orffinder/, accessed on 15 July 2021). The signal peptide was predicted using the SignalP 5.0 server (http://www.cbs.dtu.dk/services/SignalP/index.php, accessed on 15 July 2021). A simple modular architecture study (SMART) (http://smart.embl-heidelberg.de/smart/set_mode.cgi?NORMAL=1, accessed on 15 July 2021) was used to predict TLR protein domains, including transmembrane regions, LRR, and TIR motifs. The ProParam software in the ExPasy server (https://web.expasy.org/protparam/, accessed on 15 July 2021) was used to predict the physical and chemical properties of the protein, including molecular weight, theoretical isoelectric point, instability index, fat index, and total average hydrophilicity. MatGAT 2.02 software (2.02, Montclair State University, Department of Biology and Molecular Biology, Montclair, NJ, USA) was used to calculate the amino acid sequence similarity [16]. The PHYRE2 server (http://www.sbg.bio.ic.ac.uk/phyre2/html/page.cgi?id=index, accessed on 18 July 2021) was used to predict and build protein 3D structure models.

2.4. Phylogenetic Analysis

Amino acid sequences are used for phylogenetic analysis, because their protein sequences variations are less than those of cDNA sequences and the similarity between species is higher, thus species with closer relationships can be found. Therefore, the phylogenetic tree was constructed based on the amino acid sequence of the TLRs of the swamp eel and the other bony fishes. The Clustal X software (1.83, Institut de Genetique et de Biologie Moleculaire et Cellulaire, lllkirch Cedex, France) was used to perform multiple sequence alignment [17]. Based on the results of the alignment, a phylogenetic tree was constructed using the MEGA 7.0 neighbor joining model [18]. Bootstrap was set to 1000 to test its effectiveness.

2.5. Syntenic Analysis of TLR Genes in Swamp Eel and Other Teleost Fish

The syntenic analysis of TLRs among swamp eels and other five teleost fishes, including the Amazon molly (Poecilia formosa), Spotted green pufferfish (Tetraodon nigroviridis), Tiger Puffer (Takifugu rubripes), tilapia (Oreochromis niloticus), and Threespined Stickleback (Gasterosteus aculeatus) was performed. The genomic annotations of these species were downloaded from the Genomicus database (https://www.genomicus.bio.ens.psl.eu/genomicus-92.01/cgi-bin/search.pl, accessed on 18 July 2021).

2.6. Tissue Collections, Total RNA Extraction, and Reverse Transcription

To investigate the expression profile of TLRs, five healthy individuals were euthanized and nine tissues (skin, muscle, intestine, liver, spleen, gonads, head kidney, middle kidney, and blood) were collected and stored in RNAlater reagent. Then, all samples were stored at −80 °C for subsequent RNA extraction. The integrity and purity of the RNA were detected using 1.5% agarose gel electrophoresis stained with SYBR Green I (Shanghai, China) and a Protein nucleic acid analyzer, respectively. The cDNA was synthesized using a PrimeScript RT reagent Kit (Takara, Dalian, China) according to manufacturer’s protocol and was kept at −80 °C for subsequent quantitative real-time PCR (qPCR).

2.7. Gene Clone

The gene sequences of swamp eel TLRs were obtained according to the Section 2.2. Specific primers were designed using Primer Premier 5.0 software (Premier Biosoft, Palo Alto, CA, USA; Table 1). PCR amplification was used to clone the ORFs (Open Reading Frames) of tlr1, tlr5s, tlr5m, and tlr14. All PCR products were ligated into pMD18-T vectors (TaKaRa, Shiga, Japan) and sequenced. The sequences were further assembled with SeqMan software (5.01, DNASTAR, INC, Madison, WI, USA) and aligned with tlr1, tlr5s, tlr5m, and tlr14.

2.8. Quantitative PCR (qPCR) and Statistical Analysis

According to the searched cDNA sequence of swamp eel TLRs, specific primers were designed using Primer Premier 5.0 software (Premier Biosoft, Palo Alto, CA, USA; Table 1). The cDNA prepared by RT-PCR was used for the quantitative real-time PCR step of qRT-PCR protocol on step one plus real-time PCR system (ABI, Foster City, CA, USA). Swamp eel EF1A (encoding eukaryotic translation elongation factor 1 alpha 1 (EF-1α)) was used as an internal control. ChamQ Universal SYBR qPCR Master Mix (Vazyme, Nanjing, China) was used following the instructions. Each qPCR reaction was performed in a total volume of 20 µL, including 10 µL of ChamQ Universal SYBR qPCR Master Mix, 4 µL of cDNA, 0.4 µM of each sense and antisense primer, and 5.2 µL of ddH2O. Reactions were performed using a three-step method: 95 °C for 10 min initially, followed by 40 cycles, 95 °C for 10 s, 60 °C for 30 s, and 72 °C for 20 s. Melt curve analysis was carried out over a range from 55 °C to 95 °C at the end of each PCR run.
Statistical analysis was performed using SPSS 23.0 software (IBM Cop., Armonk, NY, USA) and calculated using the hyperbolic curve method. All data were evaluated for normality and homogeneity of variances before statistical analysis, and gene expression data were expressed as geometric mean ± geometric standard deviation. A one-way analysis of variance (ANOVA) was conducted to compare the differences of expression levels among various samples. The least significant difference (LSD) test was used to perform multiple comparisons. The level of statistical significance was set at p < 0.05 for all analyses.

2.9. Bacterial Challenge Experiment

A. veronii was obtained from the microbiology laboratory of Yangtze University. Single colonies were picked out and inoculated into 200 mL Luria-Bertani (LB) liquid culture media, which were cultured in a 28 °C incubator, with shaking at medium speed overnight. Next day, the bacterial concentration was calculated, and the culture was diluted to 1 × 10⁷ colony-forming units (CFU)/mL. A total of 105 healthy swamp eels (60 ± 20 g) without injury and parasites were randomly divided into one control group and six experimental groups. Experimental groups were injected intraperitoneally with 200 μL of A. veronii at a dose of 1 × 10⁷ CFU/mL, and the control group was injected with the same volume of sterile phosphate buffered saline (PBS). Five fish were randomly euthanized from the experimental group at 0, 1, 4, 12, 24, and 72 h post-injection (hpi). Three immune tissues (spleen, kidney, and intestine) were collected and stored in RNAlater, and then all samples were stored at −80 °C for subsequent RNA extraction. The cDNA template preparation and qRT-PCR quantitative methods were the same as in Section 2.6 and Section 2.8.

3. Results

3.1. Identification and Analysis of TLR Genes

The detailed information for each TLR gene in the swamp eel (Monopterus albus) is presented in Table 2. The cDNA lengths of the four TLR genes ranged from 2174 bp (tlr5s) to 3400 bp (tlr5m), with open reading frames (ORFs) ranging from 1962 bp (tlr5s) to 2667 bp (tlr5m) and encoding proteins of 653 aa (tlr5s) to 888 aa (tlr5m) in length. The maximum molecular weight was 127.47 kDa (tlr5m), the minimum molecular weight was 80.87 kDa (tlr5s), and the pI (electronic point) varied from 5.79 (tlr5m) to 8.72 (tlr5s).
Domain analysis showed that the four TLRs all contained extracellular LRR motifs (Figure 1); however, the numbers varied, ranging from six LRR motifs in tlr1 to twelve in tlr5s. The LRR motif is an important part of the TLR receptor ligand binding site, and the number of LRR motifs might be related to the recognition mechanism of foreign pathogens. Except for tlr5s, which lacked a signal peptide, transmembrane region, and TIR domain, the other TLRs have typical TLR functional domains [19]. There are three conserved functional areas, Box 1, Box 2, and Box 3 in the TIR domain. These conserved functional areas play an important role in the activation of downstream signaling pathways through signal protein transduction [20].
The sequence comparison of the TLRs showed that compared with those from mammals, birds, and amphibians, TLRs from swamp eel and fish were more similar. Among fishes, the highest similarity was with TLRs from mandarin fish Aucha Perch (Siniperca chuatsi), for which the similarity rates of trl1, trl5m, trl5s, and trl14 were all above 74%, followed by 72.2% (Scophthalmus maximus) and 68.4% (Epinephelus coioides) (Table 3).

3.2. Phylogeny and Collinearity Analysis

A phylogenetic tree was constructed by the multiple sequence alignment of the full length amino acid sequences of fish TLRs (Figure 2). According to the nomenclature used in teleosts, all seventeen TLR proteins were clustered into six subfamilies, named the trl1 subfamily, trl3 subfamily, trl4 subfamily, trl5 subfamily, trl7 subfamily, and trl11 subfamily. The results showed that swamp eel and other fish TLRs shared common characteristics. trl1, trl14, and trl5s fell into the same clades with their counterparts of turbot, and then clustered with other teleosts. trl1 and trl14 belong to the trl1 subfamily. trl5m clusters with the red-finned puffer and belongs to the same trl5 subfamily group with trl5s. trl1 and trl14 were classified into the trl1 subfamily. trl5m was clustered with the tiger puffer (Takifugu rubripes) and belonged to the same trl5 subfamily group with trl5s.

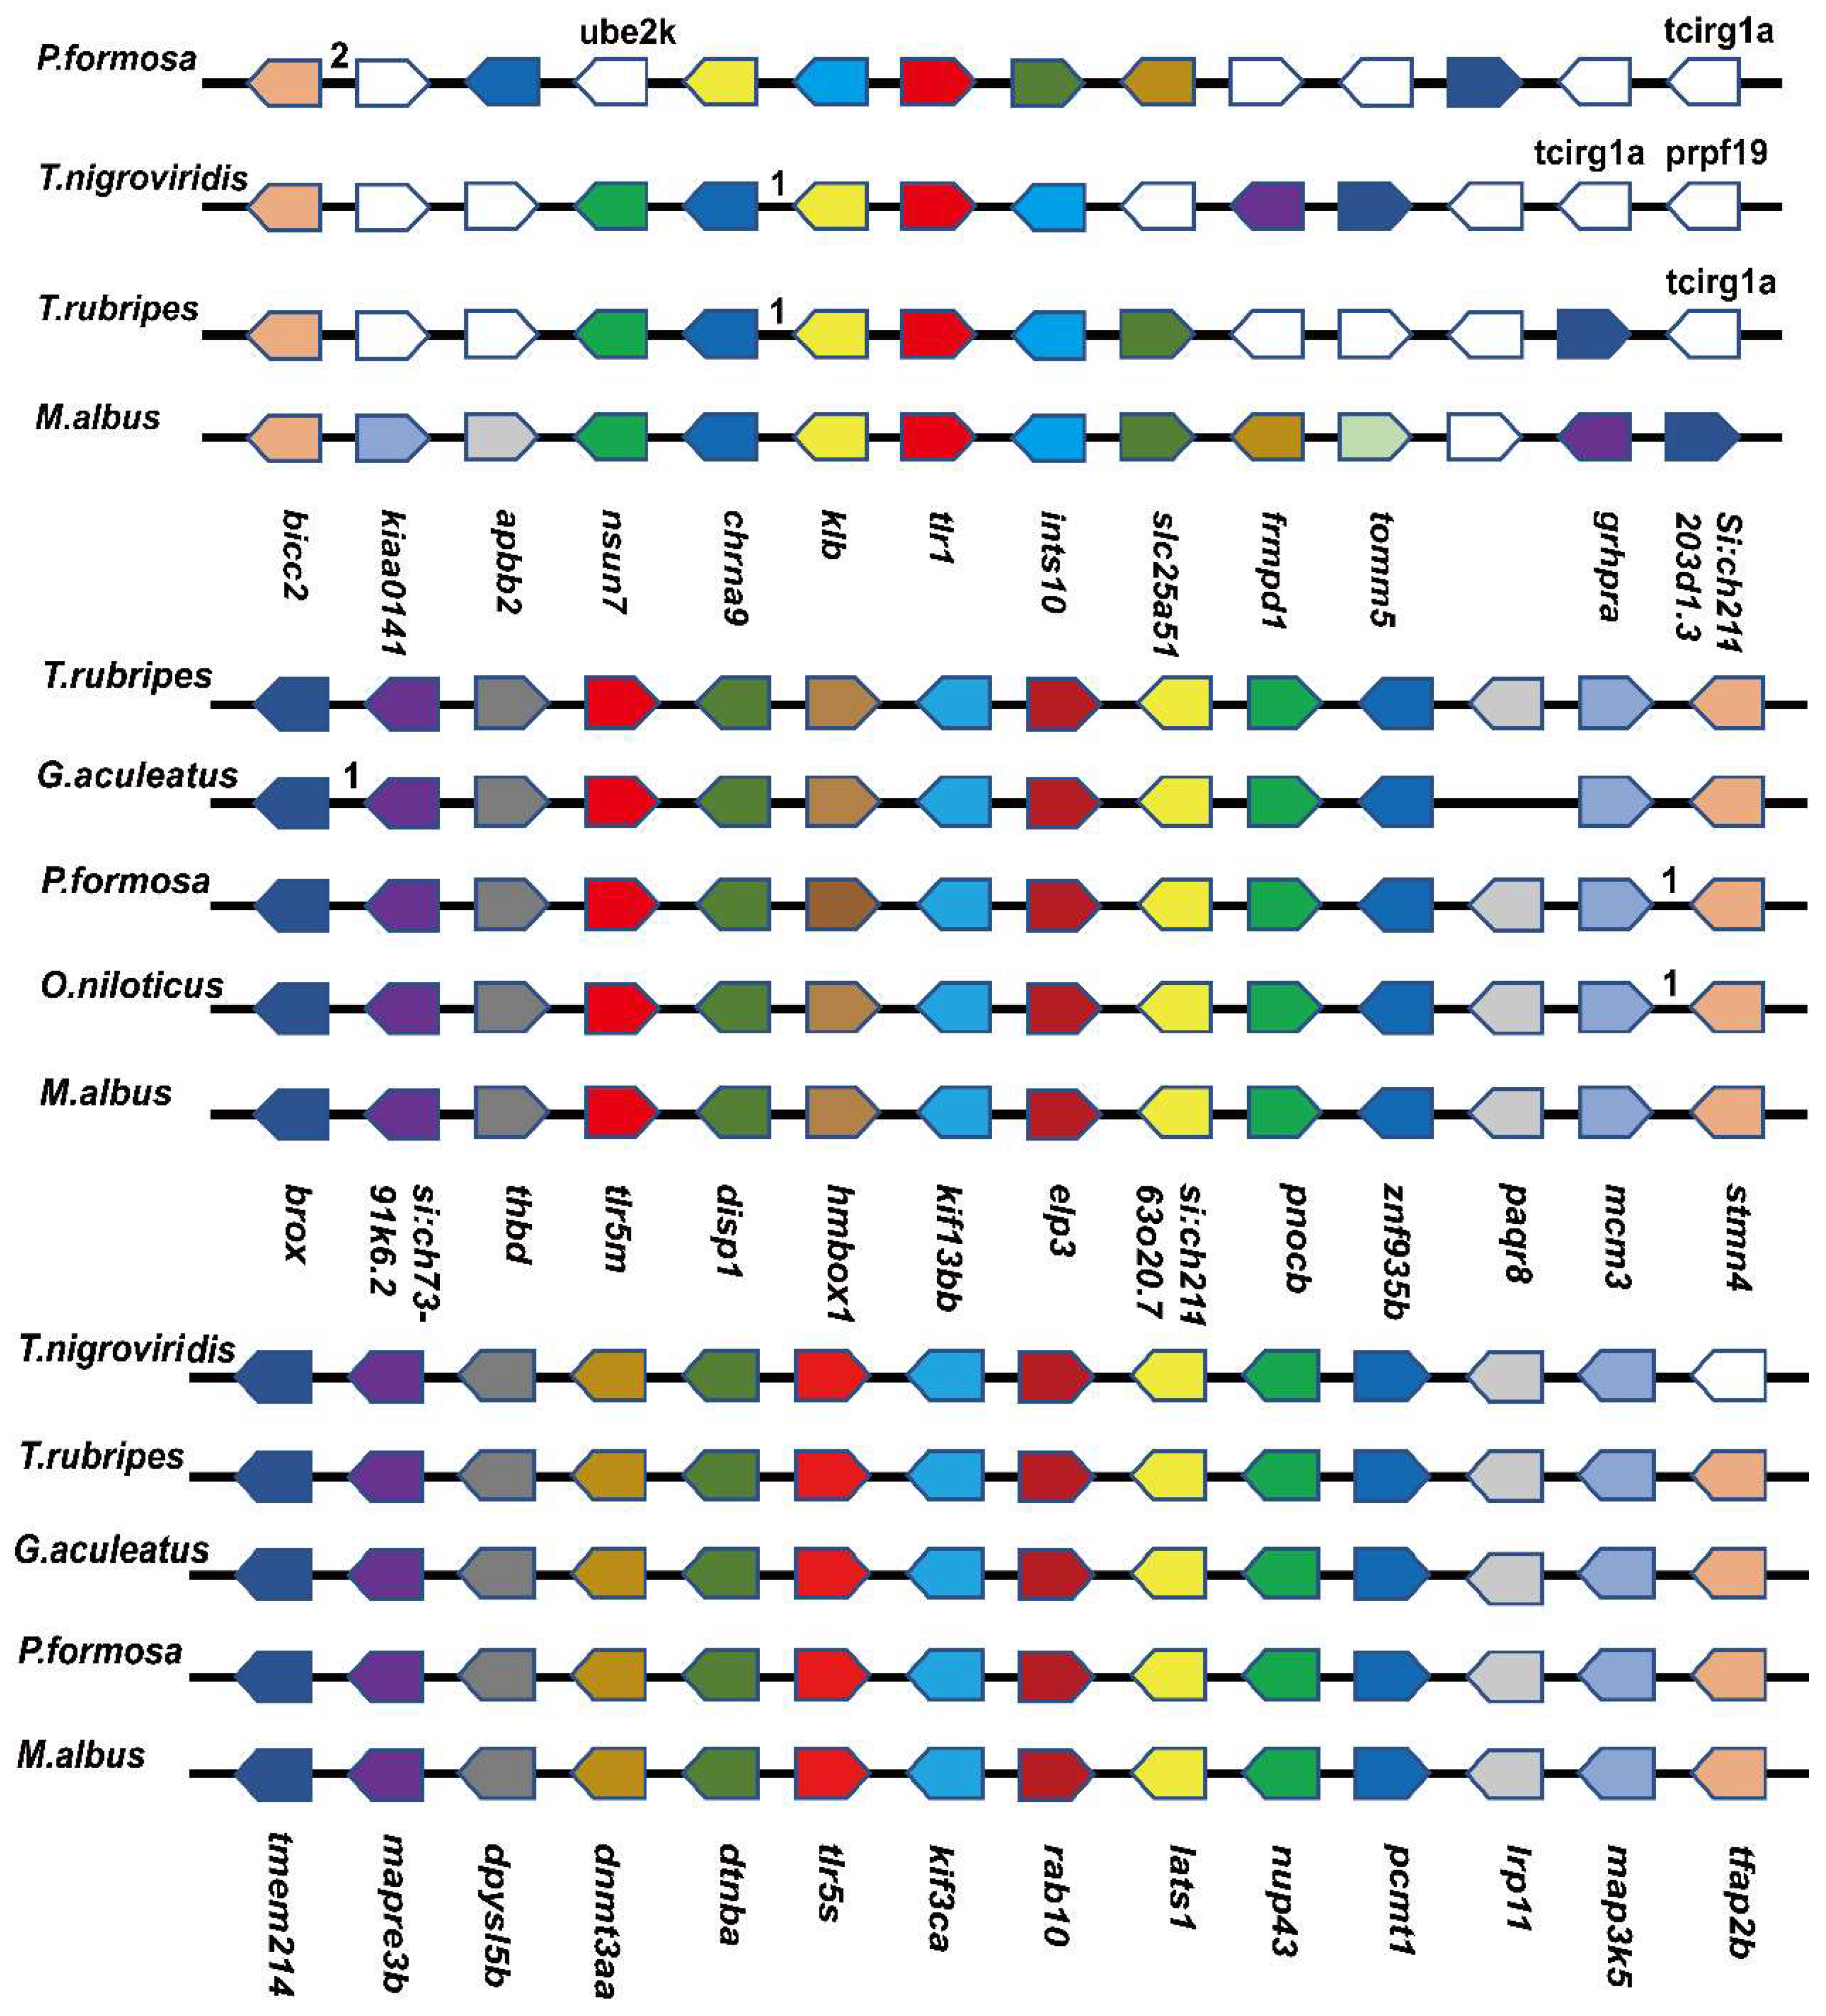
3.3. Collinearity Analysis

Although phylogenetic relationships provided strong support for the identities of the TLRs, the collinearity analysis of the genes provided additional evidence for the annotations and identifications of the TLRs. Except for tlr14, for which we failed to find relevant data, the collinearity analysis of tlr1, tlr5m, and tlr5s is shown in Figure 3. tlr5m and tlr5s were relatively conserved in terms of collinearity, and their adjacent genes were the same. Several conserved genes around the tlr5m of Tiger Puffer (Takifugu rubripes), Three-spined stickleback (Gasterosteus aculeatus), Amazon molly (Poecilia Formosa), and Nile tilapia (Oreochromis niloticus) were thbd, disp1, hmbox1, kif113bb, and elp3, respectively. In tlr5s, similar phenomena were found in Spotted green pufferfish (Tetraodon nigroviridis), Tiger Puffer (Takifugu rubripes), stickleback (Gasterosteus aculeatus), and Amazon molly (Poecilia Formosa), including dnmt3aa, dtnba, kif3ca, rab10, and lats1. Only two adjacent genes of tlr1 were consistent.
In addition, the tertiary structures of the encoded proteins were constructed using the Phyre2 server and colored from N to C terminus. (Figure 4, Figure 5, Figure 6 and Figure 7).

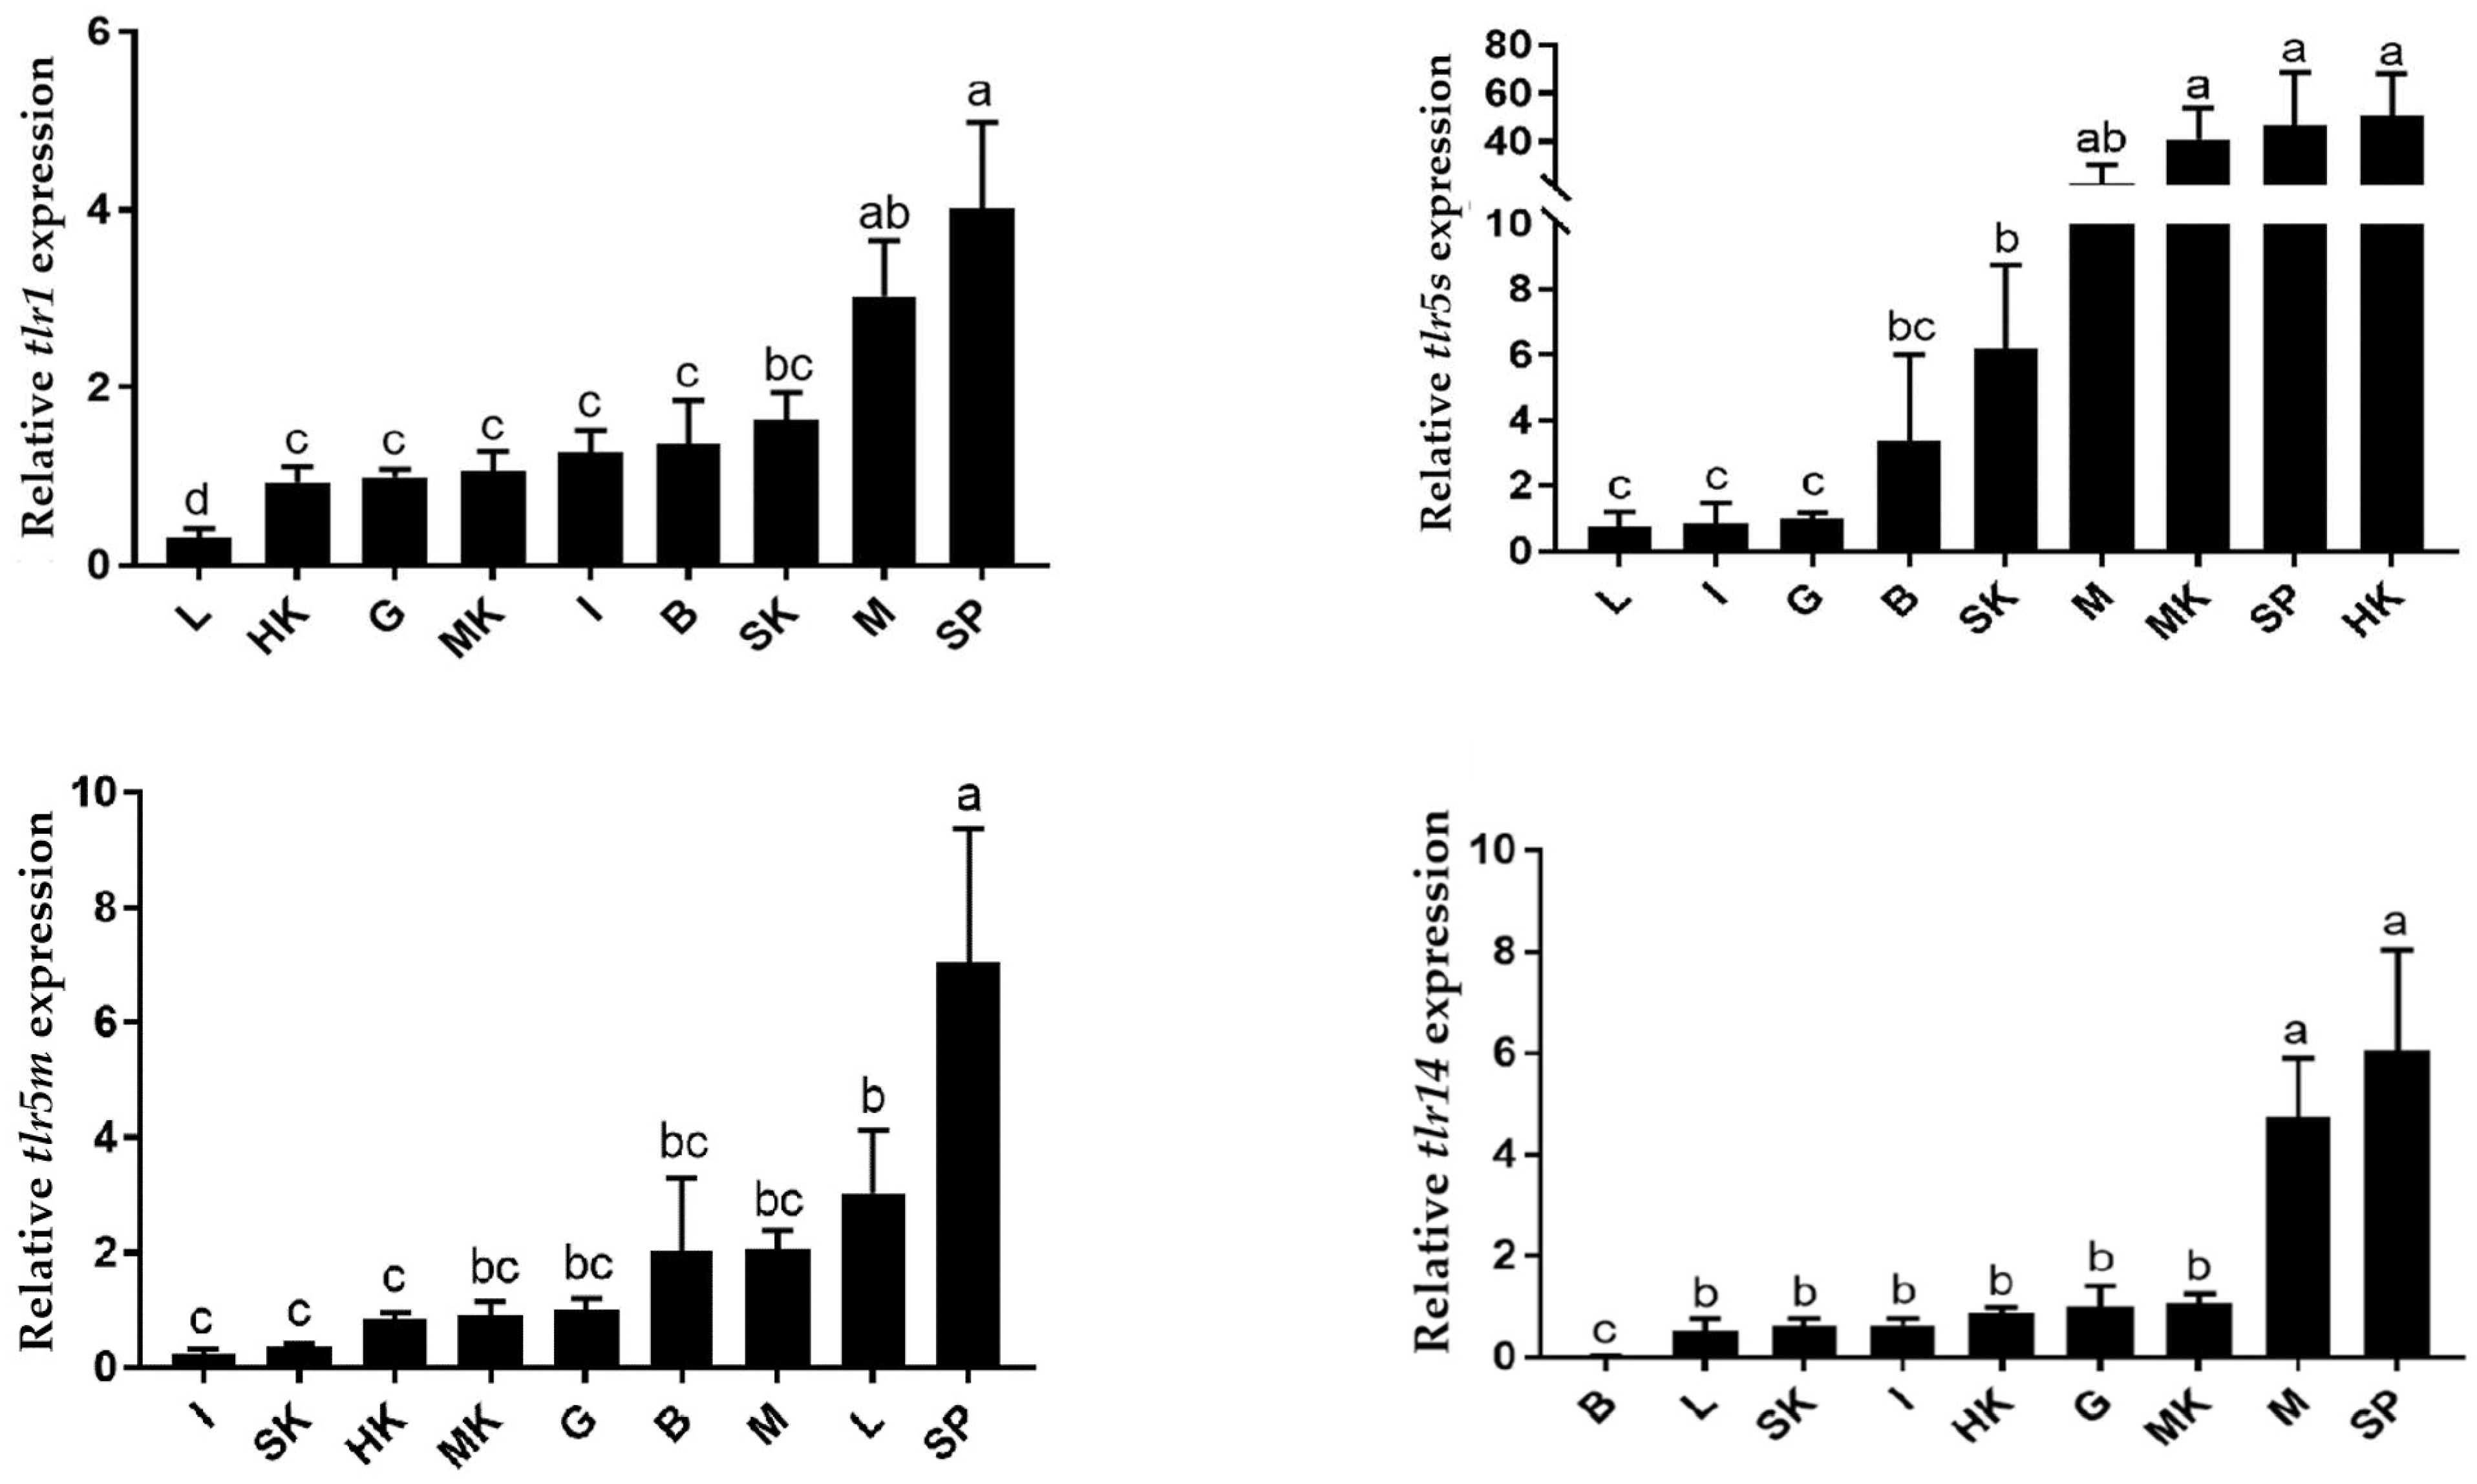
3.4. Expression Patterns of TLR Genes in Different Tissues

qRT-PCR was used to detect the tissue distribution of swamp eel TLR genes, and the results showed that swamp eel TLR genes were expressed in all tested tissues (Figure 8). trl5m was highly expressed in the spleen, whereas trl5s was highly expressed in the kidney and spleen. Interestingly, high expression levels of trl1 and trl14 were detected in the spleen and muscle. These results indicated that the spleen played an important role in the immune response of the swamp eel.

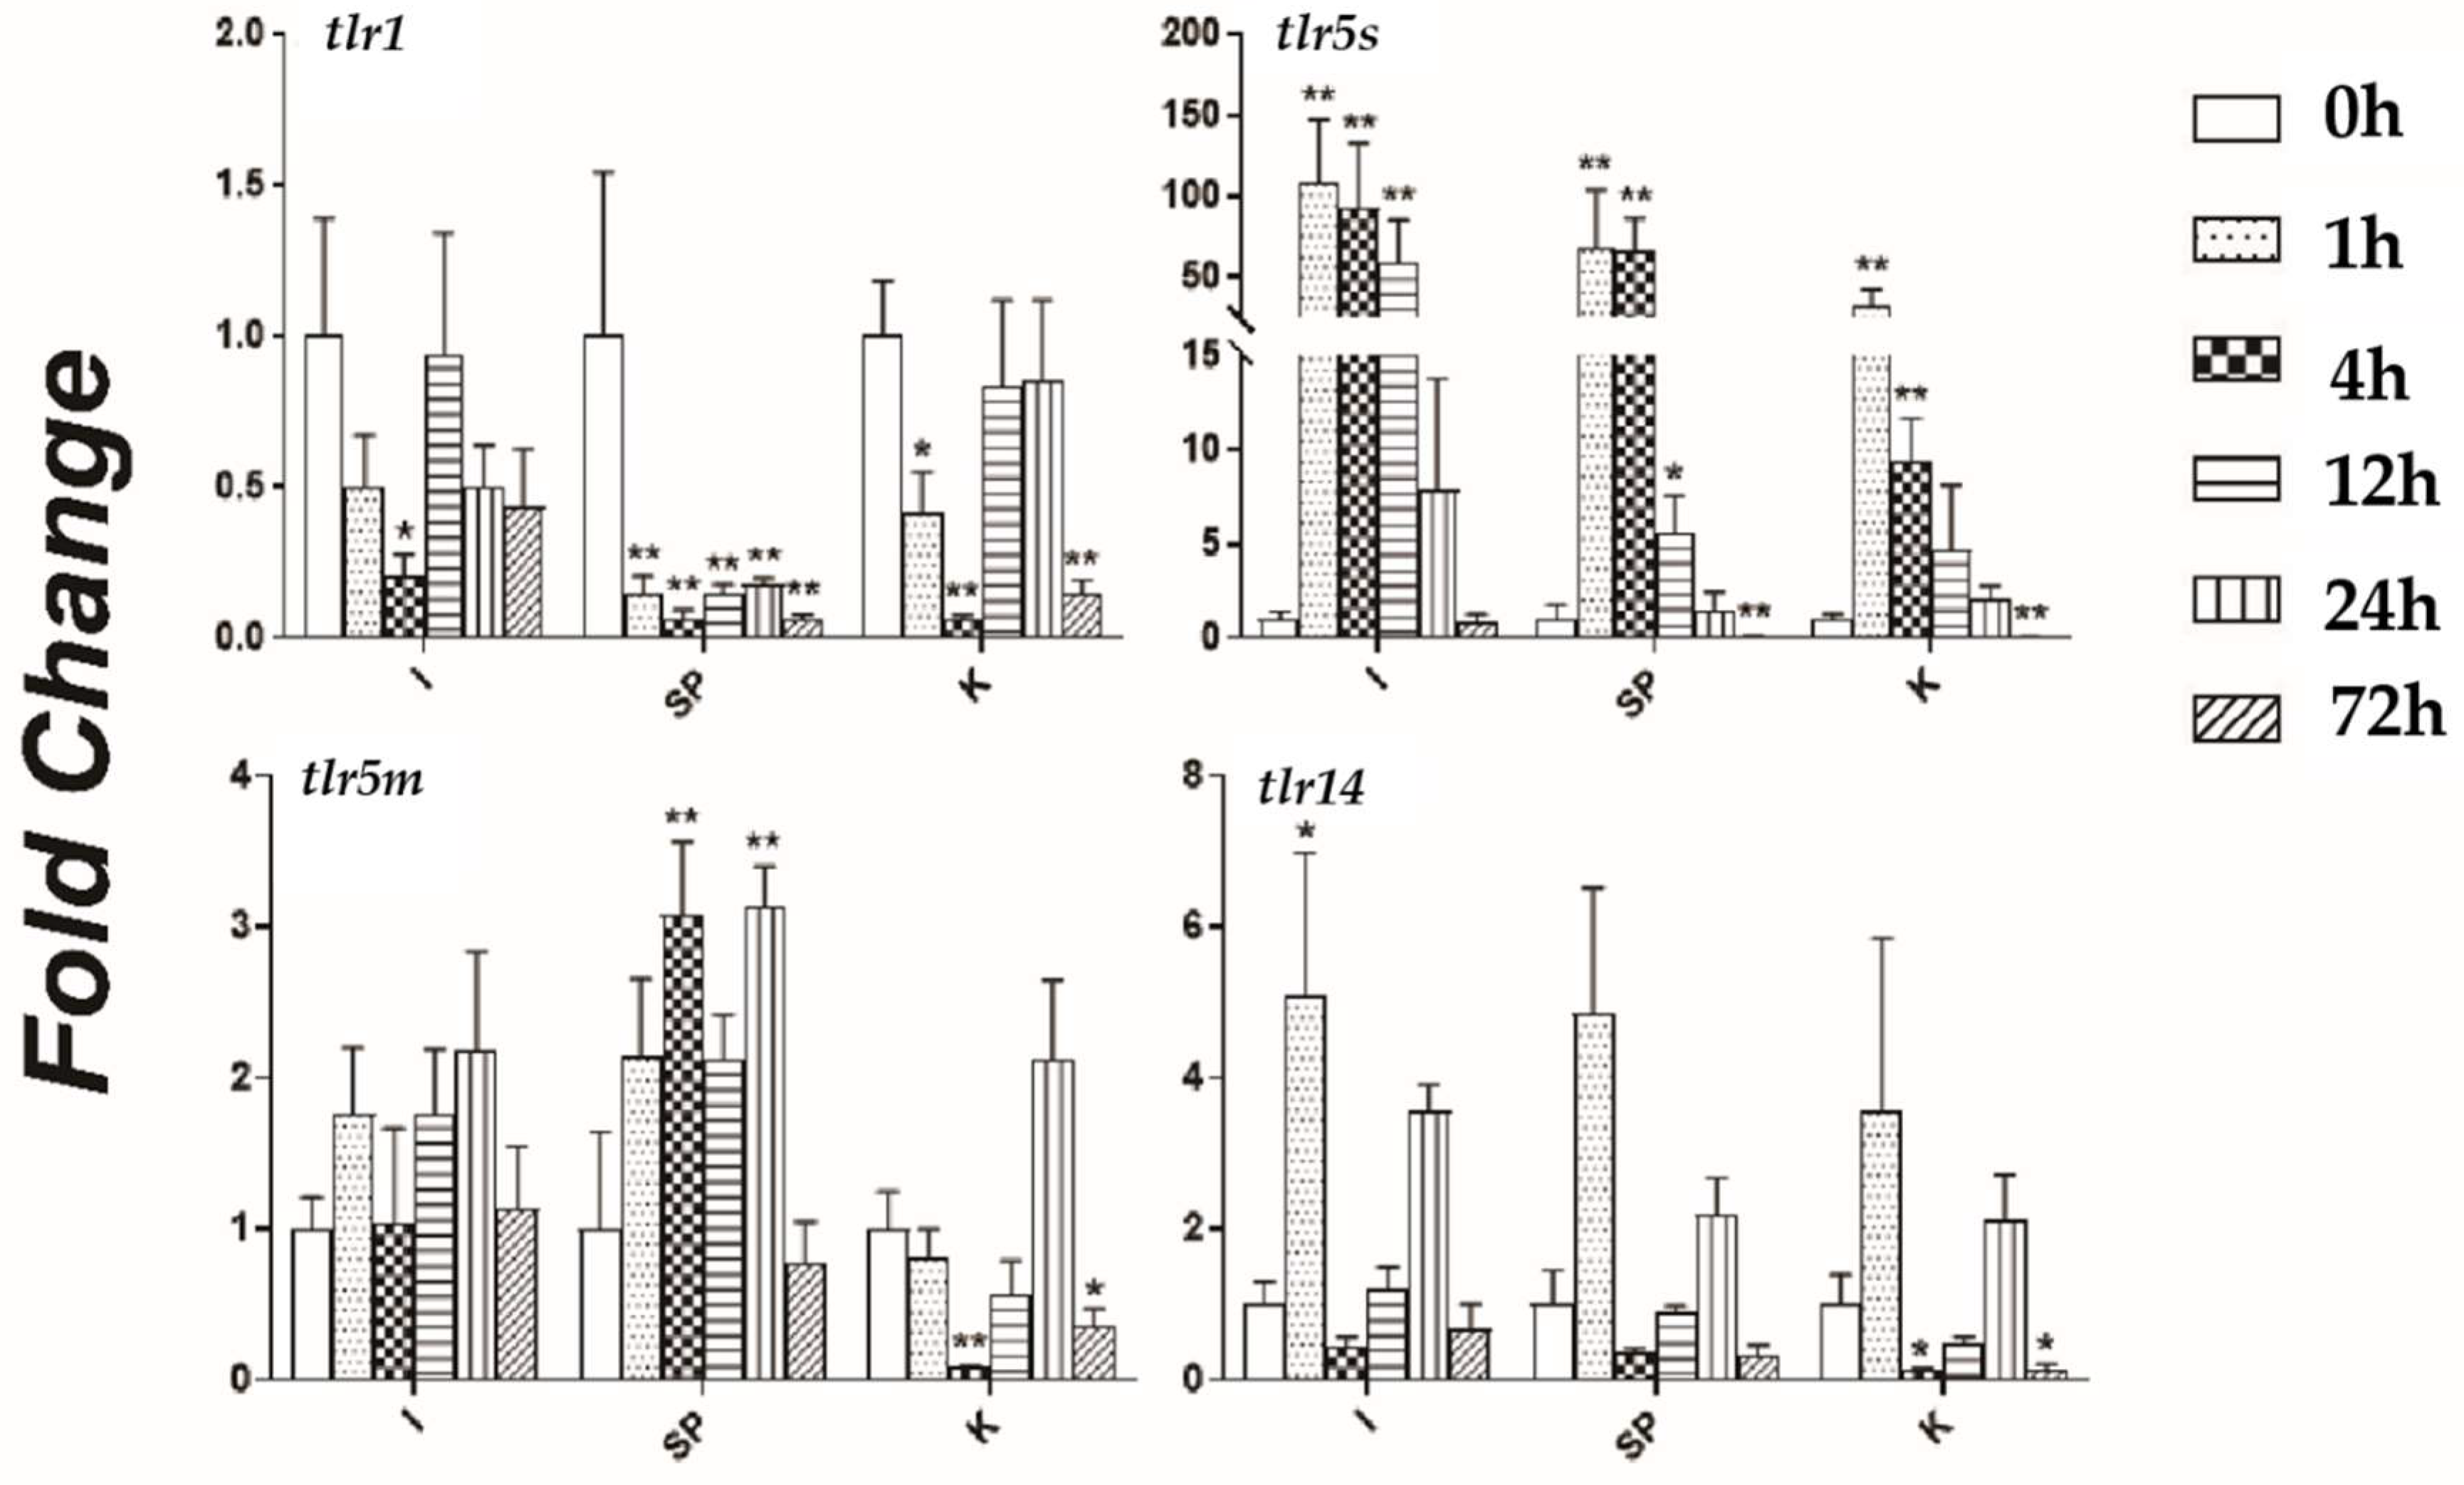
3.5. Responses of TLR Genes to Bacterial Challenge

The TLR genes responded to bacterial challenge; however, their responses were tissue-specific (Figure 9). trl1 was significantly downregulated in the spleen after the A. veronii attack and was inhibited. In the kidneys and intestines, it showed a trend of decreasing initially and then increasing, reaching its lowest level at 4 h. trl5s expression was significantly upregulated in three tissues at 1, 4, and 12 h, the maximum expression at 1 h. Thus, trl5s actively responded to bacterial invasion in the early stage of the challenge. trl5m was expressed differently in different tissues with some tissue specificity. Specifically, it was slightly upregulated in the intestines and spleen and downregulated in the kidneys. The expression pattern of trl14 was similar to that of trl5s, and both reached their maximum expression at 1 h after infection.

4. Discussion

The spleen and kidney are the main immune organs, while the intestine is the largest endocrine organ in fish. The intestinal mucosal barrier system could block pathogenic microorganisms and toxins and plays an important role in fish immune defense [21]. In recent years, research on various TLR genes and specific TLRs against various PAMPs during invasion has been increasing; however, related research in fish is rare. The gene sequence characteristics, structural domain characteristics, and phylogeny status of the four TLRs in swamp eel were verified and analyzed in the present study. In addition, collinearity analysis and protein tertiary structure prediction were performed. Furthermore, the background expression levels of the four TLR genes in nine tissues, and their expression patterns of three immune-related tissues after challenge by A. veronii were tested. These results laid the foundation for further revealing the function of TLRs in the innate immunity of swamp eel.
As in most other fish, almost all of the TLRs verified in this study possess LRR and TIR domains. tlr5m and tlr14 also have transmembrane domains. It was worth noting that the TLRs in swamp eel and other species had highly conserved domains. Vertebrate TLR genes do not seem to be evolving rapidly, and the differences in the molecular distance between species with shorter and longer generations were relatively small, which was consistent with reports that TLRs were highly conserved in evolution [21]. Phylogenetic tree analysis showed that the TLR classification of fish is the same as that of mammals and could be divided into six TLR subfamilies. The four TLR genes belonged to two subfamilies: the tlr1 subfamily and tlr5 subfamily.
We detected the expression of the four TLR genes in nine tissues of swamp eels and noted high expression of the TLRs in the spleen and kidney, which was highly consistent with the expression of TLR genes reported in other fish. For example, in the Banded Catfish (Pelteobagrus fulvidraco), nine TLR genes were highly expressed in the head kidney, trunk kidney, spleen, and liver, and all of which were involved in the host immune response [22]. In mandarin fish, 16 identified TLR genes were highly expressed in immune-related tissues (head kidney and spleen) and mucosa-related tissues (intestine and pyloric cecum) [23].
The analysis of the four TLR genes at six time points after a challenge with A. veronii showed that only tlr5s, tlr5m, and tlr14 responded positively in the early stage, indicating that these genes might be involved in the recognition of bacteria. Among them, the tlr5 subfamily comprises bacterial flagellin sensitive receptors, which could trigger the MyD88-dependent signal pathway and activate the transcription factor, nuclear factor kappa B (NF-κB) [24]. tlr5m had a structure and function similar to that of mammalian tlr5 [25]. tlr5s could trigger NF-κB activation in two species of fish in the presence of Vibrio anguillarum flagellin. In addition, tlr5s could directly interact with flagellin in rainbow trout (Oncorhyn chusmykiss), significantly enhancing tlr5m-mediated NF-κB activation, and it had been suggested that tlr5s could amplify the tlr5m-mediated immune response in a positive feedback manner [26,27]. This was consistent with the conclusion of the present study.
tlr14 belongs to the tlr1 subfamily. In the tlr1 subfamily, we identified two TLR genes, tlr1 and tlr14. Members of the tlr1 subfamily tend to combine with each other to form heterodimers, which work together to identify microbial components [28]. For instance, tlr1/ tlr2 binds and recognizes triacyl lipoproteins and mycobacteria [29,30]. This was consistent with our experimental results. After challenge by A. veronii, the expression of tlr1 in the spleen was inhibited, indicating that tlr1 was less involved in this immune response. However, tlr14 could respond to the invasion of many pathogens, for example, tlr14 expression in blood cells was upregulated after stimulation with poly(I:C) in lampreys (Lampetra japonica) [31]. In response to attack by Streptococcus suis and the Spotted green pufferfish (Edwardsiella lentus), tlr14 was upregulated in the bastard halibut (Paralichthys olivaceus) [32]. tlr14 transcription levels in the gills and spleen infected with parasites in orange-spotted groupers increased significantly [33]. It is possible that multiple fish tlr14 genes were created by duplications and likely evolved to express different ligand specificities. However, the ligand for fish tlr14 has not been confirmed.

5. Conclusions

In this study, the cDNA length and amino acid number of tlr1, tlr5s, tlr5m, and tlr14 genes of the swamp eel were 2876 bp, 2174 bp, 3400 bp, and 3319 bp and 801 aa, 653 aa, 888 aa, and 866 aa, respectively. We found that four TLRs genes were expressed in different tissues of swamp eel, and were highly expressed in immune tissues, such as the spleen and kidney. By observing the expression changes in various immune tissues under bacterial challenge, we verified the high sensitivity of the tlr5 subfamily to bacterial ligands and the universality of tlr14 ligands, as well as the consistent inhibition of the expression of other TLR genes being in the face of bacterial invasion. The functions of other TLRs in the swamp eel remain to be determined, and research into the functions of swamp eel TLRs in viral diseases and parasitic diseases has not been reported. With the vigorous development of swamp eel farming, the recognition of different diseases by swamp eel TLRs will have great scientific research value and practical significance.

Author Contributions

Conceptualization, H.G., H.Y. and D.Y.; Formal analysis, Q.X.; Capital acquisition, H.Y. and D.Y.; Methodology, Z.Z.; Project management, J.X.; Resources, H.Y. and D.Y.; Software, H.Y. and D.Y.; Supervision, Q.X.; Visualization, H.G.; Writing—manuscript, J.X.; Writing—Comments and editing, Z.Z. All authors have read and agreed to the published version of the manuscript.

Funding

This work was supported by China Agriculture Research System of MOF and MARA (CARS-46), the Engineering Research Center of Ecology and Agricultural Use of Wetland, Ministry of Education (grant number KFT202003, KF202114), and the Hubei Province Agriculture Research System (grant number HBHZD-ZB-2020-005).

Institutional Review Board Statement

The animal research protocol was approved by the animal experiment ethics committee of Yangtze University of China (approval number 2020018).

Data Availability Statement

The data presented in this study are available on request from the corresponding author.

Acknowledgments

The authors sincerely thank Zhehua Zhang and Hanwen Yuan for their help in the experimental investigation. The authors thank all editors and reviewers for their valuable comments on this study. All authors have read and agreed to the published version of the manuscript.

Conflicts of Interest

This is an original manuscript, which has not been published previously and has not been reviewed in any other publishing channels at present. There is no conflict of interest in this manuscript, and this manuscript has been approved for publication by all authors.

References

  1. Akira, S.; Uematsu, S.; Takeuchi, O. Pathogen recognition and innate immunity. Cell 2006, 124, 783–801. [Google Scholar] [CrossRef] [PubMed] [Green Version]
  2. Suresh, R.; Mosser, D.M. Pattern recognition receptors in innate immunity, host defense, and immunopathology. Adv. Physiol. Educ. 2013, 37, 284–291. [Google Scholar] [CrossRef]
  3. Sahoo, B.R. Structure of fish Toll-like receptors (TLR) and NOD-like receptors (NLR). Int. J. Biol. Macromol. 2020, 161, 1602–1617. [Google Scholar] [CrossRef]
  4. Takeuchi, O.; Akira, S. Pattern Recognition Receptors and Inflammation. Cell 2010, 140, 805–820. [Google Scholar] [CrossRef] [PubMed] [Green Version]
  5. Netea, M.G.; Wijmenga, C.; O’Neill, L.A.J. Genetic variation in Toll-like receptors and disease susceptibility. Nat. Immunol. 2012, 13, 535–542. [Google Scholar] [CrossRef]
  6. Akira, S.; Takeda, K. Toll-like receptor signalling. Nat. Rev. Immunol. 2004, 4, 499–511. [Google Scholar] [CrossRef]
  7. Broz, P.; Monack, D.M. Newly described pattern recognition receptors team up against intracellular pathogens. Nat. Rev. Immunol. 2013, 13, 551–565. [Google Scholar] [CrossRef]
  8. O’Neill, L.A.J.; Bowie, A.G. The family of five: TIR-domain-containing adaptors in Toll-like receptor signalling. Nat. Rev. Immunol. 2007, 7, 353–364. [Google Scholar] [CrossRef]
  9. Blasius, A.L.; Beutler, B. Intracellular Toll-like Receptors. Immunity 2010, 32, 305–315. [Google Scholar] [CrossRef] [Green Version]
  10. Goubau, D.; Deddouche, S.; Reis e Sousa, C. Cytosolic Sensing of Viruses. Immunity 2013, 38, 855–869. [Google Scholar] [CrossRef] [Green Version]
  11. Zhou, Z.; Lin, Z.; Pang, X.; Shan, P.; Wang, J. MicroRNA regulation of Toll-like receptor signaling pathways in teleost fish. Fish Shellfish Immunol. 2018, 75, 32–40. [Google Scholar] [CrossRef] [PubMed]
  12. Zhang, J.; Kong, X.; Zhou, C.; Li, L.; Nie, G.; Li, X. Toll-like receptor recognition of bacteria in fish: Ligand specificity and signal pathways. Fish Shellfish Immunol. 2014, 41, 380–388. [Google Scholar] [CrossRef] [PubMed]
  13. Rauta, P.R.; Samanta, M.; Dash, H.R.; Nayak, B.; Das, S. Toll-like receptors (TLRs) in aquatic animals: Signaling pathways, expressions and immune responses. Immunol. Lett. 2013, 158, 14–24. [Google Scholar] [CrossRef] [PubMed]
  14. Cao, M.; Yan, X.; Yang, N.; Fu, Q.; Xue, T.; Zhao, S.; Hu, J.; Li, Q.; Song, L.; Zhang, X.; et al. Genome-wide characterization of Toll-like receptors in black rockfish Sebastes schlegelii: Evolution and response mechanisms following Edwardsiella tarda infection. Int. J. Biol. Macromol. 2020, 164, 949–962. [Google Scholar] [CrossRef]
  15. Gong, Y.; Feng, S.; Li, S.; Zhang, Y.; Zhao, Z.; Hu, M.; Xu, P.; Jiang, Y. Genome-wide characterization of Toll-like receptor gene family in common carp (Cyprinus carpio) and their involvement in host immune response to Aeromonas hydrophila infection. Comp. Biochem. Physiol. Part D Genom. Proteom. 2017, 24, 89–98. [Google Scholar] [CrossRef]
  16. Campanella, J.J.; Bitincka, L.; Smalley, J. MatGAT: An application that generates similarity/identity matrices using protein or DNA sequences. BMC Bioinform. 2003, 4, 29. [Google Scholar] [CrossRef] [Green Version]
  17. Larkin, M.A.; Blackshields, G.; Brown, N.P.; Chenna, R.; McGettigan, P.A.; McWilliam, H.; Valentin, F.; Wallace, I.M.; Wilm, A.; Lopez, R.; et al. Clustal W and Clustal X version 2.0. Bioinformatics 2007, 23, 2947–2948. [Google Scholar] [CrossRef] [Green Version]
  18. Kumar, S.; Stecher, G.; Tamura, K. MEGA7: Molecular Evolutionary Genetics Analysis Version 7.0 for Bigger Datasets. Mol. Biol. Evol. 2016, 33, 1870–1874. [Google Scholar] [CrossRef] [Green Version]
  19. Muñoz, I.; Sepulcre, M.P.; Meseguer, J.; Mulero, V. Molecular cloning, phylogenetic analysis and functional characterization of soluble Toll-like receptor 5 in gilthead seabream, Sparus aurata. Fish Shellfish Immunol. 2013, 35, 36–45. [Google Scholar] [CrossRef]
  20. Takano, T.; Hwang, S.D.; Kondo, H.; Hirono, I.; Aoki, T.; Sano, M. Evidence of Molecular Toll-like Receptor Mechanisms in Teleosts. Fish Pathol. 2010, 45, 1–16. [Google Scholar] [CrossRef] [Green Version]
  21. Xia, H.; Yang, P.; Liu, L.; Luo, Y.; Sun, Y.; Wang, W.; Chen, N.; Zhao, J. Advances in Intestinal Mucosal Immunoglobulins of Teleost Fish (A Review). Isr. J. Aquac.-Bamidgeh 2019, 71, 1617. Available online: http://hdl.handle.net/10524/62917 (accessed on 25 June 2022).
  22. Zhang, X.-T.; Zhang, G.-R.; Shi, Z.-C.; Yuan, Y.-J.; Zheng, H.; Lin, L.; Wei, K.-J.; Ji, W. Expression analysis of nine Toll-like receptors in yellow catfish (Pelteobagrus fulvidraco) responding to Aeromonas hydrophila challenge. Fish Shellfish Immunol. 2017, 63, 384–393. [Google Scholar] [CrossRef] [PubMed]
  23. Wang, K.L.; Chen, S.N.; Huo, H.J.; Nie, P. Identification and expression analysis of sixteen Toll-like receptor genes, TLR1, TLR2a, TLR2b, TLR3, TLR5M, TLR5S, TLR7–9, TLR13a–c, TLR14, TLR21–23 in mandarin fish Siniperca chuatsi. Dev. Comp. Immunol. 2021, 121, 104100. [Google Scholar] [CrossRef] [PubMed]
  24. Gewirtz, A.T.; Navas, T.A.; Lyons, S.; Godowski, P.J.; Madara, J.L. Cutting Edge: Bacterial Flagellin Activates Basolaterally Expressed TLR5 to Induce Epithelial Proinflammatory Gene Expression. J. Immunol. 2001, 167, 1882–1885. [Google Scholar] [CrossRef] [PubMed] [Green Version]
  25. Bai, J.-S.; Li, Y.-W.; Deng, Y.; Huang, Y.-Q.; He, S.-H.; Dai, J.; Zhao, S.-Z.; Dan, X.-M.; Luo, X.-C. Molecular identification and expression analysis of TLR5M and TLR5S from orange-spotted grouper (Epinepheluscoioides). Fish Shellfish Immunol. 2017, 63, 97–102. [Google Scholar] [CrossRef]
  26. Tsujita, T.; Tsukada, H.; Nakao, M.; Oshiumi, H.; Matsumoto, M.; Seya, T. Sensing Bacterial Flagellin by Membrane and Soluble Orthologs of Toll-like Receptor 5 in Rainbow Trout (Onchorhynchus mikiss). J. Biol. Chem. 2004, 279, 48588–48597. [Google Scholar] [CrossRef] [Green Version]
  27. Tsujita, T.; Ishii, A.; Tsukada, H.; Matsumoto, M.; Che, F.-S.; Seya, T. Fish soluble Toll-like receptor (TLR)5 amplifies human TLR5 response via physical binding to flagellin. Vaccine 2006, 24, 2193–2199. [Google Scholar] [CrossRef]
  28. Yu, J.; Liu, X.; Yang, N.; Wang, B.; Su, B.; Fu, Q.; Zhang, M.; Tan, F.; Li, C. Characterization of toll-like receptor 1 (TLR1) in turbot (Scophthalmus maximus L.). Fish Shellfish Immunol. 2021, 115, 27–34. [Google Scholar] [CrossRef]
  29. Wu, X.-Y.; Xiang, L.-X.; Huang, L.; Jin, Y.; Shao, J.-Z. Characterization, expression and evolution analysis of Toll-like receptor 1 gene in pufferfish (Tetraodon nigroviridis). Int. J. Immunogenet. 2008, 35, 215–225. [Google Scholar] [CrossRef]
  30. Jin, M.S.; Kim, S.E.; Heo, J.Y.; Lee, M.E.; Kim, H.M.; Paik, S.-G.; Lee, H.; Lee, J.-O. Crystal Structure of the TLR1-TLR2 Heterodimer Induced by Binding of a Tri-Acylated Lipopeptide. Cell 2007, 130, 1071–1082. [Google Scholar] [CrossRef] [Green Version]
  31. Kasamatsu, J.; Oshiumi, H.; Matsumoto, M.; Kasahara, M.; Seya, T. Phylogenetic and expression analysis of lamprey toll-like receptors. Dev. Comp. Immunol. 2010, 34, 855–865. [Google Scholar] [CrossRef] [PubMed] [Green Version]
  32. Hwang, S.D.; Kondo, H.; Hirono, I.; Aoki, T. Molecular cloning and characterization of Toll-like receptor 14 in Japanese flounder, Paralichthys olivaceus. Fish Shellfish Immunol. 2011, 30, 425–429. [Google Scholar] [CrossRef] [PubMed]
  33. Li, Y.-W.; Xu, D.-D.; Li, X.; Mo, Z.-Q.; Luo, X.-C.; Li, A.-X.; Dan, X.-M. Identification and characterization of three TLR1 subfamily members from the orange-spotted grouper, Epinephelus coioides. Dev. Comp. Immunol. 2016, 61, 180–189. [Google Scholar] [CrossRef] [PubMed]
Figure 1. Structural characteristics of TLRs of swamp eel.: Signal peptide; LRR-NT; LRR; Transmembrane zone; Low complexity zone; LRR-CT; TIR. TLR, toll like receptor; LRR-NT, N-terminal leucine-rich repeat; LRR, leucine-rich repeat; LRR-CT, C-terminal leucine-rich repeat; TIR, Toll/interleukin-1 receptor domain.
Fishes 07 00177 g001
Figure 2. Phylogenetic tree of swamp eel toll like receptors (TLRs). Different subfamily proteins are represented by different colors. The species names and GenBank accession numbers are shared in the branch. A red dot represents a swamp eel TLR protein.
Fishes 07 00177 g002
Figure 3. Genes marked in red are the target genes, and the direction of the arrow is the transcription direction. The number indicates the number of genes hidden between the two genes. White genes indicate genes that are different from the annotated genes. The name of the gene is given at the top. If it is not given, it is unnamed.
Fishes 07 00177 g003
Figure 4. Predicted tertiary structure of tlr1.
Fishes 07 00177 g004
Figure 5. Predicted tertiary structure of tlr5s.
Fishes 07 00177 g005
Figure 6. Predicted tertiary structure of tlr5m.
Fishes 07 00177 g006
Figure 7. Predicted tertiary structure of tlr14.
Fishes 07 00177 g007
Figure 8. The expression of swamp eel toll like receptor (TLR) genes in various tissues (setting the expression level of the TLRs in the gonads to 1). Each value represents mean ± SD (n = 3), and bars with different letters indicate significantly differences by LSD test for each time point (p < 0.05). Note: M: muscle; SK: skin; L: liver; I: intestine; SP: spleen; G: gonads; HK: head kidney; MK: middle kidney; B: blood.
Fishes 07 00177 g008
Figure 9. The expression patterns of the Toll-like receptor (TLR) genes tlr1, tlr5s, tlr5m, and tlr14 in swamp eel tissues at different timepoints (0, 1, 4, 12, 24, and 72 h) after A. veronii challenge. The expression levels of the four TLR genes in intestine (I), spleen (SP), and kidney (K) were determined by quantitative real-time reverse transcription PCR. Asterisks (*) mark the significant differences between the experimental and control groups (p < 0.05). Asterisks (**) mark an extremely distinct differences between the experimental and control groups (p < 0.01). Error bars indicate the standard error (n = 5).
Fishes 07 00177 g009
Table 1. The primers used in this study.
NameNumberSequence (5′ to 3′)UsageLength (bp)
tlr1-QF
tlr1-QR
XM_020624433.1ACAGCAACTCCACCGAGAAGA
CGGCTAGGTTAAGGACCACGA
Quantitative real-time PCR209
tlr1-F
tlr1-R
ATGAAGCCCATGACTGCCACCT
TCACTCATCTATTTCTGTGGCT
ORF cloning2406
tlr5s-QF
tlr5s-QR
M_020603847.1TGTAGCCAACTGTGCCTTCCG
CACATTCATGCCGAGCACCAG
Quantitative real-time PCR219
tlr5s-F
tlr5s-R
ATGAAAGAAGATTTAAGGTG
TTACTTCTGTTCGACCTGAG
ORF cloning1962
tlr5m-QF
tlr5m-QR
XM_020617012.1GGCTCTTCAGTTGGCTTTCAC
ATGCTGGGAGGCAGAATAGGT
Quantitative real-time PCR132
tlr5m-F
tlr5m-R
ATGTGGACACTGGCTCTTCA
TCACATGGCAATTGCTCTGA
ORF cloning2667
tlr14-QF
tlr14-QR
XM_020615508.1GACTTTGCTCGTTCACCCACAT
TACCCAGGCATCACAAGGCAC
Quantitative real-time PCR201
tlr14-F
tlr14-R
ATGATTTGGAAGTTGATTCA
TCAAACTACCTCCAGAGGGA
ORF cloning2601
EF-1α-QF
EF-1α-QR
KC011266.1CCTTCTTGGGTATGGAATCTTGC
CAGAGTATTTACGCTCAGGTGGG
Quantitative real-time PCR190
Table 2. The sequence information and physiochemical features of TLRs.
Featuretlr1tlr5stlr5mtlr14
cDNA length (bp)2876217434003319
ORF (bp)2406196226672601
Amino acids (aa)801653888866
Signal peptide22 2022
LRR motifs612117
LRR-CT0111
LRR-NT0100
TM domain0011
TIR domain1011
Molecular weight (kDa)108.1280.87127.47125.001
pI6.508.725.798.59
Instability index41.6839.9738.0838.83
Aliphatic index103.83104.37101.7691.26
Gene IDXM_020624433.1XM_020603847.1XM_020617012.1XM_020615508.1
Table 3. The sequence similarities of TLRs among species.
Speciestlr1tlr5stlr5mtlr14
Homo sapiens37.2% 38.5%
Gallus36.5% 40.3%
Xenopus tropicalis33.9%
Danio rerio47.5% 41.2%
Oncorhynchus mykiss58.8%52.2%
Ictalurus punctatus45.8%43.2%
Siniperca chuatsi74.0%74.9%74.5%75.5%
Epinephelus coioides68.4%68.5%64.4%
Scophthalmus maximus72.2% 72.9%
Salmo salar 53.1%
Takifugu rubripes62.3% 62.5%71.7%
Publisher’s Note: MDPI stays neutral with regard to jurisdictional claims in published maps and institutional affiliations.

