Article

Potential Role of Gastrointestinal Microbiota in Growth Regulation of Yellowtail Kingfish Seriola lalandi in Different Stocking Densities

1
Joint Laboratory for Deep Blue Fishery Engineering of Pilot National Laboratory for Marine Science and Technology (Qingdao), Yellow Sea Fisheries Research Institute, Chinese Academy of Fishery Sciences, Qingdao 266071, China
2
Marine Science Research Institute of Shandong Province (National Oceanographic Center, Qingdao), Qingdao 266104, China
*
Author to whom correspondence should be addressed.
Fishes 2022, 7(4), 154; https://doi.org/10.3390/fishes7040154
Submission received: 13 May 2022 / Revised: 25 June 2022 / Accepted: 26 June 2022 / Published: 28 June 2022
(This article belongs to the Special Issue Gut Microbiota in Fish and Shellfish)

Abstract

:
A 90-day study was performed under three different stocking densities, including high density (10,000 fishes/cage), medium density (8000 fishes/cage), and low density (6000 fishes/cage), in a deep-sea net cage for yellowtail kingfish (Seriola lalandi). The physiological characteristics and growth performance were tested, and structural characteristics of the gastrointestinal microbiota were systematically analyzed. The results show that fishes with high density had a lower weight gain rate and a specific growth rate, as well as higher serum cortisol content. The diversity, types and numbers of dominant microbiota with significant differences, and the numbers of shared genera among the different groups all changed. Core genera in the gastrointestinal tract were obtained according to the principles of dominance, commonality, and difference. The changes in the relative abundance of the core genera might be related to the growth and physiological characteristics of the host. The ratio of Firmicutes to Bacteroidetes in the stomach and pyloric caecum, which favors the accumulation of energy by the host from the diet, was higher in the medium-density group than in the other groups. This indicates that the higher density could cause physiological stress and affect growth performance. In order to reduce the resulting growth differences, gastrointestinal microbiota might assist the host in accumulating energy, participating in the energy distribution by adjusting its structure. Based on the growth, physiology, and production practices, the medium density was the appropriate density in this study. This study provides a reference for the improvement of deep-sea culture technology and the promotion of healthy growth through the gastrointestinal microecological regulation of yellowtail kingfish.

1. Introduction

Yellowtail kingfish, Seriola lalandi, is a large globally distributed pelagic migratory fish species [1,2]. It is considered a promising species for the aquaculture industry worldwide because of its high flesh quality, fast growth, and farming suitability in both net cages and recirculating systems [3,4,5]. The natural resources of this species have declined drastically in recent years, and large-scale farming began in 2017 as seedlings production technology was established in China. Aquaculture technologies for deep-water anti-wave net cages and industrial circulating waters are being developed. As yellowtail kingfish is a high-end food product for cuisine and sashimi, the quality of farmed fish is very important. Therefore, methods of adjusting the environmental factors, such as the stocking density, to improve the farmed welfare of fish have become a focus of farmers.
Gut microbiota have become a popular research field in recent years. There are trillions of microorganisms colonizing the gut, and their composition and activity are closely related to the conditions of the host itself, including its genetic information and physiological stage, and environmental factors, including feed nutrition, environmental bacteria, stress, etc. [6,7,8,9,10,11,12,13]. Likewise, microbiota colonizing the gut can participate in and influence a variety of physiological activities of the host, including its nutrition, energy absorption, and immunization, especially in adapting to extreme environments [14,15,16].
The research on the gut microbiota of yellowtail kingfish is gradually developing. Walburn et al. [10] and Horlick et al. [13] reported that environmental factors, including nutrition, temperature, and exterior microorganisms, could significantly change the structures of microbiota in the yellowtail kingfish gut. Meanwhile, a recent study indicated the potential role of specific bacteria in the yellowtail kingfish microbiota in preventing bacterial disease [17]. In the farming of yellowtail kingfish, aquaculture production has been affected by some problems associated with intensive fish farming, such as disease outbreaks or nutritional deficiencies causing high mortalities. Some researchers compared and analyzed the differences in the structure and function of the gut microbiota of yellowtail kingfish in the wild and those farmed in a land-based recirculating aquaculture system [18], which helps screen potential native probiotics, inhibits the reproduction of pathogenic microbiota from microecology, and promotes the absorption of nutrients by the host.
With the gradual expansion of the yellowtail kingfish stocking scale, its aquaculture management and technology are particularly important. However, there have been few studies on the key technical parameters of artificially bred yellowtail kingfish, including stocking, aquaculture mode, etc. In this study, we investigated the physiological characteristics, growth performance, and structural characteristics of the colonized gastrointestinal microbiota in artificially bred yellowtail kingfish farmed in deep-sea net cages under low, medium, and high densities. Furthermore, we analyzed the succession rule of the main gastrointestinal microbiota and explored the possible relationship between the gastrointestinal microbiota and host growth. Finally, the appropriate stocking density for 1-year-old yellowtail kingfish farmed in a deep-sea net cage was obtained. The relative results will promote the healthy growth of these fish, effectively increase the output of farming, reduce the fishing of wild groups, and help to protect the wild resources.

2. Materials and Methods

2.1. The Source and Aquaculture Management of Yellowtail Kingfish

The 1-year-old artificially bred yellowtail kingfish used in this study came from the same batch of fertilized eggs from a hatchery in Dalian, Liaoning province, China. The average body length of the yellowtail kingfish was (47.97 ± 0.54) cm and the average weight was (1043.44 ± 38.06) g.
This study included three different density groups, a high-density group, a medium-density group, and a low-density group. The high-, medium-, and low-density groups cultured 10,000, 8000, and 6000 fish, respectively. The fishes of each group were farmed in the same square deep-water net cages (15 m × 15 m × 8 m) and domesticated for 14 days. The formal study began when the fishes had adapted to the environment in the net cage. Since this study was part of a large-scale aquaculture study, the fish were large. Therefore, there was only one deep-water net cage for each density group, and all fish in each cage were regarded as parallel individuals. During the domesticated and formal study stage, the water conditions were as follows: the temperature was 22–28 °C, the dissolved oxygen was higher than 6 mg/L, and the salinity was 31–32. The fishes were fed Ammodytes personatus twice a day at 5% of the fish body weight. The study lasted for 90 days.

2.2. Collection of the Growth Data and Samples

Before the first feed in the morning, we randomly selected 30 individuals from each density group at the beginning (0 d) and end (90 d) of the study, and the body weight and length indicators of each individual were measured after light anesthesia with MS-222 (Sigma-Aldrich, St. Louis, MO, USA). Subsequently, we randomly selected 9 of the 30 anesthetized individuals for gastrointestinal tract collection at 0 d and 90 d; the other individuals were put back into each density group. After cleaning with 75% alcohol, all sampled fishes were dissected and the gastrointestinal tracts were taken out with sterile scissors and forceps under sterile conditions. After removing the fatty tissue, blood vessels, and other tissues on the surface of the gastrointestinal tracts and cleaning with 75% alcohol, the samples were squeezed gently to remove any remaining contents in the gastrointestinal tracts. Then the gastrointestinal tracts were rinsed with pre-cooled sterile 1.5% saline three to five times. Each gastrointestinal tract, including the stomach, pyloric caecum, and gut, was differentiated according to its structural characteristics, separated with sterilized scissors, and stored in liquid nitrogen.
The blood samples were collected on 0 d, 30 d, 60 d, and 90 d during this farming study. Before the first feed in the morning, we randomly selected six individuals from each density group at each sampling time and anesthetized them with MS-222 (Sigma-Aldrich, St. Louis, MO, USA). After cleaning with 75% alcohol, the blood samples with 1 mL were quickly collected from the tail vein of each fish with a disposable syringe and placed in the refrigerator at 4 °C for 4 h. After the blood samples collection, the fishes were put back into each group.

2.3. Processing of Samples and DNA Extraction of Gastrointestinal Microbiota

The blood samples were taken out of the refrigerator and centrifuged for 10 min at 4 °C and 4000 r/min. Then the supernatant (serum) was aspirated. Serum samples from 2 individuals were mixed into 1 sample. The mixed serum samples were used to determine the cortisol content with a commercial kit (Nanjing Jiancheng Bioengineering Institute, Nanjing, China) following the manufacturer’s instructions.
Gastrointestinal tract samples from 3 individuals were mixed into 1 sample for each density group at each sampling time. Then the mixed gastrointestinal tract samples were ground at a low temperature, a certain amount of powder was weighted, and the total genomic DNA of the microbiota was extracted using a DNA Extraction Kit (DNeasy PowerSoil Kit, Qiagen, Germany) following the manufacturer’s instructions. The concentration of DNA was verified with NanoDrop and agarose gel. The genome DNA was used as a template for PCR amplification with the barcoded primers and Tks Gflex DNA Polymerase (Takara, Japan). For the microbiota diversity analysis, the V3–V4 variable regions of the 16S rDNA genes were amplified using PCR with universal primers 343 F (5′-TACGGRAGGCAGCAG-3′) and 798 R (5′-AGGGTATCTAATCCT-3′). The amplicon quality was visualized using gel electrophoresis, purified with AMPure XP beads (Agencourt, Beverly, MA, USA), and amplified for another round of PCR. After purification with the AMPure XP beads again, the final amplicon was quantified. Equal amounts of purified amplicon were pooled for subsequent sequencing. The paired-end reads (2 × 250 bp) were generated by sequencing on the Illumina NovaEeq 6000 platform.

2.4. Statistical Analysis

The following formulae were used to calculate different performance parameters: weight   gain   rate   WGR ,   % = 100 × W 2 W 1 / W 1 (where W2 and W1 represent the final and the initial body weights of the trial fishes, respectively), specific   growth   rate   SGR ,   % / day = 100 × ln   W 2     ln   W 1 / T (where T represents the study period), and condition   factor   K ,   g / cm 3 = 100 ×   W 2 / L 3 (where L represents the body length of the trial fishes).
The paired-end reads were then preprocessed using Trimmomatic software [19] to detect and cut off ambiguous bases (N). It also cut off low-quality sequences with an average quality score below 20 using the sliding window trimming approach. After trimming, the paired-end reads were assembled using FLASH software [20]. The parameters of the assembly were: 10 bp of minimal overlapping, 200 bp of maximum overlapping, and a 20% maximum mismatch rate. The sequences underwent further denoising as follows: Reads with ambiguous, homologous sequences or below 200 bp were abandoned. Reads with 75% of the bases above Q20 were retained. Then, reads with chimera were detected and removed. These two steps were achieved using QIIME software [21] (version 1.8.0). After these treatments, the effective tags were acquired from all samples. Several effective tags were clustered into operational taxonomic units (OTUs) when their shared sequencing identity was higher than 97% using Vsearch (v 2.4.2) [22]. Representative sequences of each OTU were selected and annotated with species using the RDP Classifier (v 2.2) [23] and Silva database (v 123) [24], where the threshold was higher than 0.7. To control for differences in the sampling effect, we rarefied each sample to 46,800 sequences (the minimum sequence amount among all samples) per sample before calculating the diversity indices. The relative abundance and alpha and beta diversity analyses were performed based on this homogenization process. Kyoto encyclopedia of genes and genomes (KEGG) pathway analysis was conducted with Tax4fun (0.3.1).
The one-way analysis of variance (ANOVA) was used to analyze the data with SPSS 17.0, and Duncan’s test was used to make multiple comparisons of the differences among the different density groups in growth performance and changes in the serum cortisol content during the whole study. The Mann–Whitney U test was used to detect the differences in the values of gastrointestinal microbiota between the beginning and end of this study, and the Kruskal–Wallis H test was used to detect the differences among the three stocking density groups. The significance level was set at p ≤ 0.05, and the results are expressed as the mean ± SD.

3. Results

3.1. Growth Performance

The initial body weights of the fishes in the high-density group were lower than those in the low- and medium-density groups; however, there were no significant differences (p > 0.05) (Table 1). The final body weights of the fishes in the high-density group were significantly lower than those in the other two density groups (p ≤ 0.05). The condition factor of the fishes in the medium-density group was significantly higher than the other two groups (p ≤ 0.05). The values of the weight gain rate and specific growth rate in the three groups decreased with the increase in stocking density. However, there were no significant differences in the weight gain rate or specific growth rate among the three different density groups (p > 0.05). At each sampling time, the content of cortisol in the serum of fishes in the high-density group was significantly higher than those in the low- and medium-density groups (p ≤ 0.05) (Figure 1). With the growth in the yellowtail kingfish, the trend of serum cortisol content first increased and then decreased in the low-density group and first decreased and then stabilized in the medium-density group, while the trend of the high-density group was opposite to that of the low-density group.

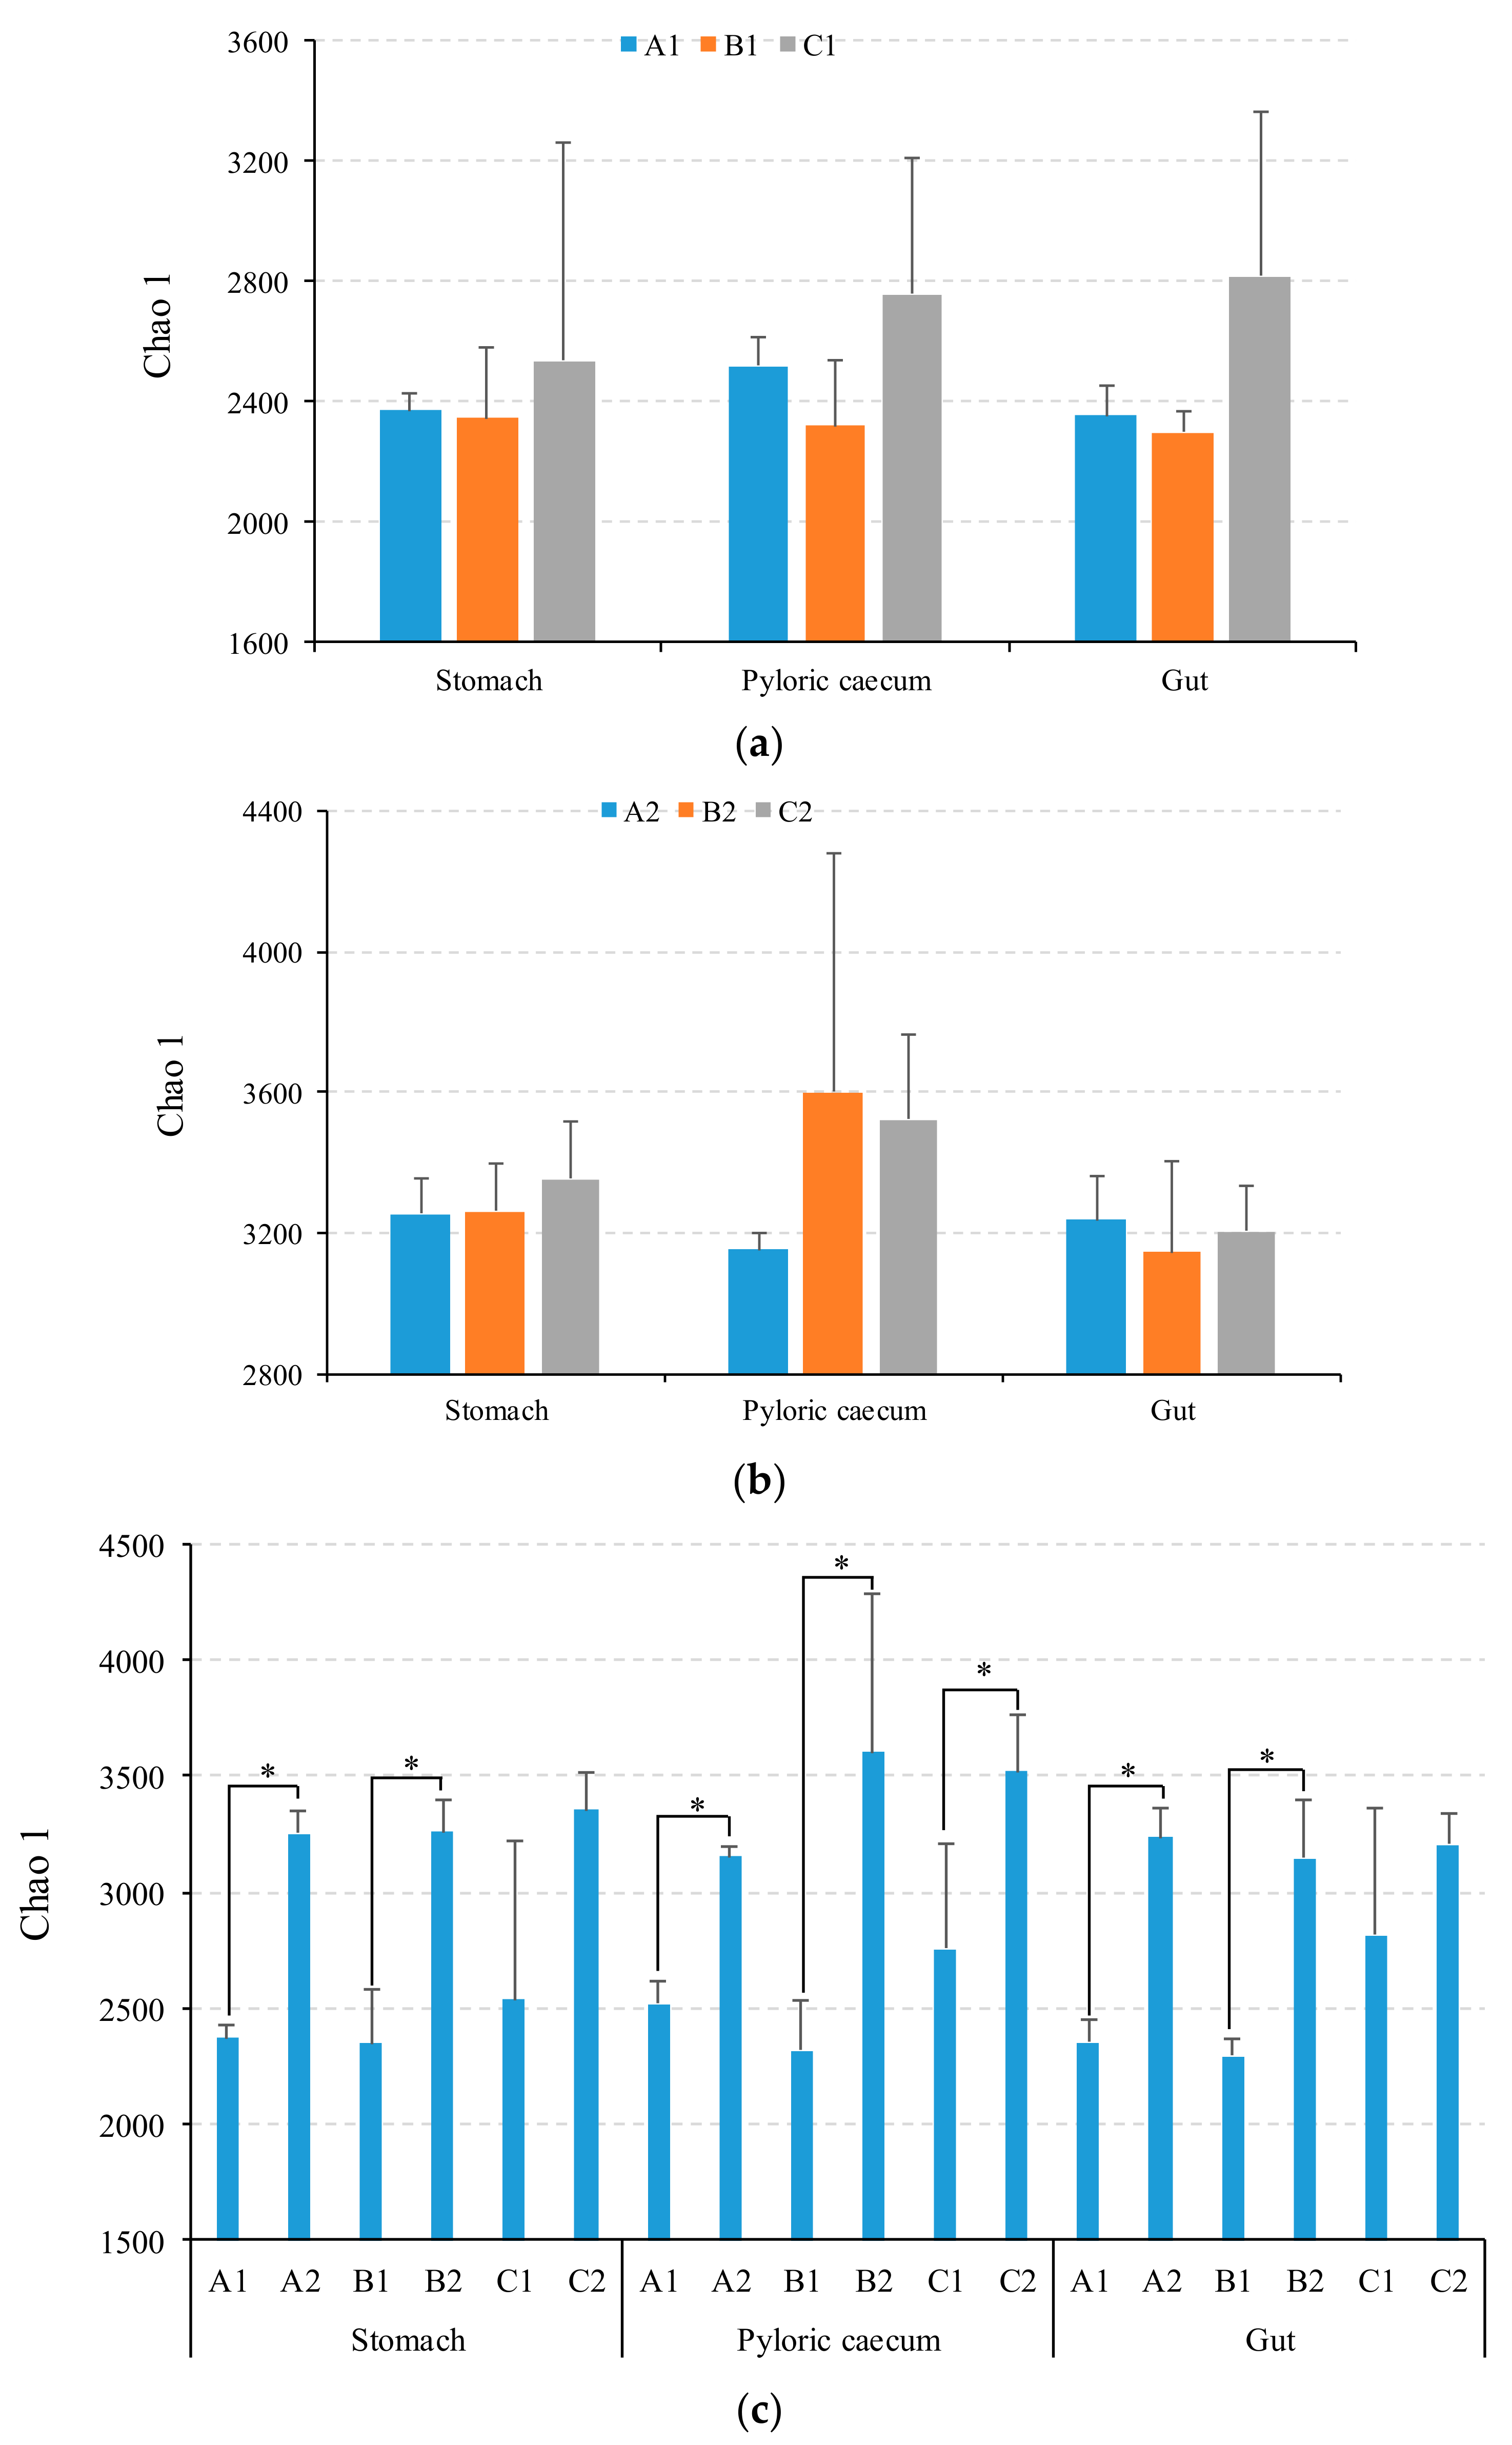
3.2. Sequencing Data and Alpha Diversity

After removing the barcode and primer sequences and cleaning the unqualified tags and chimera sequences for the row data obtained from the 54 samples with the Illumina HiSeq PE250 system, the effective tags that would be used in the subsequent analysis were obtained. The length of the effective tags was 412.34~417.73 bp, and the average was 415.68 bp (Figure S1). The number of effective tags was 58561.33~65502.67, and the average was 63502.87. These effective tags were classified into OTUs, and the average number of OTUs was 1962.61 in all gastrointestinal tissue samples of these fishes.
The Chao1 index is mainly used to estimate species richness. At the beginning or end of the study, there were no significant differences in the gastrointestinal tissue among the three groups (p > 0.05) (Figure 2a,b). However, with the increase in the stocking density, the trend of the Chao1 indices in the pyloric caecum obviously changed at the end of the study. With the growth of these fishes, the values of Chao1 index of the gastrointestinal tissue in the three groups increased (Figure 2c). Except in the stomach and gut of the fishes farmed in the high-density group, the values of the Chao1 indices in each gastrointestinal tissue at the end of the study were significantly higher than those at the beginning of the study (p ≤ 0.05).

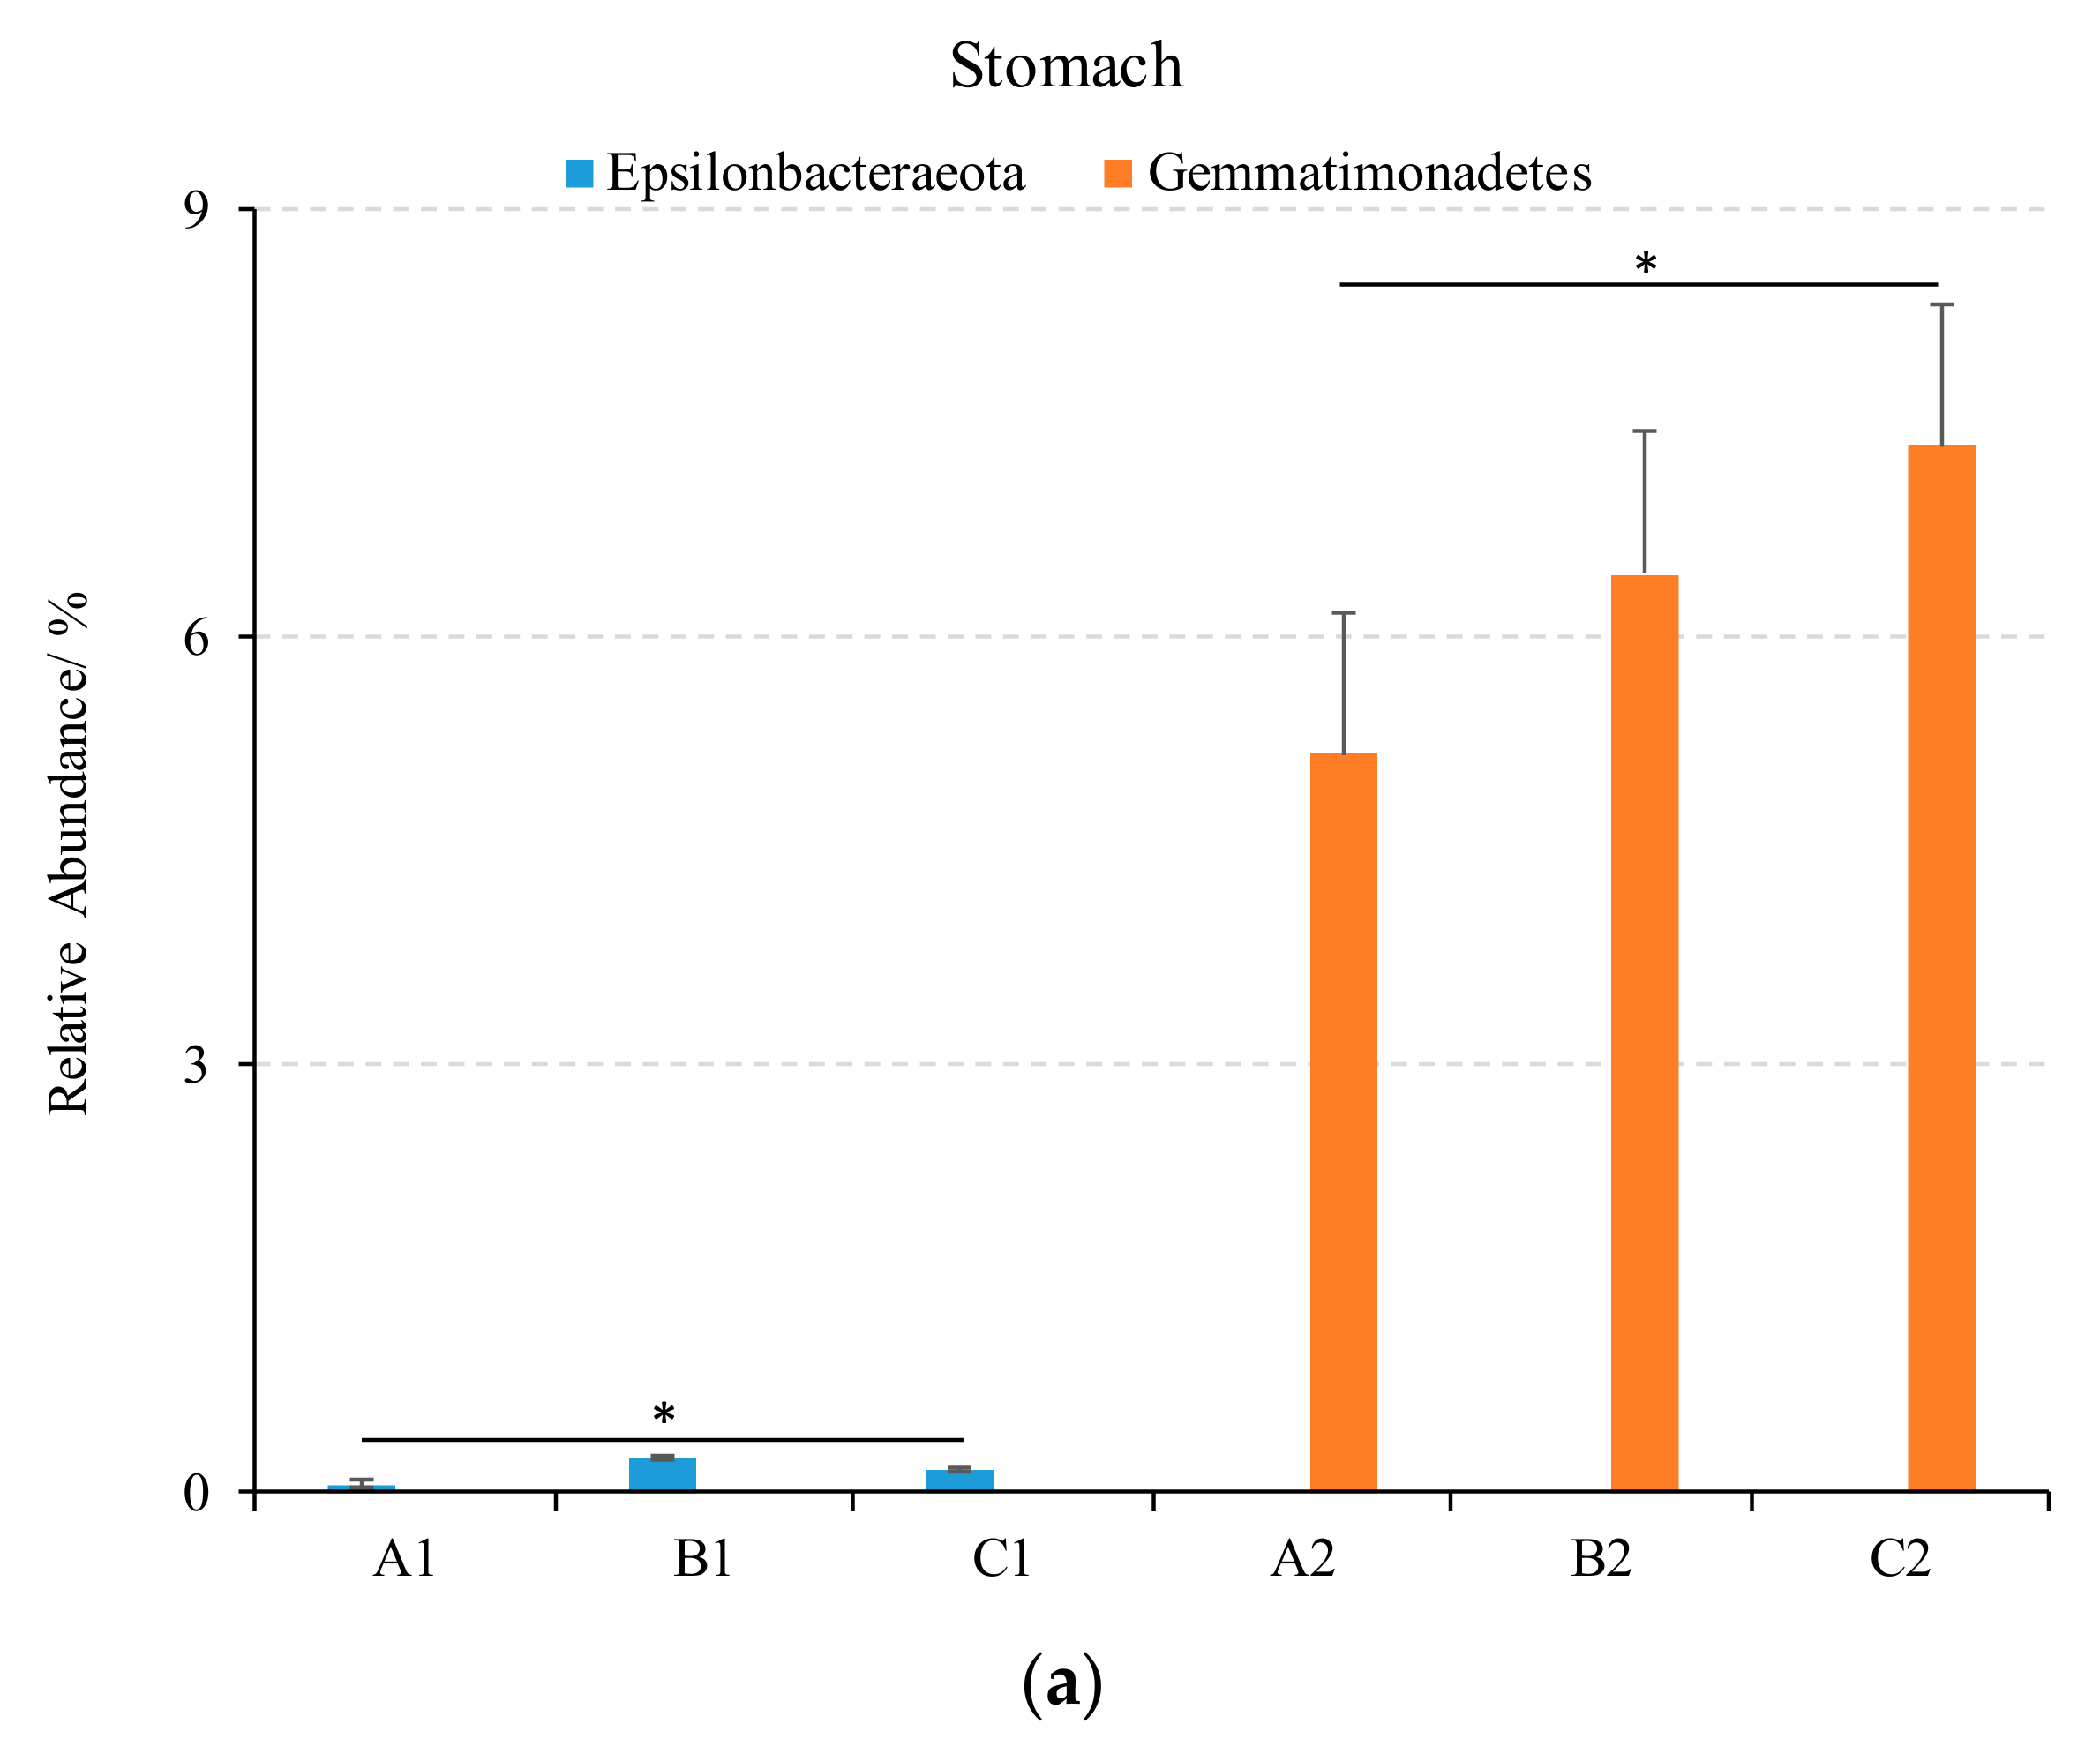
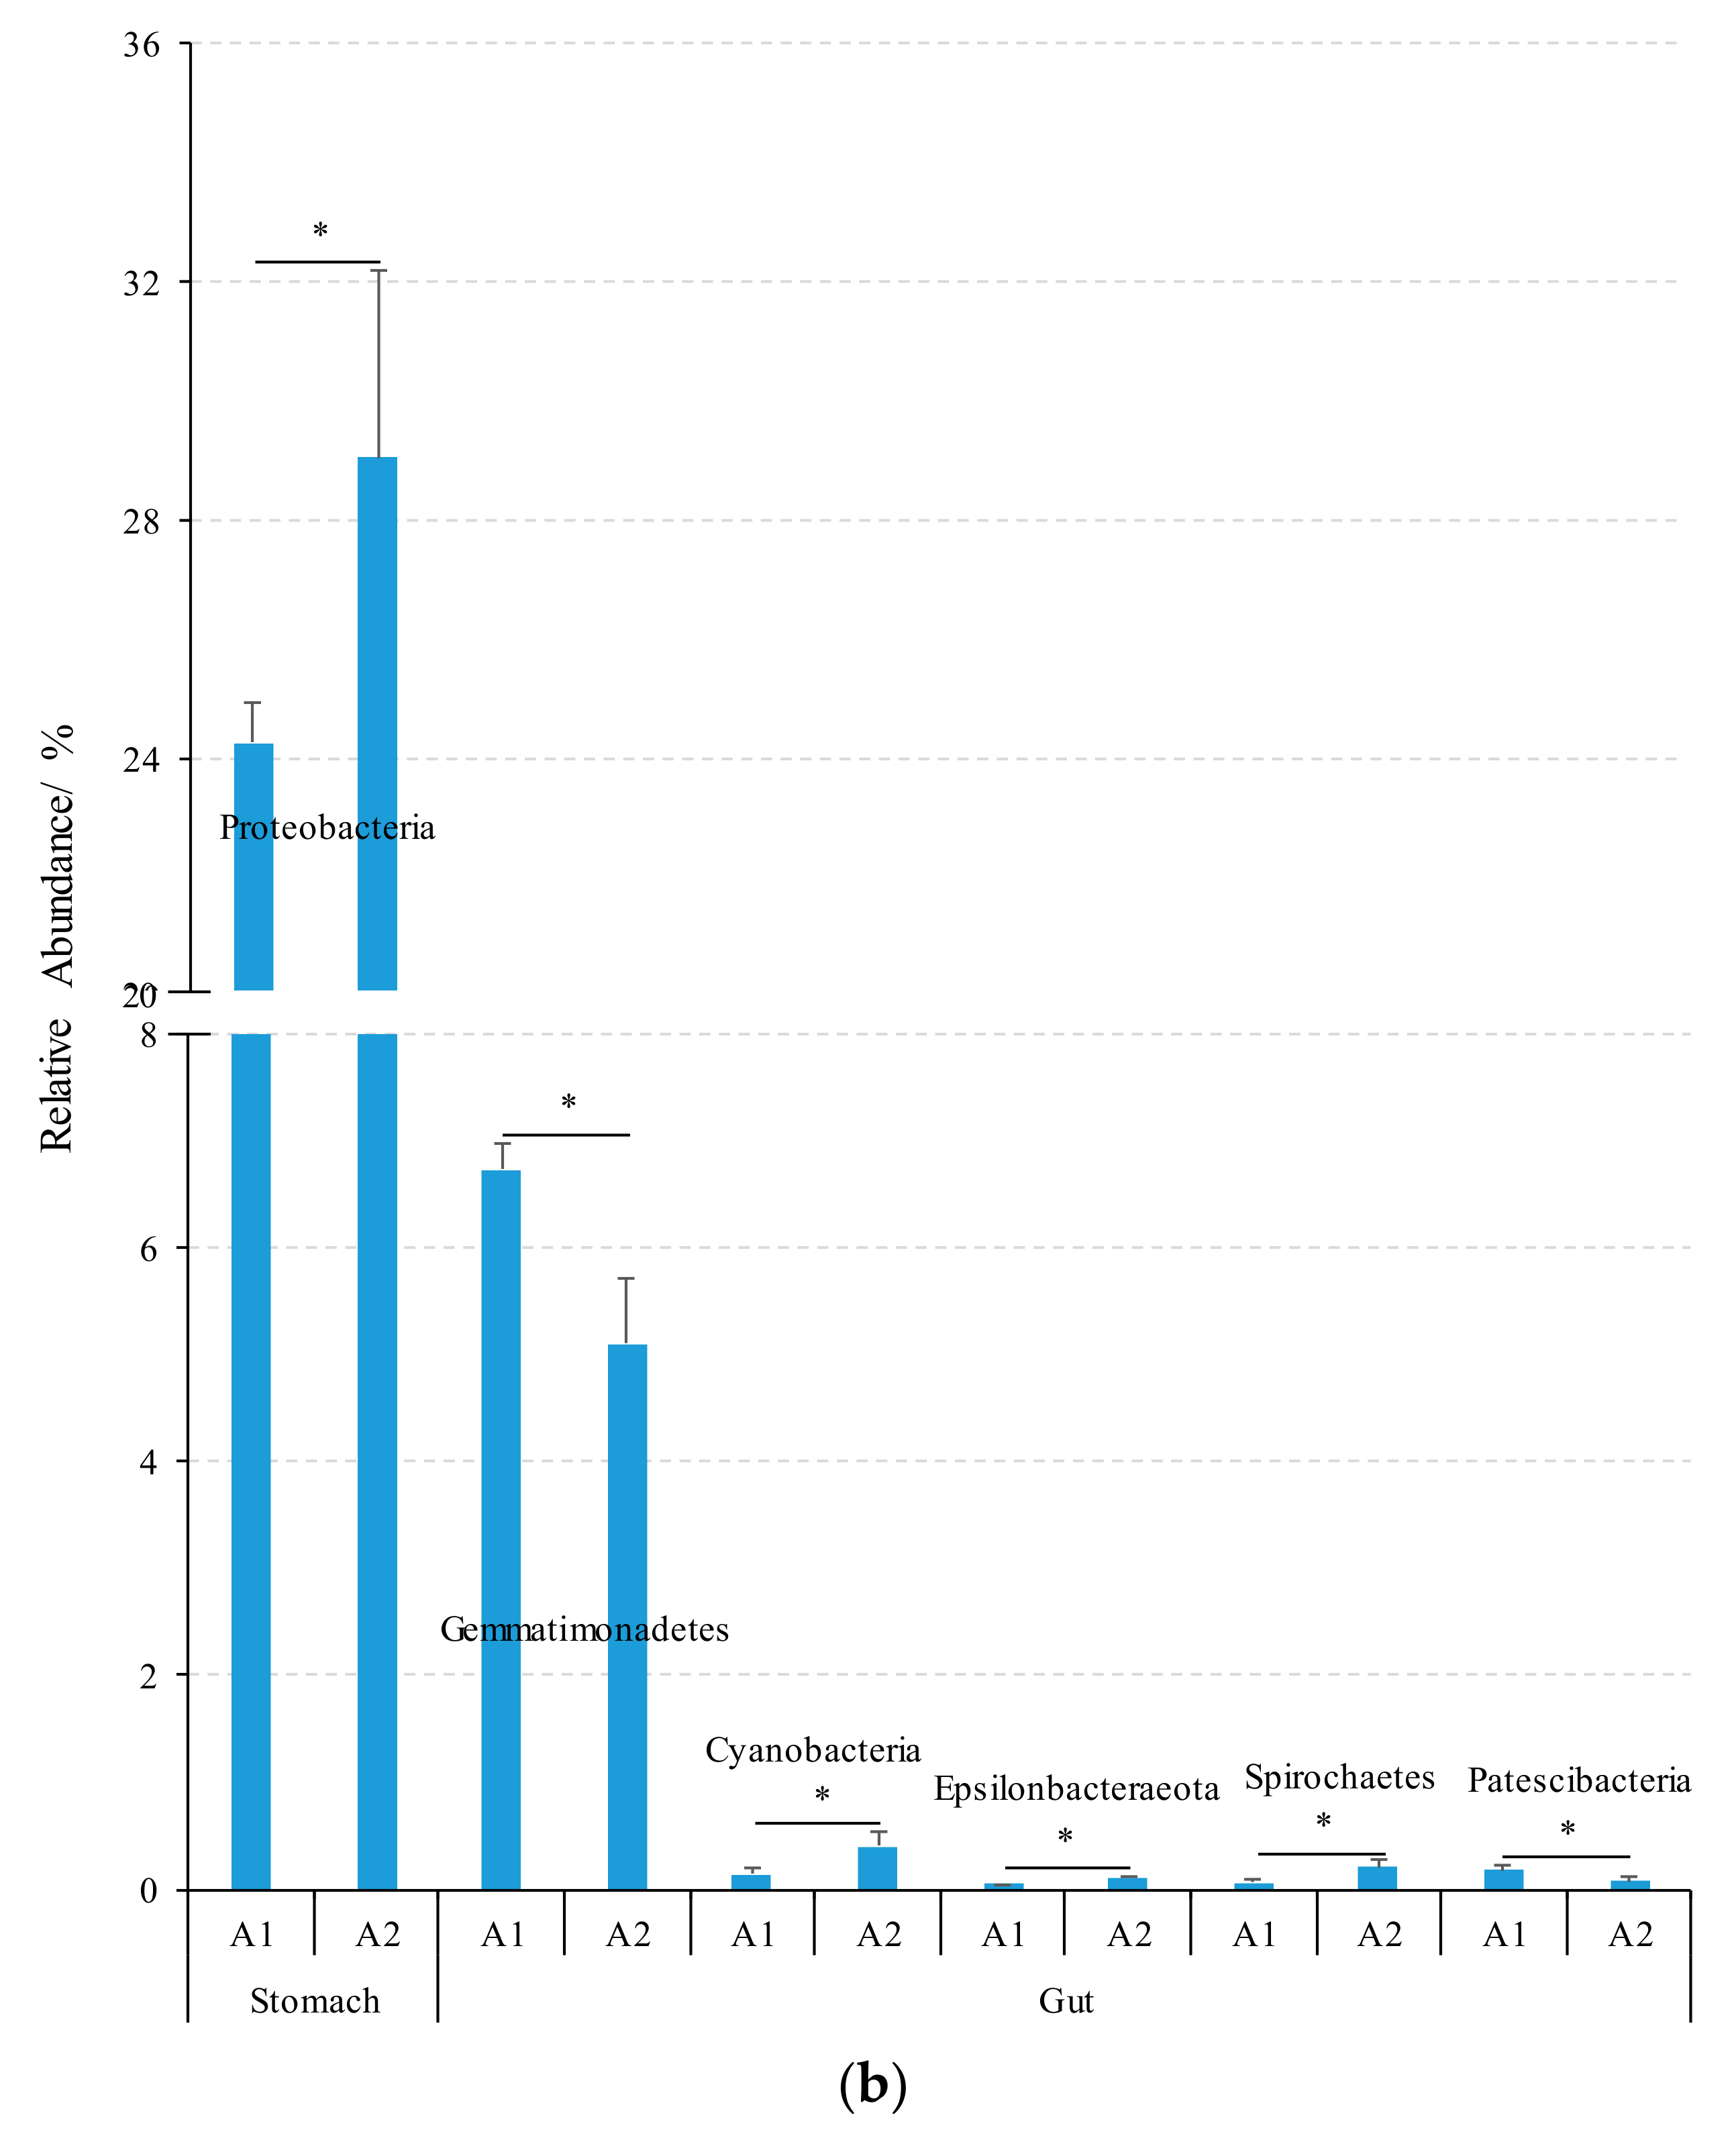
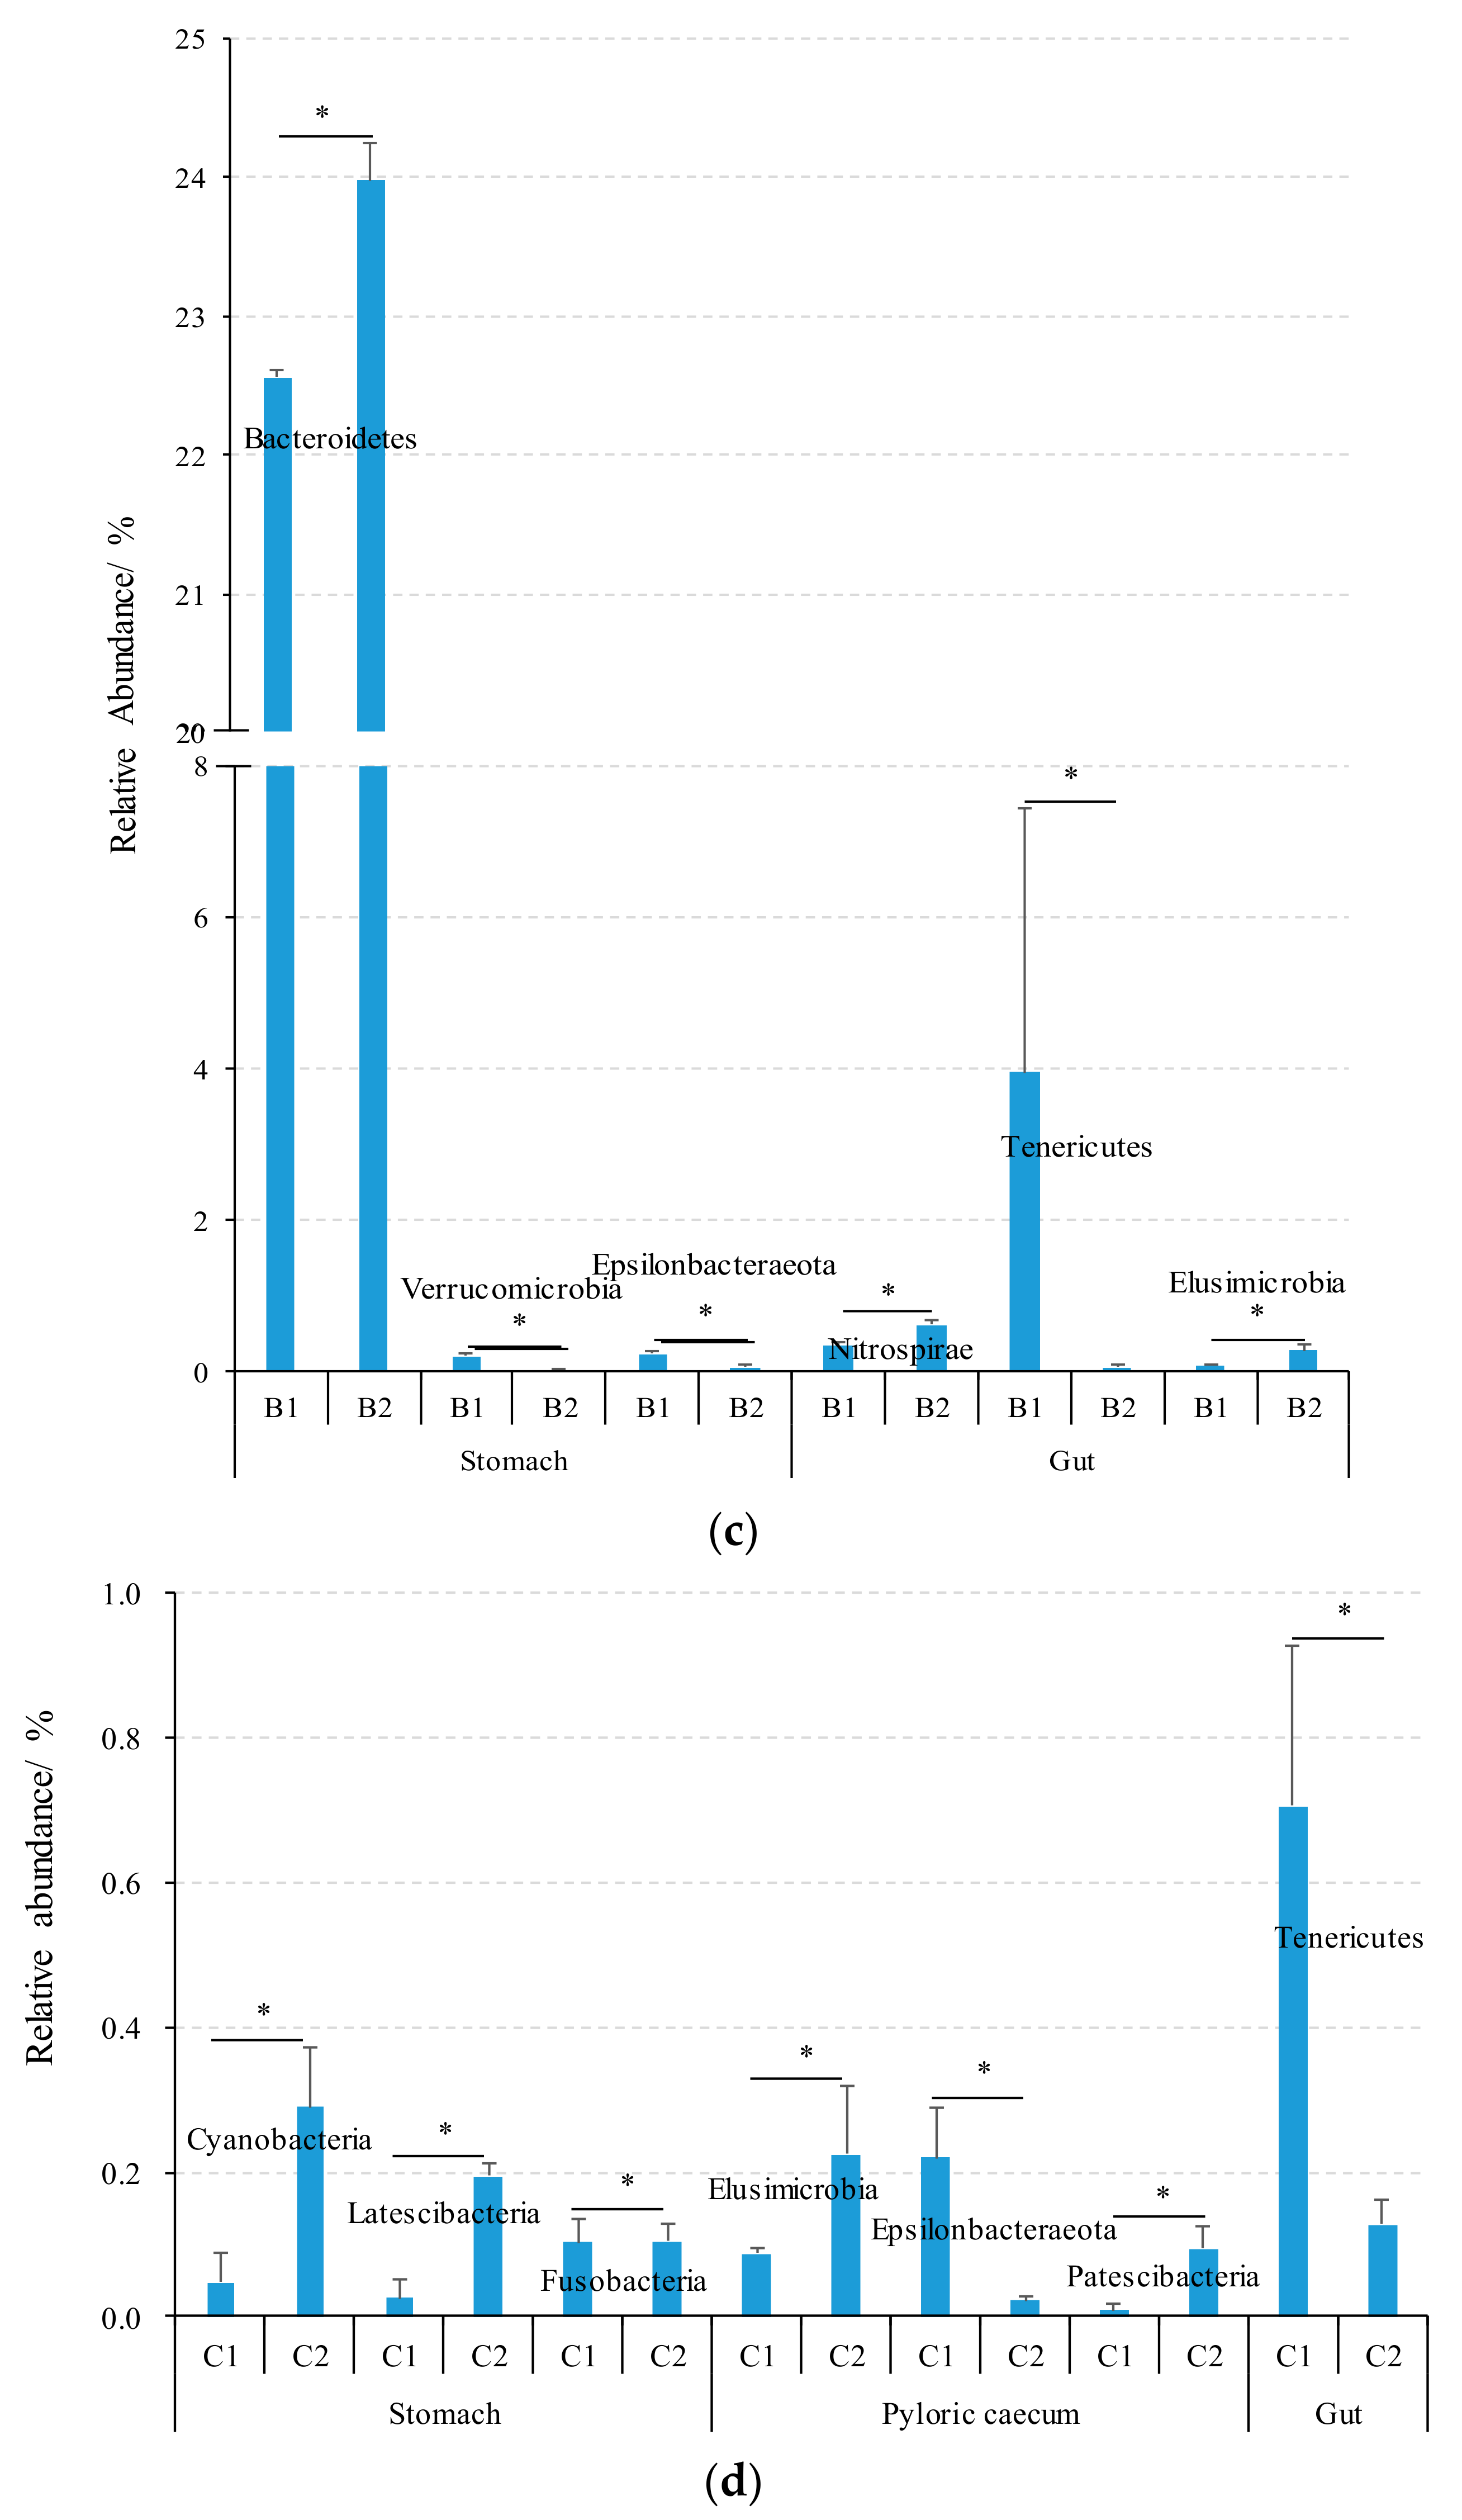
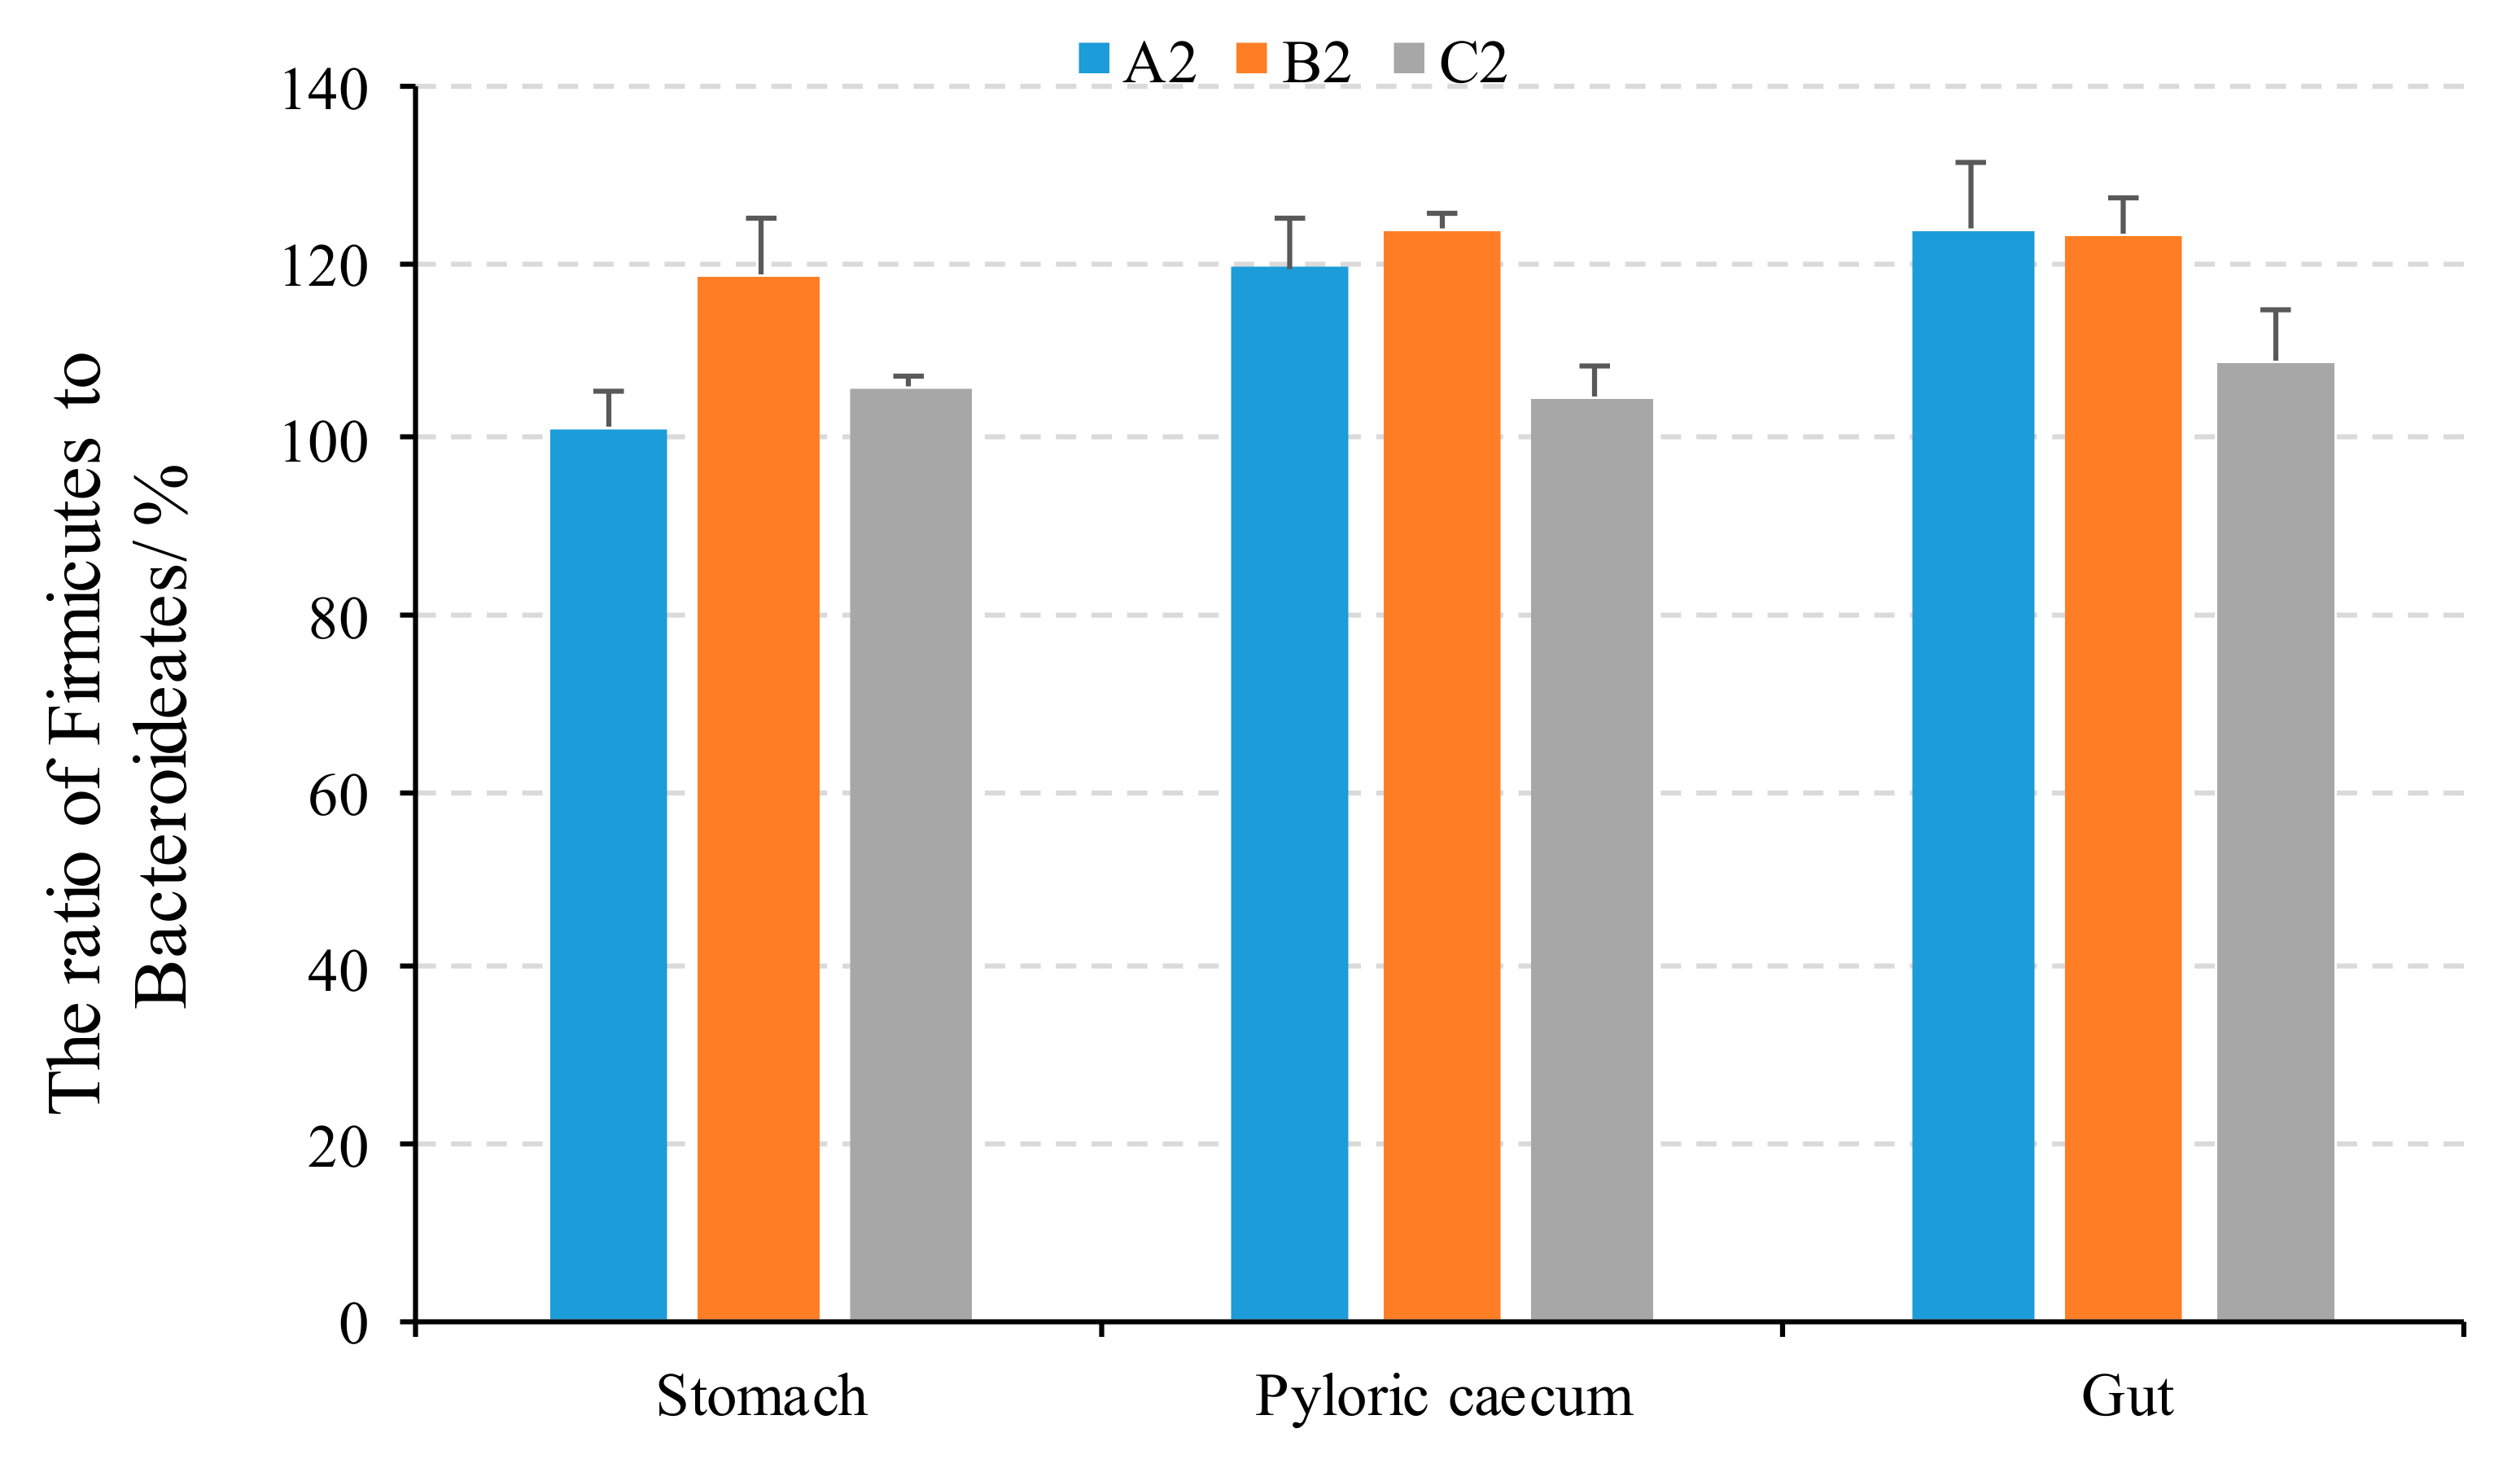
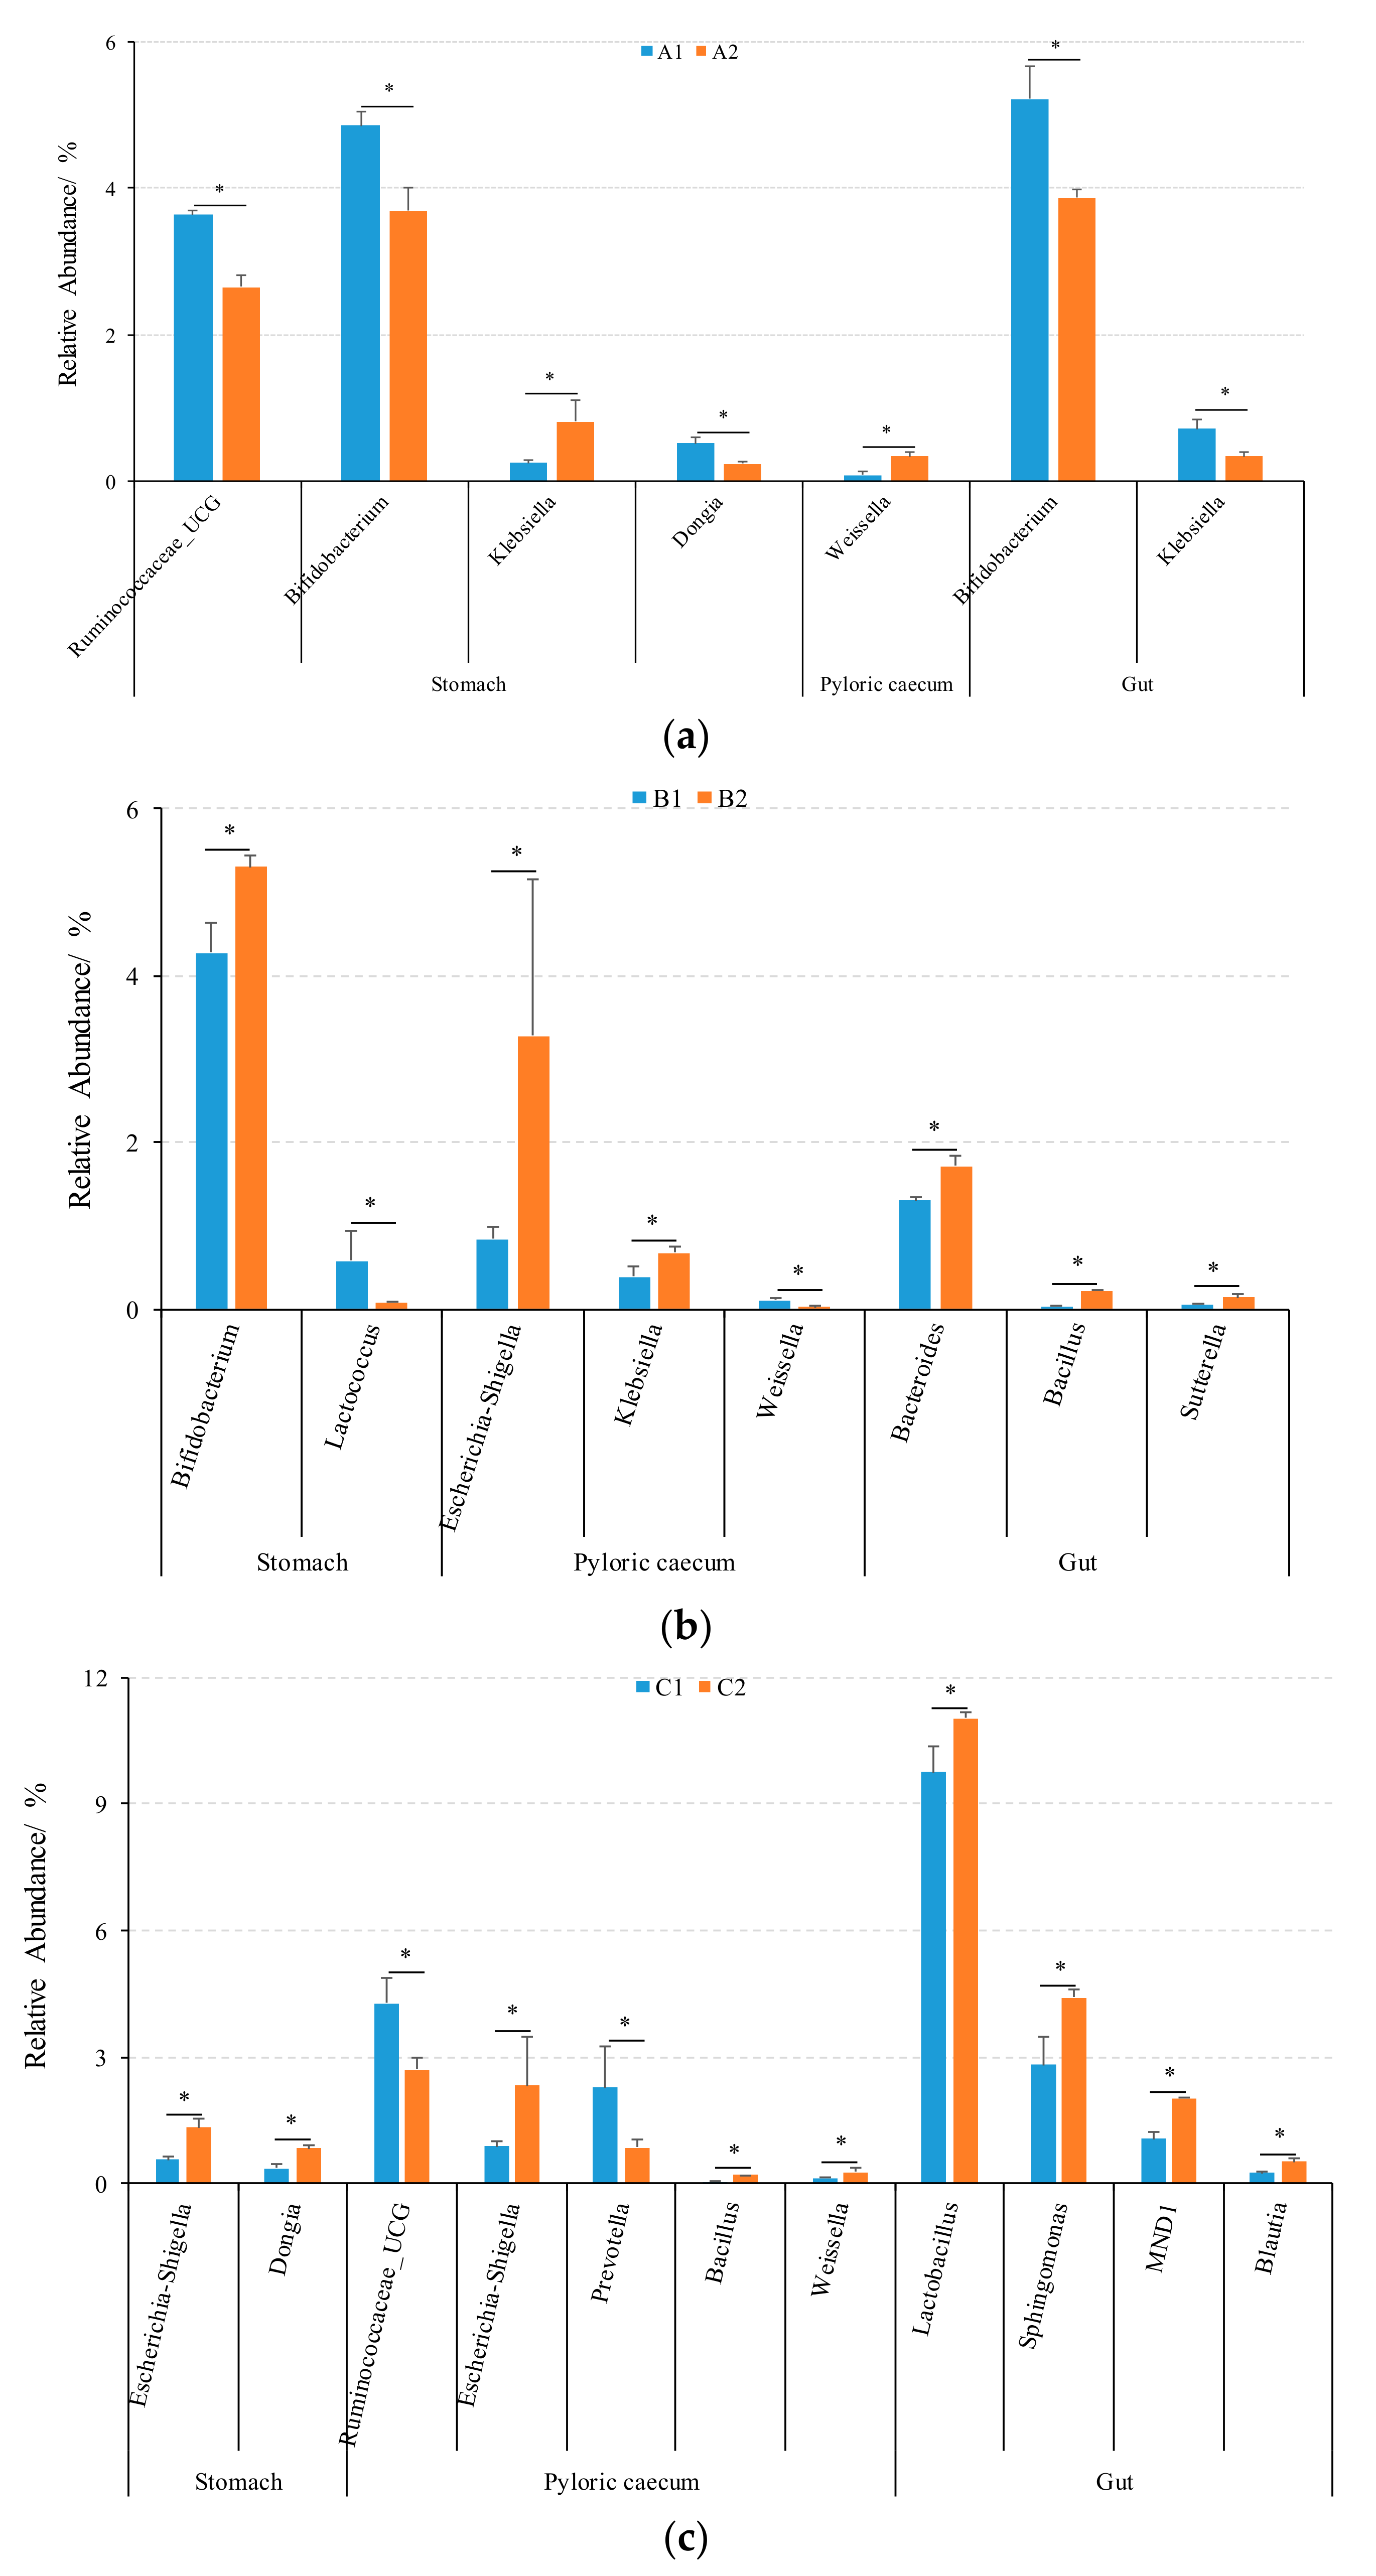
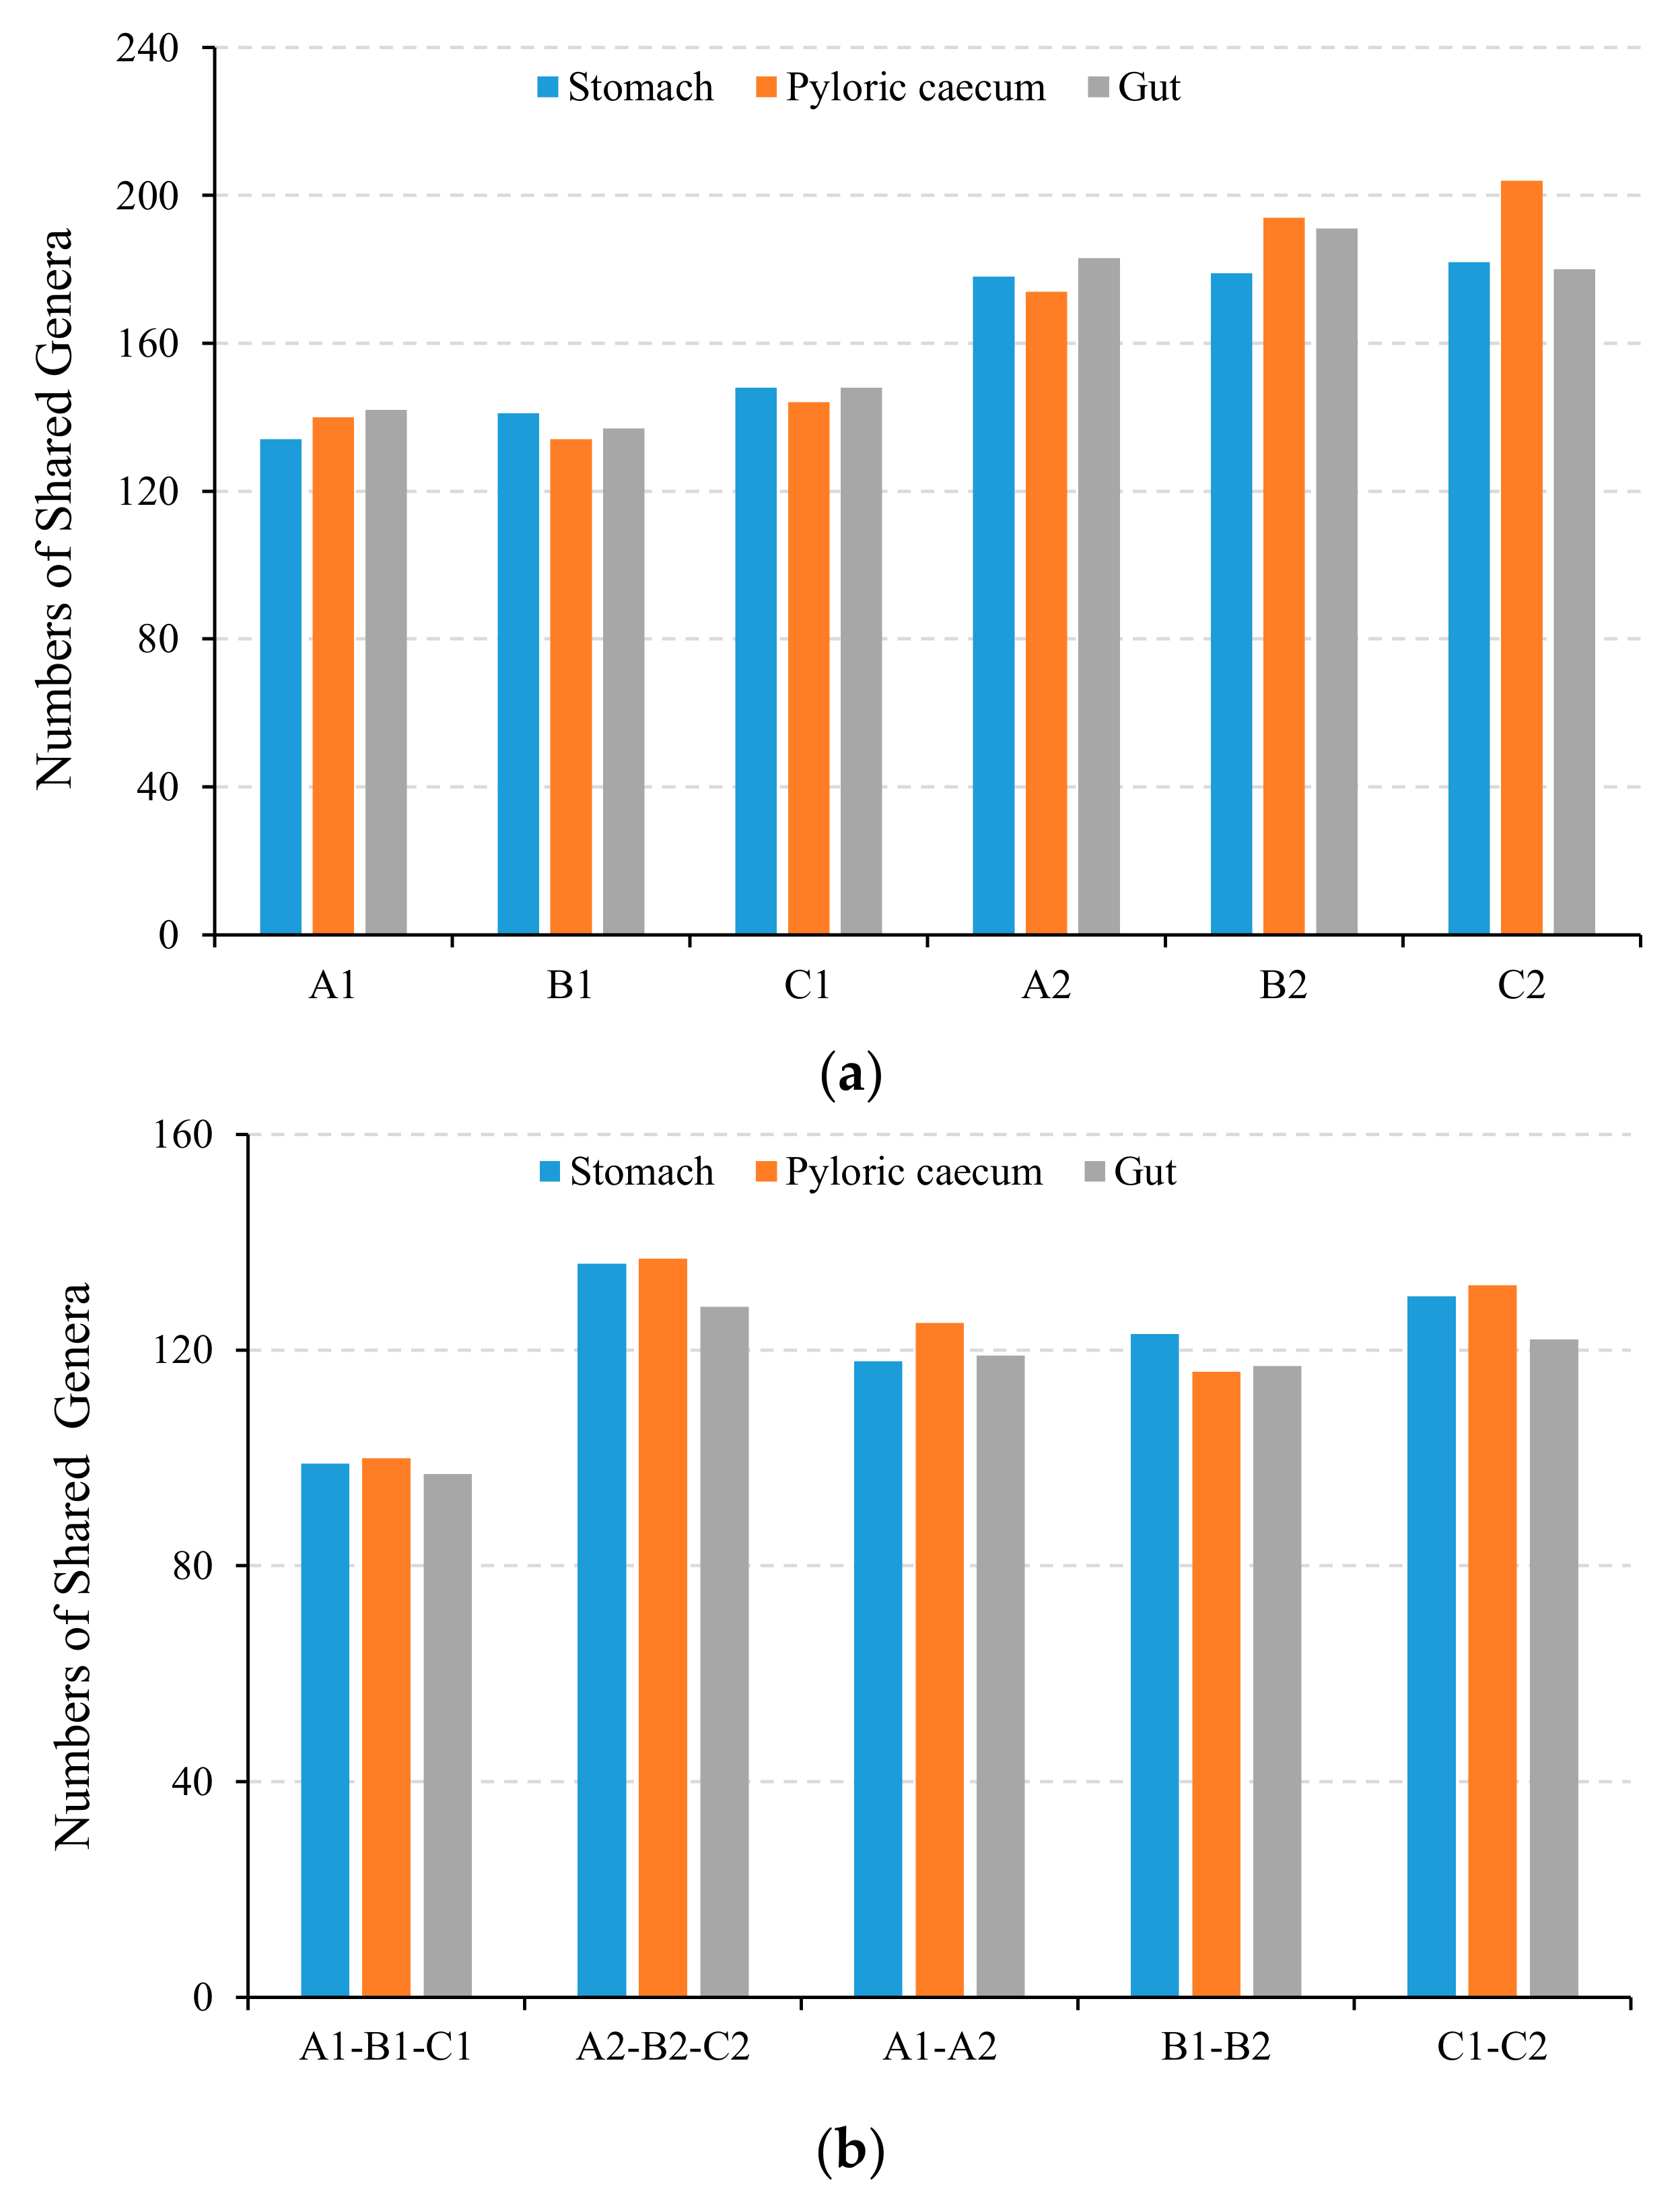
3.3. Structural Characteristics of Gastrointestinal Microbiota

The dominant (top ten, according to the average relative abundances of the three parallel samples for each gastrointestinal tissue in each treatment) phyla of relative abundance in each sample are presented in Figure S2. Firmicutes, Proteobacteria, Bacteroidetes, Actinobacteria, Gemmatimonadetes, Acidobacteria, and Nitrospirae were the shared and dominant phyla in the gastrointestinal tract in this study. The relative abundances of the first three dominant phyla, including Firmicutes, Proteobacteria, and Bacteroidetes, were 22.31–33.22%, and the sum of these phyla was 74.23–80.97%. In the stomach, there were significant differences in the relative abundances of Epsilonbacteraeota at the beginning of this study and Gemmatimonadetes at the end of the study among the three density groups (p ≤ 0.05) (Figure 3a). In the low-density group, there were significant differences in the relative abundances of Proteobacteria in the stomach, and Gemmatimonadetes, Cyanobacteria, Epsilonbacteraeota, Spirochaetes, and Patescibacteria in the gut between the beginning and end of the study (p ≤ 0.05) (Figure 3b). In the medium-density group, there were significant differences in the relative abundances of Bacteroidetes, Verrucomicrobia, and Epsilonbacteraeota in the stomach, and Nitrospirae, Tenericutes, and Elusimicrobia in the gut between the beginning and end of the study (p ≤ 0.05) (Figure 3c). In the high-density group, there were significant differences in the relative abundances of Cyanobacteria, Latescibacteria, and Fusobacteria in the stomach, Elusimicrobia, Epsilonbacteraeota, and Patescibacteria in the pyloric caecum, and Tenericutes in the gut between the beginning and end of the study (p ≤ 0.05) (Figure 3d). More importantly, the ratio of Firmicutes to Bacteroidetes in the medium-density group was higher in each gastrointestinal tissue (Figure 4).
The structural characteristics of the microbiota structures in the stomach, pyloric caecum, and gut of fishes farmed in different density groups are shown in Figure S3 based on the genus level. Lactobacillus, Bacteroides, genus represented by Ruminococcaceae_UCG, Bifidobacterium, Faecalibaculum, Sphingomonas, Escherichia-Shigella, Prevotella, Bacillus, Faecalibacterium, Lactococcus, etc., were the dominant (top ten, according to the average relative abundances of the three parallel samples of each gastrointestinal tissue in each treatment) genera in the gastrointestinal tracts of the fishes farmed in the three density groups. The abundance of Lactobacillus (8.25–11.83%) was the highest genus in all the gastrointestinal tract tissues. Lactobacillus, Bacteroides, genus represented by Ruminococcaceae_UCG, Bifidobacterium, Faecalibaculum, and Sphingomonas were the shared and dominant genera in the gastrointestinal tracts of the fishes in the study.
All dominant genera with significant differences in relative abundance are shown in Figure 5 in the study. With the growth of fishes in the low-density group, there were significant differences in the relative abundances of genus represented by Ruminococcaceae_UCG, Bifidobacterium, Klebsiella, and Dongia colonizing the stomach; Weissella colonizing the pyloric caecum; and Bifidobacterium and Klebsiella colonizing the gut between the beginning and end of the study (p ≤ 0.05) (Figure 3a). In the medium-density group, there were significant differences in the relative abundances of Bifidobacterium and Lactococcus colonizing the stomach; Escherichia-Shigella, Klebsiella, and Weissella colonizing the pyloric caecum; and Bacteroides, Sutterella and Bacillus colonizing the gut between the beginning and end of the study (p ≤ 0.05) (Figure 3b). In the high-density group, there were significant differences in the relative abundances of Escherichia-Shigella and Dongia colonizing the stomach; the genus represented by Ruminococcaceae_UCG, Escherichia-Shigella, Prevotella, Bacillus, and Weissella colonizing the pyloric caecum; and Lactobacillus, Sphingomonas, the genus represented by MND1, and Blautia colonizing gut between the beginning and end of the study (p ≤ 0.05) (Figure 3c).

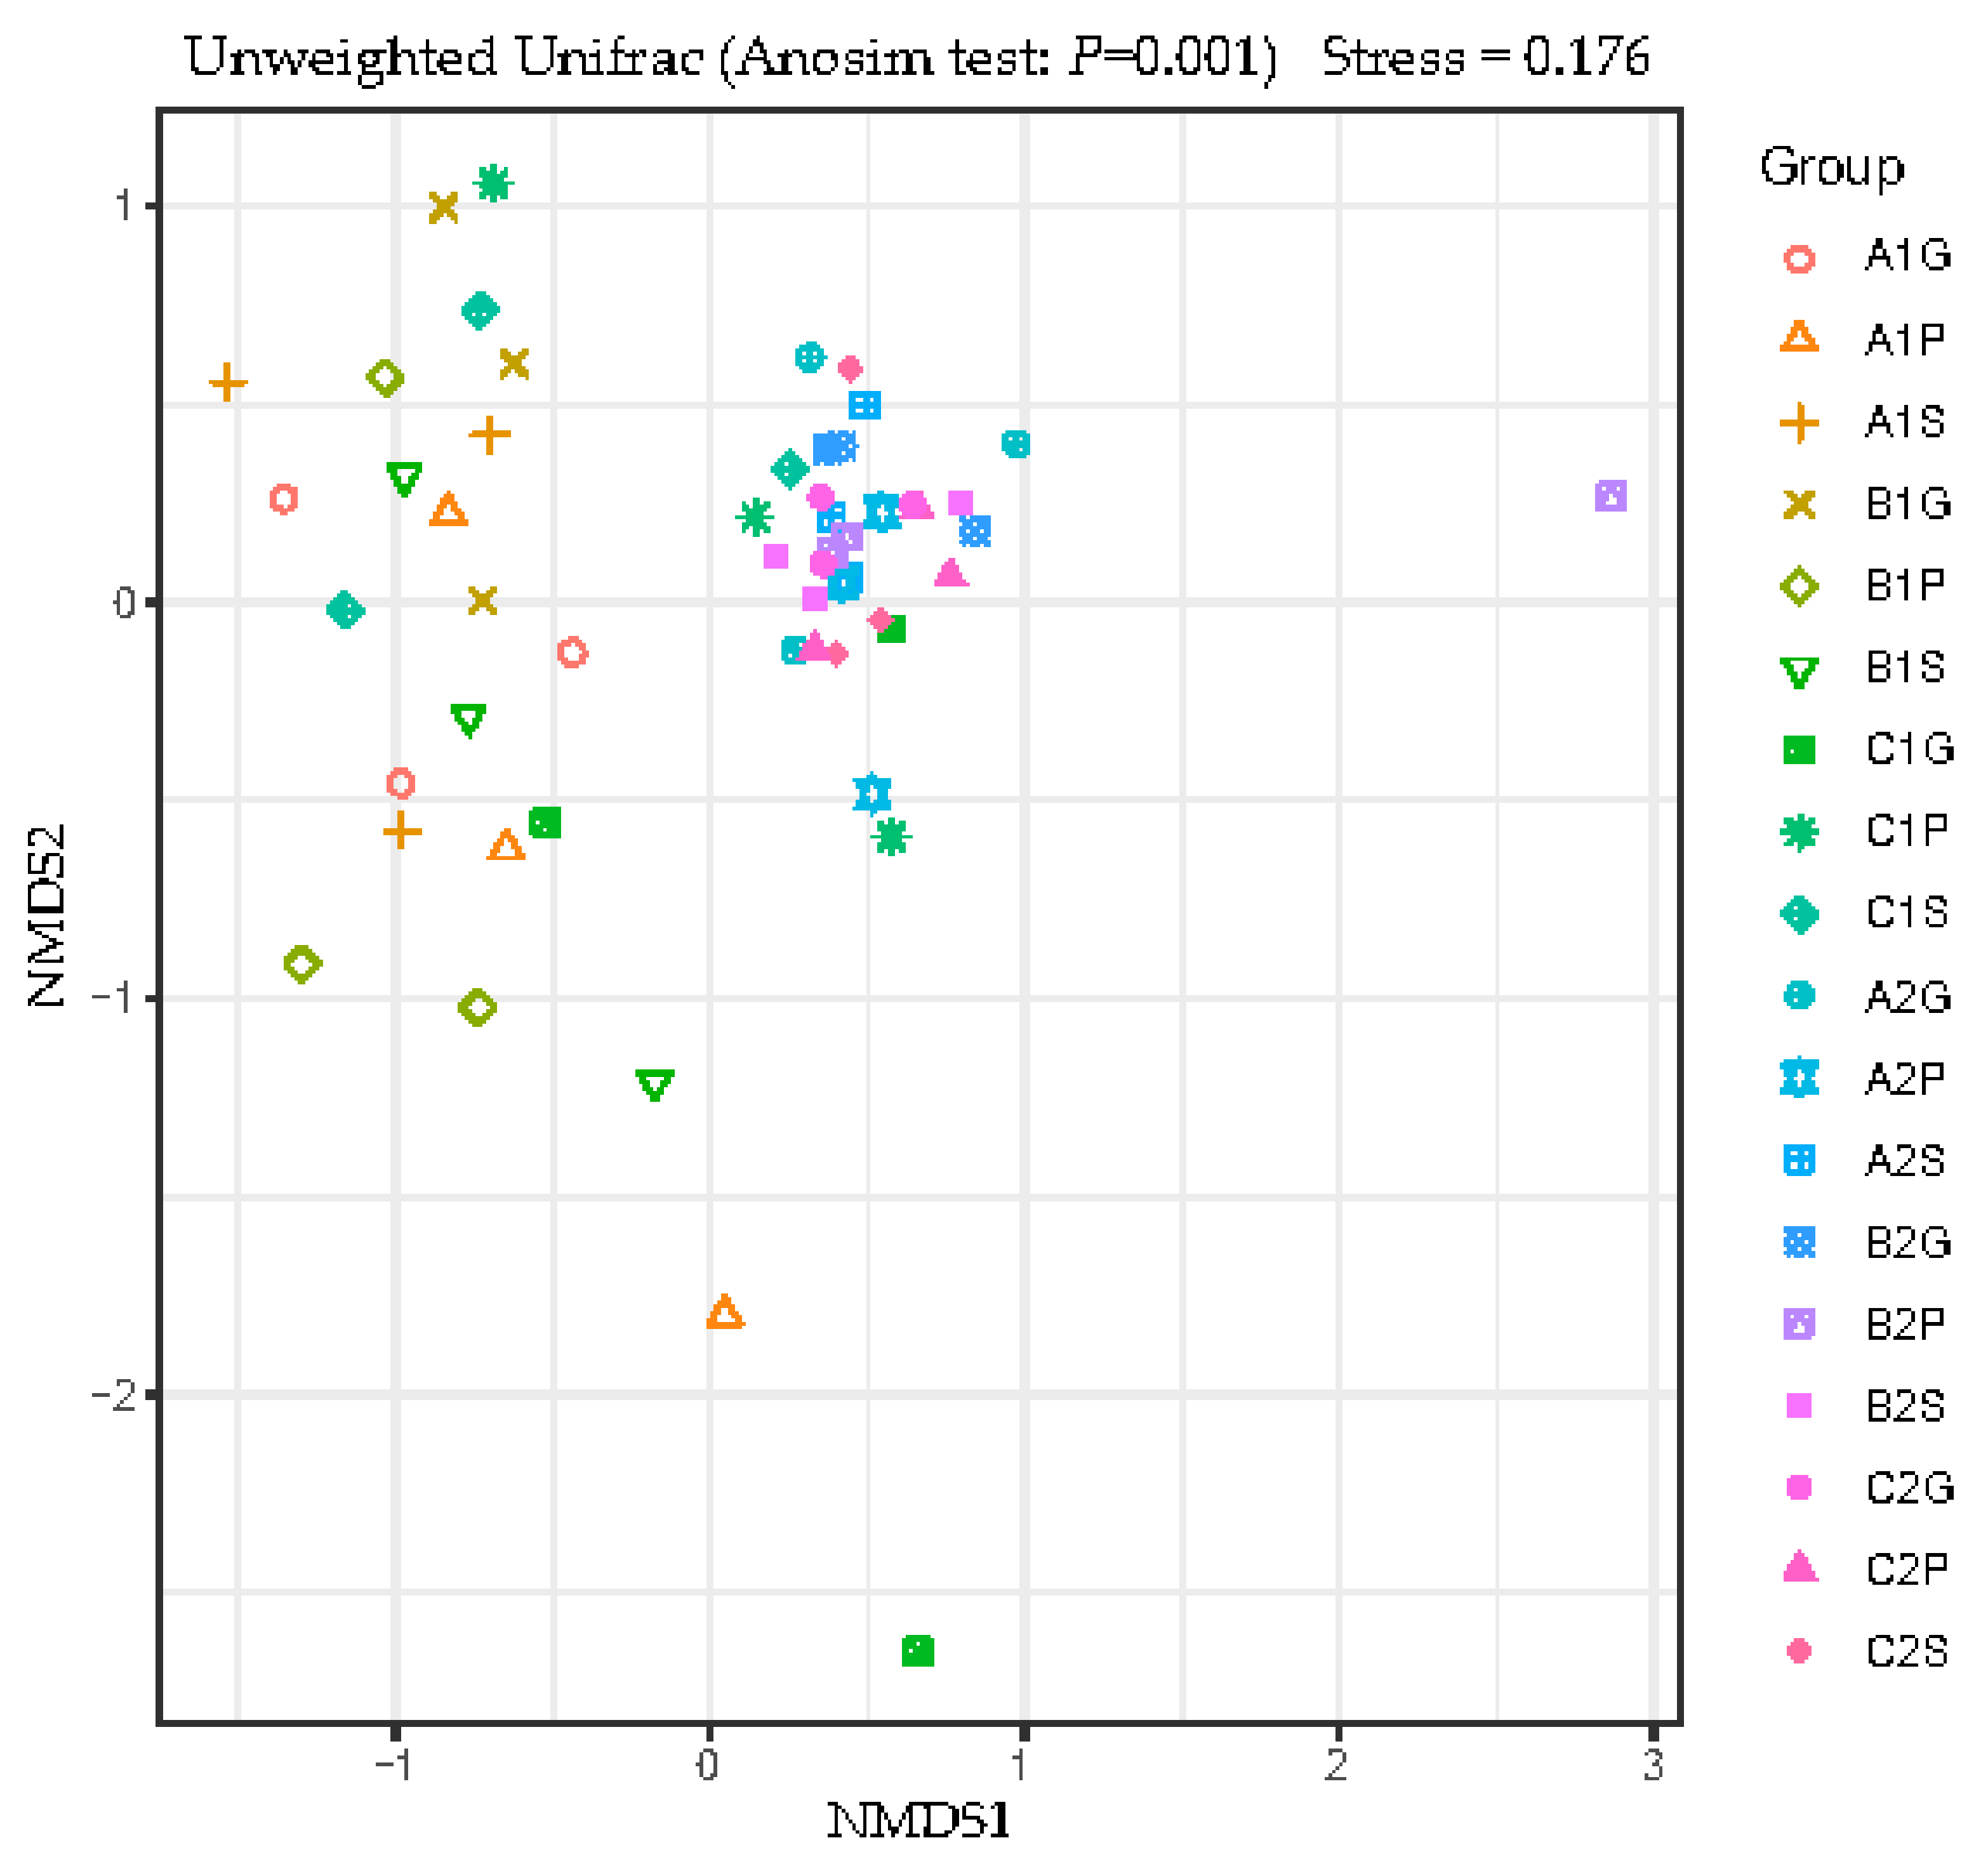
3.4. Beta Diversity Analysis

Nonmetric multidimensional scaling (NMDS) is a data analysis method that simplifies research objects (samples or variables) in a multi-dimensional space and low-dimensional space for positioning, analysis, and classification, while retaining the original relationship between objects. NMDS and ANOSIM analysis are two methods that can analyze the overall differences among different samples. The ANOSIM analyses performed in the study showed significant differences in the microbiota structure among the samples (p ≤ 0.05) (Figure 6), which indicates that the diversity of the gastrointestinal microbiota was obviously correlated with the stocking density, growth of the fishes, and different gastrointestinal tissues.
Based on the shared genera among the three parallel samples, it was found that the numbers of genera colonizing the stomach, pyloric caecum, and gut of the fishes farmed in the high-density group were all higher than those in the other two groups at the beginning of the study (Figure 7a). At the end of the study, except for the microbiota colonizing the gut, the numbers of genera colonizing the stomach and pyloric caecum of the fishes farmed in the high-density group were all higher than those in the medium- and low-density groups. Likewise, the numbers of shared genera among the three groups were 97–100 at the beginning of the study, while they were 128–137 at the end of the study (Figure 7b). With the growth of the fishes, the number of shared genera colonizing each gastrointestinal tract tissue increased by 24.29–32.84% in the low-density group, 26.94–44.78% in the medium-density group, and 21.62–41.67% in the high-density group at the end of the study. The numbers of shared genera in each tissue between the beginning and end of the study were 118–125 in the low-density group, 116–123 in the medium-density group, and 122–132 in the high-density group.

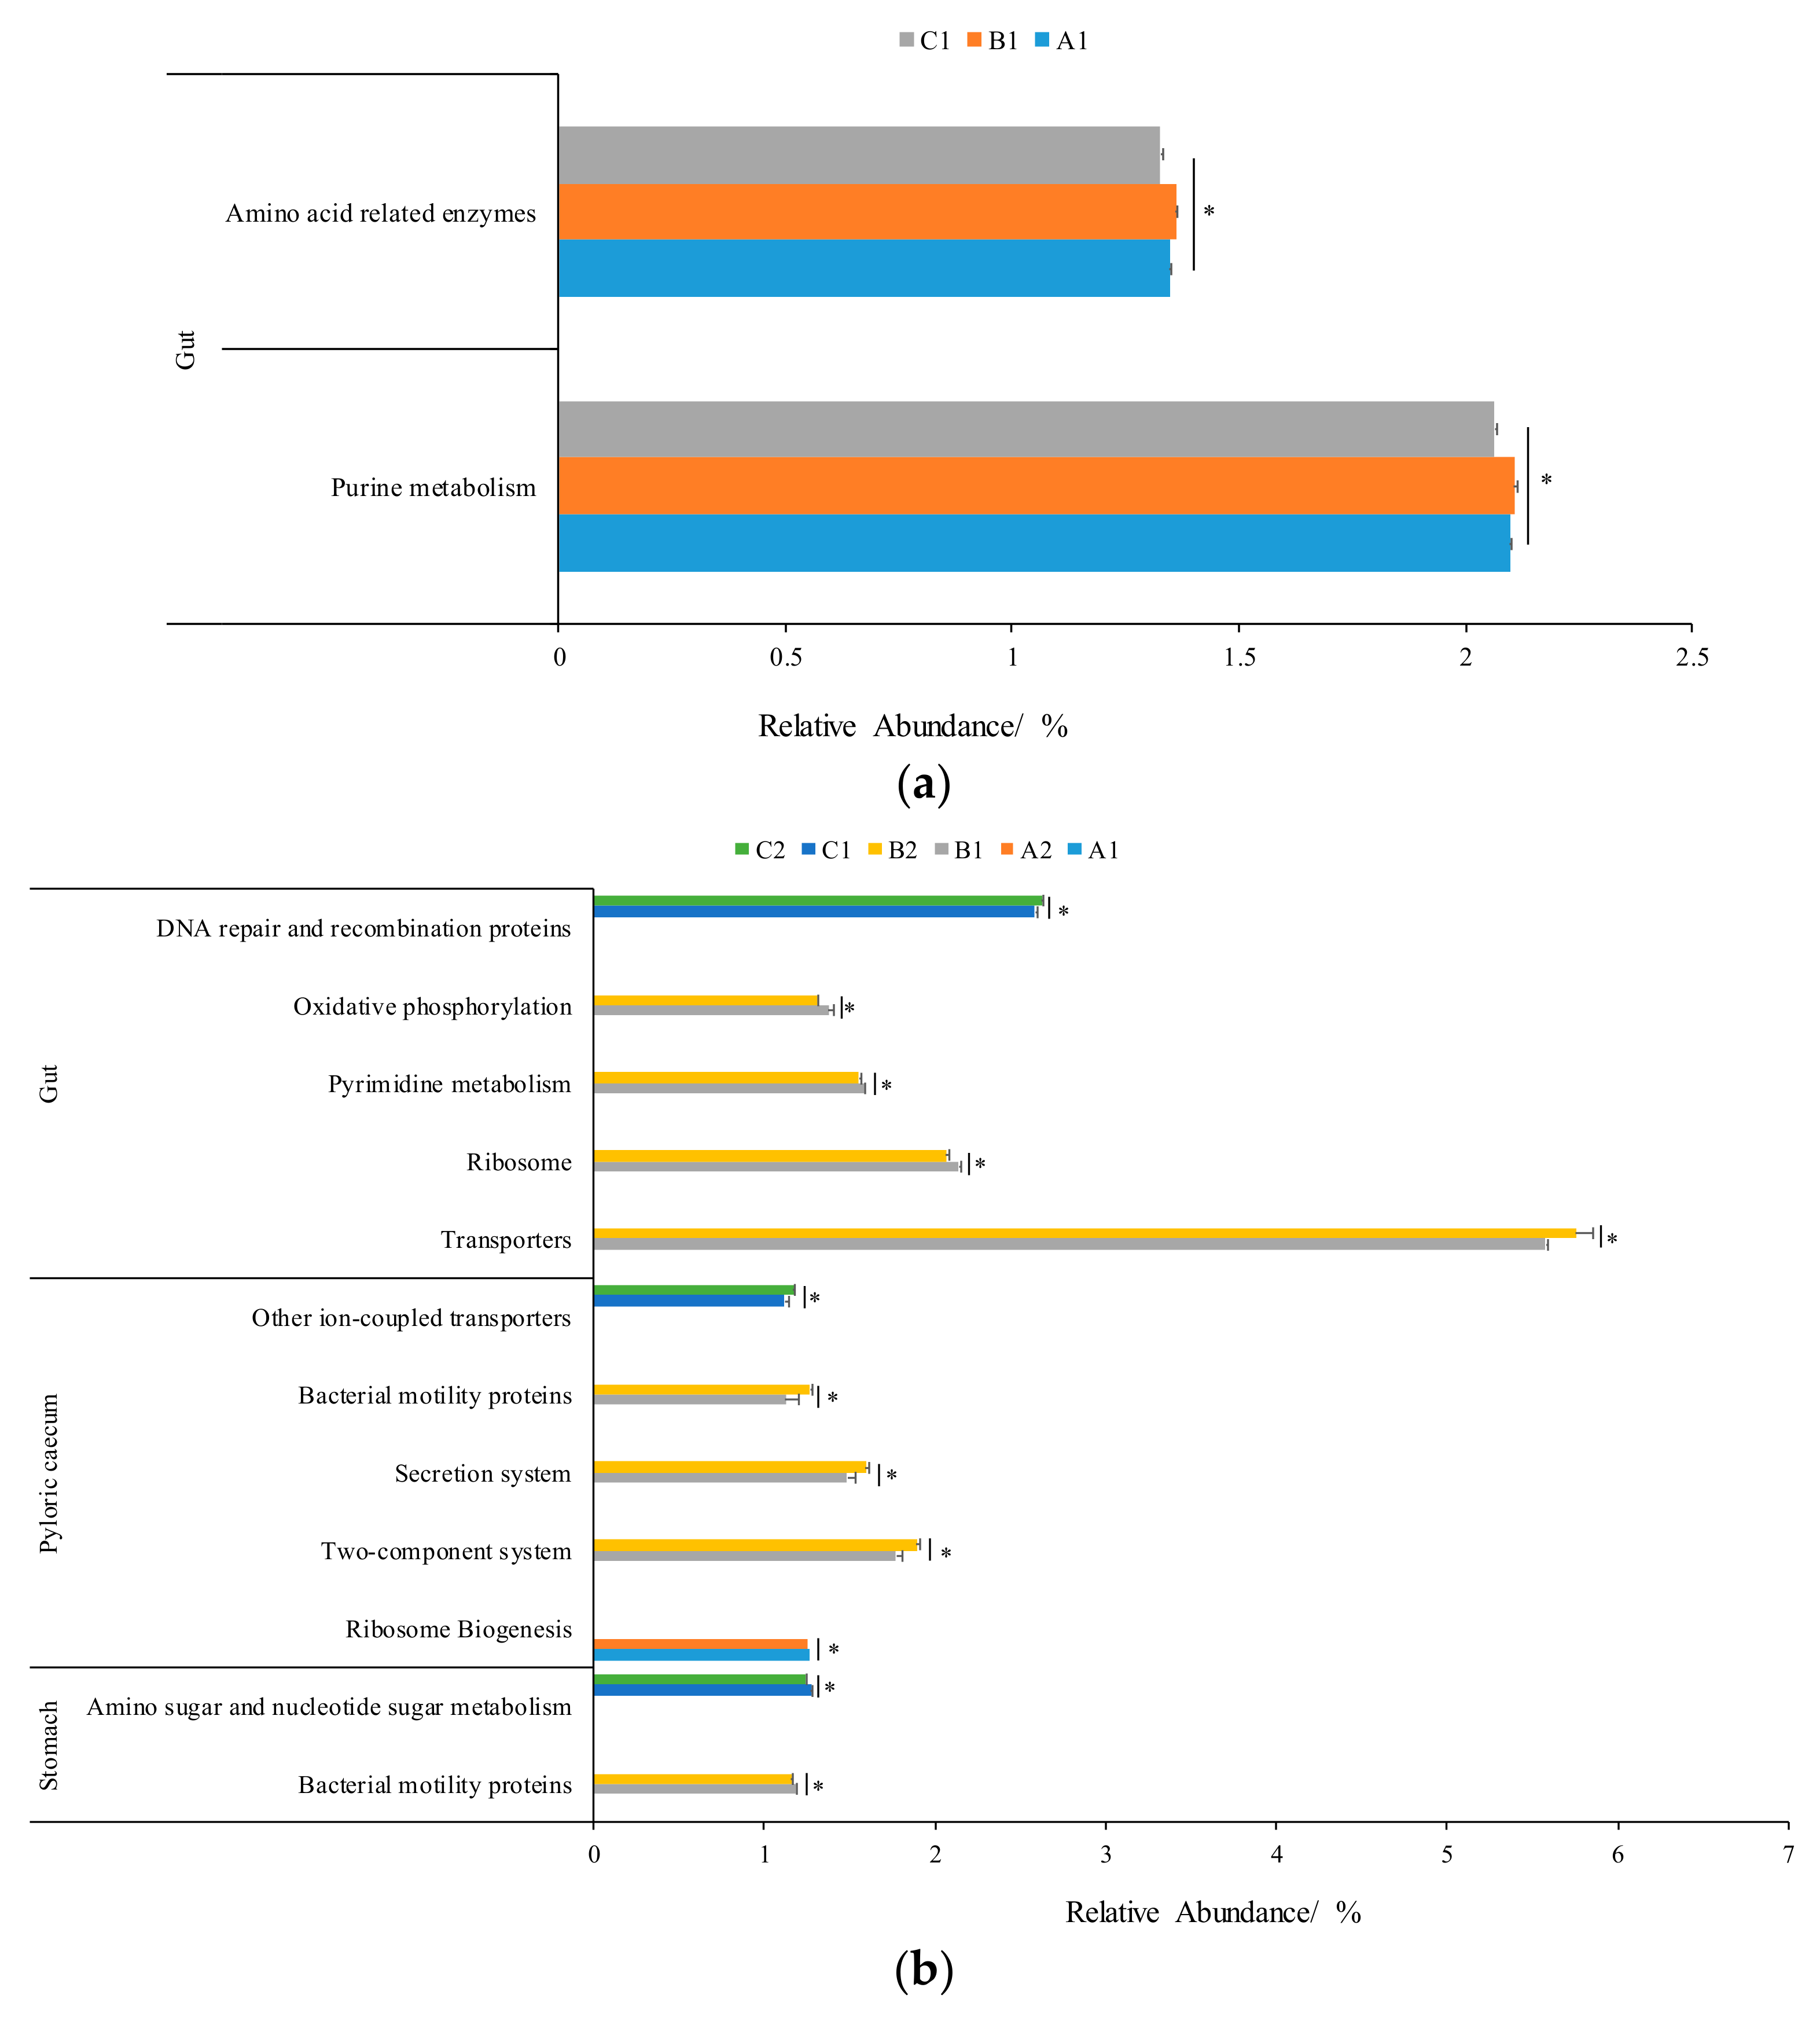
3.5. Functional Characteristics of Gastrointestinal Microbiota

Through the analysis of the KEEG pathway, it was found that metabolism, accounting for 48.97–49.87%, was the first dominant pathway at the first level (Figure S4). At the third level, transporters, ABC transporters, DNA repair and recombination proteins, ribosome, purine metabolism, the two-component system, peptidases, the secretion system, etc., were the dominant (top fifteen, according to the relative abundances of the three parallel samples for each gastrointestinal tissue in each treatment) pathways in all samples (Figure S5). At the beginning of the study, there were significant differences in the relative abundances of purine metabolism and amino acid-related enzymes pathways among the three groups in the gut (p ≤ 0.05) (Figure 8a). With the growth of the fishes, there were significant differences in the relative abundances of the ribosome biogenesis pathway in the pyloric caecum between the beginning and end of the study in the low-density group (p ≤ 0.05) (Figure 8b). In the medium-density group, there were significant differences in the relative abundances of the amino sugar and nucleotide sugar metabolism pathways in the stomach, other ion-coupled transporter pathways in the pyloric caecum, and the DNA repair and recombination protein pathways in the gut between the beginning and end of the study (p ≤ 0.05). In the high-density group, there were significant differences in the relative abundances of the bacterial motility protein pathways in the stomach; the two-component system, secretion system, and bacterial motility protein pathways in the pyloric caecum; and transporter, ribosome, pyrimidine metabolism, and oxidative phosphorylation pathways between the beginning and end of the study (p ≤ 0.05).

4. Discussion

A high stocking density decreased the growth performance, feed intake, and feed efficiency of gilthead sea bream (Sparus aurata) in comparison to lower density [25,26]. In this study, the higher stocking densities (medium and high densities) obviously decreased the growth performance (weight gain rate and specific growth rate) of artificially bred yellowtail kingfish, especially in the high-density group. Meantime, the serum cortisol content in the higher stocking density was significantly higher throughout the whole study. The serum cortisol content of yellowtail kingfish farmed in a higher density was significantly higher than that in the low-density group, indicating that the physiological stress was formed in the domestication period. The trends of the serum cortisol contents in the three stocking density groups were obviously different. These results illustrate that the high stocking density caused physiological stress to the yellowtail kingfish. Studies have reported that environmental factors, including stress, can significantly change the distribution and composition of intestinal microbiota [8,13,15]. Because of these, the Chao1 indices of microbiota in each gastrointestinal tissue of all the yellowtail kingfish at the end of the study were obviously higher than those at the beginning of the study, but there were no significant differences exclusively in the stomach and gut of the fishes farmed in the high-density group. These results are consistent with a recent study on the stocking density changing the diversity of gut microbiota [23]. Additionally, the numbers of shared genera in each gastrointestinal tissue at the end of the study in each density group were higher than those at the beginning of the study. Meanwhile, the number of shared genera in each gastrointestinal tissue among the three groups at the end of the study were obviously higher than those at the beginning of the study. This suggests that the stocking density could affect the diversity and richness of the species of gastrointestinal microbiota during the growth of yellowtail kingfish. The relative abundances of Firmicutes were all higher than those of Bacteroidetes, and the ratio of Firmicutes to Bacteroidetes in the stomach and pyloric caecum of the fishes farmed in the medium-density group was higher with respect to the other groups. Meanwhile, the condition factor of the yellowtail kingfish in the medium-density group was significantly higher than those in the other two density groups. In studies of obesity, the results have shown that the relative abundance of Firmicutes in obese individuals’ guts was greater than Bacteroidetes, which could make the gut more effective in accumulating energy from the diet, leading to obesity [27,28,29,30]. Nevertheless, the view that a high ratio of Firmicutes to Bacteroidetes is related to obesity has been challenged by partial studies [31,32,33]. Likewise, in this study, the difference in the ratio of Firmicutes to Bacteroidetes in the fish gut was not significant among the three groups at the end of the study. Moreover, the ratio of Firmicutes to Bacteroidetes decreased with the increase in the stocking density. This might be related to the setting of the research conditions, differences in the detection methods, the characteristics of the research object, etc. Thus, we speculated that the higher ratio of Firmicutes to Bacteroidetes in the medium-density group promoted the accumulation of energy from the diet, and the distribution of energy in the host body was affected by the main gastrointestinal microbiota. More energy was used in the increase of the condition factor, while less for growth in the medium-density group led to the higher condition factor for yellowtail kingfish. However, more and more energy was used to make up the effects of the high stocking density on the growth of the yellowtail kingfish farmed in the high-density group compared to the low-density group, although the growth performance was not better than that of the other two groups. Compared to the higher stocking density, the swimming space of the fish in the low-density group was relatively large, and the absorbed energy was mainly used for swimming and growth. It is indicated that the gastrointestinal microbiota were involved in the regulation of the growth and condition factors, helping the yellowtail kingfish better adapt to the high density living environment. However, the differences in the weight gain rate and specific growth rate were not significant among the three density groups. Moreover, further research is needed to confirm this hypothesis.
The dominant phyla with significant differences among the three density groups at the beginning of the study were different from those at the end of the study. This might be related to the growth of yellowtail kingfish, considering the composition of the dominant phyla with significant differences between the beginning and end of the study. At the genus level, Lactobacillus, Bacteroides, the genus represented by Ruminococcaceae_UCG, Bifidobacterium, Faecalibaculum, Sphingomonas, Prevotella, and the genus represented by MND1 were the dominant shared genera in the stomach. Lactobacillus, Bacteroides, the genus represented by Ruminococcaceae_UCG, Bifidobacterium, Faecalibaculum, and Sphingomonas were the dominant shared genera in pyloric caecum and gut of yellowtail kingfish, which suggested that these genera always colonize the gastrointestinal tract. Combined with the significantly different genera in the dominant genera, we classified Lactobacillus, Bacteroides, the genus represented by Ruminococcaceae_UCG, Bifidobacterium, Escherichia-Shigella, Prevotella, Faecalibaculum, Sphingomonas, Bacillus, the genus represented by MND1, Klebsiella, Dongia, Weissella, Lactococcus, Sutterella, and Blautia into the core microbiota according to the principles of dominance, commonality, and difference, which include two types of dominant genera (the dominant shared genera and the significantly different dominant genera). Lactobacillus, Lactococcus, Bifidobacterium, and Bacillus are generally potential probiotics in aquaculture, and reports have indicated that these potential probiotics increased the growth performance of the host [34,35,36,37,38]. Faecalibaculum might be helpful in the microbiota-modulating treatment of inflammatory bowel diseases [39]. Some strains belonging to Bacteroides could synthesize and secrete polysaccharide A with anti-inflammatory properties [40]. Sphingomonas sp. PDD-57b-25 and Acinetobacter towneri isolated from wastewater had higher ammonia nitrogen, nitrite nitrogen, nitrate nitrogen, and total phosphorus assimilation capacities [41]. Klebsiella pneumoniae belonging to Klebsiella can cause a wide range of infections, including pneumonias, urinary tract infections, bacteremias, and liver abscesses [42]. Some strains of Weissella have been used in probiotic yogurt to reduce aflatoxin poisoning and to produce bacteriocins [43,44,45]. There are no relative reports on Faecalibaculum, Sphingomonas, Klebsiella, Dongia, Weissella, etc., causing disease in aquaculture to date.
The relative abundance of Lactobacillus was relatively stable in all groups. There were no significant differences among the three density groups at the beginning and end of the study. Influenced by the growth of fishes, the relative abundances of genus represented by Ruminococcaceae_UCG, Bifidobacterium, and Dongia in the stomach, and Bifidobacterium and Klebsiella in the gut obviously decreased in the low-density group, but the relative abundances of Klebsiella in the stomach and Weissella in the pyloric caecum increased. In addition, the relative abundances of Bifidobacterium in the stomach, Escherichia-Shigella and Klebsiella in the pyloric caecum, and Bacteroides, Sutterella, and Bacillus in the gut increased in the medium-density group, and the relative abundance of Lactococcus in the stomach and Weissella in the pyloric caecum obviously decreased in the medium-density group. The relative abundances of Escherichia-Shigella and Dongia in the stomach; Escherichia-Shigella, Bacillus, and Weissella in the pyloric caecum; and Lactobacillus, Sphingomonas, the genus represented by MND1, and Blautia in the gut increased in the high-density group, and the genus represented by Ruminococcaceae_UCG and Prevotella in the pyloric caecum decreased. With the increase in density, the numbers of the dominant genera with significant differences in the gastrointestinal tract of the fishes increased, indicating that the effect of density was relatively obvious. Researchers have reported that stress, as well as temperature, rearing density, and nutrition, could change the composition of gut microbiota through systematic comparison [8,26,46,47]. These all indicate that the stocking density could affect the structure of microbiota in each gastrointestinal tissue with the growth of yellowtail kingfish in this study.
Most of the gastrointestinal microbiota mainly participated in the metabolism pathway to supply the energy for the yellowtail kingfish in this study, which might be related to the rapid growth and development of the fishes. The function of the gastrointestinal microbiota obviously changed with the change in structure. The main differences were reflected by the KEGG pathway. With the increase in the stocking density, the trends of the numbers of pathways with significant differences first increased and then increased. It is possible that the genera with significant differences caused the significant differences in these pathways.

5. Conclusions

In summary, the stocking density affected the physiology and growth performance and changed the diversity, compositions, and structures of microbiota colonizing the stomach, pyloric caecum, and gut during the growth process of artificially bred yellowtail kingfish. This indicates that the high stocking density caused stress to yellowtail kingfish. The changes in the ratio of Firmicutes to Bacteroidetes and core genera reflect that the gastrointestinal microbiota of the yellowtail kingfish might have assisted the host in better adapting to the higher stocking density by adjusting its own structure in a deep-sea net cage. Therefore, considering that there was no significant difference in the specific growth rate of the yellowtail kingfish among the three stocking densities, the medium density (8000 fishes/cage) is the appropriate stocking density for the deep-sea net cage farming of 1-year-old artificially bred yellowtail kingfish from the perspective of growth, physiology, and production practice.

Supplementary Materials

The following supporting information can be downloaded at: https://www.mdpi.com/article/10.3390/fishes7040154/s1, Figure S1: The sequencing data of all samples; Figure S2: The dominant colonizing phyla in yellowtail kingfish gastrointestinal tract; Figure S3: The dominant colonizing genera in yellowtail kingfish gastrointestinal tract; Figure S4: The dominant pathway at level 1 in each tissue of yellowtail kingfish; Figure S5: The dominant pathway at level 3 in each tissue of yellowtail kingfish.

Author Contributions

Conceptualization, Y.X. and Y.J.; methodology, Y.X. and Y.J.; validation, Y.X., X.L. and Y.J.; formal analysis, Y.J. and C.Y.; investigation, Y.J. and Y.X.; data curation, C.Y., A.C., B.W. and H.Z.; writing—original draft preparation, Y.J.; writing—review and editing, Y.J. and Y.X.; supervision, X.L.; funding acquisition, Y.X. All authors have read and agreed to the published version of the manuscript.

Funding

This research was funded by the National Key R&D Program of China (2019YFD0900901, 2018YFD0901204), the Central Public-interest Scientific Institution Basal Research Fund, CAFS (20603022021011, 2020TD47), and the China Agriculture Research System of MOF and MARA (CARS-47).

Institutional Review Board Statement

The animal study protocol was approved by the Institutional Animal Care and Use Committee of Yellow Sea Fisheries Research Institute, Chinese Academy of Fishery Sciences (Approval code: YSFRI-2022020, and date: 3 July 2019).

Data Availability Statement

The data of the present study are available from the authors upon reasonable request.

Acknowledgments

The authors would like to thank Dalian Fugu Fishery Co. Ltd. (Dalian, China) for providing deep-sea net cages for trial fish farming.

Conflicts of Interest

The authors declare no conflict of interest.

References

  1. Gillanders, B.M.; Ferrell, D.J.; Andrew, N.L. Aging methods for yellowtail kingfish (Seriola lalandi), and results from age- and size-based growth models. Fish. Bull. 1999, 97, 812–827. [Google Scholar]
  2. Swart, B.L.; Merwe, B.V.D.; Kerwath, S.E.; Roodt-Wilding, R. Phylogeography of the pelagic fish Seriola lalandi at different scales: Confirmation of inter-ocean population structure and evaluation of southern African genetic diversity. Afr. J. Mar. Sci. 2016, 38, 513–524. [Google Scholar] [CrossRef]
  3. Orellana, J.; Waller, U.; Wecker, B. Culture of yellowtail kingfish (Seriola lalandi) in a marine recirculating aquaculture system (RAS) with artificial seawater. Aquacult. Eng. 2014, 58, 20–28. [Google Scholar] [CrossRef]
  4. Sicuro, B.; Luzzana, U. The state of Seriola spp. other than yellowtail (S. quinqueradiata) farming in the world. Rev. Fish. Sci. Aquac. 2016, 24, 314–325. [Google Scholar] [CrossRef]
  5. Sanchis-Benlloch, P.J.; Nocillado, J.; Ladisa, C.; Aizen, J.; Miller, A.; Shpilman, M.; Levavi-Sivan, B.; Ventura, T.; Elizur, A. In-vitro and in-vivo biological activity of recombinant yellowtail kingfish (Seriola lalandi) follicle stimulating hormone. Gen. Comp. Endocr. 2017, 241, 41–49. [Google Scholar] [CrossRef]
  6. Li, X.; Yu, Y.; Feng, W.; Yan, Q.; Gong, Y. Host species as a strong determinant of the intestinal microbiota of fish larvae. J. Microbiol. 2012, 50, 29–37. [Google Scholar] [CrossRef]
  7. Nicholson, J.K.; Holmes, E.; Kinross, J.; Burcelin, R.; Gibson, G.; Jia, W.; Pettersson, S. Host-gut microbiota metabolic interactions. Science 2012, 336, 1262–1267. [Google Scholar] [CrossRef] [Green Version]
  8. Banerjee, G.; Ray, A.K. Bacterial symbiosis in the fish gut and its role in health and metabolism. Symbiosis 2017, 72, 1–11. [Google Scholar] [CrossRef]
  9. Dwivedi, M.; Ansarullah; Radichev, I.; Kemp, E.H. Alteration of immune-mechanisms by human microbiota and development and prevention of human diseases. J. Immunol. Res. 2017, 2017, 6985256. [Google Scholar] [CrossRef] [Green Version]
  10. Walburn, J.W.; Wemheuer, B.; Thomas, T.; Copeland, E.; O’Connor, W.; Booth, M.; Fielder, S.; Egan, S. Diet and diet-associated bacteria shape early microbiome development in Yellowtail Kingfish (Seriola lalandi). Microb. Biotechnol. 2019, 12, 275–288. [Google Scholar] [CrossRef] [Green Version]
  11. Jiang, Y.; Wang, Y.; Zhang, Z.; Liao, M.; Li, B.; Rong, X.; Chen, G. Responses of microbial community structure in turbot (Scophthalmus maximus) larval intestine to the regulation of probiotic introduced through live feed. PLoS ONE 2019, 14, e0216590. [Google Scholar] [CrossRef] [PubMed]
  12. Jiang, Y.; Liu, X.; Xu, Y.; Shi, B.; Wang, B. Microbiota characteristics in Sebastes schlegelii intestine in early life stages. J. Oceanol. Limnol. 2020, 38, 275–287. [Google Scholar] [CrossRef]
  13. Horlick, J.; Booth, M.A.; Tetu, S.G. Alternative dietary protein and water temperature influence the skin and gut microbial communities of yellowtail kingfish (Seriola lalandi). PeerJ 2020, 8, e8705. [Google Scholar] [CrossRef] [Green Version]
  14. Shabat, S.K.B.; Sasson, G.; Doron-faigenboim, A.; Durman, T.; Yaacoby, S.; Miller, M.E.B.; White, B.A.; Shterzer, N.; Mizrahi, I. Specific microbiome-dependent mechanisms underlie the energy harvest efficiency of ruminants. ISME J. 2016, 10, 2958–2972. [Google Scholar] [CrossRef] [Green Version]
  15. Zhang, Z.; Xu, D.; Wang, L.; Hao, J.; Wang, J.; Zhou, X.; Wang, W.; Qiu, Q.; Huang, X.; Zhou, J.; et al. Convergent evolution of rumen microbiomes in high-altitude mammals. Curr. Biol. 2016, 26, 1873–1879. [Google Scholar] [CrossRef] [PubMed] [Green Version]
  16. Legrand, T.P.R.A.; Catalano, S.R.; Wos-Oxley, M.L.; Stephens, F.; Landos, M.; Bansemer, M.S.; Stone, D.A.J.; Qin, J.G.; Oxley, A.P.A. The Inner Workings of the Outer Surface: Skin and Gill Microbiota as Indicators of Changing Gut Health in Yellowtail Kingfish. Front. Microbiol. 2018, 8, 2664. [Google Scholar] [CrossRef] [PubMed]
  17. Ramírez, C.; Rojas, R.; Romero, J. Partial evaluation of autochthonous probiotic potential of the gut microbiota of Seriola lalandi. Probiotics Antimicro. 2020, 12, 672–682. [Google Scholar] [CrossRef]
  18. Ramírez, C.; Romero, J. The Microbiome of Seriola lalandi of Wild and Aquaculture Origin Reveals Differences in Composition and Potential Function. Front. Microbiol. 2017, 8, 1844. [Google Scholar] [CrossRef] [Green Version]
  19. Bolger, A.M.; Lohse, M.; Usadel, B. Trimmomatic: A flexible trimmer for Illumina sequence data. Bioinformatics 2014, 30, 2114–2120. [Google Scholar] [CrossRef] [Green Version]
  20. Reyon, D.; Tsai, S.Q.; Khayter, C.; Foden, J.A.; Sander, J.D.; Joung, J.K. FLASH assembly of TALENs for high-throughput genome editing. Nat. Biotechnol. 2012, 30, 460–465. [Google Scholar] [CrossRef]
  21. Caporaso, J.G.; Kuczynski, J.; Stombaugh, J.; Bittinger, K.; Bushman, F.D.; Costello, E.K.; Fierer, N.; Peña, A.G.; Goodrich, J.K.; Gordon, J.I.; et al. QIIME allows analysis of high-throughput community sequencing data. Nat. Methods 2010, 7, 335–336. [Google Scholar] [CrossRef] [PubMed] [Green Version]
  22. Rognes, T.; Flouri, T.; Nichols, B.; Quince, C.; Mahé, F. VSEARCH: A versatile open source tool for metagenomics. PeerJ 2016, 4, e2584. [Google Scholar] [CrossRef] [PubMed]
  23. Edgar, R.C. UPARSE: Highly accurate OTU sequences from microbial amplicon reads. Nat. Methods 2013, 10, 996–998. [Google Scholar] [CrossRef] [PubMed]
  24. Quast, C.; Pruesse, E.; Yilmaz, P.; Gerken, J.; Schweer, T.; Yarza, P.; Peplies, J.; Glöckner, F.O. The SILVA ribosomal RNA gene database project: Improved data processing and web-based tools. Nucleic Acids Res. 2013, 41, D590–D596. [Google Scholar] [CrossRef] [PubMed]
  25. Diógenes, A.F.; Teixeira, C.; Almeida, E.; Skrzynska, A.; Costas, B.; Oliva-Teles, A.; Peres, H. Effects of dietary tryptophan and chronic stress in gilthead seabream (Sparus aurata) juveniles fed corn distillers dried grains with solubles (DDGS) based diets. Aquaculture 2019, 498, 396–404. [Google Scholar] [CrossRef]
  26. Parma, L.; Pelusio, N.F.; Gisbert, E.; Esteban, M.A.; D’Amico, F.; Soverini, M.; Candela, M.; Dondi, F.; Gatta, P.P.; Bonaldo, A. Effects of rearing density on growth, digestive conditions, welfare indicators and gut bacterial community of gilthead sea bream (Sparus aurata, L. 1758) fed different fishmeal and fish oil dietary levels. Aquaculture 2020, 518, 734854. [Google Scholar] [CrossRef]
  27. Ruth, L.E.; Fredrik, B.; Peter, T.; Lozupone, C.A.; Knight, R.D.; Gordon, J.I. Obesity alters gut microbial ecology. Proc. Natl. Acad. Sci. USA 2005, 102, 11070–11075. [Google Scholar] [CrossRef] [Green Version]
  28. Ley, R.E.; Turnbaugh, P.J.; Klein, S.; Gordon, J.I. Microbial ecology: Human gut microbes associated with obesity. Nature 2006, 444, 1022–1023. [Google Scholar] [CrossRef]
  29. Turnbaugh, P.J.; Ley, R.E.; Mahowald, M.A.; Magrini, V.; Mardis, E.R.; Gordon, J.I. An obesity-associated gut microbiome with increased capacity for energy harvest. Nature 2006, 44, 1027–1031. [Google Scholar] [CrossRef]
  30. Cox, A.J.; West, N.P.; Cripps, A.W. Obesity, inflammation, and the gut microbiota. Lancet Diabetes End. 2015, 3, 207–215. [Google Scholar] [CrossRef]
  31. Duncan, S.H.; Lobley, G.E.; Holtrop, G.; Ince, J.; Johnstone, A.M.; Louis, P.; Flint, H.J. Human colonic microbiota associated with diet, obesity and weight loss. Int. J. Obesity 2008, 32, 1720–1724. [Google Scholar] [CrossRef] [PubMed] [Green Version]
  32. Schwiertz, A.; Taras, D.; Schfer, K.; Beijer, S.; Bos, N.A.; Donus, C.; Hardt, P.D. Microbiota and SCFA in lean and overweight healthy subjects. Obesity 2010, 18, 190–195. [Google Scholar] [CrossRef] [PubMed]
  33. Liu, R.; Hong, J.; Xu, X.; Feng, Q.; Zhang, D.; Gu, Y.; Shi, J.; Zhao, X.; Liu, W.; Wang, X.; et al. Gut microbiome and serum metabolome alterations in obesity and after weight-loss intervention. Nat. Med. 2017, 23, 859–868. [Google Scholar] [CrossRef]
  34. Sanders, M.E.; Morelli, L.; Tompkins, T.A. Sporeformers as Human Probiotics: Bacillus, Sporolactobacillus, and Brevibacillus. Compr. Rev. Food Sci. Food Saf. 2003, 2, 101–110. [Google Scholar] [CrossRef] [PubMed]
  35. Adineh, H.; Jafaryan, H.; Sahandi, J.; Alizadeh, M. Effect of Bacillus spp. probiotic on growth and feeding performance of rainbow trout (Oncorhynchus mykiss) larvae. Bulg. J. Vet. Med. 2013, 16, 29–36. [Google Scholar]
  36. Hassani, M.H.S.; Jourdehi, A.Y.; Zelti, A.H.; Masouleh, A.S.; Lakani, F.B. Effects of commercial superzist probiotic on growth performance and hematological and immune indices in fingerlings Acipenser Baerii. Aquacult. Int. 2020, 28, 377–387. [Google Scholar] [CrossRef]
  37. Chen, Y.; Meenu, M.; Xu, B. A Narrative Review on Microencapsulation of Obligate Anaerobe Probiotics Bifidobacterium, Akkermansia muciniphila, and Faecalibacterium prausnitzii. Food Rev. Int. 2021, 1–30. [Google Scholar] [CrossRef]
  38. Cano-Lozano, J.A.; Diaz, L.M.V.; Bolivar, J.F.M.; Hume, M.E.; Pardo, Y.R. Probiotics in tilapia (Oreochromis niloticus) culture: Potential probiotic Lactococcus lactis culture conditions. J. Biosci. Bioeng. 2021, 133, 187–194. [Google Scholar] [CrossRef]
  39. Yaghoubfar, R.; Behrouzi, A.; Fateh, A.; Nojoumi, S.A.; Vaziri, F.; Khatami, S.; Siadat, S.D. Effects of Akkermansia muciniphila and Faecalibacterium prausnitzii on serotonin transporter expression in intestinal epithelial cells. J. Diabetes Metab. Disord. 2021, 20, 1–5. [Google Scholar] [CrossRef]
  40. Hiippala, K.; Kainulainen, V.; Suutarinen, M.; Heini, T.; Bowers, J.R.; Jasso-Selles, D.; Lemmer, D.; Valentine, M.; Barnes, R.; Engelthaler, D.M.; et al. Isolation of Anti-Inflammatory and EpitheliumReinforcing Bacteroides and Parabacteroides Spp. from A Healthy Fecal Donor. Nutrients 2020, 12, 935. [Google Scholar] [CrossRef] [Green Version]
  41. Shao, Y.; Zhong, H.; Mao, X.; Zhang, H. Biochar-immobilized Sphingomonas sp. and Acinetobacter sp. isolates to enhance nutrient removal: Potential application in crab aquaculture. Aquacult. Environ. Interac. 2020, 12, 251–262. [Google Scholar] [CrossRef]
  42. Paczosa, M.K.; Mecsas, J. Klebsiella pneumoniae: Going on the Offense with a Strong Defense. Microbiol. Mol. Biol. Rev. 2016, 80, 629–661. [Google Scholar] [CrossRef] [PubMed] [Green Version]
  43. Srionnual, S.; Yanagida, F.; Lin, L.H.; Hsiao, K.N.; Chen, Y.S. Weissellicin 110, a newly discovered bacteriocin from Weissella cibaria 110, isolated from plaa-som, a fermented fish product from Thailand. Appl. Environ. Microb. 2007, 73, 2247–2250. [Google Scholar] [CrossRef] [PubMed] [Green Version]
  44. Masuda, Y.; Zendo, T.; Sawa, N.; Perez, R.H.; Nakayama, J.; Sonomoto, K. Characterization and identification of weissellicin Y and weissellicin M, novel bacteriocins produced by Weissella hellenica QU 13. J. Appl. Microbiol. 2011, 112, 99–108. [Google Scholar] [CrossRef] [PubMed]
  45. Nduti, N.; McMillan, A.; Seney, S.; Sumarah, M.; Njeru, P.; Mwaniki, M.; Reid, G. Investigating probiotic yoghurt to reduce an aflatoxin B1 biomarker among school children in eastern Kenya: Preliminary study. Int. Dairy J. 2016, 63, 124–129. [Google Scholar] [CrossRef]
  46. Sullam, K.E.; Essinger, S.D.; Lozupone, C.A.; O’Connor, M.P.; Rosen, G.L.; Knight, R.; Kilham, S.S.; Russell, J.A. Environmental and ecological factors that shape the gut bacterial communities of fish: A meta-analysis. Mol. Ecol. 2012, 21, 3363–3378. [Google Scholar] [CrossRef] [Green Version]
  47. Kelly, P. Nutrition, intestinal defence and the microbiome. Proc. Nutr. Soc. 2010, 69, 261–268. [Google Scholar] [CrossRef] [Green Version]
Figure 1. Serum cortisol content of yellowtail kingfish farmed in different densities during the whole study. Notes: A represents the low-density group, B represents the medium-density group, C represents the high-density group. Different lowercase letters indicate significant differences among the three different density groups at each sampling time (p ≤ 0.05).
Fishes 07 00154 g001
Figure 2. Chao1 indices of microbiota in yellowtail kingfish gastrointestinal tracts. Notes: (a) at the beginning of the study; (b) at the end of the study; (c) the analysis of the Chao1 indices of gastrointestinal microbiota between the beginning and end of the study. A1, B1, and C1 represent the low-, medium-, and high-density groups at the beginning of the study, while A2, B2, and C2 represent the low-, medium-, and high-density groups at the end of the study. * represents the significant differences in each density group between the beginning and end of the study (p ≤ 0.05).
Fishes 07 00154 g002
Figure 3. The dominant (top ten, according to the average relative abundances of the three parallel samples for each gastrointestinal tissue in each treatment) phyla with significant differences in the gastrointestinal tracts of yellowtail kingfish. Notes: (a) among the three different density groups at the beginning and end of the study; (b) between the beginning and end of the study for the low-density group; (c) between the beginning and end of the study for the medium-density group; (d) between the beginning and end of the study for the high-density group. A1, B1, and C1 represent the low-, medium-, and high-density groups at the beginning of the study, while A2, B2, and C2 represent the low-, medium-, and high-density group at the end of the study. * represents significant differences for the same phylum between the beginning and end of the study in each density group (p ≤ 0.05).
Fishes 07 00154 g003aFishes 07 00154 g003bFishes 07 00154 g003c
Figure 4. The ratio of Firmicutes to Bacteroidetes in the gastrointestinal tract of yellowtail kingfish. Notes: A2, B2, and C2 represent the low-, medium-, and high-density groups at the end of the study.
Fishes 07 00154 g004
Figure 5. The dominant genera with significant differences in the gastrointestinal tract of yellowtail kingfish. Notes: (a) between the beginning and end of the study for the low-density group; (b) between the beginning and end of the study for the medium-density group; (c) between the beginning and end of the study for the high-density group. A1, B1, and C1 represent the low-, medium-, and high-density groups at the beginning of the study, while A2, B2, and C2 represent the low-, medium-, and high-density group at the end of the study. * represents the significant differences between the beginning and end of the study in each density group (p ≤ 0.05).
Fishes 07 00154 g005
Figure 6. The nonmetric multidimensional scaling (NMDS) analysis. Notes: A1S, B1S, and C1S represent the stomach samples in the low-, medium-, and high-density groups at the beginning of the study, while A1P, B1P, and C1P represent the pyloric caecum samples in the low-, medium-, and high-density groups at the beginning of the study, and A1G, B1G, and C1G represent the gut samples in the low-, medium-, and high-density groups at the beginning of the study, respectively. Likewise, A2S, B2S, C2S, A2P, B2P, C2P, A2G, B2G, and C2G represent the stomach, pyloric caecum, and gut samples in the low-, medium-, and high-density groups at the end of the study, respectively.
Fishes 07 00154 g006
Figure 7. The shared genera of each tissue of yellowtail kingfish. Notes: (a) among the three parallel groups of each density group; (b) among three different density groups at the beginning or end of the study, and between the beginning and end of the study for each density group. A1, B1, and C1 represent the low-, medium-, and high-density groups at the beginning of the study, while A2, B2, and C2 represent the low-, medium-, and high-density groups at the end of the study.
Fishes 07 00154 g007
Figure 8. The dominant (top fifteen, according to the relative abundances) KEGG pathways with significant differences in the gastrointestinal microbiota. Notes: (a) among the three different density groups at the beginning or end of the study; (b) between the beginning and end of the study for each density group. A1, B1, and C1 represent the low-, medium-, and high-density groups at the beginning of the study, while A2, B2, and C2 represent the low-, medium-, and high-density groups at the end of the study. * represents the significant differences between the beginning and end of the study in each density group (p ≤ 0.05).
Fishes 07 00154 g008
Table 1. The growth indicators of yellowtail kingfish under different densities.
GroupsInitial Body Weight/gFinal Body Weight/gCondition Factor/(g/cm3)Weight Gain Rate/%Specific Growth Rate/(%/Day)
Low-density group1033.3 ± 84.132104.3 ± 23.57 a1.7 ± 0.04 b106.8 ± 19.230.8 ± 0.10
Medium-density group1133.3 ± 34.202164.7 ± 24.22 a1.98 ± 0.10 a91.4 ± 7.040.7 ± 0.04
High-density group963.7 ± 43.191813.0 ± 18.77 b1.8 ± 0.07 b88.9 ± 8.890.7 ± 0.05
Notes: The superscripts of different lowercase letters in the same column indicate that the values were significantly different among different density groups (p ≤ 0.05).
Publisher’s Note: MDPI stays neutral with regard to jurisdictional claims in published maps and institutional affiliations.

