Article

Incorporation of Fructooligosaccharides in Diets Influence Growth Performance, Digestive Enzyme Activity, and Expression of Intestinal Barrier Function Genes in Tropical Gar (Atractosteus tropicus) Larvae

1
Laboratorio de Fisiología en Recursos Acuáticos, División Académica de Ciencias Biológicas (DACBiol), Universidad Juárez Autónoma de Tabasco (UJAT), Villahermosa 86150, Mexico
2
Cátedra Consejo Nacional de Ciencia y Tecnología, Ciudad de México 03940, Mexico
3
Laboratorio de Biología Molecular, División Académica Multidisciplinaria de Jalpa de Méndez (DAMJ), Universidad Juárez Autónoma de Tabasco (UJAT), Jalpa de Méndez 86205, Mexico
4
Laboratorio de Microbiología Aplicada, División Académica de Ciencias Biológicas (DACBiol), Universidad Juárez Autónoma de Tabasco (UJAT), Villahermosa 86150, Mexico
5
Laboratorio de Fisiología Comparada y Genómica Funcional, Centro de Investigaciones Biológicas del Noroeste, La Paz 23096, Mexico
6
Facultad de Ciencias Marinas, Universidad Autónoma de Baja California (UABC), Ensenada 21100, Mexico
*
Authors to whom correspondence should be addressed.
These authors contributed equally to this work.
Fishes 2022, 7(3), 137; https://doi.org/10.3390/fishes7030137
Submission received: 22 April 2022 / Revised: 6 June 2022 / Accepted: 8 June 2022 / Published: 10 June 2022
(This article belongs to the Special Issue Gut Microbiota in Fish and Shellfish)

Abstract

:
This study was conducted to investigate the effects of dietary fructooligosaccharides (FOS) on the growth, survival rate, digestive enzyms activity, and the expression of intestinal barrier function genes in tropical gar (Atractosteus tropicus) larvae. A total of 960 larvae (0.030 ± 0.006 g) were fed three diets supplemented with increasing FOS concentrations (2.5, 5, and 7.5 g kg−1) and a control diet for 15 days. Results revealed that a 7.5 g kg−1 FOS supplementation improved weight gain, specific growth rate, and survival rate (p < 0.05). Furthermore, 5 g kg−1 FOS supplementation increased alkaline protease and amylase activities and induced an upregulation of the claudin-17 gene expression (p < 0.05). Meanwhile, the inclusion of 7.5 g kg−1 FOS induced the upregulation of mucin 2 (muc-2), and the tight junction genes zo-2 and claudin-3 (p < 0.05). In addition, 2.5, 5, and 7.5 g kg−1 FOS promoted the downregulation of the claudin-15 gene expression (p < 0.05). At the same time, FOS inclusion did not increase the pro-inflammatory cytokine il-8 expression. We can conclude that 7.5 g kg−1 FOS supplementation improves growth performance, survival rate, and digestive capacity, and could contribute to the reinforcement of the intestinal barrier function of Tropical gar larvae.

1. Introduction

The ancestral fish Atractosteus tropicus, known as tropical gar, is a carnivorous species from Mexico and Central America. The demand for this freshwater fish is high, and its biological and ecological role in the region justifies its culture [1]. In recent years, this species’ aquaculture efforts have focused on exploring new feeding strategies to maximize their survival rate, growth, intake, and efficiency of feed in the larval stage [2,3]. However, the percentage of mortality in the larval stage is still very high due to cannibalism and the weaning process. Additionally, a problem to consider during its culture is the appearance of diseases. Disease development is usually controlled through the widespread use of antibiotics, which unfortunately leads to resistant pathogens and reduces the beneficial microbiota in the fish gastrointestinal system. Therefore, the use of dietary supplements such as probiotics that can favor the larval stage of this species is essential. The use of prebiotics in aquaculture can enhance fish resistance against diseases and promote the health status of the organisms [4]; it can also improve growth and decrease mortality. However, the effect of prebiotics on growth, feed utilization, and health may vary results will depend on feeding strategies, supplement dose, type of prebiotics, fish species, and their gut microbiota [5]. Prebiotics are non-digestible ingredients that beneficially affect the host by stimulating the growth of beneficial resident gut bacteria and improving host health [6]. Inulin, galactooligosaccharides (GOS), mannan-oligosaccharides (MOS), short-chain fructooligosaccharides (scFOS), and fructooligosaccharides (FOS) are the most used prebiotics in aquaculture [7]. FOS are a type of dietary fiber composed of short chains of fructose with β (2-1) glycosidic bonds, synthesized by the hydrolytic activity of fructofuranosidases [8]. Recent studies have reported that the use of FOS show a positive effect on growth, survival rate, and activity of digestive enzymes in several species, such as rainbow trout (Oncorhynchus mykiss) [9], Caspian roach fry (Rutilus rutilus) [10], blunt snout bream fingerlings (Megalobrama amblycephala) [11], starry sturgeon (Acipenser stellatus) [12], among others. In A. tropicus juveniles, 5–10 g kg−1 FOS inclusion improved the digestive capacity, growth, and survival [13]. However, the effect of FOS inclusion in the larval stage and on the intestinal barrier function has not been described. In fishes, the intestinal barrier forms a physical and immunological barrier that blocks the translocation of potentially harmful antigens, toxins, pathogens and prevents the infection and development of inflammatory bowel diseases [14,15]. This barrier comprises a) a mucus layer, b) an epithelial cell monolayer, and c) immune cells. This study focused on the mucin layer and the tight junctions complex, the structure connection between epithelial cells that comprise a series of proteins such as zonula occludens (ZO) and various claudin subtypes. The tight junctions regulate paracellular permeability and promote a selective barrier [16]. This study was carried out to determine the effects of dietary FOS on growth, survival rate, digestive enzymes activity, and expression of intestinal barrier genes in A. tropicus larvae to provide a partial reference to formulate a commercial feed for healthy breeding of this species.

2. Materials and Methods

2.1. Larviculture

The larvae used in this study were produced in the Laboratory of Physiology in Aquatic Resources (LAFIRA), División Académica de Ciencias Biológicas (DACBIOL) of the Universidad Juárez Autónoma de Tabasco (UJAT). A female of 3.5 kg was induced with a GnRH synthetic hormonal analog (Sanfer Salud Animal, Ciudad de México, México) (35 µg kg−1 of fish) and placed in a 2000 L circular tank with three males of 1.5 kg average weight. After spawning, the female and male were removed to keep eggs incubating to hatching. The larvae (4 days after hatching (DAH)) were placed in 70 L experimental tanks with a recirculation system operated by a 0.5 HP-water pump (Jacuzzi, JWPA5D-230A, Delavan, WI, USA) and a biofilter. Water quality was monitored daily using an oxygen meter; 5.7 ± 0.2 mg L−1 (YSI 85, YSI, Yellow Springs, OH, USA) and a pHmeter; 7.3 ± 0.2 (HANNA HI 991001, HANNA instruments, Woonsocket, RI, USA) and an average temperature of 27.1 ± 0.8 °C. Tanks were inspected daily for mortalities, and any excess feed and feces were siphoned.

2.2. Experimental Diets

In this study, a basal diet was used according to [2] (44% of protein and 15% lipid) with modifications (Table 1), and the feed preparation method was according to [17]. All diets were grounded and sieved until obtaining specific particle sizes (20–150 µm) considering larval growth. The diet without FOS was used as a control diet, and three experimental diets were designed by replacing starch with three FOS concentrations: 2.5, 5, and 7.5 g kg−1. All diets were analyzed for proximal analysis (humidity, ash, lipid, and protein) according to [18] (Table 1) and were maintained at −20 °C.

2.3. Experimental Design

The study was conducted under the agreement of the Declaration of Helsinki. The protocol was authorized by Secretaría de Agricultura, Ganadería, Desarrollo Rural, Pesca y Alimentación (SAGARPA), Mexico, NOM-062-ZOO-1999.2001. The treatments and the control diet were evaluated in triplicates and randomly selected, using 80 larvae per experimental tank. The feeding of A. tropicus larvae started at 4 DAH using a co-feeding with Artemia nauplii and experimental diets for five days. From 9 DAH, the larvae were fed exclusively with the FOS experimental diets and the control diet for 10 days until their transformation to juveniles (19 DHA). Larvae were fed four times a day (7:00, 11:00, 15:00, and 19:00 h).

2.4. Evaluation of Growth Indexes and Survival Rate

At the beginning (4 DAH) and end of the experiment (19 DAH), sampling of each larva was performed to determine the wet weight (g) using an analytical scale (Ohaus HH120, Shenzhen, China) and the total length (cm) through scale photography using the Software Image 1.5. At the end of the bioassay, productive parameters were calculated considering only the days of administration of the experimental diets, including feed intake (FI): total feed intake per experimental unit/number of rearing days; the weight gain (WG): [final weight (g) − initial weight (g)] × 100; specific growth rate (SGR): (exp(g) − 1) × 100 (where g = (ln (final weight) − ln (initial weight))/days) [19]; condition factor (CF): (final mean body weight/final mean body lenght3) × 100; the feed conversion factor (FCE): feed intake in dry matter (g)/fish weight gain (g) × 100; the protein efficiency ratio (PER): weight gain (g)/protein delivered (g), and survival rate (S): (number of final fish/number of initial fish) × 100.

2.5. Biological Sampling

At the end of the trial, nine larvae per treatment (three larvae per replicate) were collected for enzyme activity quantification, and nine larvae per treatment (three larval per replicate) were collected for gene expression analysis. All the larvae collected were washed with freshwater after collecting them. Heads and tails were cut and discarded. The samples for enzyme activity were frozen at −80 °C. For molecular analysis, samples were kept in RNAlater solution and frozen at −80 °C.

2.6. Enzyme Activities Quantification

Extracts were obtained by maceration of viscera from three larvae per replicate in 50 mM Tris-HCl pH 7.5, then were centrifuged at 14,000× g at 4 °C for 15 min. The supernatant was kept in aliquots and stored at −80 °C. Soluble protein was quantified with the Bradford method [20]. Acid protease activity was quantified using 1% hemoglobin as substrate in 0.1 M Glycine HCl buffer, pH 2. The absorbance was measured in a microplate reader (xMark, Biorad, Hercules, CA, USA) at 280 nm. Alkaline protease activity was determined using the Walter technique [21] with 1% casein (1%) as substrate and 100 mM Tris-HCl, 10 mM CaCl2, pH 9, and the absorbance was measured at 280 nm. Trypsin activity was quantified using the Erlanger et al. (1961) technique [22] with 1 mM BAPNA as substrate (Nα-Benzoyl-DL-Arginine-P-nitroanilide) in 50 mM Tris-HCl, 10 mM CaCl2, pH 8.2, and the absorbance was measured at 410 nm. Chymotrypsin activity was quantified following the technique of Del Mar et al. [23], using 1.25 mM SAPNA as substrate (135 µL) with 50 mM Tris-HCl, pH 8.2, and the absorbance was measured at 410 nm. Lipase activity was carried out with a modify method by [24], using 4-nitrophenil palmitate as substrate and 0.5 M Tris-HCl, pH 7.4, 6 mM of sodium taurocholate, and 5 µL of extract and the absorbance was measured at 415 nm. The α-Amylase activity was quantified using 2% starch as substrate in buffer sodium citrate, 0.05 M NaCl, pH 7.5, and the absorbance was measured at 600 nm. All data obtained are shown as U mg protein−1 according to the following equations: units by mL (U mL−1) = [Δabs × final reaction volume (mL)][ε × time (min) × extract volume (ml)]−1; specific activity (U mg protein−1) = U mL mg−1 of soluble protein.

2.7. RNA Extraction and Reverse Transcription

Total RNA of each larval sample was isolated using Trizol (Invitrogen, Waltham, MA, USA) according to the manufacturer’s instructions. The concentration and purity of RNA samples were assessed by the ratio of the absorbance at 260 and 280 nm in a spectrophotometer (Jenway GenovaNano, Cole-Parmer, Staffordshire, UK). RNA integrity was verified by visualizing 28S and 18S RNAs in a 1% agarose/formaldehyde gel electrophoresis. One microgram of RNA was inversely transcribed into cDNA in a thermocycler (Mastercycle nexus GSX1, Eppendorf, Hamburg, Germany) by using the high-capacity cDNA inversely transcription kit (Maxima First Strand cDNA Synthesis Kit for RT-qPCR, ThermoScientific, Waltham, MA, USA) in a final volume of 20 μL, following the manufacturer’s recommendations.

2.8. Gene Expression Analysis

To determine the expression of intestinal barrier function genes like zo-1, zo-2, claudin-3, claudin-12, claudin-15, claudin-17 (tight junction proteins), muc-2 (mucus layer protein), and il-8 (cytokine pro-inflammatory) in larval samples; transcripts of A. tropicus were obtained by a bioinformatic blast search on the available transcriptome project number PRJNA395289, on the National Center for Biotechnology Information (NCBI). Specific primers were designed using the PrimerBlast tool (https://www.ncbi.nlm.nih.gov/tools/primer-blast/, accessed on 22 April 2022) (Table 2). A standard curve for each pair of primers was generated to confirm the amplification efficiencies using five serial dilutions (from 100 to 0.1 ng of DNA). qPCR reactions were carried out using 10 µL of Eva Green supermix (BioRad, Hercules, CA, USA), 9 µL of cDNA (5 ng µL−1) and 1 µL primers mix, in a final volume of 20 µL. A negative control was performed with each run by replacing the template cDNA with sterile water. The β-actin gene [25] was used as the reference gene. qPCR was performed in a CFX96TM Real Time Thermocycler (BioRad, Hercules, CA, USA) using de following conditions: one denaturation cycle of 10 min at 95 °C followed by 40 cycles of 15 s at 95 °C and 1 min at 60 °C. The relative changes in gene expression were calculated employing the 2−ΔΔCt method [26] with the efficiency correction of the genes (Table 2).

2.9. Statistical Analysis

Normality (Kolmogorov-Smirnov) and homoscedasticity (Bartlett) were tested for all treatments. Differences in growth indexes, the survival rate, and digestive enzyme activities between diets were assessed using one-way ANOVA, followed by Tukey’s test. Gene expression differences were determined by the Kruskal–Wallis and Nemenyi methods. All data were statistically analyzed using GraphPad Prism 8 (GraphPad Software, San Diego, CA, USA) software whit a significance value of 0.05.

3. Results

3.1. Growth Indexes and Survival Rate

The means of growth indices and survival rate are shown in Table 3. At the end of the bioassay, larvae fed with 7.5 g kg−1 FOS had the greatest weight gain (0.13 ± 0.0005 g) (p < 0.05). For total length, larvae fed with control diet and 7.5 g kg−1 FOS diets showed the highest length (3.13 ± 0.01 and 3.11± 0.02 cm, respectively) but there was no differences between them (p > 0.05). While larvae fed with 5.0 g kg−1 and 2.5 g kg−1 were significantly smaller (p < 0.05).
Weight gain and specific growth rate values showed significant differences between the four diets, where higher values were observed in larvae fed with the 7.5 g kg−1 FOS diet (p < 0.05). The condition factor in larvae fed with the 2.5 g kg−1 FOS diet exhibited a highest value (0.49 ± 0.06). There was a significant difference for CF between larvae fed with control diet and 2.5 g kg−1 FOS diet (p < 0.05), while 5 and 7.5 g kg−1 FOS diets did not show differences (p > 0.05). The feed intake, the feed conversion factor, and the protein efficiency ratio values did not show significant difference. After 15 days of feeding, larvae fed with 7.5 g kg−1 FOS had the highest survival rate (24.18% ± 1.74) and showed significant differences (p < 0.05) from larvae fed with the 5 g kg−1 and control diet.

3.2. Digestive Enzyme Activities

The effect of the experimental diets on the digestive enzyme activities of larvae is presented in Figure 1. The specific activity of acid protease was significantly higher (p < 0.05) in larvae fed with 2.5 g kg−1 FOS (Figure 1a). Alkaline protease activity was higher in larvae fed 5 g kg−1 FOS and showed significant differences among all treatments (p < 0.05) (Figure 1b). No significant differences were observed in trypsin activity when compared with the larvae fed with control diet (Figure 1c). The specific activity of chymotrypsin decreased in larvae fed with 2.5 g kg−1 FOS (p < 0.05), while larvae fed with 5 and 7.5 g kg−1 did not show significant differences with control diet (Figure 1d). The highest lipase activity was detected in larvae fed with control diet, while the lowest lipase activity was detected in larvae fed with 5 g kg−1 FOS (p < 0.05) (Figure 1e). Finally, amylase activity showed higher values in larvae fed with 5 g kg−1 FOS (p < 0.05) (Figure 1f).

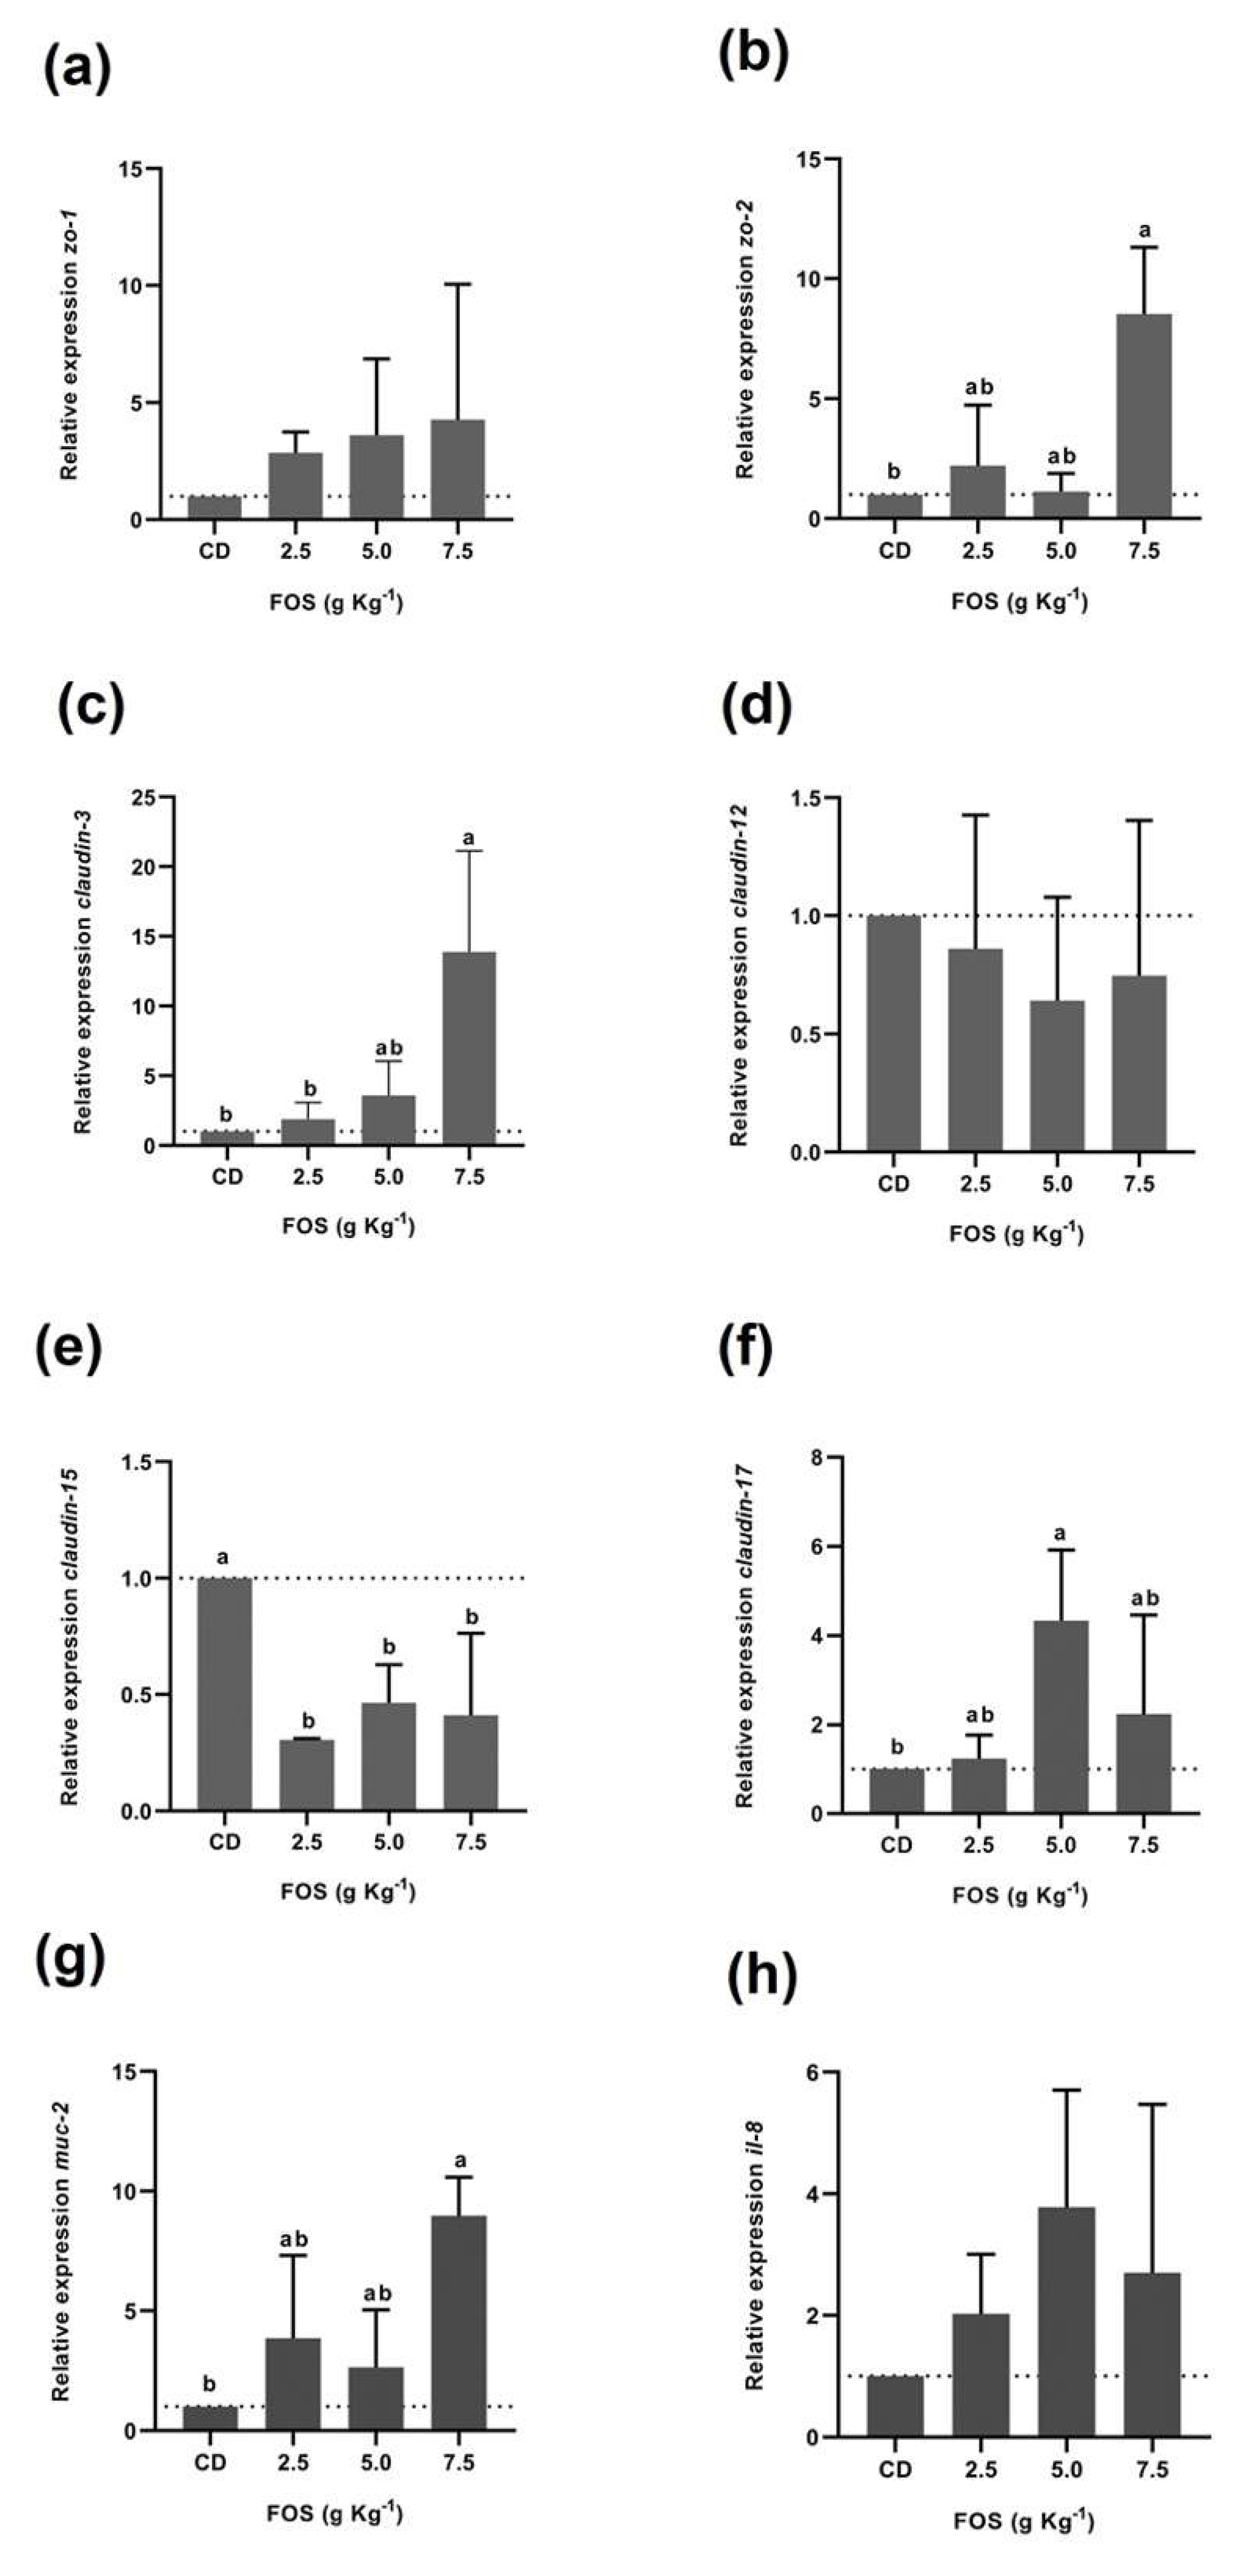
3.3. Intestinal Barrier Protein Gene Expression

The effect of FOS dietary supplementation on the expression of intestinal barrier function genes in larvae was analyzed. The relative changes in gene expression of zo-1, zo-2, claudin-3, claudin-12, claudin-15, claudin-17 (TJ proteins), muc-2 (mucus layer protein), and il-8 (a pro-inflammatory cytokine) are presented in Figure 2.
Relative zo-1 expression showed a tendency of up-regulation when increasing the FOS inclusion but did not show significant differences among treatments (Figure 2a). The expression of zo-2 (Figure 2b) and claudin-3 (Figure 2c) were significantly (p < 0.05) up-regulated in the larvae fed with 7.5 g kg−1 FOS supplemented diet compared with the larvae fed with the control diet. In contrast, claudin-15 relative expression was downregulated (p < 0.05) in larvae fed with the 2.5, 5, and 7.5 g kg−1 FOS diet (Figure 2e). No significant difference in expression level of claudin-12 (Figure 2d) was observed. The expression of claudin-17 (Figure 2f) was significantly (p < 0.05) up-regulated in the larvae fed with 5 g kg−1 FOS diet. Relative expression of muc-2 was up-regulated (p < 0.05) in larvae fed with 7.5 g kg−1 FOS (Figure 2g). Finally, transcriptional regulation of il-8 was not affected in larvae fed with any experimental diet (p > 0.05) (Figure 2h).

4. Discussion

The use of diets made with functional ingredients has gained much interest since they have been shown to promote growth and health of fishes fed with them [27]. Particularly, the incorporation of prebiotics in diets has beneficial effects on growth performance, disease resistance, health, and gut microbiota composition [4]. Nevertheless, the results obtained in the studies with prebiotics depend on the administration pathways, concentration, type of probiotics used, and the response of the fish species and their microbiota [5]. In this study, the administration of different concentrations of fructooligosaccharides (FOS) in the diet of A. tropicus larvae did not show a linear effect concerning the variables evaluated. However, we confirmed the positive effect of FOS administration on growth performance, survival rate, digestive enzyme activities, and gene expression related to the intestinal barrier function of A. tropicus larvae. The inclusion of 7.5 g kg−1 FOS to the diet improved weight gain, specific growth rate, and survival rate in larvae compared with the larvae fed with control diet. Besides, positive effects have been observed in studies with juveniles of the same species, like [28], who proved that the supplementation of 2 g kg−1 MOS in A. tropicus juveniles increased weight gain, total length, specific growth rate, and protein efficiency ratio. In addition, [13] determined that the administration of 5 g kg−1 FOS to A. tropicus juveniles benefits its growth and the somatic indexes, weight gain, and specific growth rate. However, [24] determined that A. tropicus juveniles fed with different concentrations of β-glucans (up to 2 g kg−1) no-showed significant difference in growth performance. Concerning our results, it has been observed that dietary FOS also produces positive effects in other fishes, such as in rainbow trout (Oncorhynchus mykiss), where the administration of 5 and 10 g kg−1 FOS had a positive effect on body weight [9]. In blunt snout bream (Megalobrama amblycephala) fingerlings, the administration of increasing levels of FOS significantly increased the final body weight, weight gain, specific growth rate, and survival rate [11]. In the starry sturgeon (Acipenser stellatus), a supplementation of 10 g kg−1 FOS promoted a significant difference in growth [12]. Other prebiotics used in aquaculture with positive effects are inulin, xylooligosaccharides (XOS), galactoooligosaccharides (GOS), and some commercial prebiotic mixtures [7]. Nile tilapia (Oreochromis niloticus) juveniles fed diets supplemented with 2 g kg−1 inulin exhibited better growth performance, specific growth rate, feed conversion ratio, and survival rate [27]. A diet formulated with 10 g kg−1 XOS promoted higher final body weight, specific growth rate, and protein efficiency ratio, but the feed conversion factor showed the opposite trend in the common carp, according to [29]. The effect of feeding with 2% GOS in roach (Rutilus rutilus) was significantly higher for growth, absolute weight gain, specific growth rate, feed conversion ratio, and survival rate [30]. The evaluation of the activity of digestive enzymes in farmed fish is essential to understand the digestion mechanism and how the organisms adapt to nutritional changes [31]. Larval capacity to assimilate the required nutrients will depend on the diet and on their capacity to modulate their digestive enzymes [32]. In this work, the activity of digestive enzymes of larvae was affected by FOS. Fish fed with 5 g kg−1 of FOS had the highest alkaline proteases, trypsin, and amylase activity. While acid protease activity was greater in fish fed with 2.5 g kg−1 FOS, chymotrypsin and lipase activities were higher in the control diet. Similar to these results, previous work with A. tropicus juveniles showed that fish fed with 5 g kg−1 FOS showed higher acid protease activities [13]. Acid proteases are more abundant in the stomach of carnivorous fish species [33]. Our results agree with the higher activity detected of acid proteases with 2.5 g kg−1 FOS. Likewise, [28] reported that juveniles of A. tropicus fed with 4 g kg−1 MOS had higher alkaline protease, trypsin, and amylase activity. According to [34], trypsin activity influences the growth rate of Atlantic cod (Gadus morhua); in our results, we observed a similar trend in larvae fed with 5 g kg−1 of FOS, which presented higher specific growth rate and trypsin activity. Likewise, the amylase activity increment was similar to the results reported in blunt snout bream (Megalograma amblycephala) fingerlings fed with 4 and 8 g kg−1 of FOS [11]. As for Caspian roach fry (Rutilus rutilus), the administration of 2 and 3% FOS promoted amylase activity compared to the control diet [10]. Ref. [35] related the increase of amylase activity in the Oscar (Astronotus ocellatus) fed with 1% of scFOS, with the exogenous microbial activities stimulated by scFOS. Thus, the increase in digestive enzyme activities observed in fish fed with prebiotics may be due to bacterial enzymes production since prebiotics modify the composition of the intestinal microbiota and therefore affect digestion [10,36]. In this study, no changes were observed in the enzyme activity of chymotrypsin and lipase. Concerning this, some studies report that the administration of prebiotics in fish diets does not promote changes in the activity of digestive enzymes. In gilthead seabream (Sparus aurata) [37] and Atlantic salmon (Salmo salar) [38], inulin inclusion did not improve changes in digestive enzyme activities (amylase, alkaline phosphatase, trypsin, leucine aminopeptidase). Ref. [36] reported that the mix of prebiotics (FOS, Bio-MOS, transgalactooligosaccharide and GroBiotic-A) in diets for the hybrid striped bass (Morone chrysops × Morone saxatilis) and the red drum (Sciaenops ocellatus) did not cause changes in the activities of pepsin, trypsin, chymotrypsin, aminopeptidase, amylase, and lipase. According to [39], the presence or absence of certain digestive enzymes in fishes depends on the feed, feeding habits, and the functional morphology of the various parts of the gut. A considerable improvement in growth, feed utilization, and health in fishes are some of the benefits that prebiotics provide but depend on the fish species, feeding duration, supplement dose and type of prebiotics [5]. Likewise, the establishment of normal gut microbiota is complementary to the role of digestive enzymes, favoring the digestive process, although more studies are necessary to confirm the relationship between both.
In addition to the enzyme activity, intestinal homeostasis is essential for the host’s health since the intestine also acts as a physical and immune barrier. Thus, a disturbance of this physical barrier may lead a bacterial, antigen, pathogenic and toxic translocation into the circulation system and activate the immune system [14], which can cause infection and inflammatory diseases [40]. Therefore, the integrity of this barrier is vital to intestinal health and plays an essential role in nutrient digestion, absorption, and growth. Deficiency of nutrients disturbs the intestinal physical barrier by disrupting tight junction proteins, leading to poor fish growth [41,42,43]. However, to date, there are no reports focused on the relationship between dietary prebiotics supplementation and the integrity of the intestinal barrier mediated by tight junctions in fish. Our study describes the effects of FOS administration on the intestinal physical barrier function correlated with tight junction expression in A. tropicus larvae. Our results showed a tendency of up-regulation of the mRNA level of zo-1 as the concentration of FOS increases in the diet; however, this expression was not statistically significant. In addition, the inclusion of 7.5 g kg−1 FOS promoted an up-regulation of the mRNA of zo-2 and claudin-3, And 5 g kg−1 FOS up-regulated the mRNA level of claudin-17. Previous reports indicate that zo-1, zo-2, claudin-3, and claudin-17 are tight junction proteins that help to seal off the physical intestinal barrier of many organisms, and a decreased in expression may reduce the intestinal barrier function and lead to intestinal disorders [44,45]. In contrast, previous studies indicate that up-regulated claudin-12 (Ca+ channel) and claudin-15 (Na+ channel) expression disturbed intestinal barrier function by increasing pore-forming and the intestinal permeability [42,45]. A similar trend was observed in other studies, where a dietary valine deficiency disrupted the intestinal barrier by increasing the claudin-15 expression in young grass carp (Ctenopharyngodon idella) [41]. Meanwhile, [43] showed that a deficiency of dietary pyridoxine up-regulated the mRNA levels of claudin-12 and claudin-15a in young grass carp affected the function of the tight junction proteins. In the current study, the expression levels of claudin-12 were not significantly altered under any treatment. Despite that, no effects on the intestinal barrier can be assumed since the effects of claudin-12 on intestinal barrier function is not completely clear as variable results have been recorded in a different model of studies [46]. However, a significant change in claudin-15 mRNA transcript abundance was observed. The inclusion of 2.5, 5, and 7.5 g kg−1 FOS diet promoted a down-regulation of the mRNA level of claudin-15. Thus, these results suggest that the FOS inclusion in the A. tropicus diet could indirectly reinforce the intestinal barrier integrity through transcriptional up-regulation of zo-2 and claudin-3 and down-regulation of claudin-15. Another element of the intestinal physical barrier is the mucus layer that overlays the intestinal epithelium and limits direct contact with microorganisms [47], preventing activation of the subepithelial immune system. The major component of mucus is the MUC-2 protein. A deficient protective mucus layer, inflammation diseases, and severe colitis has been shown in mammal models with a MUC-2 deficiency and with mutations in the muc-2 gene [48,49]. In this study, we evaluated the expression of the mucus layer protein MUC-2. Our results showed that muc-2 relative expression was up-regulated in A. tropicus larvae fed with 7.5 g kg−1 FOS, according to [13], who reported that A. tropicus juveniles fed 10 and 15 g kg−1 FOS showed overexpression of muc-2. While [24] did not show any differences in the muc-2 expression with the supplementation of β-glucans in juveniles of A. tropicus. Finally, to elucidate the relationship between dietary FOS and the immune response, we considered analyzing the intestinal pro-inflammatory cytokine il-8 gene expression. In fish, it is well known that the inclusion of different prebiotics provoked the activation of the immune system at the molecular level [50]. Special attention has been focused on pro-inflammatory cytokines in several fish species. Many studies are focused on evaluating the effect of prolonged stress, feed allergens, and nutrient deficiency on the expression of IL-1β, TNF-α, and IL-8, affecting digestion, absorption, and immune system, resulting in negative effects in growth [14,41,42]. Our results showed that dietary FOS does not regulate il-8 mRNA level, suggesting that FOS inclusion does not promote an intestinal inflammatory response mediated by this pro-inflammatory cytokine. However, more studies are required to elucidate a more detailed model in which FOS supplementation influences these gene expressions to develop strategies that enhance the barrier integrity and fish health using a functional diet supplementation.

5. Conclusions

The results obtained indicate that supplementation of 7.5 g kg−1 FOS in the diet of A. tropicus larvae benefits weight gain, specific growth rate, and survival rate. Moreover, the inclusion of 5 g kg−1 FOS increased alkaline protease and amylase activities, improving the capacity to hydrolyze nutrients. In addition, we report that the inclusion of 7.5 g kg−1 FOS induces upregulation of muc-2, zo-2, and claudin-3 genes. In contrast, the inclusion of 2.5, 5, and 7.5 g kg−1 FOS induces downregulation of the pore-forming gen claudin-15 (Na+ channel). At the same time, the FOS inclusion does not increase il-8 mRNA level suggesting that it does not promote an intestinal inflammatory response mediated by this pro-inflammatory cytokine. Thus, this report provides evidence that prebiotics as a supplement in the diet improves the intestinal barrier function via regulating the epithelial structural integrity of larval intestine. Thus, the supplementation of 5–7.5 g kg−1 FOS can positively affect the development and intestinal health of A. tropicus larvae.

Author Contributions

Conceptualization, C.S.A.-V. and C.A.A.-G.; investigation, E.S.P.-M., G.M.P.-J., D.T.-R., C.I.M.-V. and G.G.A.-A.; formal analysis, C.A.S.-Q.; methodology, C.S.A.-V., C.A.A.-G., L.D.J.-M., M.A.G., T.M.-B., C.I.M.-V. and S.D.l.R.-G.; project administration, C.A.A.-G. and C.S.A.-V.; resources, C.A.A.-G., C.S.A.-V. and S.D.l.R.-G.; writing—original draft, C.S.A.-V. and G.M.P.-J.; writing-review and editing, C.S.A.-V., C.A.A.-G., E.S.P.-M., D.T.-R., S.D.l.R.-G., R.M., G.G.A.-A., C.I.M.-V. and G.M.P.-J. All authors have read and agreed to the published version of the manuscript.

Funding

This research was funded by the Consejo Nacional de Ciencia y Tecnología (CONACYT) project “Estudio de la fisiología digestiva en larvas y juveniles de pejelagarto (Atractosteus tropicus) con base en técnicas histológicas, bioquímicas y moleculares” CB-2016-1-282765 and Programa Institucional de Superación Académica (PRODEP), project UJAT-EXB-236.

Institutional Review Board Statement

The study was conducted under the agreement of the Declaration of Helsinki. The protocol was authorized by Secretaría de Agricultura, Ganadería, Desarrollo Rural, Pesca y Alimentación (SAGARPA), Mexico, NOM-062-ZOO-1999.2001.

Data Availability Statement

The data that support the findings of this study are available from the corresponding author upon reasonable request.

Acknowledgments

The author thank the Grant provided by CONACYT for postgraduate studies.

Conflicts of Interest

All authors declared they have no conflict of interest.

References

  1. Márquez-Couturier, G.; Álvarez-González, C.A.; Contreras-Sánchez, W.M.; Hernández-Vidal, U.; Hernández-Franyutti, A.; Mendoza-Alfaro, R.; Goytortúa-Bores, E. Avances en la Alimentación y Nutrición del Pejelagarto Atractosteus tropicus; Avances En Nutrición Acuícola VIII; Universidad Autonóma de Nuevo León: Monterrey, Nuevo León, México, 2006; pp. 446–523. [Google Scholar]
  2. Frías-Quintana, C.; Domínguez-Lorenzo, J.; Álvarez-González, C.; Tovar-Ramírez, D.; Martínez-García, R. Using cornstarch in microparticulate diets for larvicultured tropical gar (Atractosteus tropicus). Fish Physiol. Biochem. 2016, 42, 517–528. [Google Scholar] [CrossRef] [PubMed]
  3. Huerta-Ortiz, M.; Álvarez-González, C.; Civera-Cerecedo, R.; Martínez-García, R.; Camarillo-Coop, S.; Goytortúa-Bores, E.; Peña, E.; Pérez-Morales, A. Optimum level of dietary lipids for growth, chemical composition and apparent digestibility of lipids for Atractosteus tropicus. Lat. Am. J. Aquat. Res. 2018, 46, 1073–1082. [Google Scholar] [CrossRef]
  4. Merrifield, D.; Dimitroglou, A.; Foey, A.; Davies, S.; Baker, R.; Bogwald, J.; Mathieu, C.; Ringo, E. The current status and future focus of probiotic and prebiotic applications for salmonids. Aquaculture 2010, 302, 1–18. [Google Scholar] [CrossRef]
  5. Ye, J.; Wang, K.; Li, F.; Sun, Y. Single or combined effects of fructo- and mannan oligosaccharide supplements and Bacillus clausii on the growth, feed utilization, body composition, digestive enzyme activity, innate immune response and lipid metabolism of the Japanese flounder Paralichthys olivaceus. Aquac. Nutr. 2011, 17, e902–e911. [Google Scholar] [CrossRef]
  6. Gibson, G.; Roberfroid, M. Dietary modulation of the human colonic microbiota-introducing the concept of prebiotics. J. Nutr. 1995, 125, 1401–1412. [Google Scholar] [CrossRef]
  7. Ringo, E.; Olsen, R.; Gifstad, T.; Dalmo, R.; Amlund, H.; Hemre, G.; Bakke, A. Prebiotics in aquaculture: A review. Aquac. Nutr. 2010, 16, 117–136. [Google Scholar] [CrossRef]
  8. Kumar, C.; Sripada, S.; Poornachandra, Y. Status and future prospects of frutooligosaccharides as nutraceuticals. In Role of Materials Science in Food Bioengineering; Grumezescu, A.M., Holban, A.M., Eds.; Academic Press: Cambridge, MA, USA, 2018; pp. 451–503. [Google Scholar]
  9. Ortiz, L.; Rebolé, A.; Velasco, S.; Rodríguez, L.; Treviño, J.; Tejedor, J.; Alzueta, C. Effects of inulin and fructooligosaccharides on growth performance, body chemical composition and intestinal microbiota of farmed rainbow trout (Oncorhynchus mykiss). Aquac. Nutr. 2012, 19, 475–482. [Google Scholar] [CrossRef]
  10. Soleimani, N.; Hoseinifar, S.; Merrifield, D.; Barati, M.; Abadi, Z. Dietary supplementation of fructooligosaccharide (FOS) improves the innate immune response, stress resistance, digestive enzyme activities and growth performance of Caspian roach (Rutilus rutilus) fry. Fish Shellfish Immunol. 2012, 32, 316–321. [Google Scholar] [CrossRef]
  11. Wu, Y.; Liu, W.; Li, H.; Xu, W.; He, J.; Li, X.; Jian, G. Effects of dietary supplementation of fructooligosaccharide on growth performance, body composition, intestinal enzymes activities and histology of blunt snout bream (Megalobrama amblycephala) fingerlings. Aquac. Nutr. 2013, 19, 886–894. [Google Scholar] [CrossRef]
  12. Akrami, R.; Iri, Y.; Rostami, H.; Mansour, M. Effect of dietary supplementation of frutooligosaccharide (FOS) on growth performance, survival, lactobacillus bacterial population and hemato-immunological parameters of stella sturgeon (Acipenser stellatus) juvenile. Fish Shellfish Immunol. 2013, 35, 1235–1239. [Google Scholar] [CrossRef]
  13. Sepúlveda-Quiroz, C.; Peña-Marín, E.; Pérez-Morales, A.; Martínez-García, R.; Alvarez-Villagomez, C.; Maytorena-Verdugo, C.; Camarillo-Coop, S.; Vissio, P.; Sirkin, D.; Tovar-Ramírez, D.; et al. Fructooligosaccharide supplementation in diets for tropical gar (Atractosteus tropicus) juveniles: Effects on morphophysiology and intestinal barrier function. Aquac. Res. 2020, 52, 37–50. [Google Scholar] [CrossRef]
  14. Niklasson, L.; Sundh, H.; Fridell, F.; Taranger, G.; Sundell, K. Disturbance of the intestinal mucosal immune system of farmed Atlantic salmon (Salmo salar), in response to long-term hypoxic conditions. Fish Shellfish Immunol. 2011, 31, 1072–1080. [Google Scholar] [CrossRef] [PubMed]
  15. Feng, L.; Li, W.; Liu, Y.; Jiang, W.; Kuang, S.; Jiang, J.; Tnag, L.; Wu, P.; Tang, W.; Zhang, Y.; et al. Dietary phenylalanine improved intestinal barrier health in young grass carp (Ctenopharyngodon idella) is associated with increased immune status and regulated gene expression of cytokines, tight junction proteins, antioxidant enzymes and related signalling molecules. Fish Shellfish Immunol. 2015, 45, 495–509. [Google Scholar] [CrossRef] [PubMed]
  16. González-Mariscal, L.; Betanzos, A.; Nava, P.; Jaramillo, B. Tight junction proteins. Prog. Biophys. Mol. Biol. 2003, 81, 1–44. [Google Scholar] [CrossRef]
  17. Álvarez-González, C.A.; Ortiz-Galindo, J.; Dumas, S.; Martínez-Díaz, S.; Hernández-Ceballos, D.; Del Alamo, T.; Moreno-Legorreta, M.; Peña-Martínez, R. Effect of Stocking Density on the Growth and Survival of Spotted Sand Bass Paralabrax maculatofasciatus Larvae in a Closed Recirculating System. J. World Aquac. Soc. 2001, 32, 151–159. [Google Scholar] [CrossRef]
  18. AOAC (Association of Official Analytical Chemists). Official Methods of Analysis, 17th ed.; Association of Official Analytical Chemists: Arlington, VA, USA, 2000. [Google Scholar]
  19. Ricker, W. Handbook of computations for biological statistics of fish populations. Bull. Fish Res. Board Can. 1958, 119, 300. [Google Scholar]
  20. Bradford, M. A rapid and sensitive method for the quantization of microgram quantities of protein utilizing the principle of protein-dye binding. Anal. Chem. 1976, 72, 248–254. [Google Scholar]
  21. Walter, H. Proteinases: Methods with hemoglobin, casein and azocoll as substrates. In Methods of Enzymatic Analysis; Verlag Chemie: Weinheim, Germany, 1984; pp. 270–277. [Google Scholar]
  22. Erlanger, B.; Kokowsky, N.; Cohen, W. The preparation and properties of two new chromogenic substrates of trypsin. Arch. Biochem. Biophys. 1961, 95, 271–278. [Google Scholar] [CrossRef]
  23. Del Mar, E.; Largman, C.; Brodrick, J.; Geokas, M. A sensitive new substrate for chymotrypsin. Anal. Biochem. 1979, 99, 316–320. [Google Scholar] [CrossRef]
  24. Gjellesvik, D.; Lombardo, D.; Walther, B. Pancreatic bile salt dependent lipase from cod (Gadus morhua): Purification and properties. Biochim. Biophys. Acta 1992, 1124, 123–124. [Google Scholar] [CrossRef]
  25. Nieves-Rodríguez, K.; Álvarez-González, C.; Peña-Marín, E.; Vega-Villasante, F.; Martínez-García, R.; Camarillo-Coop, S. Effect of β-Glucans in diets on growth, survival, digestive enzyme activity, and immune system and intestinal barrier gene expression for Tropical Gar (Atractosteus tropicus) juveniles. Fishes 2018, 3, 27. [Google Scholar] [CrossRef] [Green Version]
  26. Livak, K.J.; Schmittgen, T.D. Analysis of relative gene expression data using real- time quantitative PCR and the 2ΔΔCT method. Method 2002, 25, 402–408. [Google Scholar] [CrossRef] [PubMed]
  27. Boonanuntanasarn, S.; Tiengtam, N.; Pitaksong, T.; Piromyou, P.; Teaumroong, N. Effects of inulin and Jerusalem artichoke (Helianthus tuberosus) on intestinal microbiota community and morphology of Nile tilapia (Oreochromis niloticus) fingerlings. Aquac. Nutr. 2017, 24, 712–722. [Google Scholar] [CrossRef]
  28. Nájera-Arzola, I.; Álvarez-González, C.; Frías-Quintana, C.; Peña, E.; Martínez-García, R.; Camarillo-Coop, S.; Méndez-Marín, O.; Gisbert, E. Evaluation of Mannan oligosaccharides (MOS) in balanced diets for tropical gar juveniles (Atractosteus Trop). Hidrobiológica 2018, 28, 239–246. [Google Scholar] [CrossRef]
  29. Abasubong, K.; Li, X.; Zhang, D.; Jia, E.; Xiang-Yang, Y.; Xu, C.; Liu, W. Dietary supplementation of xylooligosaccharides benefits the growth performance and lipid metabolism of common carp (Cyprinus carpio) fed hight-fat diets. Aquac. Nutr. 2018, 24, 1416–1424. [Google Scholar] [CrossRef]
  30. Hoseinifar, S.; Khalili, M.; Rostami, H.; Esteban, M. Dietary galactooligosaccharide affects intestinal microbiota, stress resistence, and performance of Caspian roach (Rutilus rutilus) fry. Fish Shellfish Immnunol. 2013, 35, 1416–1420. [Google Scholar] [CrossRef]
  31. Sunde, J.; Eiane, S.; Rustad, A.; Jensen, H.; Opstvedt, J.; Nygard, E.; Venturini, G.; Rungruangsak-Torrissen, K. Effect of fish feed processing conditions on digestive protease activities, free amino acid pools, feed conversion efficiency and growth in Atlantic salmon (Salmo salar L.). Aquac. Nutr. 2004, 10, 261–277. [Google Scholar] [CrossRef]
  32. Cahu, C.; Zambonino, J. Substitution of live food by formulated diets in marine fish larvae. Aquaculture 2001, 200, 61–181. [Google Scholar] [CrossRef] [Green Version]
  33. García-Carreño, F.; Albuquerque-Cavalcanti, C.; Navarrete del Toro, M.; Zaniboni-Filho, E. Digestive proteinases of Brycon orbignyanus (Characidae, Teleostei): Characteristics and effects of protein quality. Comp. Biochem. Physiol. 2002, 132, 343–352. [Google Scholar] [CrossRef]
  34. Lemieux, H.; Blier, P.; Dutil, J. Do digestive enzymes set a physiological limit on growth rate and food conversion efficiency in the Atlantic cod (Gadus Morhua)? Fish Physiol. Biochem. 1991, 20, 293–303. [Google Scholar] [CrossRef]
  35. Hoseinifar, S.; Khalili, M.; Sun, Z. Intestinal histomorphology, autochthonous microbiota and growth performance of the oscar (Astronotus ocellatus Agassiz, 1831) following dietary administration of xylooligosaccharide. J. Appl. Ichthyol. 2015, 32, 1137–1141. [Google Scholar] [CrossRef]
  36. Anguiano, M.; Pohlenz, C.; Buentello, A.; Gatlin, D. The effects of prebiotics on the digestive enzymes and gut histomorphology of red drum (Sciaenops ocellatus) and hybrid striped bass (Morone chrysops × M. saxitilis). Br. J. Nutr. 2013, 109, 623–629. [Google Scholar] [CrossRef] [PubMed] [Green Version]
  37. Cerezuela, R.; Meseguer, J.; Esteban, M. Effects of dietary inulin, Bacillus subtilis and microalgae on intestinal gene expression in gilthead seabream (Sparus aurata L.). Fish Shellfish Immunol. 2013, 34, 843–848. [Google Scholar] [CrossRef] [PubMed]
  38. Refstie, S.; Bakke-McKellep, A.M.; Penn, M.H.; Sundby, A.; Shearer, K.D.; Krogdahl, S. Capacity for digestive hydrolysis and amino acid absorption in Atlantic salmon (Salmo salar) fed diets with soybean meal or inulin with or without addition of antibiotics. Aquaculture 2006, 26, 392–406. [Google Scholar] [CrossRef]
  39. Buddintong, R.; Diamond, J. Aristotle revisited: The function of pyloric caeca in fish. Proc. Natl. Acad. Sci. USA 1986, 83, 8012–8014. [Google Scholar] [CrossRef] [Green Version]
  40. Lee, S. Intestinal permeability regulation by tight junction: Implication on inflammatory bowel diseases. Intest. Res. 2015, 13, 11–18. [Google Scholar] [CrossRef] [Green Version]
  41. Luo, J.; Feng, L.; Jiang, W.; Liu, Y.; Wu, P.; Jiang, J.; Kuang, S.; Tang, L.; Zhang, Y.; Zhou, X. The impaired intestinal mucosal immune system by valine deficiency for young grass carp (Ctenopharyngodon idella) is associated with decreasing immune status and regulating tight junction proteins transcript abundance in the intestine. Fish Shellfish Immunol. 2014, 40, 197–207. [Google Scholar] [CrossRef]
  42. Chen, L.; Feng, L.; Jiang, W.; Jiang, J.; Wu, P.; Zhao, J.; Kuang, S.; Tang, L.; Tang, W.; Zhang, Y.; et al. Intestinal immune function, antioxidant status and tight junction proteins mRNA expression in young grass carp (Ctenopharyngodon idella) fed riboflavin deficient diet. Fish Shellfish Immunol. 2015, 47, 470–484. [Google Scholar] [CrossRef]
  43. Wu, P.; Zheng, X.; Zhou, X.; Jiang, W.; Liu, Y.; Jiang, J.; Kuang, S.; Tang, L.; Zhang, Y.; Feng, L. Deficiency of dietary pyridoxine disturbed the intestinal physical barrier function of young grass carp (Ctenopharyngodon idella). Fish Shellfish Immunol. 2018, 74, 459–473. [Google Scholar] [CrossRef]
  44. Patel, R.; Myers, L.; Kurundkar, A.; Maheshwari, A.; Nusrat, A.; Lin, P. Probiotic bacteria induce maturation of intestinal claudin 3 expression and barrier function. Am. J. Pathol. 2012, 180, 626–635. [Google Scholar] [CrossRef] [Green Version]
  45. Günzel, D.; Yu, A. Claudins and the Modulation of Tight Junction Permeability. Physiol. Rev. 2013, 93, 525–569. [Google Scholar] [CrossRef] [PubMed] [Green Version]
  46. Ulluwishewa, D.; Anderson, R.; McNabb, W.; Moughan, P.; Wells, J.; Roy, N. Regulation of Tight Junction Permeability by Intestinal Bacteria and Dietary Components. J. Nutr. 2011, 141, 769–776. [Google Scholar] [CrossRef] [PubMed] [Green Version]
  47. Hansson, G.; Johansson, M. The inner of the two Muc2 mucin-dependent mucus layers in colon is devoid of bacteria. Gut Microbes. 2010, 1, 51–54. [Google Scholar] [CrossRef] [Green Version]
  48. Heazlewood, C.; Cook, M.; Eri, R.; Price, G.; Tauro, S.; Taupin, D.; Thornton, D.; Png, C.; Crockford, T.; Cornall, R.; et al. Aberrant mucin assembly in mice causes endoplasmic reticulum stress and spontaneous inflammation resembling ulcerative colitis. PLoS Med. 2008, 5, e54. [Google Scholar] [CrossRef] [PubMed] [Green Version]
  49. Fu, J.; Wei, B.; Wen, T.; Johansson, M.; Liu, X.; Bradford, E.; Thomsson, K.; McGee, S.; Mansour, L.; Tong, M.; et al. Loss of intestinal core 1-derived O-glycans causes spontaneous colitis in mice. J. Clin. Investig. 2011, 121, 1657–1666. [Google Scholar] [CrossRef] [Green Version]
  50. Hoseinifar, S.; Esteban, M.; Cuesta, A.; Sun, Y. Prebiotics and Fish Immune Response: A Review of Current Knowledge and Future Perspectives. Rev. Fish. Sci. Aquac. 2015, 23, 315–328. [Google Scholar] [CrossRef]
Figure 1. Digestive enzyme activities (U mg protein −1) of A. tropicus larvae (19 DAH) fed a diet supplemented with different levels of FOS (2.5, 5.0, and 7.5 g kg−1) and a diet without FOS (control diet) for 15 days. (a) acid protease, (b) alkaline protease, (c) trypsin, (d) chymotrypsin, (e) lipase, and (f) amylase. Values are mean ± SD. Significant differences between the diets are indicated by different letters (p < 0.05).
Fishes 07 00137 g001
Figure 2. Expression levels of intestinal barrier function genes in A. tropicus larvae (19 DAH) fed a diet supplemented with different levels of FOS (2.5, 5.0, and 7.5 g kg−1) and a diet without FOS (control diet) for 15 days. Tight junction proteins: (a) zo-1, (b) zo-2, (c) claudin-3, (d) claudin-12, (e) claudin-15, (f) claudin-17. Mucus layer protein: (g) muc-2. Cytokine pro-inflammatory: (h) il-8. The relative mRNA levels were measured by RT-qPCR using β-actin as the reference gene. Each bar represents the mean of the relative mRNA levels changes compared with larvae fed with control diet (dotted line). Values are mean ± SD. Significant differences between the diets are indicated by different letters (p < 0.05).
Fishes 07 00137 g002
Table 1. Composition of experimental diets with different concentrations of FOS.
FOS (g kg−1)
Ingredients (g kg−1)Control Diet2.557.5
Fish Meal a305.4305.4305.4305.4
Poultry meal a150150150150
Pork meal a150150150150
Soybean meal a150150150150
Starch b123.7121.2118.7116.2
Soybean oil c79.979.979.979.9
FOS d02.557.5
Mineral premix e5555
Vitaminic premix e10101010
Grenetin f20202020
Vitamin C g5555
Vitamin E h1111
Proximate composition (g kg−1 of dry matter)
Energy (kJ g−1)17.6717.6317.6717.81
Protein (%)43.5844.5143.2843.79
Ether extract (%)15.0114.3414.7315.03
Ash (%)15.0914.7414.2115.18
NFE 1 (%)26.3226.4127.7826
a Marine and agricultural proteins S.A. de C.V., Guadalajara, Jalisco; b Pronat Ultra, Merida, Yucatan, Mexico; c Ragasa Industries S.A. de C.V.; d Agaviótica, Monterrey, Nuevo Leon; e Vitamin premix composition g/mg or International Units per kg of diet: Vitamin A, 10,000,000 IU; Vitamin D3, 2,000,000 IU; Vitamin E, 100,000 IU; Vitamin K3, 4.0 g; Thiamine B1, 8.0 g; Riboflavin B2, 8.7 g; Pyridoxine B6, 7.3 g; Vitamin B12, 20.0 mg; Niacin, 50.0 g; Pantothenic acid, 22.2 g; Inositol, 0.15 mg; Nicotinic Acid, 0.16 mg; Folic Acid, 4.0 g; Biotin, 500 mg; Vitamin C, 10.0 g; Choline 0.3 mg, Excipient q.s. 2 g; Manganese, 10 g; Magnesium, 4.5 g; Zinc, 1.6 g; Iron, 0.2 g; Copper, 0.2 g; Iodine, 0.5 g; Selenium, 40 mg; Cobalt 60 mg. Excipient q.s. 1.5 g; f D’gari, food and diet products relámpago, S.A. de C.V.; g,h ROVIMIX® STAY-C® 35–DSM, Guadalajara, Mexico; NFE 1 = Nitrogen-free extract:100−(% protein-% etherel extrac-% ash-% fiber).
Table 2. Primers used for qPCR analysis.
Target GenePrimer Sequence (5′-3′)Amplification Efficiency (%)R2Amplicon Size (bp)Reference
zo-1FW: TGTGCCTCAGATCACTCCAC
RV: AAAGGCAGAGGGTTGGCTTC
98.580.95123This study
zo-2FW: TACCCATGGAAAATGTGCCTCA
RV: CGGGGTCTCTTCACGGTAAT
95.290.9888This study
claudin-3FW: CCTGTATATCGGCTGGGCTG
RV: TGCAAGCTAACGACTACGCA
98.840.91285This study
claudin-12FW: CGCAGGAAAAGGAGACCAATTT
RV: CTGCTCAAAACAGCCTCCAAG
96.060.93105This study
claudin-15FW: ATCCCGGGACAAAGTACGAG
RV:CAGATCGCTAGCAAGGCAGA
97.630.9370This study
claudin-17FW: GCAAACGGAATCATCCGAGC
RV: TACAGCAGGAGGGCACAATG
96.950.91261This study
il-8FW: ATATTCACTGGTGGGCGGAG
RV: GTGCGGCCTGAGATTGTTT
94.180.96369This study
muc-2FW: GGCCTCCTCAAGAGCACGGTG
RV:TCTGCACGCTGGAGCACTCAATG
90.94-100[24]
β-actinFW: GGACTTTGAGCAGGAGATGG
RV:GACGGAGTATTTACGCTCTGG
89.91-355[24]
Table 3. Growth indexes and survival rate (mean ± standard deviation, SD) of A. tropicus larvae fed with a diet supplemented with different levels of FOS (2.5, 5, and 7.5 g kg−1) and a diet without FOS (control diet) for 15 days.
FOS (g Kg−1)
Control Diet2.557.5
initial weight (g)0.03 ± 0.0060.03 ± 0.0060.03 ± 0.0060.03 ± 0.006
final weight (g)0.12 ± 0.001 b0.10 ± 0.009 c0.09 ± 0.001 d0.13 ± 0.0005 a
initial lenght (cm)1.69 ± 0.121.69 ± 0.121.69 ± 0.121.69 ± 0.12
final lenght (cm)3.13 ± 0.01 a2.78 ± 0.04 b2.79 ± 0.08 b3.11 ± 0.02 a
FI (g d−1)0.04 ±0.0040.05 ± 0.140.04 ± 0.110.06 ± 0.016
WG (%)302.4 ± 5.01 b253.01 ± 30.50 c208.2 ± 4.31 d355.35 ± 1.79 a
SGR (% d−1)9.73 ± 0.09 b8.76 ± 0.64 c7.79 ± 0.10 d10.63 ± 0.03 a
CF0.39 ± 0.002 b0.49 ± 0.064 a0.43 ± 0.041 ab0.45 ± 0.008 ab
FCE23.38 ± 3.8823.29 ± 8.2232.18 ± 4.4425.97 ± 3.05
PER0.09 ± 0.01 ab0.10 ± 0.03 a0.06 ± 0.009 b0.08 ± 0.01 ab
S (%)17.33 ± 0.94 b22.57 ± 1.07 ab17.39 ± 2.04 b24.18 ± 1.74 a
FI: feed intake; WG: weight gain; SGR: specific growth rate; CF: condition factor; FCE: the feed conversion factor; PER: the protein efficiency ratio; S: the survival rate. Values are mean ± SD. Significant differences between the diets are indicated by different letters (p < 0.05).
Publisher’s Note: MDPI stays neutral with regard to jurisdictional claims in published maps and institutional affiliations.

