Article

Molecular Characterization of Aquaporins Genes from the Razor Clam Sinonovacula constricta and Their Potential Role in Salinity Tolerance

1
School of Marine Sciences, Ningbo University, Ningbo 315211, China
2
Key Laboratory of Aquatic Germplasm Resources of Zhejiang, Zhejiang Wanli University, Ningbo 315100, China
*
Author to whom correspondence should be addressed.
Fishes 2022, 7(2), 69; https://doi.org/10.3390/fishes7020069
Submission received: 28 January 2022 / Revised: 13 March 2022 / Accepted: 15 March 2022 / Published: 18 March 2022

Abstract

:
Aquaporins (AQPs) play crucial roles in osmoregulation, but the knowledge about the functions of AQPs in Sinonovacula constricta is unclear. In this study, Sc-AQP1, Sc-AQP8, and Sc-AQP11 were identified from S. constricta, and the three Sc-AQPs are highly conserved compared to the known AQPs. The qRT-PCR analysis revealed that the highest mRNA expressions of Sc-AQP1, Sc-AQP8, and Sc-AQP11 were detected in the gill, digestive gland, and adductor muscle, respectively. In addition, the highest mRNA expression of Sc-AQP1 and Sc-AQP11 was detected in the D-shaped larvae stage, whereas that of SC-AQP8 was observed in the umbo larvae stage. The mRNA expression of Sc-AQP1, Sc-AQP8, and Sc-AQP11 significantly increased to 12.45-, 12.36-, and 27.44-folds post-exposure of low salinity (3.5 psu), while only Sc-AQP1 and Sc-AQP11 significantly increased post-exposure of high salinity (35 psu) (p < 0.01). The fluorescence in situ hybridization also showed that the salinity shift led to the boost of Sc-AQP1, Sc-AQP8, and Sc-AQP11 mRNA expression in gill filament, digestive gland, and adductor muscle, respectively. Knockdown of the Sc-AQP1 and Sc-AQP8 led to the decreased osmotic pressure in the hemolymph. Overall, these findings would contribute to the comprehension of the osmoregulation pattern of AQPs in S. constricta.

1. Introduction

Aquaporins (AQPs) are one-of-a-kind small integral membrane proteins with transmembrane channels that have high water permeability in specific biological membranes [1]. They are responsible for sustaining net water movement at a rate suitable for fulfilling cellular or transcellular functions in animals, plants, and prokaryotes [2,3,4,5]. AQPs, also known as major integral proteins (MIPs), exist on the surface of the cell membrane as a tetramer [6]. Each AQP’s monomer contains water pores [6] and commonly includes six membrane-spanning α-helices packed to form part of a trapezoid-like structure [7,8], which is relative to the water transportation.
To date, numerous kinds of AQP genes, with different classifications in their biological function in transporting water and other small molecules, have been identified in vertebrates and invertebrates [6]. For instance, at least 13 definite AQP isoforms have been identified in vertebrates, whereby AQPs can be divided into four grades corresponding to classical AQP, aquaglyceroporins (AQGPs), S-aquaporin, and AQP-8 type ones [9]. In addition, the invertebrate MIPs are located in classical AQP and AQP8-type grades based on the evolutionary framework [6]. Nevertheless, only a few studies have considered the aquatic animals as the models; they can also represent an excellent animal model to investigate the water transport activity of AQP in response to the changeable ambient salinity [10].
The razor clam (Sinonovacula constricta) (Lamarck, 1818), a marine shellfish species with high commercial value, has been widely cultured in muddy intertidal zones due to its fast growth and high nutritional value [11]. Recently, the industry of razor clam has greatly expanded, but its growth is being affected significantly by the dramatic changes in salinity at rearing ponds, thereby resulting in enormous economic losses [12]. Significantly, the processes of ion and water transport in the gills lead to the variation of osmotic pressure [13]. The current researches are mostly concerned with studying membrane-bound ion channels and exchangers and intercellular tight junctions, giving rise to an advanced molecular pathway involved in ion transport [14]. However, little research has been conducted to investigate the molecular pathways of water transport in shellfish. Thus, there are still uncertainties at the molecular level regarding water transport mechanisms, especially across different anatomical sections of the organs, because different species have various water transport mechanisms [14].
In this study, to investigate the potential role of AQPs of S. constricta in salinity tolerance, three new AQPs isoforms from S. constricta, denoted as Sc-AQP1, Sc-AQP8, and Sc-AQP11, were cloned and characterized. Then, their expression profiles in different tissues and developmental stages were examined. Furthermore, RNA interference (RNAi) technology and fluorescence in situ hybridization (FISH) were used to explore the potential functions of three Sc-AQPs on osmotic pressure regulation of the hemolymph under different salinities.

2. Materials and Methods

2.1. Animal Cultivation

Healthy juvenile razor clams (mixed sexes) with an average shell length of 4.0 ± 0.5 cm were collected from Yinzhou Danyan Aquaculture Field (salinity of 18 psu, pH 8.2, 19–25 °C) in Ningbo, Zhejiang Province, China, and then cultured in the genetic breeding research center of Zhejiang Wanli University. These clams came from the same family line and shared an identical genetic background. The laboratory conditions set for clams’ cultivation were similar to the collection point in the field. Collected clams were acclimatized in 100 L aerated seawater with a salinity level of 18 psu and pH range of 8–8.5 at 24 ± 1 °C. Five hundred and fifteen clams were kept in the laboratory for two weeks prior to the following experiments, including tissue distribution analysis (5 clams), salinity challenge experiments (300 clams), and RNA interference (210 clams). During the acclimatization period, Chaetoceros calcitrans (Takano, 1968) and Platymonas helgolandica Kylin var. tsingtaoensis were used as a diet source for razor clam. The seawater was refreshed twice daily after feeding the microalgae for 4 h. Embryos and larvae were reared in hatching tanks in 18 psu salinity seawater, fed with Isochrysis galbana Parke 8701 (1949) and C. meülleri Lemmerman. During the period of animal cultivation, the pH, temperature, and salinity of seawater were monitored by using HD40 (HACH, Loveland, CO, USA) and BEC-600 (BELL, Dalian, Liaoning, China), respectively.

2.2. Tissue and Spatiotemporal Expression Analysis

Five clams were dissected to investigate the distribution of Sc-AQP1, Sc-AQP8, and Sc-AQP11 in different tissues, including the gill, intestine, kidney, digestive gland, siphon, mantle, foot, and adductor muscle. Additionally, embryos and larvae from ten different developmental stages (unfertilized mature eggs, fertilized eggs, 4 cells, blastula, gastrulae, trochophore, D-shaped larvae, umbo larvae, eyebot larvae, and juvenile clams) were collected and immediately frozen in liquid nitrogen. Two hundred samples were included in each developmental stage. The samples were then stored at −80 °C prior to total RNA extraction and following quantitative real-time (qRT-PCR) analysis.

2.3. Low- and High-Salinity Challenges

Based on the 50% lethal dose (LD50) test of salinity, the levels of salinity lethal to 50% of razor clam were determined to be 3.5 and 35 psu in 168 h (data not shown). Then the salinity levels of 3.5 and 35 psu were set as the low-salinity and high-salinity pressure. To investigate the temporal expression profile of Sc-AQP1, Sc-AQP8, and Sc-AQP11 after low-salinity and high-salinity treatment, razor clams were randomly divided into three groups, with each group containing 300 clams: two experimental groups (Group 1 and Group 2) and one control group. For Group 1, razor clams were transferred from 18 to 3.5 psu for the acute low-salinity stress, while razor clams in Group 2 were transferred from 18 to 35 psu for the acute high-salinity stress. The razor clams in the control group were continuously cultured in filtrated natural seawater (collected from Xiangshan harbour, Ningbo, Zhejiang province) of 18 psu. The 3.5 psu seawater was prepared by diluting seawater with tap water, while the 35 psu seawater was prepared by adding artificial sea salt to the natural seawater. The temperature was kept at 24 °C throughout the whole experiment. The clams were cultured in different salinity levels for 72 h. The hemolymph sample from five clams was collected at different sampling times (0, 2, 4, 8, 12, 24, 48, and 72 h) post-exposure. The osmotic pressure of hemolymph was measured by using the Gonotec OSMOMAT 3000 (Gonotec GmbH, Berlin, Germany). The gill samples from fifteen clams were collected simultaneously. Samples were rapidly frozen in liquid nitrogen and stored at −80 °C prior to the total RNA extraction and following qRT-PCR analysis. In addition, gill, digestive gland, and adductor muscle samples were collected separately from three groups at 48 h for the following FISH analysis.

2.4. RNA Isolation and Reverse Transcription

Total RNA was extracted from the clam samples collected at different tissues and developmental stages, using RNAiso Plus reagent (TaKaRa, Dalian, China). The RNA was then treated with RNase-free DNase (TaKaRa, Dalian, China) to eliminate contaminating genomic DNA. The quantity and quality of purified RNA were assessed by spectrophotometry and electrophoresis on 1% agarose gels. RNA samples with OD 260/280 of 2.0 and most intense smear between 400 bp and 4 kb were processed further for the first-strand complementary DNA (cDNA) synthesized. The cDNA was synthesized by using Prime Script™ Reverse Transcription Kit (TaKaRa, Dalian, China). The synthesized cDNA product was 10-times diluted and stored at −20 °C until further analysis.

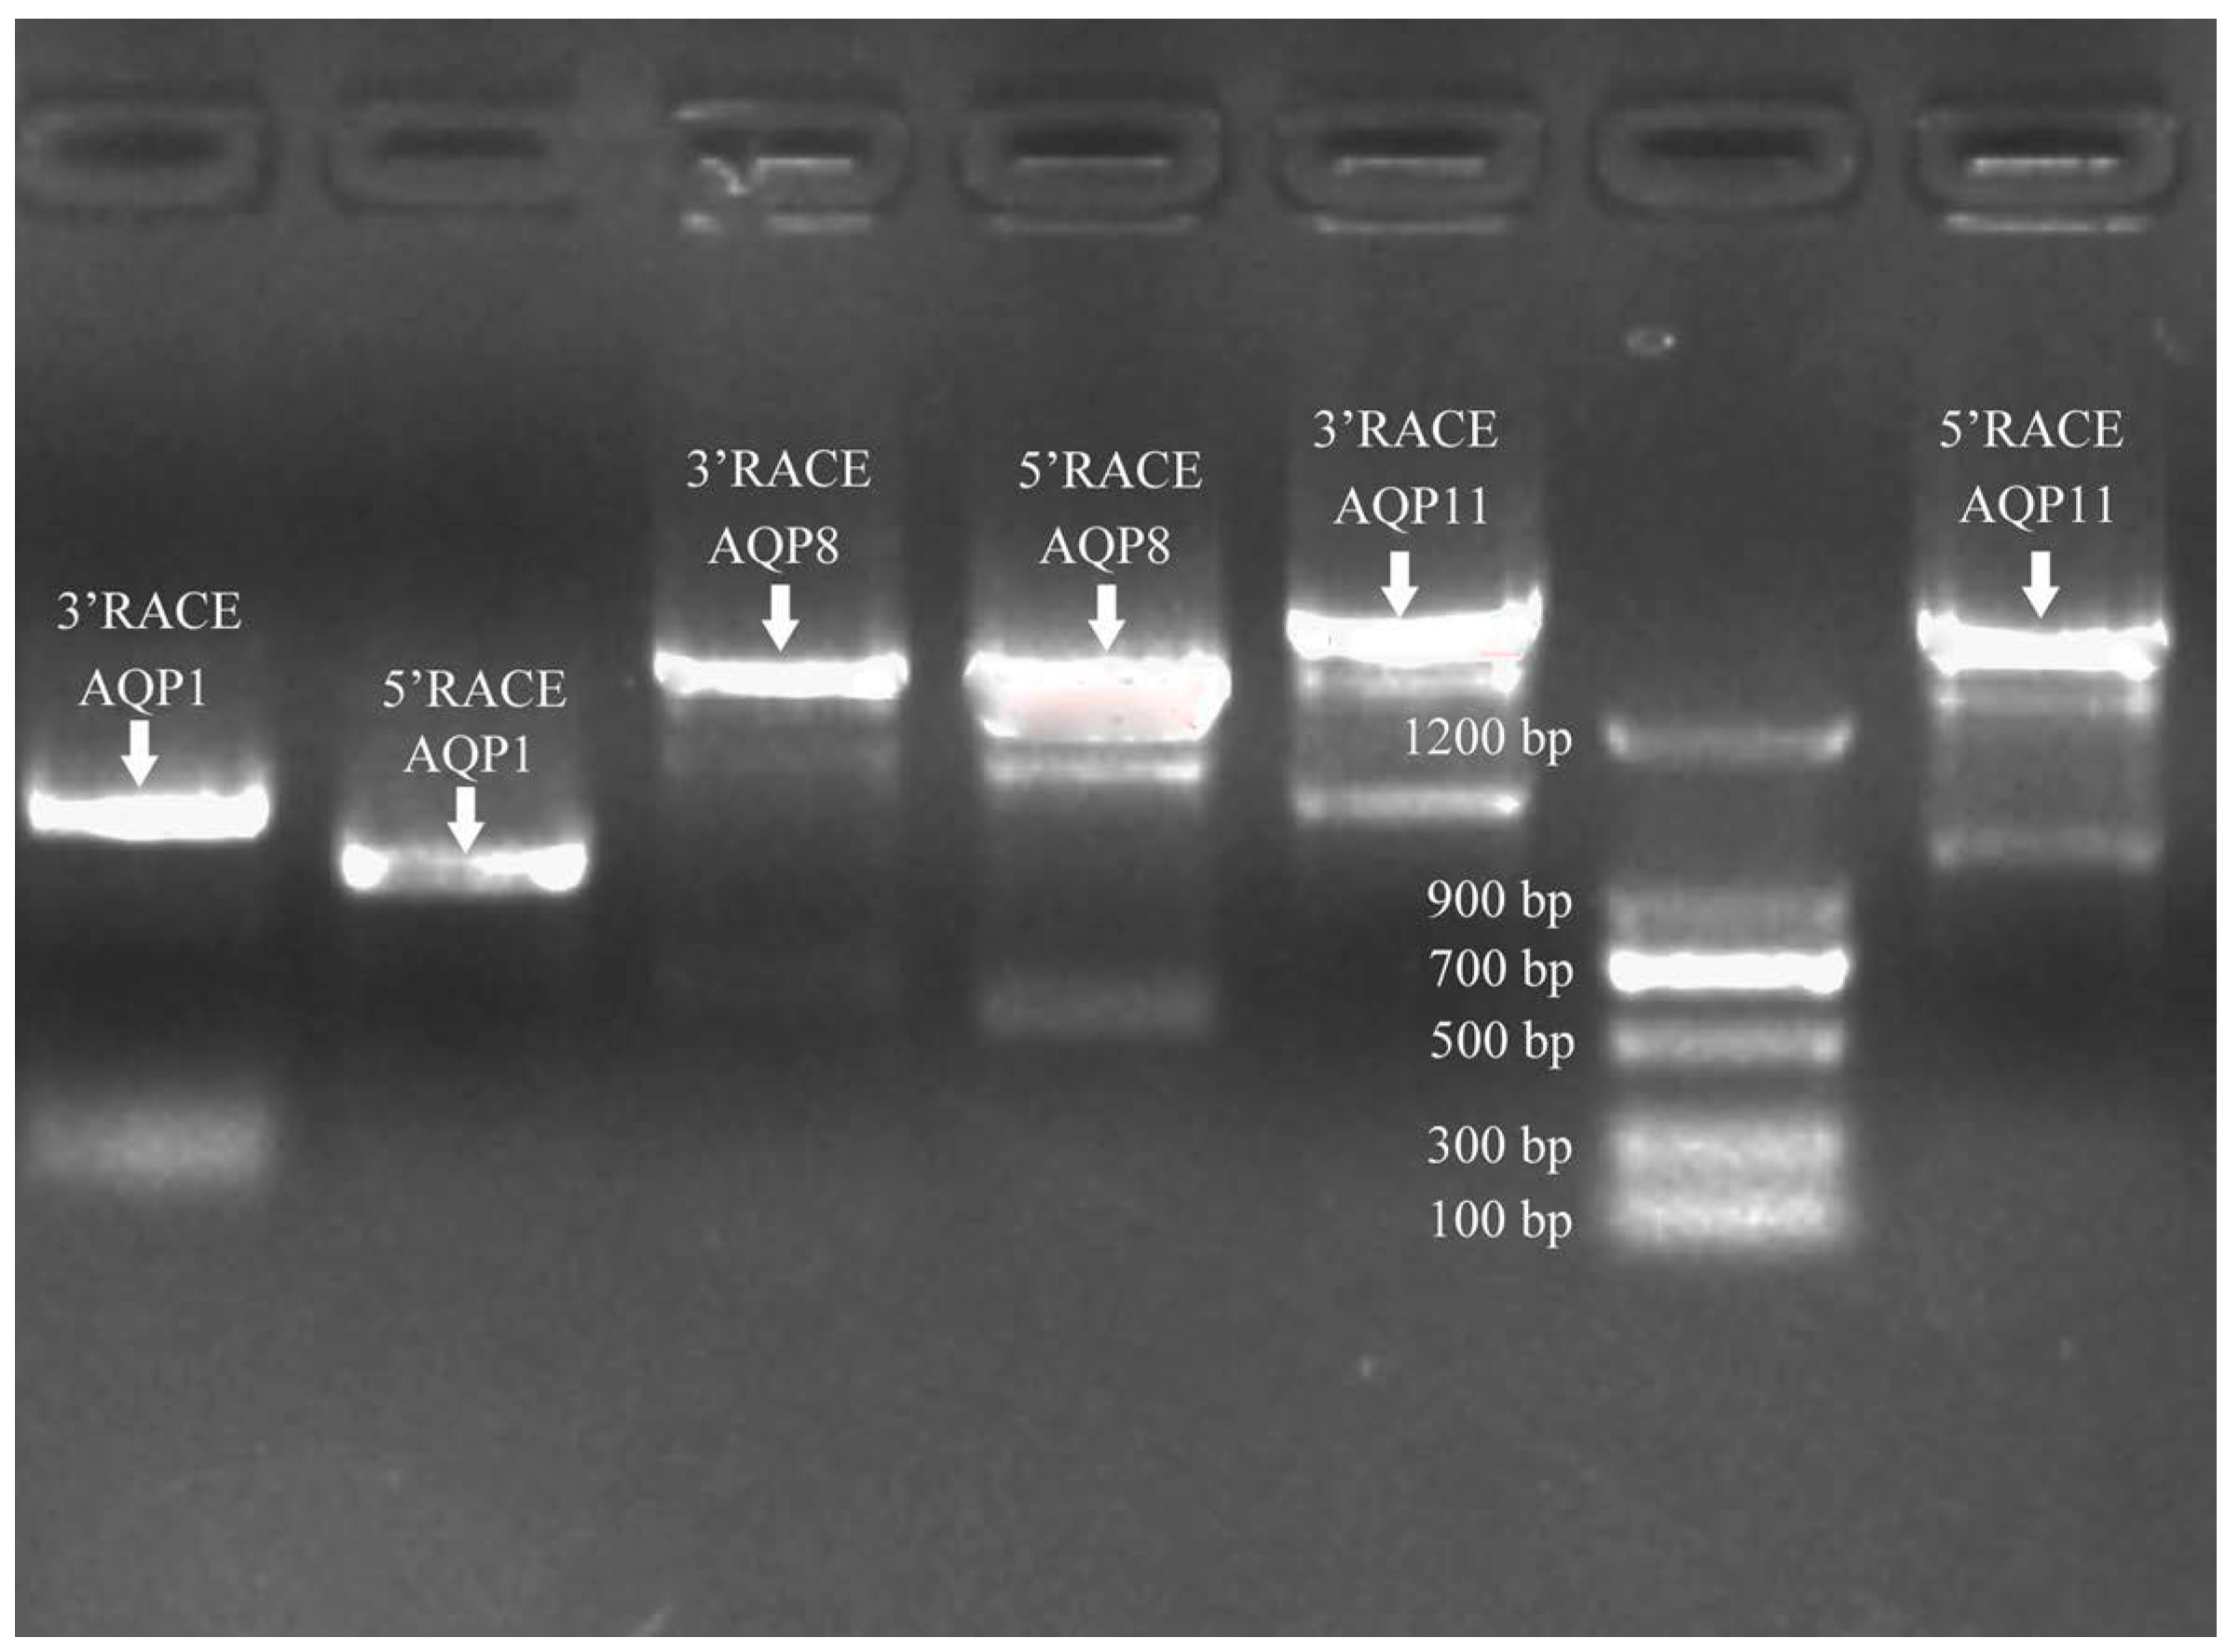
2.5. Cloning of Sc-AQP1, Sc-AQP8, and Sc-AQP11 cDNA Sequence

To amplify the cDNA ends (5′ and 3′ RACE) of Sc-AQP1, Sc-AQP8, and Sc-AQP11, three pairs of primers were designed according to the known transcriptome data of S. constricta (SRX6707291) and listed in Table 1. The first-strand cDNA was synthesized by using the SMART RACE cDNA Amplification Kit (Clontech, Mountain View, CA, USA), and the touchdown PCR program was performed by following the manufacturer’s instruction. The targeted PCR products were then purified and cloned into pEasy-T1 vector (Transgen, Beijing, China). Positive clones were sent to the company (Sangon, Shanghai, China) for sequencing.

2.6. Bioinformatics Sequence Analysis

The nucleotide sequences of Sc-AQP1, Sc-AQP8, and Sc-AQP11 were analyzed by using the DNAStar 7.0 software. The protein sequence and the open reading frame (ORF) were predicted by using the ExPASy translation tools (http://www.expasy.ch/, accessed on 1 October 2020.) and ORF Finder (https://www.ncbi.nlm.nih.gov/orffinder/, accessed on 3 October 2020), respectively. The signal peptide and domain were predicted by using the Signal P software (http://www.cbs.dtu.dk/services/Signal%20P, accessed on 15 October 2020) and Simple Modular Architecture Research Tool (http://smart.embl-heidelberg.de/, accessed on 20 December 2020), respectively. The physicochemical characteristics, protein 3D structure, ligand-binding site, and transmembrane helices of the protein sequence were predicted according to the method mentioned in previous research [15].

2.7. Multiple Sequences Alignment and Phylogenetic Analysis

The homology search of the amino acid sequence of Sc-AQP1, Sc-AQP8, and Sc-AQP11 was performed by using BlastX algorithm at the National Center for Biotechnology Information (http://www.ncbi.nlm.nih.gov/BLAST/, accessed on 7 January 2021). A total of 80 AQP sequences were used to construct the phylogenetic tree, and the detailed information of these sequences was listed in Table S1. The multiple sequence alignments of Sc-AQPs were aligned by using ClustalW analysis program, and the aligned sequences were subsequently imported in MEGA 7.0 software to construct a phylogenic tree. Only 1000 data bootstrap replications calculated in the neighbor-joining method were used for the phylogenic tree construction.

2.8. qRT-PCR Analyses

To determine the relative expression levels of Sc-AQP1, Sc-AQP8, and Sc-AQP11 genes, qRT-PCR was carried out by using a Light Cycler 480 instrument (Roche, Basel, Switzerland) with the synthesized total cDNA as a template. Primer sequences for each gene were designed by using the program of Primer 5 software and are listed in Table 1. Each qRT-PCR reaction was performed in a total volume of 20 μL mixture containing 0.8 μL of cDNA, 1 μL of forward primer, 1 μL of reverse primer, 7.2 μL of PCR-grade water, and 10 μL of 2× SYBR Green Supermix (Bio-Rad, Hercules, CA, USA). All qRT-PCR reactions were set up as follows: pre-incubation step at 95 °C for 5 min, followed by 40 cycles of denaturing at 95 °C for 10 s and annealing at 61 °C for 20 s. A melting curve analysis was conducted to confirm that a single PCR product was produced by each pair of primers during the reaction. All samples were measured in technical triplicate. The relative expression level of each gene was normalized to 18S rRNA gene and subsequently calculated according to the standard 2-ΔΔCT method [16].

2.9. RNA Interference

Double-stranded RNAs (dsRNA) and small interfering RNA (siRNA) specific to the Sc-AQP1, Sc-AQP8, and Sc-AQP11 were designed by using the SnapDragon-dsRNA Design tool and Small Interfering RNA (DSIR) webtool (https://www.flyrnai.org/cgi-bin/RNAi_find_primers.pl, accessed on 11 March 2021), respectively. The dsRNA and siRNA were generated by using the T7 RNAi Transcription Kit (Vazyme, Nanjing, China) with primers listed in Table 1. The synthesized dsRNA and siRNAs were subsequently purified by using Monarch RNA Cleanup Kit (NEB, Ipswich, MA, USA), diluted to 1 μg/μL, and stored at −80 °C prior to the injection. Two hundred and ten clams from normal salinity group (18 psu) were randomly divided into 7 groups, and 30 clams in each group were intramuscularly (adductor muscle) injected with different solutions as follows: 100 μL of dsRNA-Sc-AQP1 and 100 μL of siRNA-Sc-AQP1 for Sc-AQP1-silenced groups, 100 μL of dsRNA-Sc-AQP8 and 100 μL of siRNA-Sc-AQP8 for Sc-AQP8-silenced groups, 100 μL of dsRNA-Sc-AQP11 and 100 μL of siRNA-Sc-AQP1 for Sc-AQP11-silenced groups, and 100 μL of diethylpyrocarbonate (DEPC)-treated water for the control group. Five clams were collected from each group at every sampling time (0, 12, 24, 48, 72, and 96 h). The gill, digestive gland, and adductor muscle were sampled to detect the relative expression of Sc-AQP1, Sc-AQP8, and Sc-AQP11, respectively. The osmotic pressure of hemolymph was measured simultaneously by using the Gonotec OSMOMAT 3000 (Gonotec GmbH, Berlin, Germany).

2.10. Fluorescence In Situ Hybridization

RNA probes labeled with digoxigenin (DIG) were prepared from the cDNA of Sc-AQP1, Sc-AQP8, and Sc-AQP11 by using a T7 High-Efficiency Transcription Kit (TransGen, Beijing, China) and DIG RNA labeling kit (Roche, Basel, Switzerland). The FISH analysis of Sc-AQP1, Sc-AQP8, and Sc-AQP11 was conducted on the paraffin section of gill, digestive gland, and adductor muscle, respectively. The preparation of the paraffin section and the subsequent procedure of FISH were handled according to the method mentioned in previous research [17]. The expression of each gene in different tissues was observed by using a fluorescence microscope (Nikon, 80i, Tokyo, Japan).

2.11. Statistical Analysis

All statistical analyses were performed with the SPSS 13.0 statistical package (IBM, Manassas, VA, USA). All experimental data were presented as mean ± standard error (SE). The Kolmogorov–Smirnov test was used to inspect the normality and homogeneity of variance of all the data. Data with normal distribution were statically analyzed by using one-way ANOVA with the Least Significance Difference (LSD) test. For all comparisons, a p-value < 0.05 was considered statistically significant.

3. Results

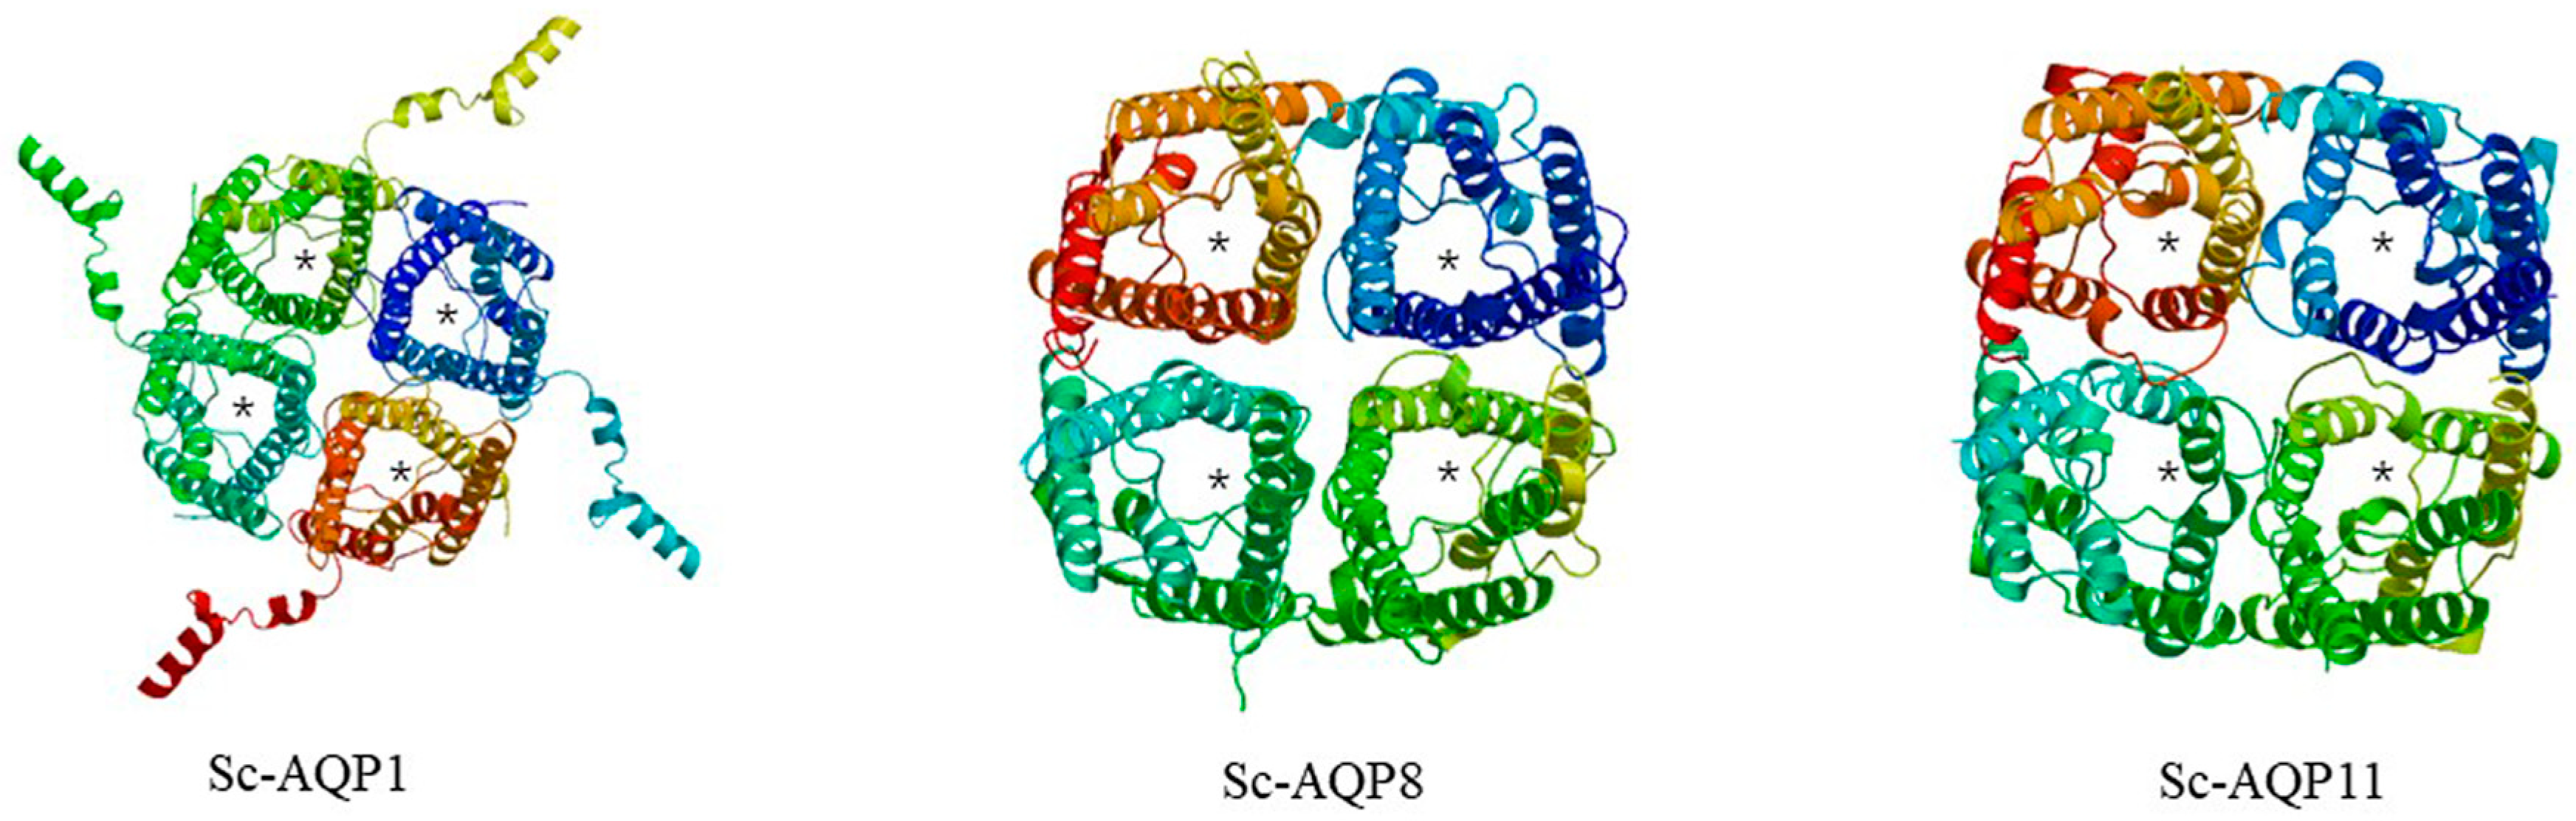
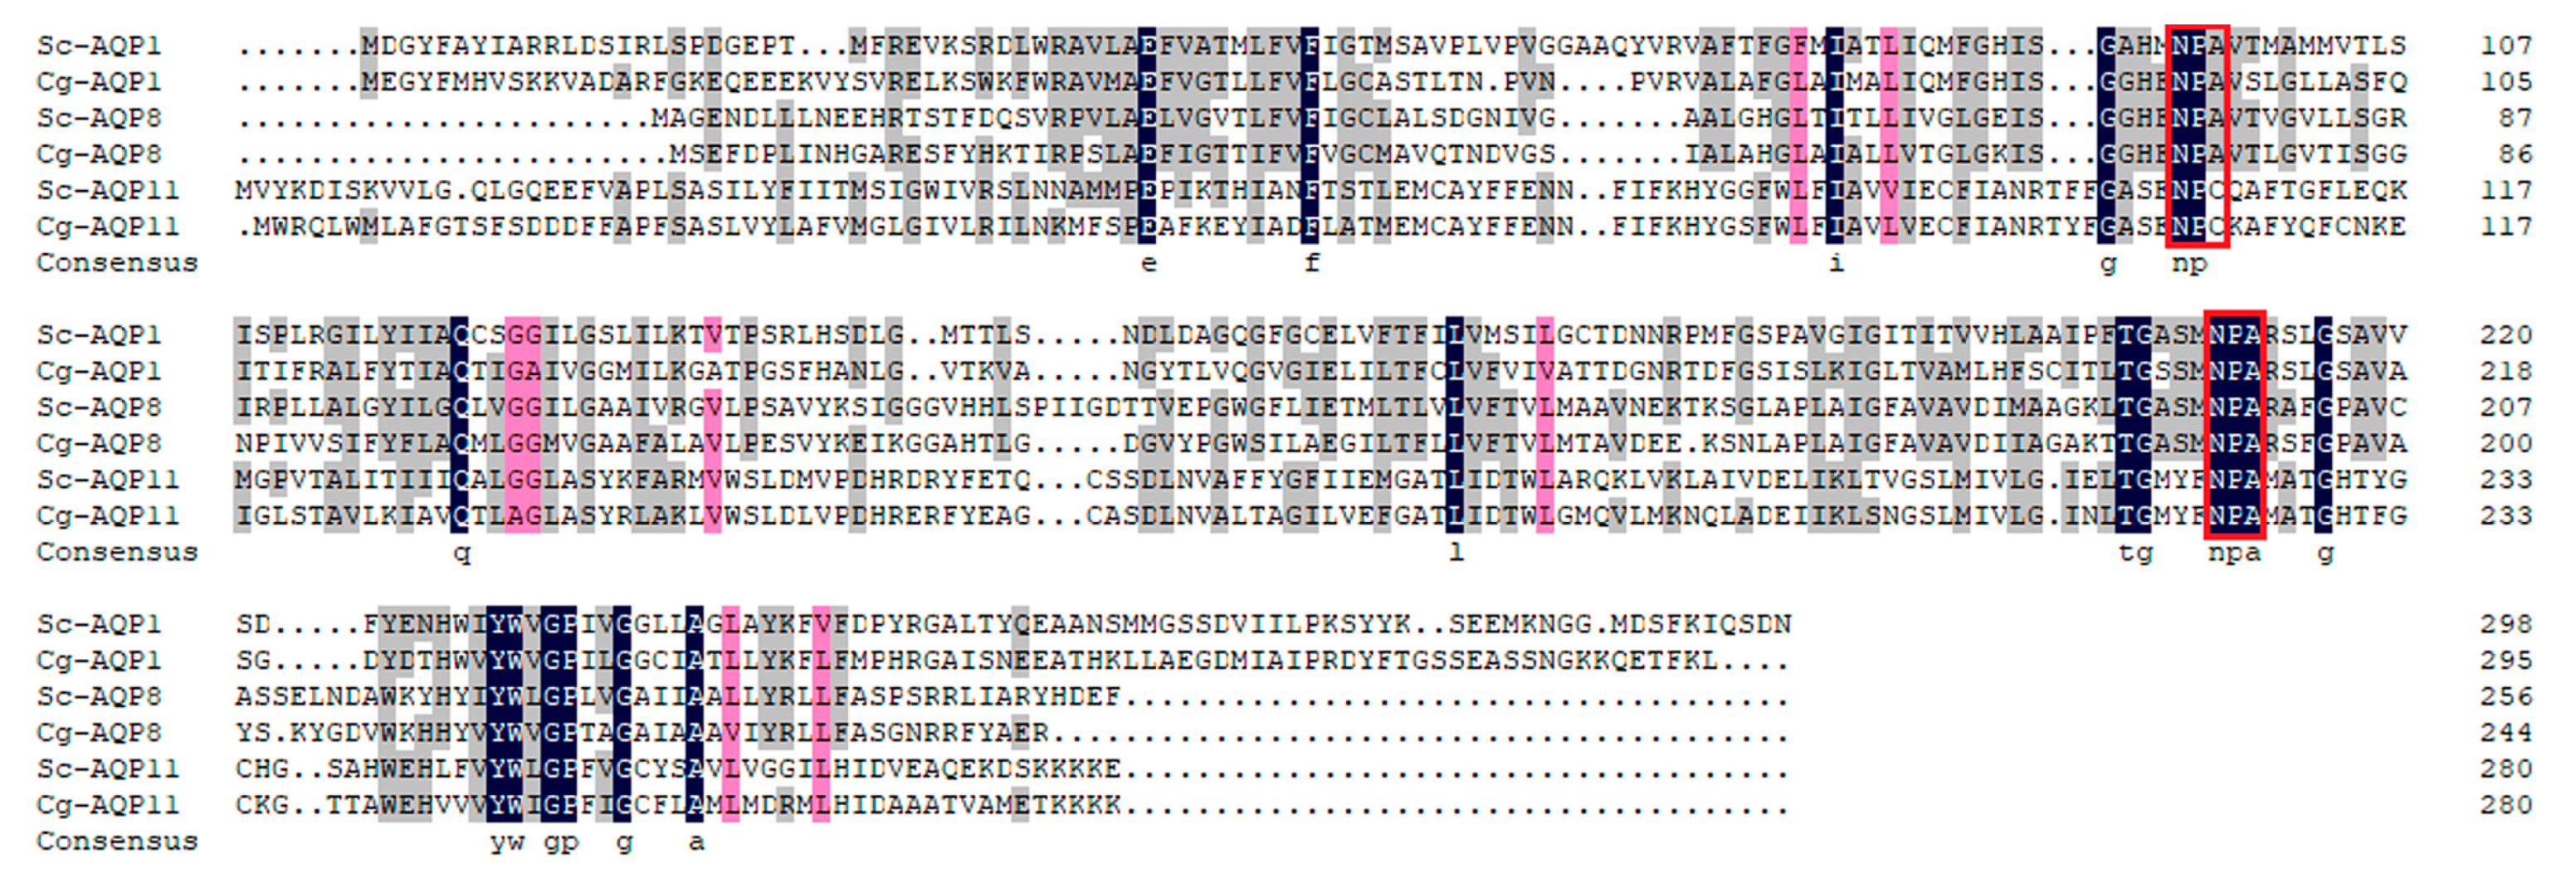
3.1. Sequence Features of Sc-AQP1, Sc-AQP8, and Sc-AQP11

The entire genome sequences of Sc-AQP1, Sc-AQP8, and Sc-AQP11 were all obtained by using 3′RACE and 5′RACE amplification (Figure 1). The completed cDNA sequence of Sc-AQP1, Sc-AQP8, and Sc-AQP11 was deposited in GenBank under accession numbers MN186579, MN186580, and MN186581, respectively. The sequence features of each gene are listed in Table 2. The complete ORF of each gene included a downstream in-frame stop codon and a polyadenylation signal (AATAA motif) before the poly-A tail. According to the topology prediction of these proteins, three Sc-AQPs contained six putative transmembrane domains, five connecting loops, and a cytoplasmic N- and C-terminal domain. In addition, Sc-AQP1, Sc-AQP8, and Sc-AQP11 contained 6, 8, and 4 ATTTA motifs in their 3′-UTR, respectively. As displayed in Figure 2, typical AQP structures including monomers containing water pores and tetramers were observed in the three Sc-AQPs. Notably, the two channel-forming NPA signature motifs were found at amino acid positions 95–97 and 210–212 in Sc-AQP1 and positions 75–77 and 197–199 in Sc-AQP8. In contrast to Sc-AQP1 and Sc-AQP8, the Sc-AQP11 had only one highly conserved NPA sequence, with other NPA motifs replaced by Asn-Pro-Cys (NPC) motifs (Figure 3).
The BlastX analysis revealed that the three Sc-AQPs shared high amino acid sequence identity and similarity with mollusk counterparts compared to other species (Table 3). The Sc-AQP1 shared the highest identity (47%) and similarity (66.2%) with Aplysia californica (J. G. Cooper, 1863) (Table 3). The amino acid sequence of Sc-AQP8 shared 46.1–54.7% identity and 60.3–67.6% similarity to the AQP8 of mollusk, particularly with the highest identity (54.7%) and similarity (67.6%) to C. gigas. Similarly, the amino acid sequence of Sc-AQP11 had more than 65% similarity to that of AQP11 molecules of mollusk, excluding Biomphalaria glabrata (Say, 1818) (63.6%).
The pairwise comparison showed that the amino acid sequence of Sc-AQP1 shared 27.5% identity and 39.6% similarity with that of Sc-AQP8, but that of Sc-AQP1 shared only 11.3% identity and 21.6% similarity with that of Sc-AQP11 (Table 3). Predicted protein chemistry properties also showed a similarity between Sc-AQP1 and Sc-AQP8 in molecular weight and pI. In addition, multiple sequence alignments revealed 10.4–46.1% identity and 20.2–65.5% similarity in the amino acid sequence of Sc-AQP1, Sc-AQP8, and Sc-AQP11 with My-AQP1, My-AQP8, and My-AQP11, respectively (Table 3).

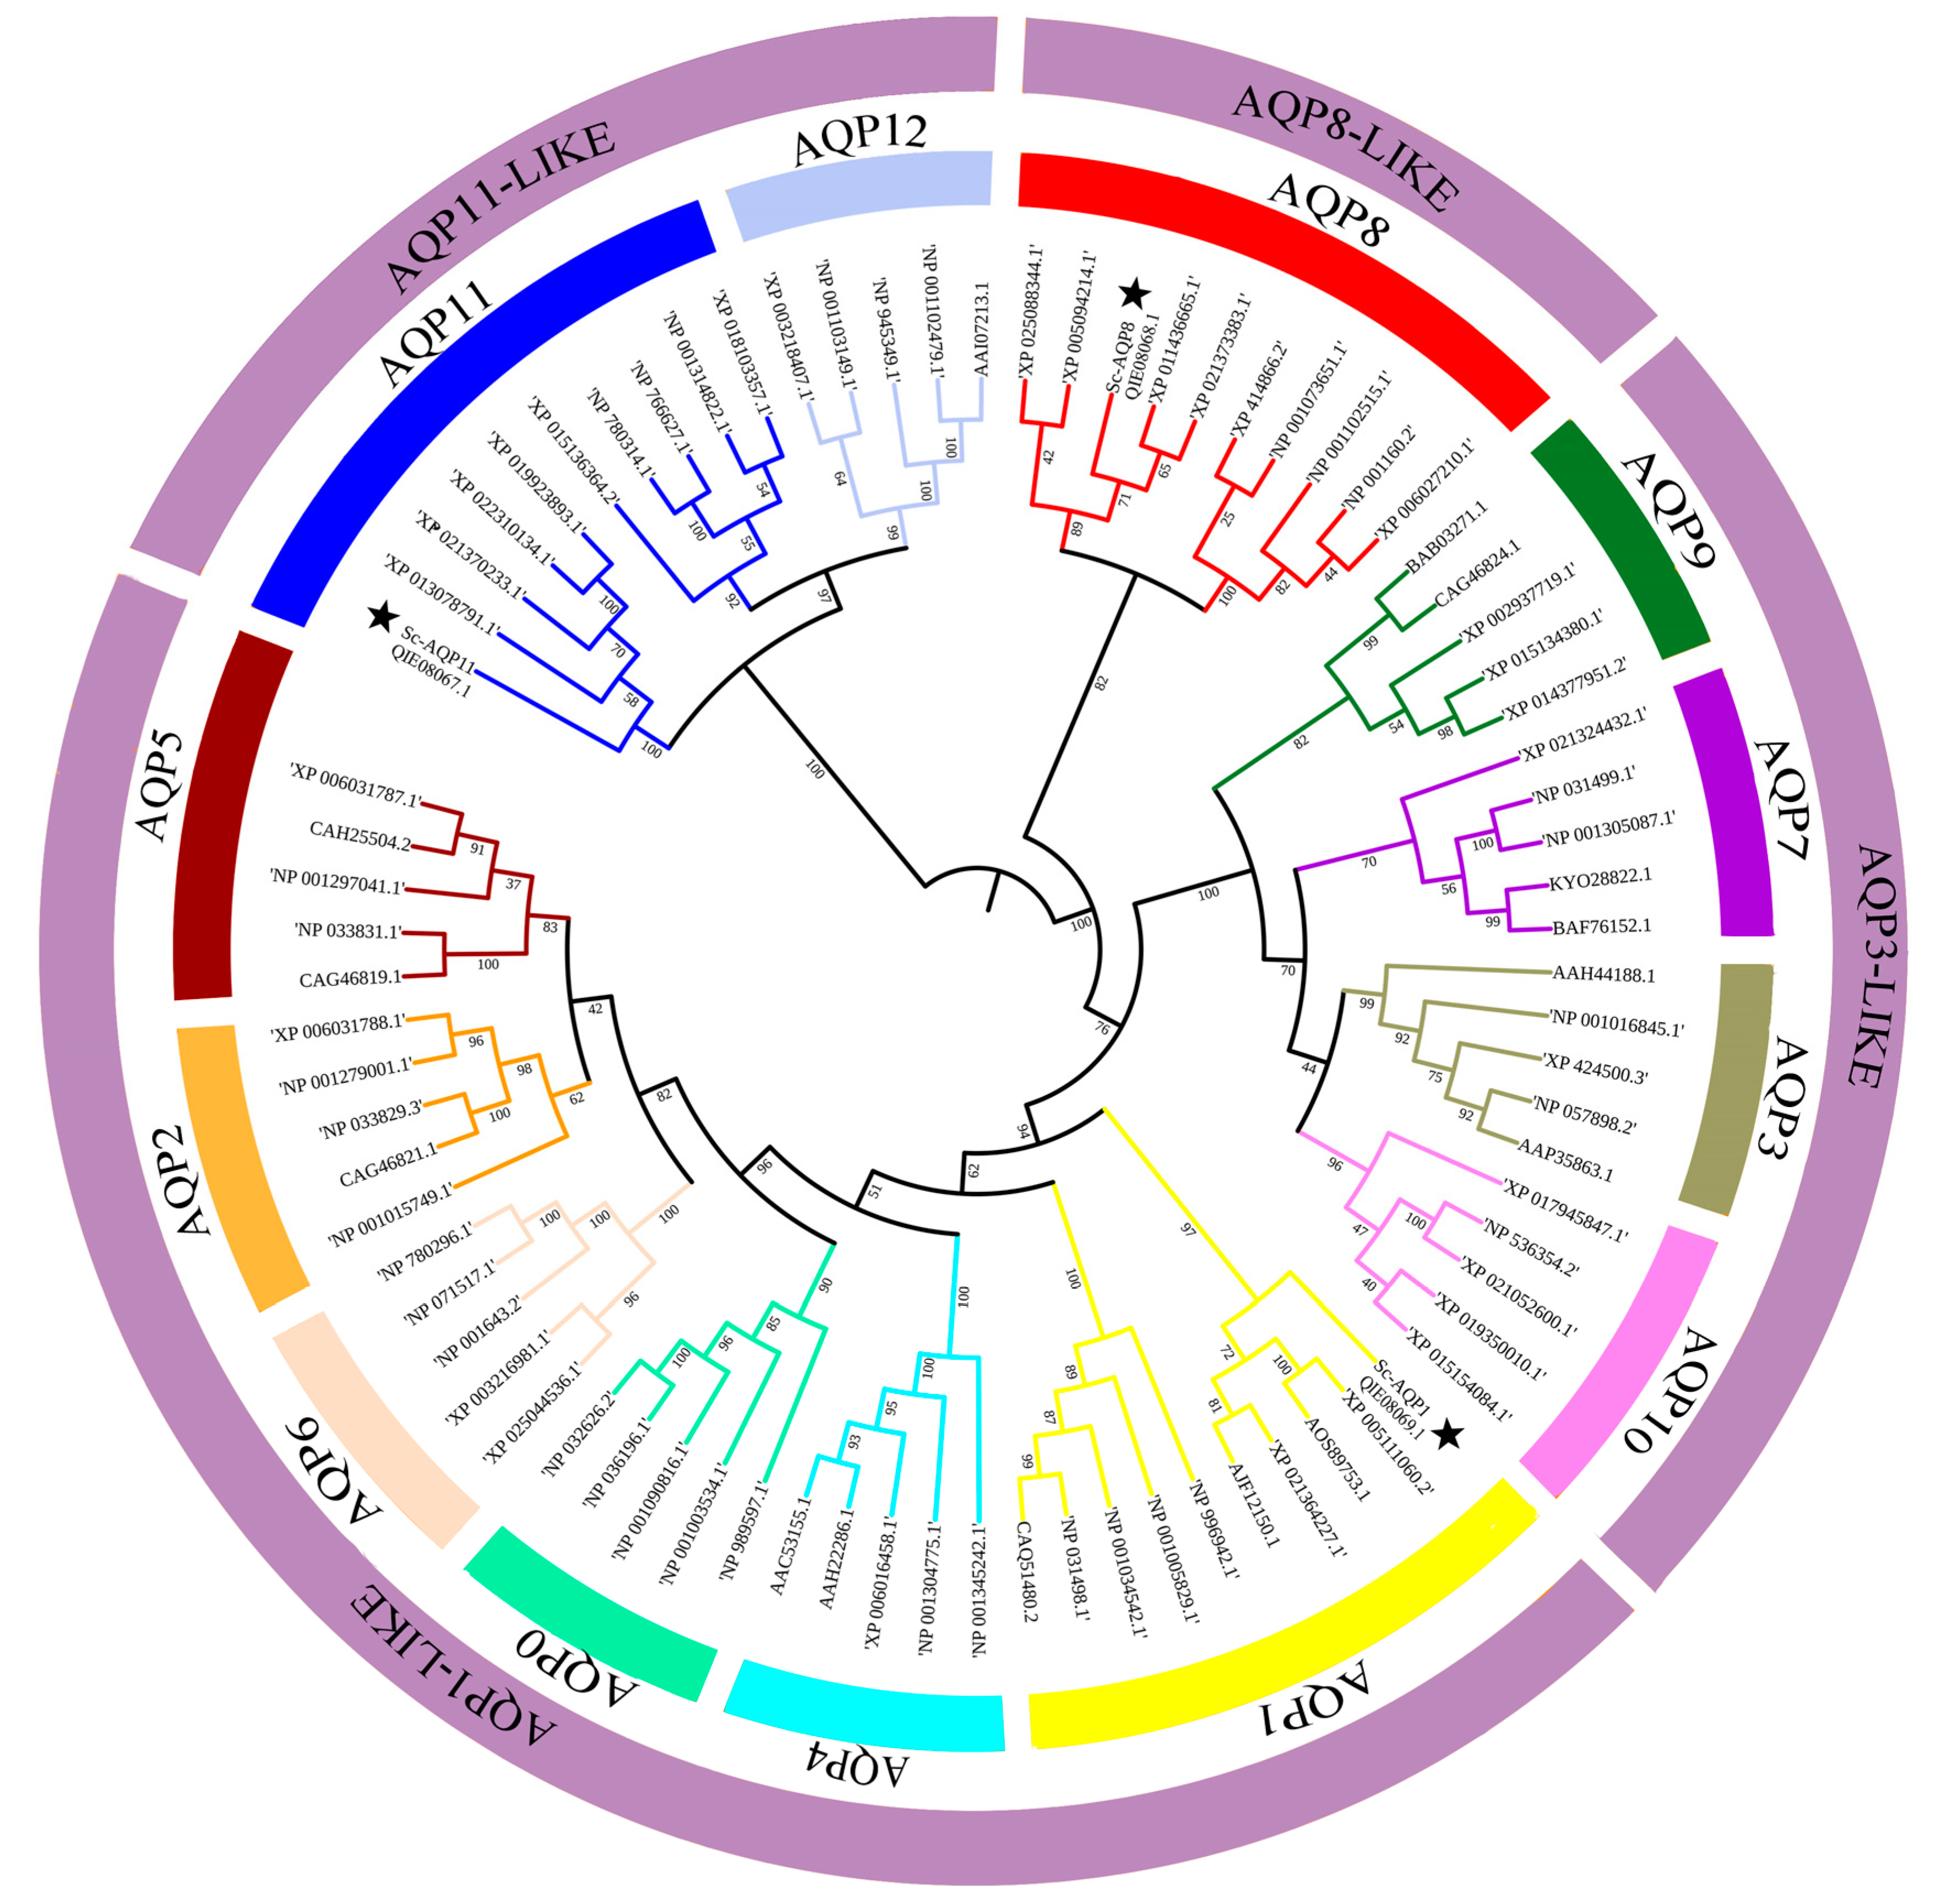
3.2. Phylogenetic Tree Analysis

To elucidate the phylogenetic relationship of the three Sc-AQPs with other species, a phylogenetic tree was constructed. Results revealed that the phylogenetic tree could be divided into thirteen main clades (Figure 4). The phylogenic tree analysis of AQPs supported the idea that those newly identified Sc-AQPs can be classified into AQP1, AQP8, and AQP11.

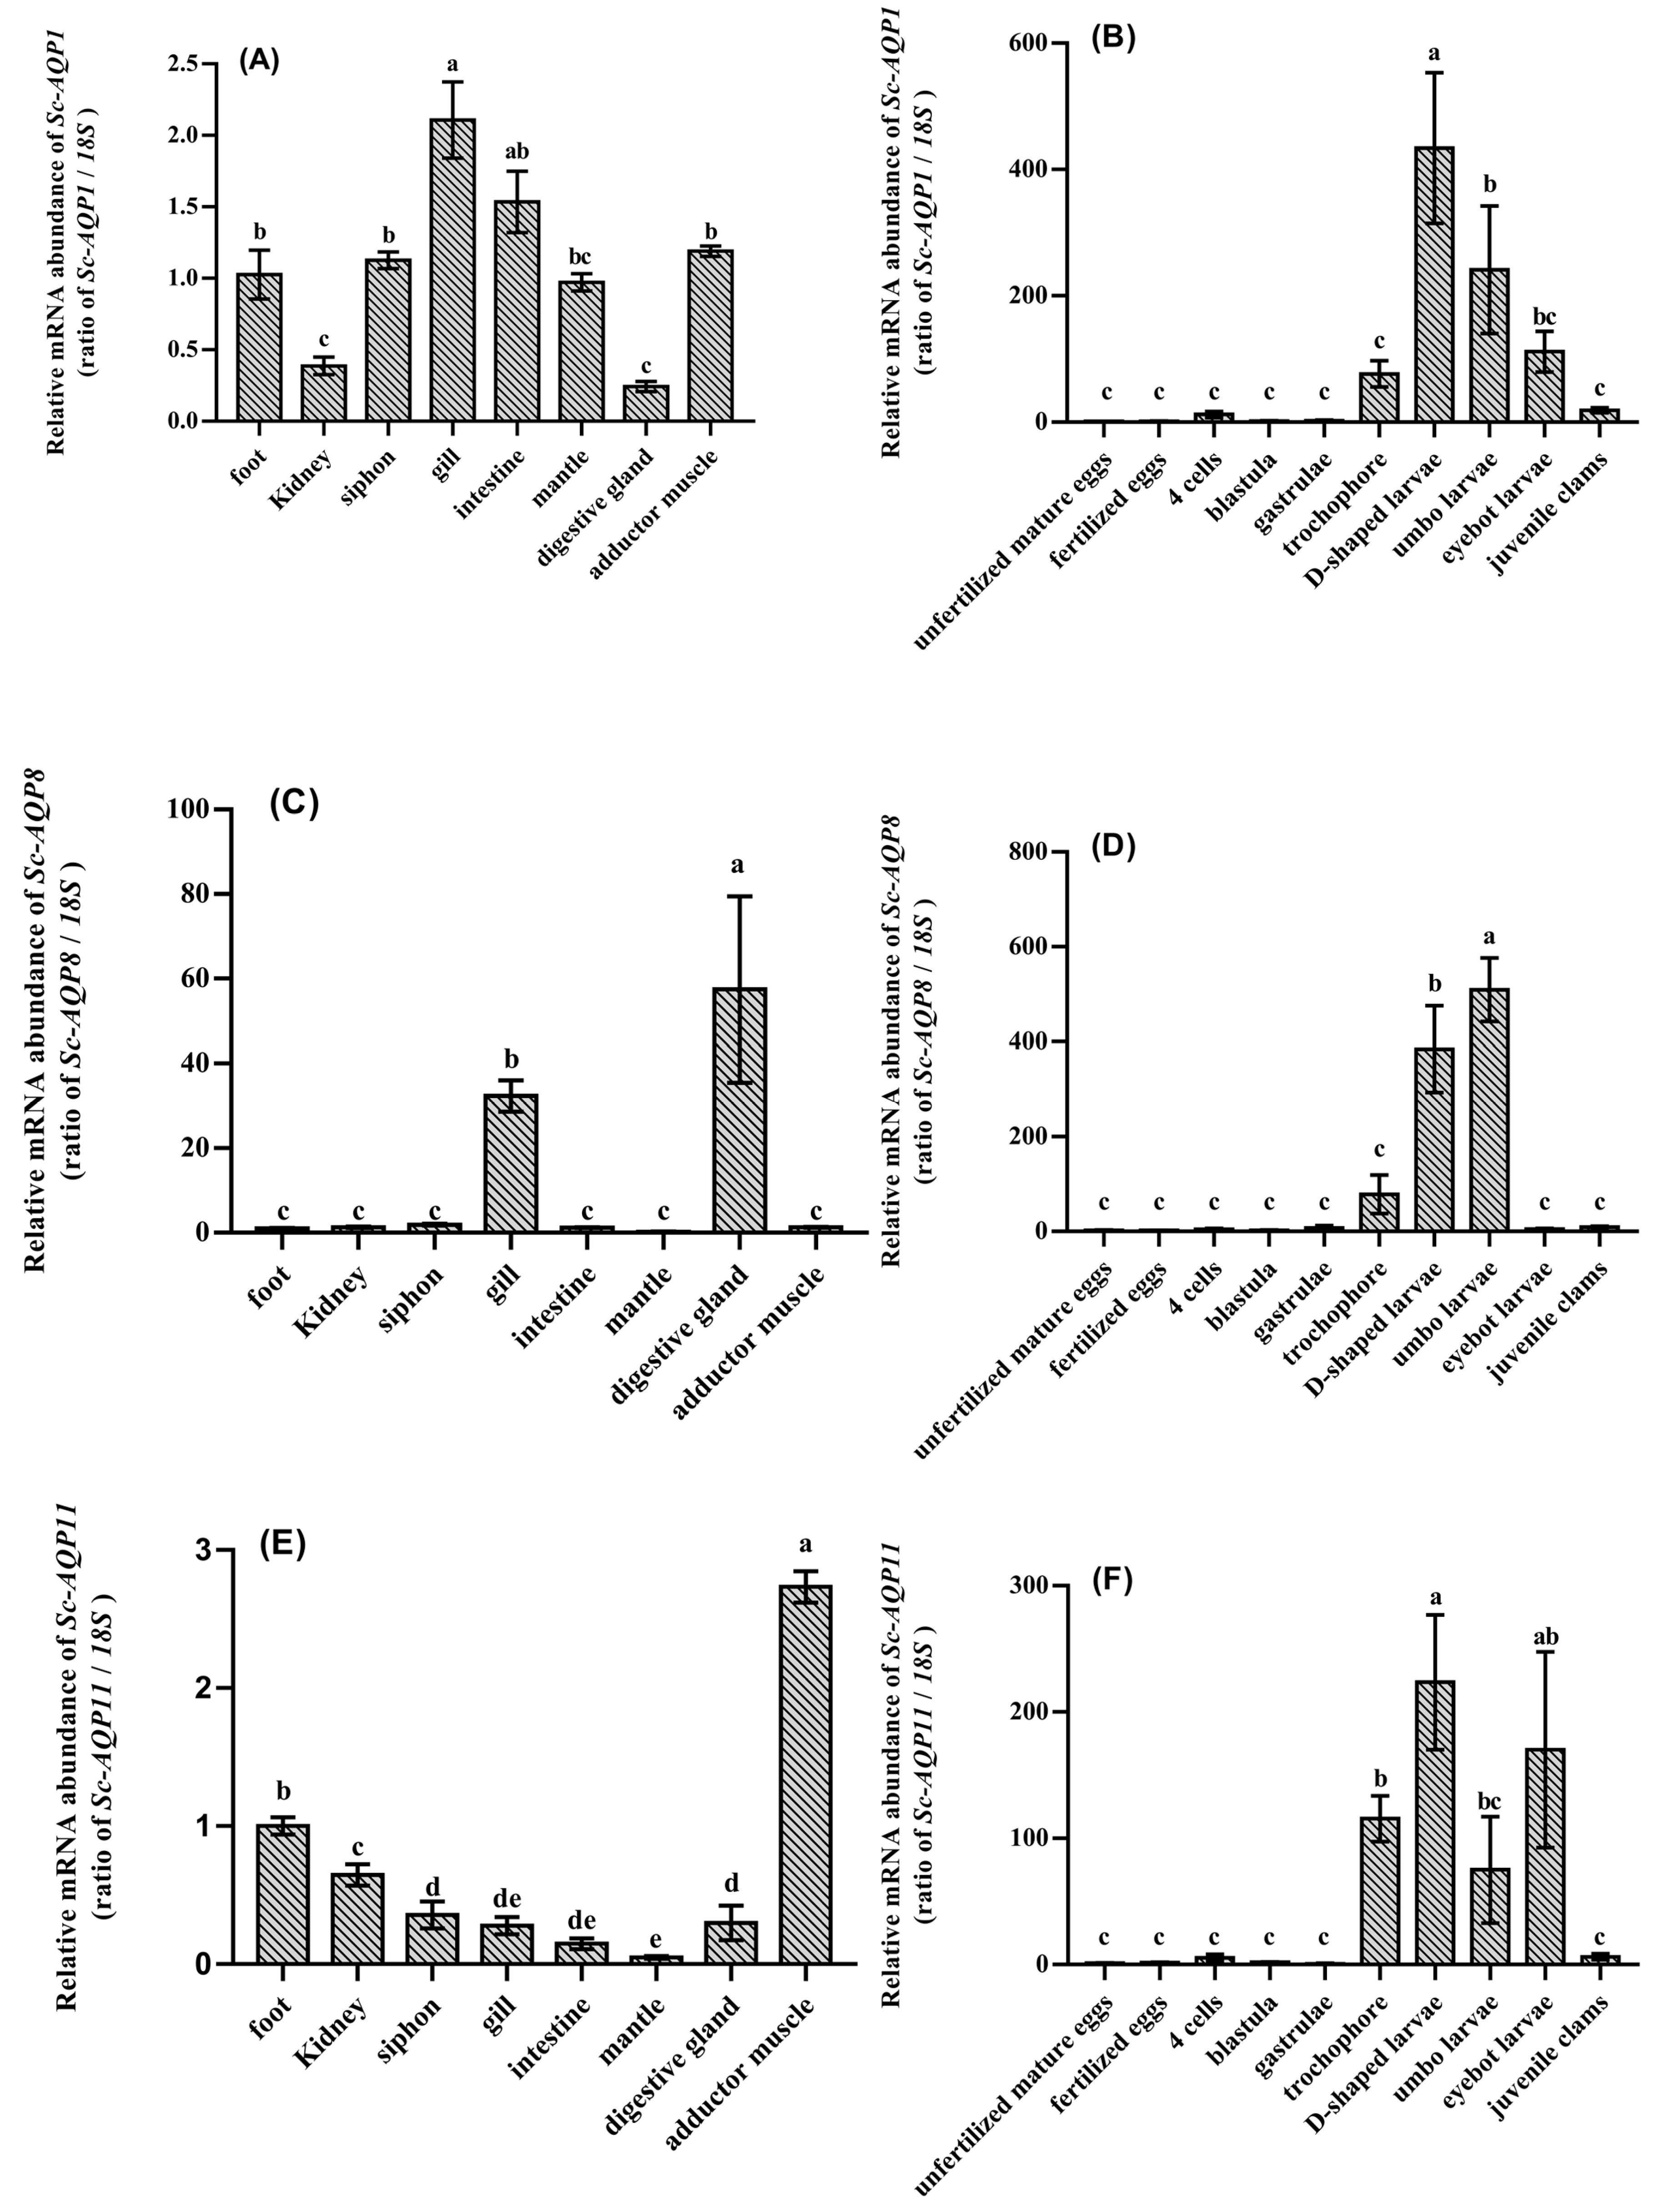
3.3. Spatiotemporal Expression Analysis of Sc-AQP1, Sc-AQP8, and Sc-AQP11

We quantified the mRNA expression levels of Sc-AQP1, Sc-AQP8, and Sc-AQP11 in eight different tissues, including gill, intestine, kidney, digestive gland, siphon, mantle, foot, and adductor muscle. Results showed that the expressions of three Sc-AQPs mRNAs were detected in all examined tissues (Figure 5). Sc-AQP1 was significantly expressed in the gill and intestine (p < 0.01) (Figure 5A). In contrast, the Sc-AQP8 was significantly expressed in the digestive gland and gill, whereas the Sc-AQP11 was significantly expressed in adductor muscle (p < 0.01) (Figure 5C,E).
The time-course expression revealed that the relative expression levels of Sc-AQP1, Sc-AQP8, and Sc-AQP11 were expressed in all ten developmental stages (Figure 5B,D,F). The expression level of Sc-AQP1 peaked up in the D-shaped larvae stage, followed by a downward trend, while that of Sc-AQP8 was upregulated in the trochophore stage and peaked up in the umbo larvae stage, which was significantly higher than those detected in other stages (p < 0.01) (Figure 5B,D). A relatively higher expression of Sc-AQP11 was detected in trochophore, D-shaped larvae, umbo larvae, and eyebot larvae stage (Figure 5F).

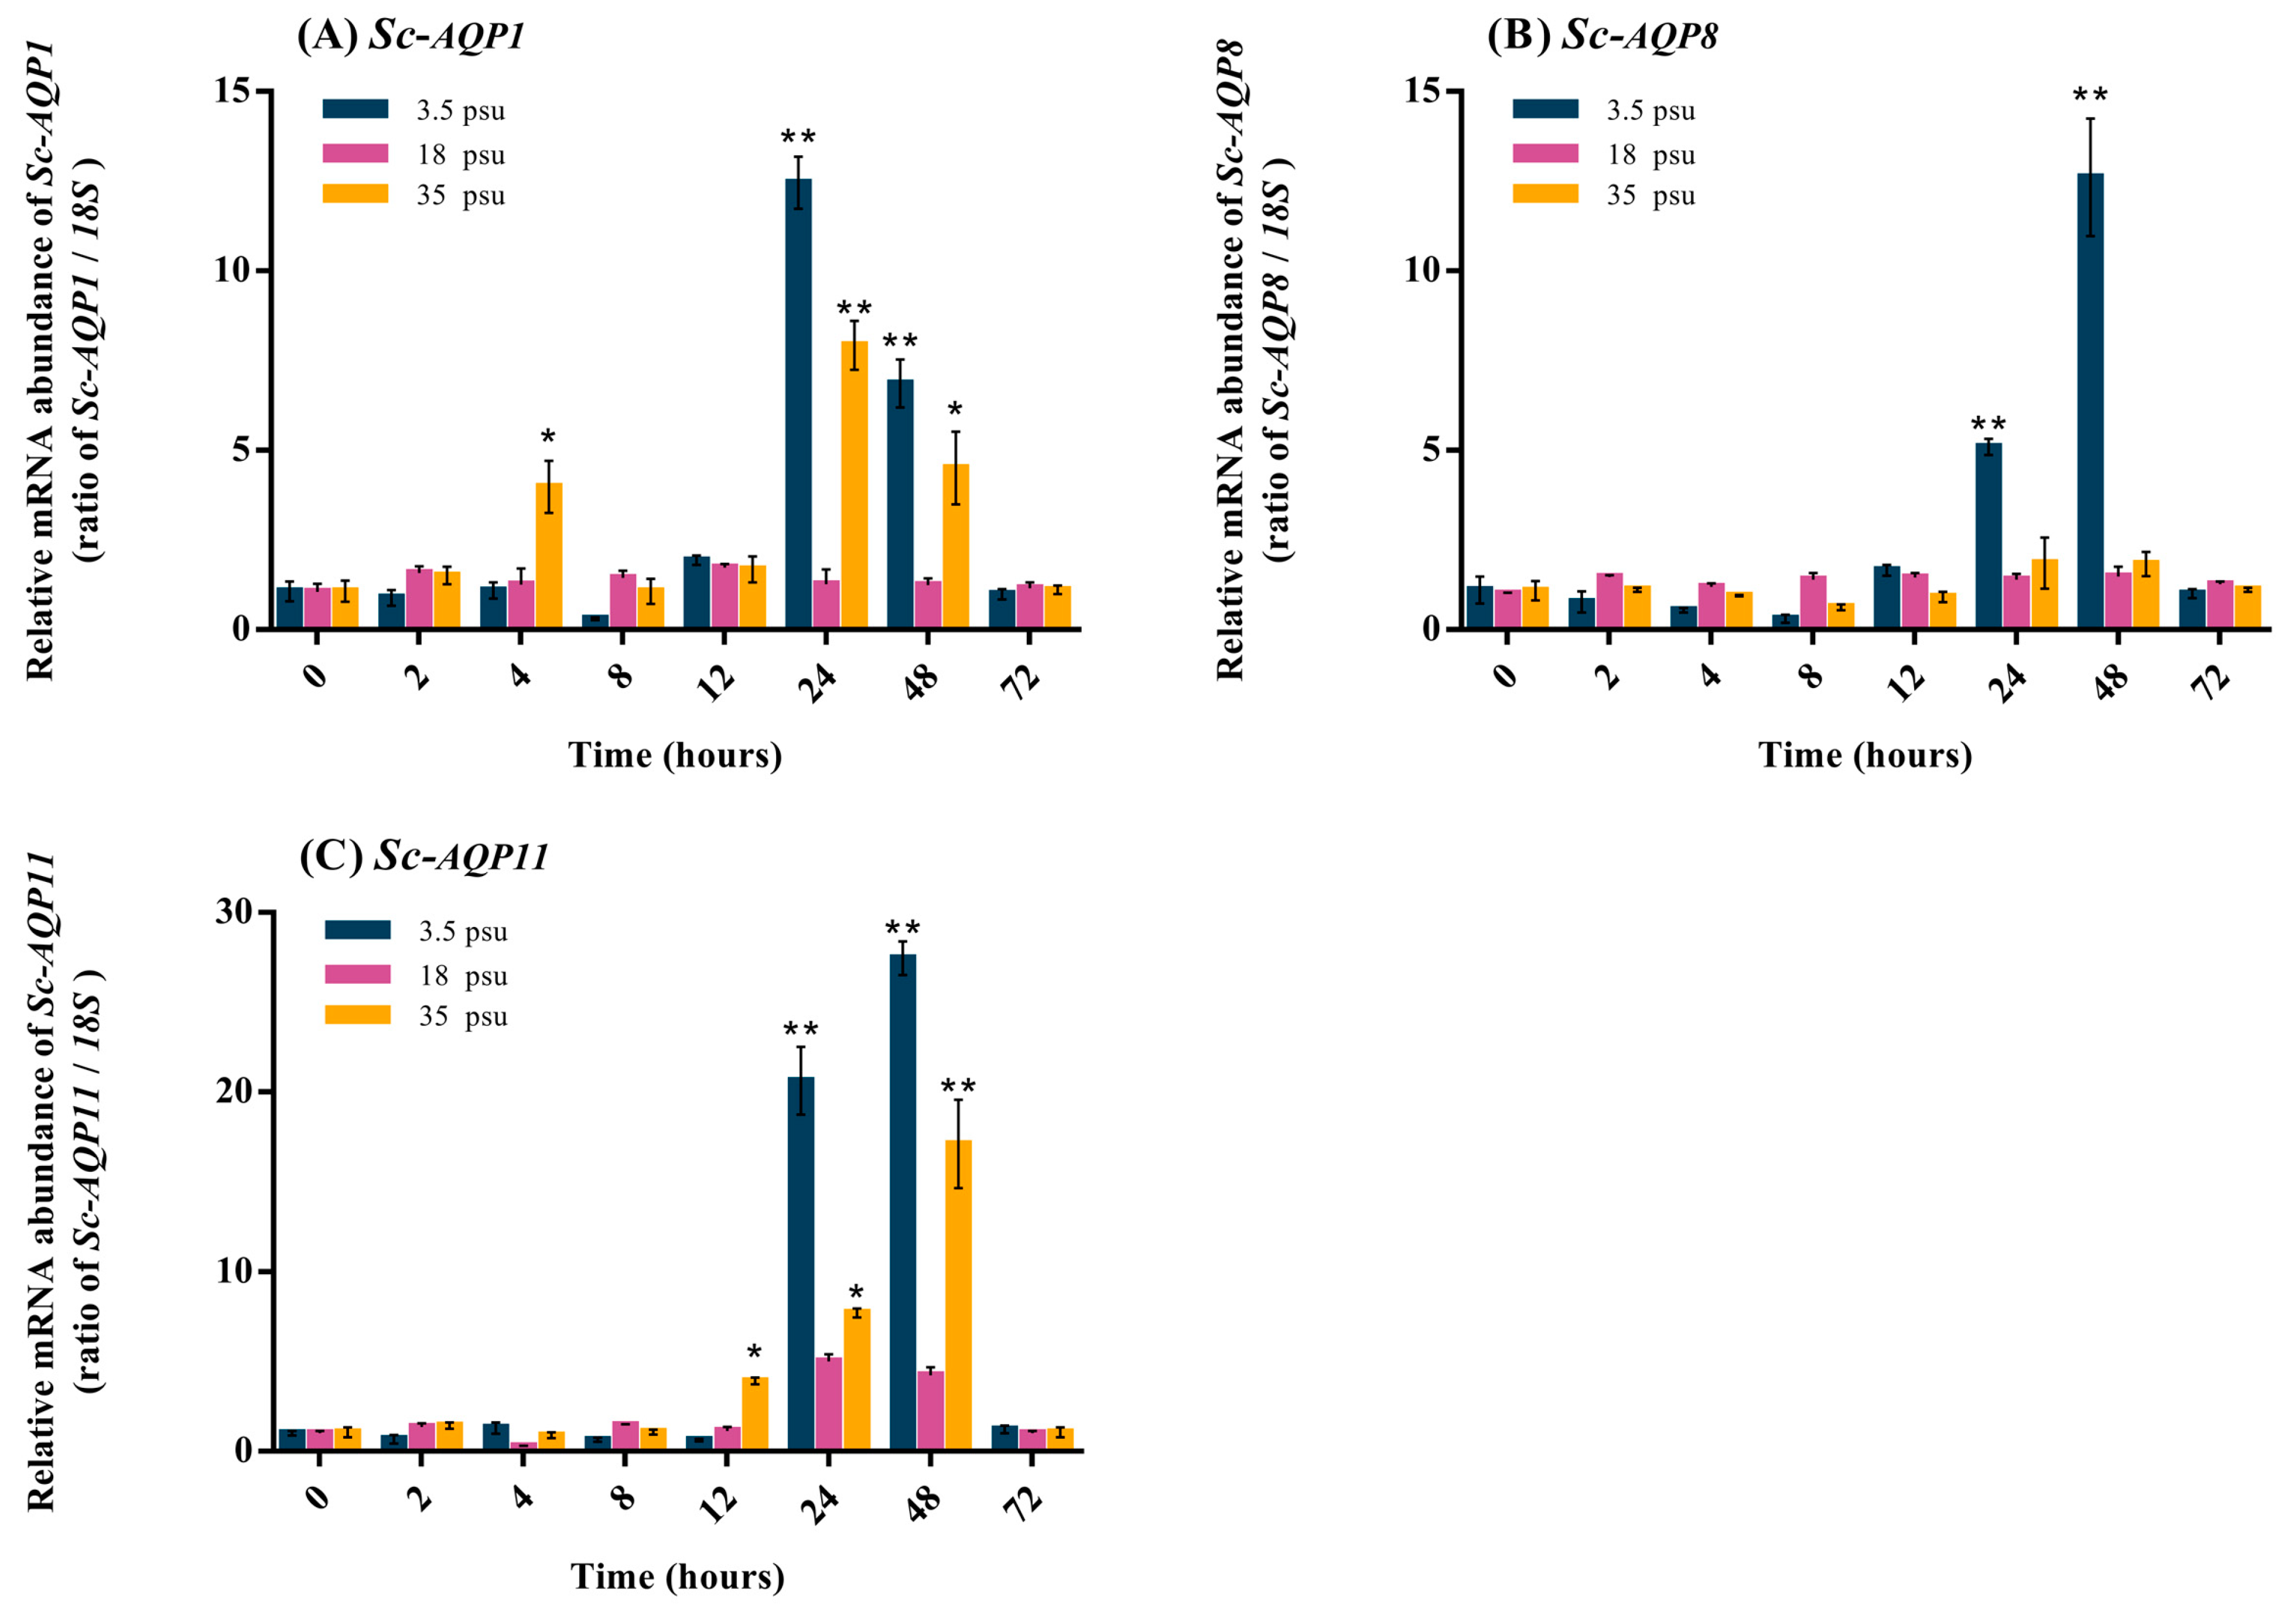
3.4. Quantitative Expression Analysis of Sc-AQP1, Sc-AQP8, and Sc-AQP11 mRNA after Salinity Challenge

To study the transcriptional response of Sc-AQP to salinity stress, razor clams were subjected to low-salt stress (3.5 psu) and high-salt stress (18 psu). Under low-salt and high-salt treatment, the Sc-AQP1 expressions were induced and increased to 12.45-folds and 7.93-folds after 24 h of treatment, respectively, which were significantly higher than that of the control group (p < 0.05) (Figure 6A). For Sc-AQP8, its expression increased significantly at 24 h and reached the peak at 48 h (12.36-folds) under low-salt treatment (p < 0.01) (Figure 6B). However, it remained unchanged under high-salt treatment. The Sc-AQP11 expression increased by 27.44- and 17.09-folds after 48 h of low-salt and high-salt treatment, respectively, which were significantly higher than that of the control group (p < 0.01) (Figure 6C). After 72 h, the RNA levels of Sc-AQP were all back to their initial levels.

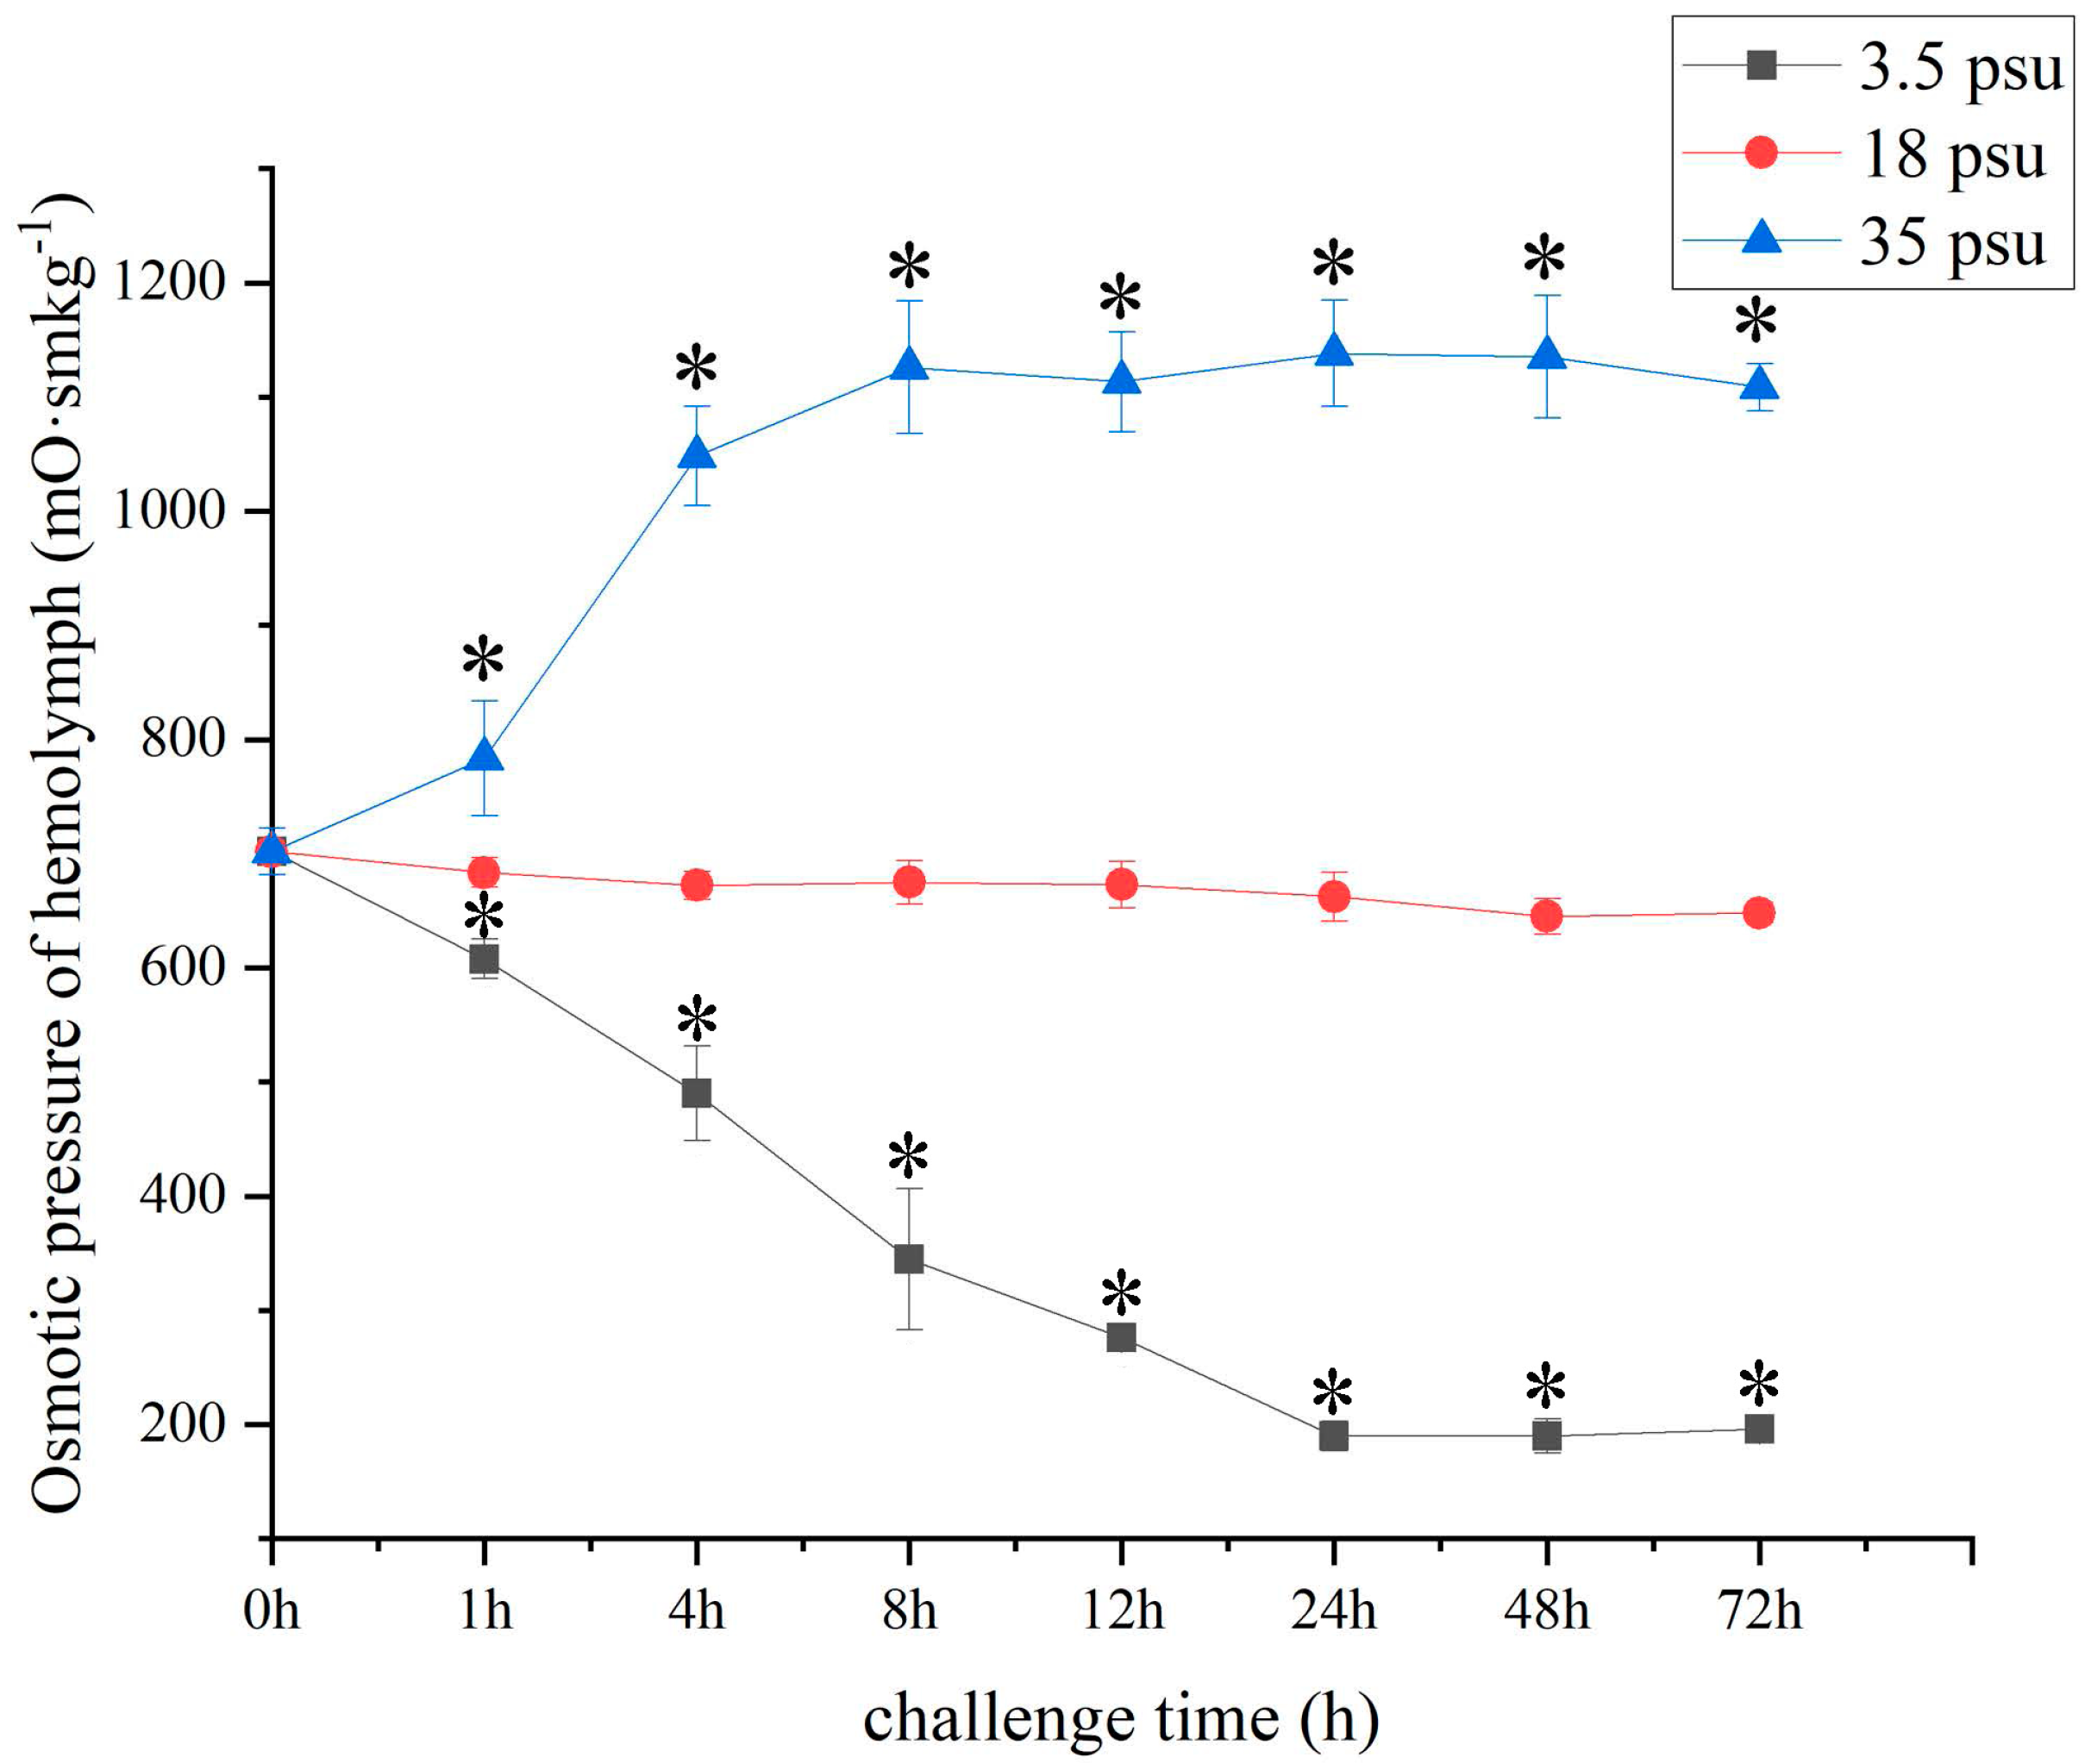
3.5. Detection of the Osmotic Pressure of Hemolymph after Salinity Challenge

The osmotic pressure of hemolymph was detected in each sampling time post-exposure to the low- and high-salinity stimulation. The osmotic pressure in hemolymph significantly increased in the high-salinity group and peaked up to 1138.2 mO·smkg−1 at 24 h (p < 0.05) (Figure 7). Conversely, the osmotic pressure significantly decreased within 96 h in the low-salinity group as compared with the control group (p < 0.05) (Figure 7).

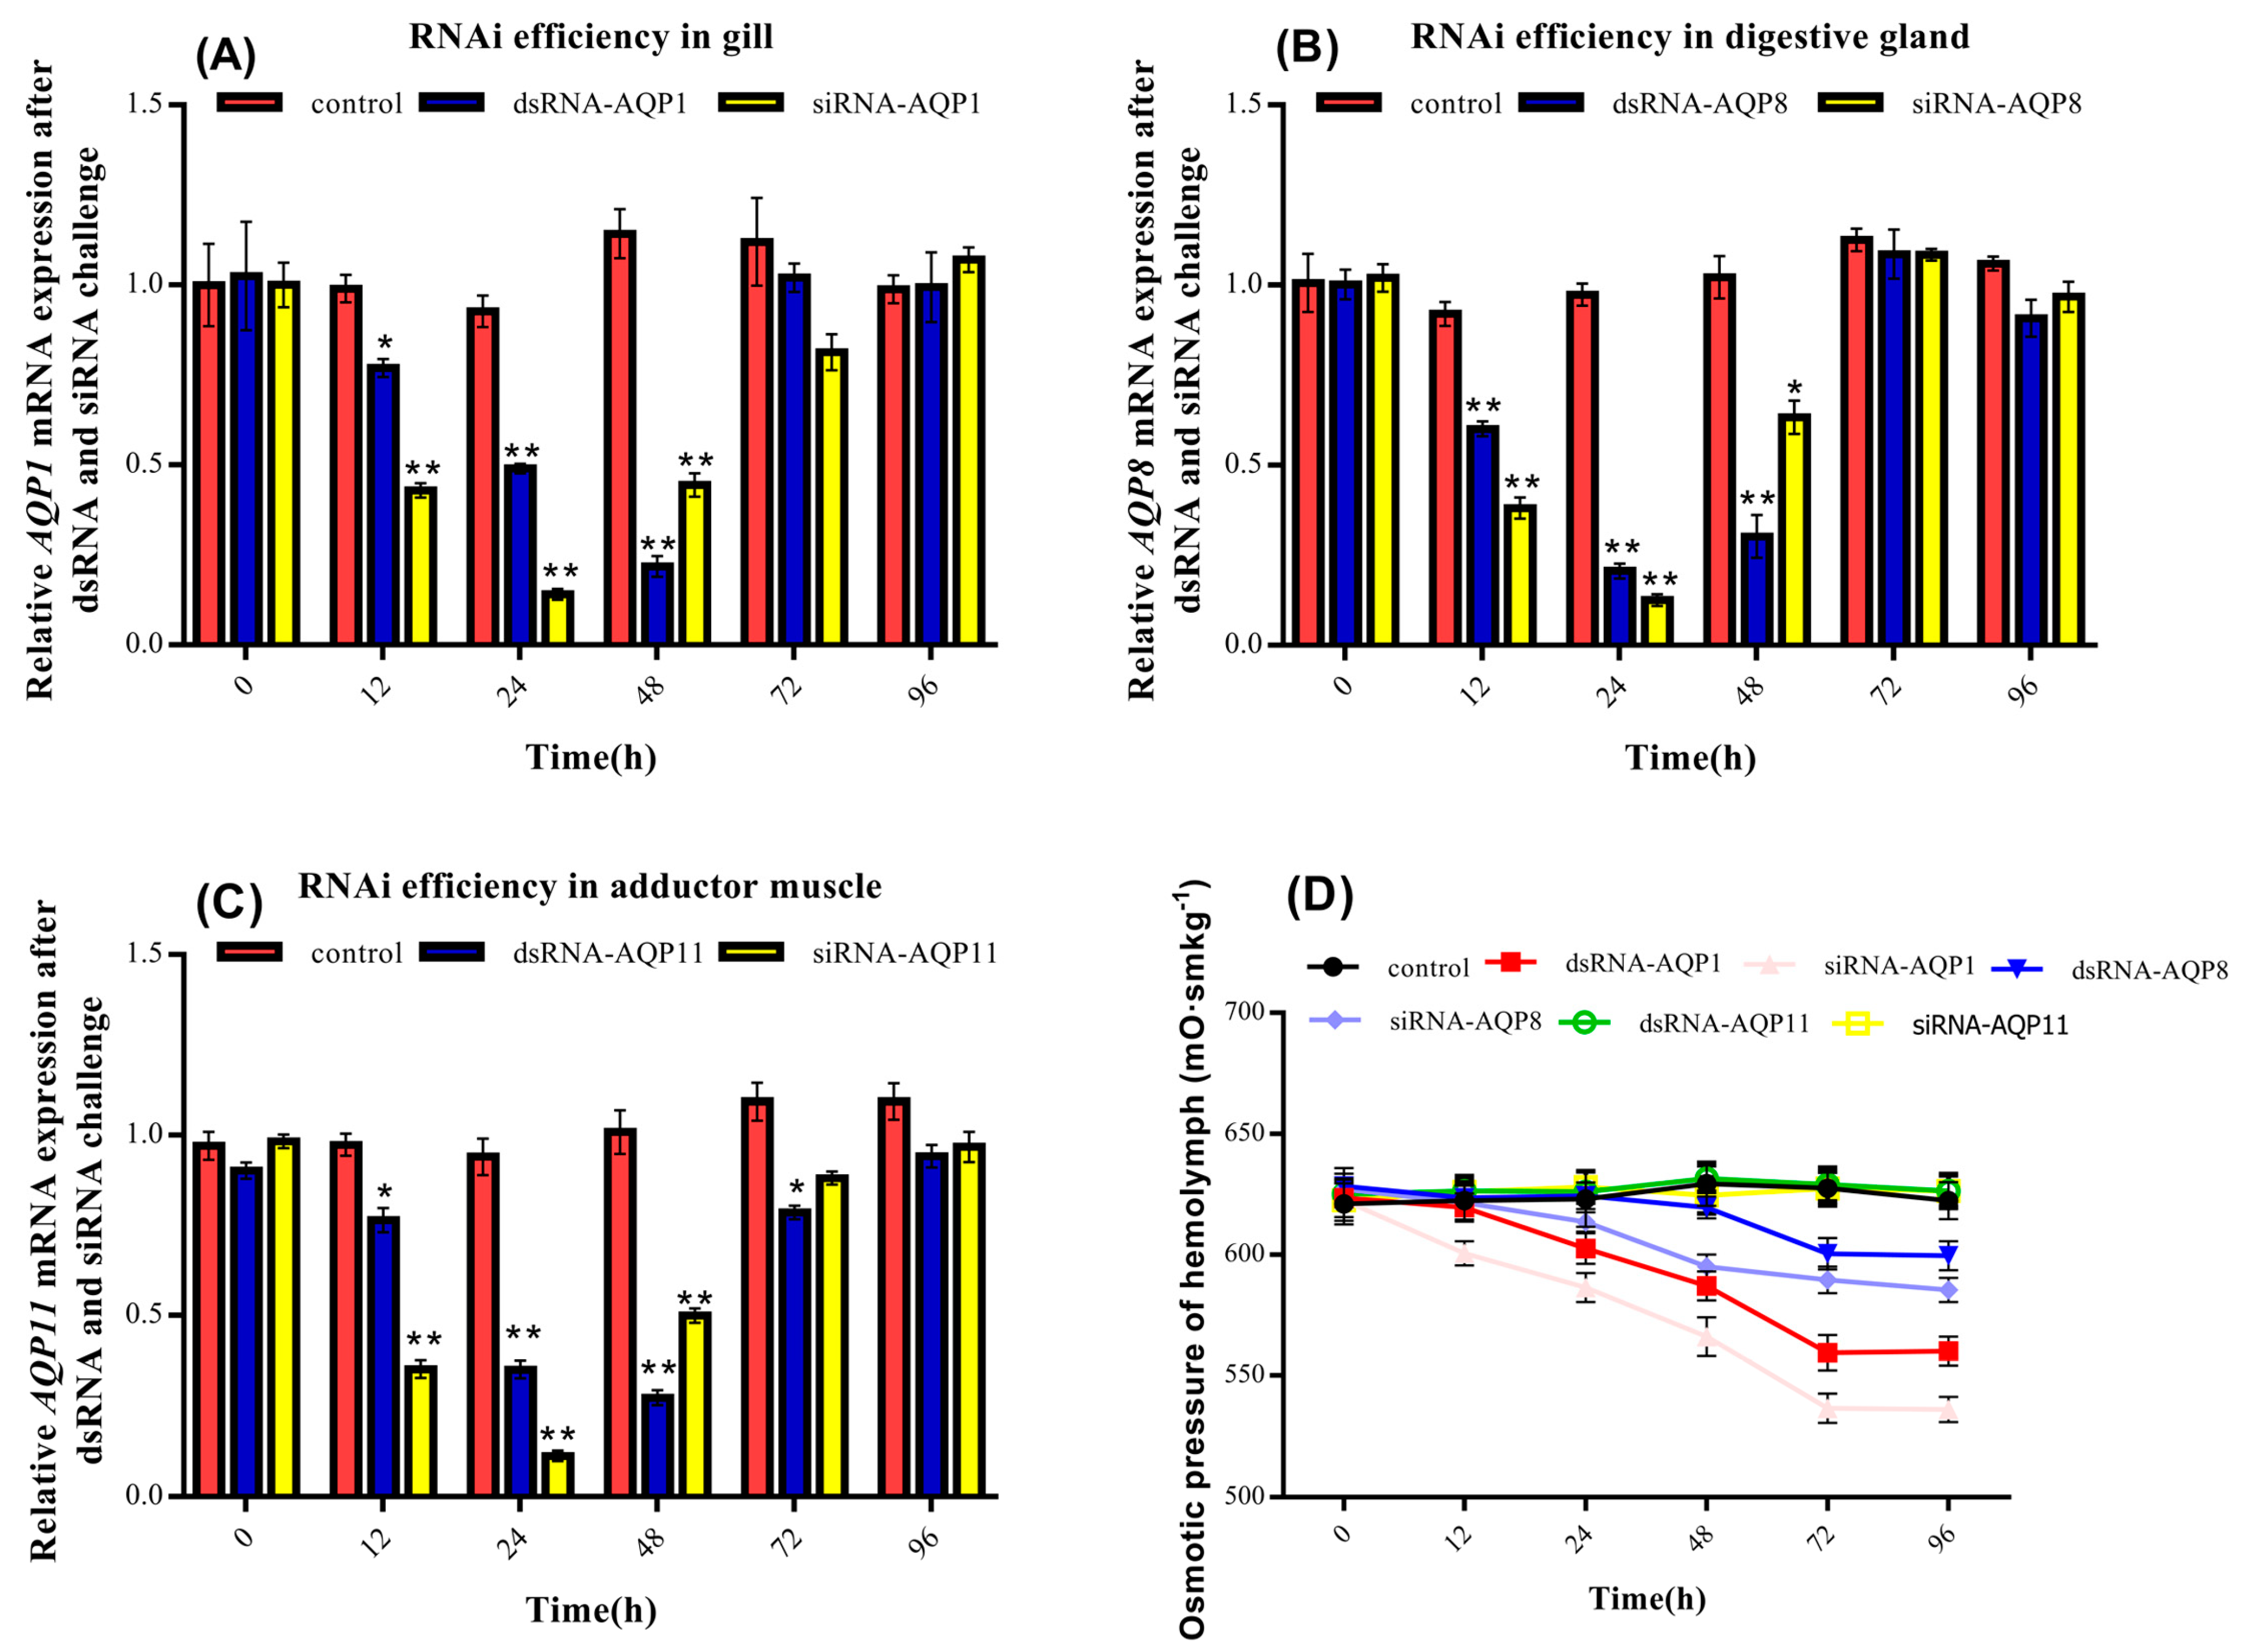
3.6. Effects of dsRNA and siRNA on Sc-AQP1, Sc-AQP8, and Sc-AQP11 Expression and Osmotic Pressure

A qRT-PCR was performed to determine the expression levels of Sc-AQP1, Sc-AQP8, and Sc-AQP11 in different tissues post RNA interference (Figure 8). The results revealed that dsRNA and siRNA significantly reduced the transcript level of Sc-AQP1, Sc-AQP8, and Sc-AQP11. The relative expression levels of the Sc-AQP1 gene in gills were significantly decreased to the lowest level at 48 and 24 h post-injection with dsRNA-Sc-AQP1 and siRNA-Sc-AQP1, respectively (Figure 8A). The relative expression levels Sc-AQP8 gene in digestive gland reached the lowest level at 24 h post-injection with dsRNA-Sc-AQP8 and siRNA-Sc-AQP8, respectively (Figure 8B). Post-injection with dsRNA-Sc-AQP11 and siRNA-Sc-AQP11, the Sc-AQP11 gene expression in adductor muscle significantly decreased to 12% and 28% of its initial level, respectively (p < 0.01) (Figure 8C).
The osmotic pressure in hemolymph first decreased from 24 and 12 h and then reached the lowest values of 563 and 543 mO·smkg−1 at 96 h after interference with dsRNA-AQP1 and siRNA-AQP1, respectively (Figure 8D). In contrast, the osmotic pressure in hemolymph began to decrease from 48 and 24 h and then reached the lowest values of 599 and 583 mO·smkg−1 at 96 h after interference with dsRNA-AQP8 and siRNA-AQP8, respectively (Figure 8D). Interestingly, no change was observed in osmotic pressure in hemolymph after interference with dsRNA-AQP11 and siRNA-AQP11 (Figure 8D).

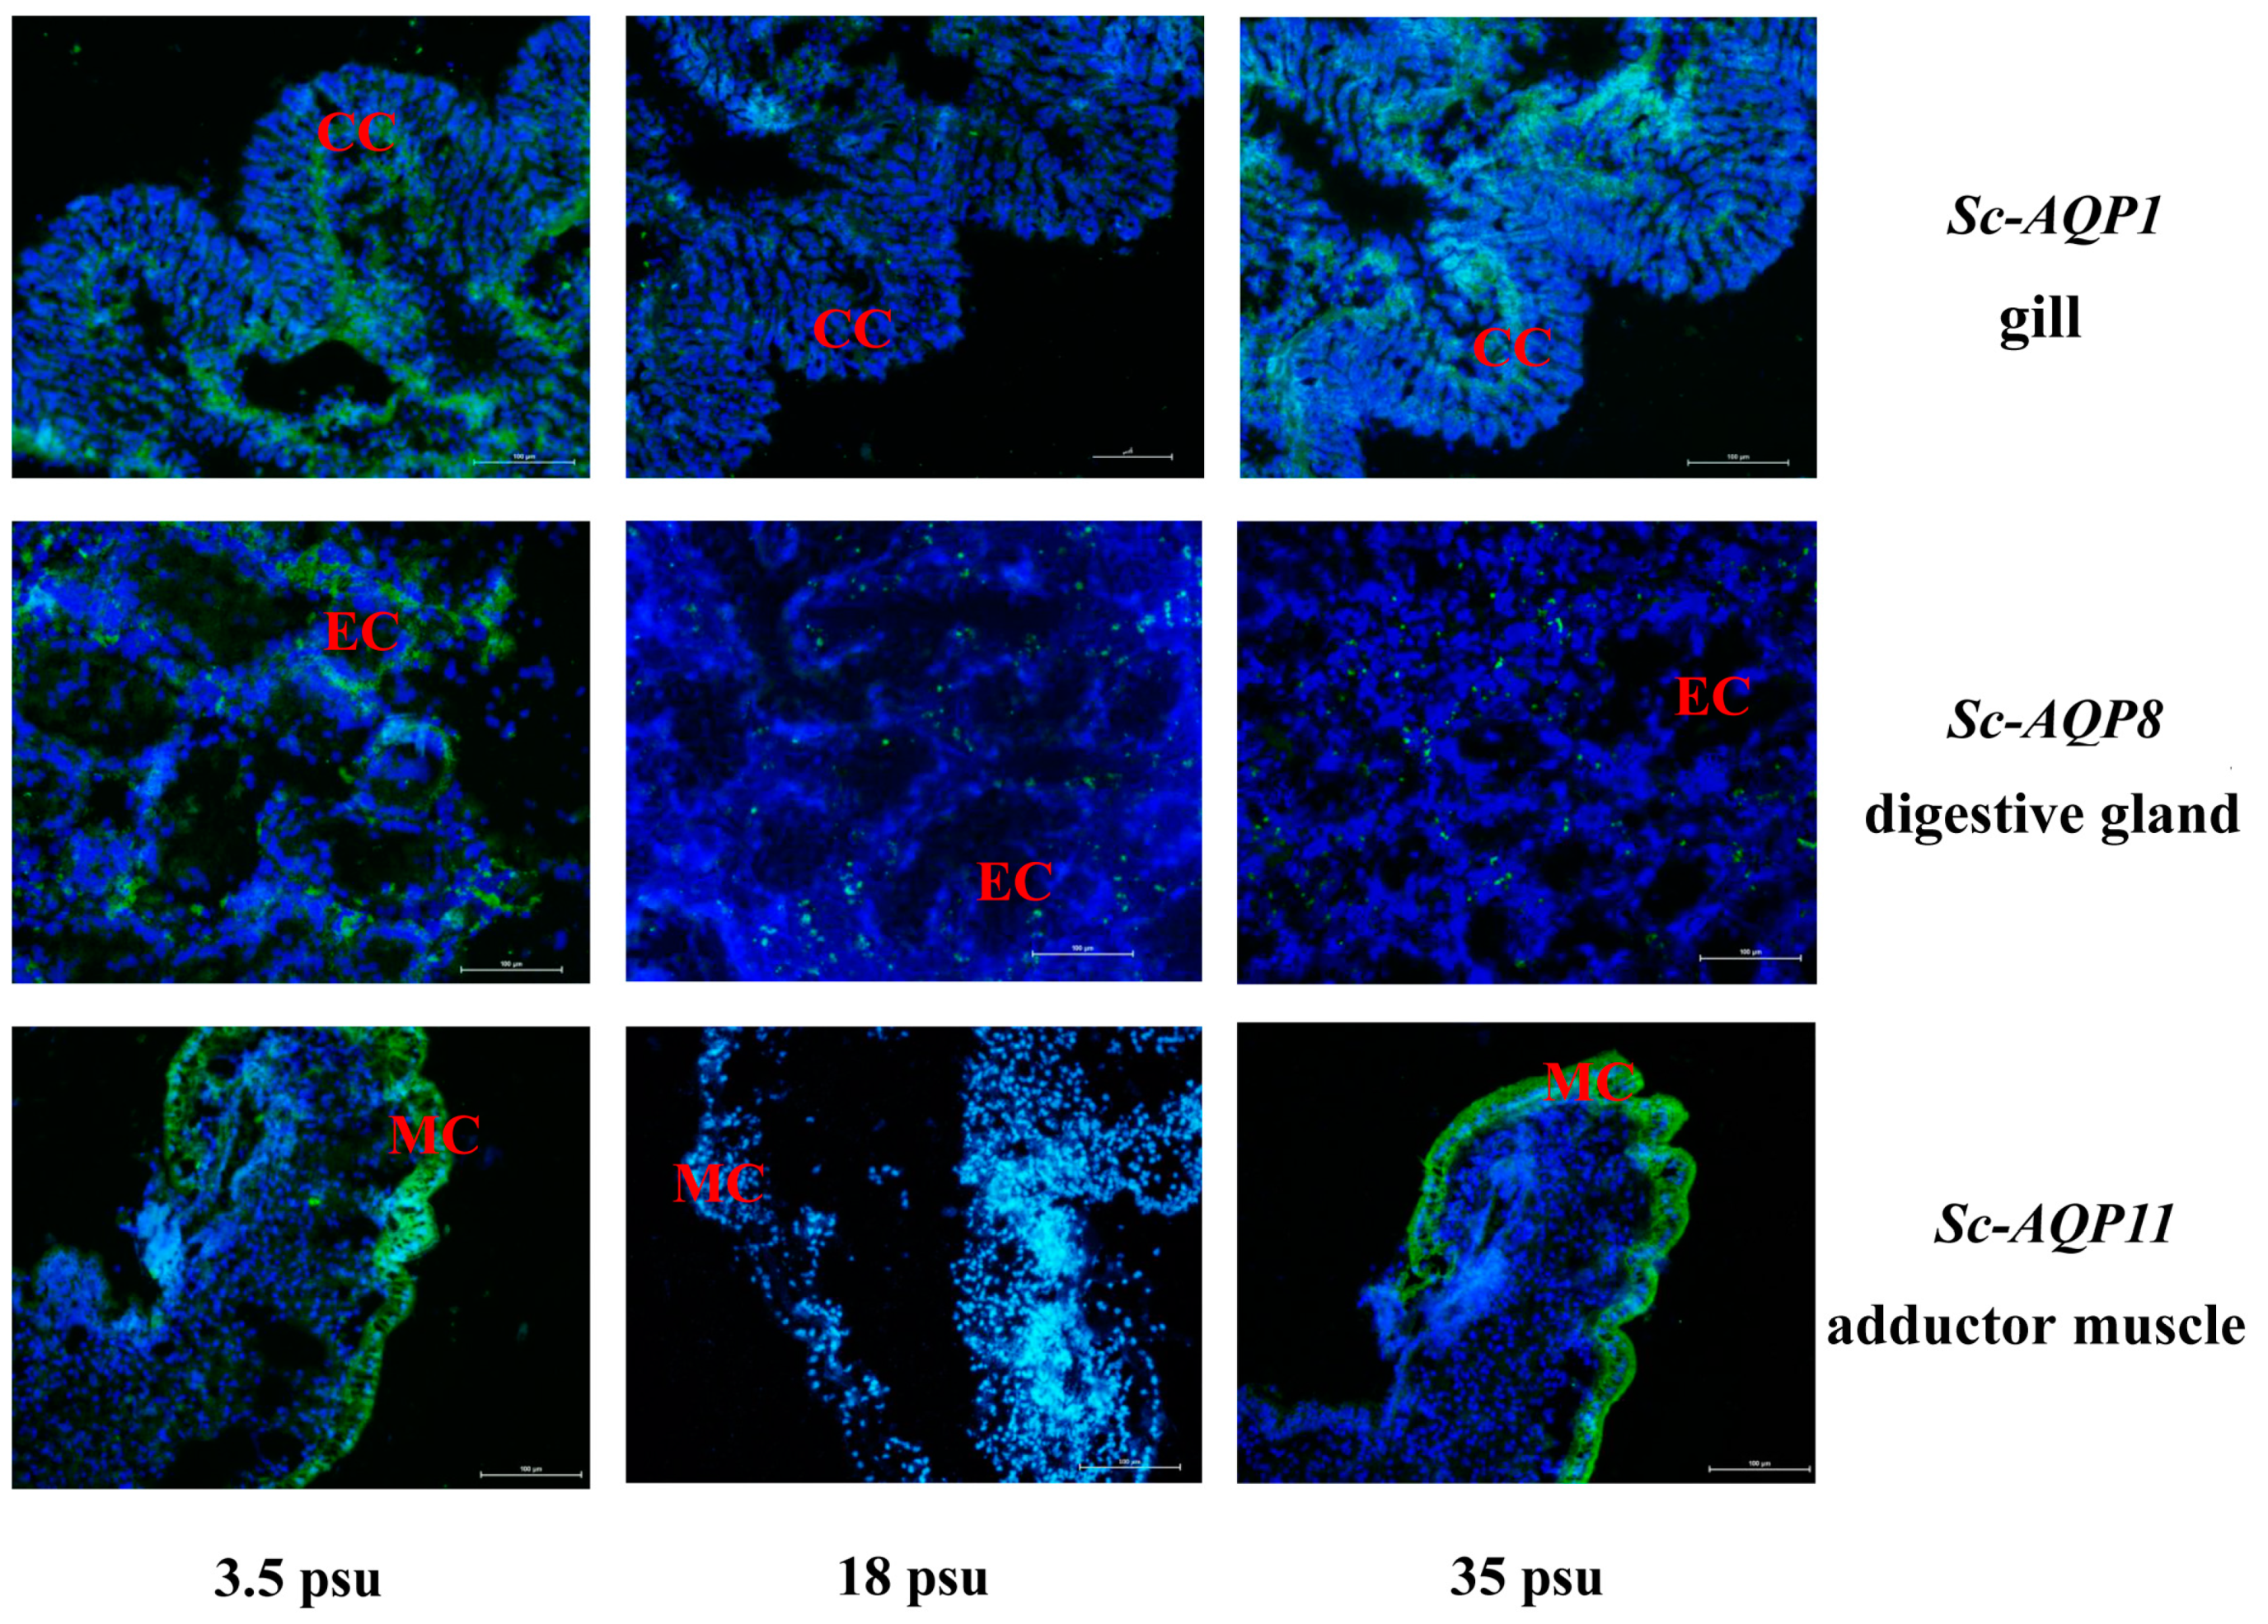
3.7. Fluorescence In Situ Hybridization of Sc-AQP1, Sc-AQP8, and Sc-AQP11

We further performed the FISH analysis to confirm the expression level of Sc-AQP1, Sc-AQP8, and Sc-AQP11 in different tissues in response to the low- and high-salinity pressure. A stronger signal of Sc-AQP1 was detected at the inner side of gill filaments post low-salt and high-salt treatment (Figure 9). Similarly, low-salt and high-salt stress also induced a stronger signal of Sc-AQP11 at the surface of the adductor muscle (Figure 9). For Sc-AQP8, the stronger signal was only observed at the digestive gland post low-salt treatment (Figure 9).

4. Discussion

It is well-known that bivalves tolerate a wide range of environmental stress through adaptation mechanisms. Thus, S. constricta is able to regulate their extracellular and intracellular fluids under salinity changes. Notably, osmotic pressure regulation is a complex biological process, in which many genes belonging to the AQP family and also many other types of genes, e.g., ion channels, are involved [18]. AQP is a specialized channel that rapidly transports water and other small solutes within different organs [19]. The channels facilitate the rapid movement of water across cell membranes [20]. The permeability of some cells to water can change rapidly due to the fact that some AQP properties can be activated/inactivated by phosphorylation, or translocated in and outside the cell membrane [21]. So far, at least 30 AQP genes were discovered in other mollusks, including C. gigas, C. hongkongensis (Lam et Mortan, 2003), and C. virginica (Gmelin, 1791), while no AQP genes were identified from S. constricta. In this study, we cloned and characterized three cDNAs encoding AQPs from the gill of S. constricta.
The AQP family commonly contained five loops, termed as loops A–E, and are responsible for connecting membrane-spanning α-helices [22]. Within them, two loops, namely the cytosolic loop (loop B) and the extra-cytosolic loop (loop E), contain conserved Asn-Pro-Ala (NPA) motifs [22]. The interaction between these conserved NPA motifs and the adjacent residues located on loop B and loop E is vitally important for water transport across the membrane [23]. Notably, some AQPs show the N-terminal NPA modified into NPC to form tetramers [24]. Consistent with the notion, the Sc-AQP1 and Sc-AQP8 detected here contained two conserved NPA motifs, which caped the end of the two half helices and lay at the middle of the permeation channel. Thus, we inferred that Sc-AQP1 and Sc-AQP8 can form a constriction that appears to act mainly as size exclusion filters. Notably, Sc-AQP11 had a unique amino acid sequence that included an NPC motif which corresponded to the N-terminal NPA signature motif of conventional AQPs. The substitution of cysteine residues with alanine residues in AQP11 results in the suppression of water transport efficiency [24]. Nevertheless, previous research revealed that a key amino acid residue (Tyr83) facing the channel pore might be responsible for its slow but constant water permeable function of AP11 [25].
The three Sc-AQPs had higher identity and similarity with mollusks than mammalian counterparts, suggesting their close evolutionary relationship. It has been proposed that AQP11 and AQP12 are the most distantly related paralogs and share only 20% homology with AQP family members [26]. A similar finding was observed in Sc-AQP11 in this study. Comparisons of AQP sequences from C. gigas have revealed that some domains within Sc-AQPs remained unchanged through evolution, suggesting that a similar molecular mechanism of water transport among the species exists [27]. For most kinds of mollusks, such as snails, Pinctada fucata martensii (Dunker, 1872), and C. hongkongensis, the AQPs have been proved to be ubiquitous proteins and play important roles in many essential water transport functions [28,29]. Similarly, the phylogenetic tree also showed that there existed a strictly evolutionary relationship in Sc-AQPs with arthropods and fishes [30,31]. For the crustaceans, in addition to the osmotic pressure regulating, AQPs expression also changes during the moult cycle of a decapod crustacean, together with the regulation of cell volume with the participation of AQPs [32].
In order to further confirm their roles in water transport, multiple experiments, including tissue distribution analysis, salinity stress analysis, and RNA interference, were conducted. The vital role of AQP1 contributed to water transport has been verified in many researches [33,34]. For example, Pallone et al. (2000) proved that deletion of AQP1 leads to a urinary concentrating deficiency in outer medullary descending vasa recta (OMDVR) water transport [33]. Deane et al. (2011) also claimed that AQP1a played a key role in releasing water through the basolateral membrane of the cells in order to avoid cell swelling when confronted with hypo-osmotic stimulation [34]. In this study, Sc-AQP1 showed a wide tissue distribution similar to those observed in other marine species [31,35,36]. In addition, Sc-AQP1 seemed to be sensitive to the salinity adaptation, because its transcript expression was significantly upregulated post hyposaline and hypersaline acclimation. FISH also indicated that its expression in gill was higher than in the control group after changing water salinity. Knockdown of the Sc-AQP1 directly reduced the osmotic pressure of hemolymphoid, which was similar to previous research [37]. RNAi gene silencing of CLAQP1 in Cimex lectularius (Linnaeus, 1758) significantly reduced water excretion [37]. Thus, we believed Sc-AQP1 in the gill was important for S. constricta to transport water and regulate osmotic pressure.
Similarly, the Sc-AQP8 gene was also detected in all test organs, especially in the digestive gland and gill. The organs belonging to the digestive gland are highly involved in water transport, and AQP8 is important in this process [38,39]. For example, Laforenza et al. (2005) indicated that AQP8 plays a major role in water movement through the colon [38]. Ferri et al. (2003) also demonstrated its potential role in canalicular water secretion [39]. Moreover, Ferri et al. (2003) suggested an intracellular involvement of AQP8 in preserving cytoplasmic osmolality during glycogen metabolism and in maintaining mitochondrial volume [39]. The FISH analysis also showed that low-salinity challenge resulted in the upregulation of the Sc-AQP8 gene in the digestive gland. Unfortunately, no research has been conducted to explain why AQP8 transcript is highly expressed in the gill. We speculated that its high expression might be relative to the water transport and gas exchange in gill. Furthermore, our results showed that the Sc-AQP8 in gill was sensitive to low salinity, implying its potential role in water transport. In addition, knockdown of Sc-AQP8 led to the significant downregulation of Sc-AQP8 expression, and the osmotic pressure of hemolymph decreased simultaneously. Thus, it was undisputed that the Sc-AQP8 was highly related to water transport and osmotic pressure regulation. In the case of AQP8, apart from being water channel, it also supports the significant fluxes of NH3 and NH4+ transport [40].
Furthermore, AQP11 owns a ubiquitous tissue distribution in rats and Oryzias latipes (Temminck and Schlegel, 1846), whereas it was found only in the gastrointestinal tract of zebrafish [41,42,43]. In this study, Sc-AQP11 was found to be highly expressed in the adductor muscle of S. constricta, which was an important organ responsible for the ion transport from cells to the myostracum [44]. Thus, we believe this newly identified AQP11 is important for the ion and water transport, although there exists controversy over the functional studies of AQP11 in different tissues. Gorelick was unable to demonstrate the transport of water, glycerol, urea, or ions by AQP11 in Xenopus oocyte [45]. In contrast, Morishita found that AQP11 is essential for the proximal tubular function in the mice, which was correlated to the water transport [46]. In addition, the high expression of Sc-AQP11 in gill in hyposaline and hypersaline acclimation further suggested its prominent role in water absorption.
Despite the lack of a complete osmotic adjustment mechanism, a majority of marine organisms initiate a set of adaptive mechanisms to deal with external stress, such as salinity changes [47]. Interestingly, we found the expression of transcript response to the hyposaline and hypersaline was distinct among Sc-AQP1, Sc-AQP8, and Sc-AQP11. The hypersaline acclimation resulted in an elevated expression of transcript of Sc-AQP1 and higher osmotic pressure in hemolymph post-exposure for 24 h, and the suppression of Sc-AQP1 mRNA expression led to the downregulation of osmotic pressure from 24 to 72 h. We speculated that the Sc-AQP1 might play a role as outlet point for water drainage through the basolateral membrane, as has been verified in euryhaline silver sea bream [34]. Curiously, the hyposaline acclimation also resulted in an elevated expression of transcript of Sc-AQP1, which might be caused by osmotic pressure imbalance in gill. As the gas exchange organ of shellfish, gills need to balance the osmotic gradient between blood and surrounding water. Therefore, the gill tends to be highly permeable, meaning that the gill epithelial cells may require a more developed osmotic-pressure-regulation ability [48]. These findings suggest that the Sc-AQP1 may be synthesized to excrete water entering the gill at high osmotic salinity, while its function appears to be limited at low salinity. In contrast, our results also showed that acclimation to salinities ranging from 18 to 35 psu did not significantly affect gill Sc-AQP8 expression, and the Sc-AQP8 was more sensitive to low salinity than high salinity. To decrease the osmotic difference between the internal and external environment during salinity changes, chloride cells commonly change the structure for water flow and increase the flux of water molecules, and this was relative to the upregulation of AQP8 expression [49]. We therefore propose that knockdown of the Sc-AQP8 leads to the dysfunction of chloride cells and imbalance of osmotic pressure in the hemolymph. Similarly, the hyposaline and hypersaline acclimation resulted in an elevated expression of transcript of Sc-AQP11. Interestingly, although RNA interference resulted in the downregulation of Sc-AQP11 expression in adductor muscle, it did not change the osmotic pressure in the hemolymph. This is because Sc-AQP11 may be involved in the slow but continuous movement of water across the membrane [25]. Intertidal organisms, including plants, fish, shellfish, and crabs, commonly form a species-dependent ontogenetic pattern to accommodate the fluctuation of environmental salinity [50]. Within these organisms, shellfish own a high osmoregulatory capacity to adapt to the estuarine conditions, especially in the larvae stage [51]. Nowadays, an increasing body of evidence suggests that AQP3, AQP7, AQP8, and AQP11 are the most abundant AQPs in sperm and are strongly activated in response to variations of osmolality [51,52]. Recent works have uncovered that AQP1b can facilitate water permeation and resultant swelling of the oocyte [53]. Similarly, Sc-AQP1, Sc-AQP8, and Sc-AQP11 in this study were expressed in all developmental stages, suggesting that even larvae at earlier zoeal stages do have the osmoregulatory capacity. Moreover, our results demonstrated that the expression of Sc-AQP1, Sc-AQP8, and Sc-AQP11 was highest at D-shaped larvae and umbo larvae stages. The possible explanation for this pattern is that Sc-AQP1, Sc-AQP8, and Sc-AQP11 genes are needed to regulate the osmotic pressure when the clam larvae grow rapidly. On the contrary, the expression levels of Sc-AQP1, Sc-AQP8, and Sc-AQP11 decreased gradually at the juvenile stage, but were significantly higher than that in the pre-developmental period. The reasons for difference in expression level of three Sc-AQP at different stages may be that the tissues and organs of the clam are formed at this time, but the growth and development are still relatively vigorous.

5. Conclusions

In summary, this study identified three new AQPs in response to salinity stress in S. constricta. The mRNA transcripts of the three AQPs displayed constitutively expressed in all examined tissues and developmental stages. Moreover, Sc-AQP1, Sc-AQP8, and Sc-AQP11 displayed increased sensitivity to salinity change, with remarkable increasing expression in the gill post the exposure to the low salinity and high salinity, as evidenced by RNA interference and FISH analysis. These findings indicated that Sc-AQP1, Sc-AQP8, and Sc-AQP11 were responsible for the osmoregulation. Collectively, our findings contributed to clarifying the role of Sc-AQP in salinity tolerance and provided foundational knowledge on the adaptive mechanism of razor clams under salinity stress.

Supplementary Materials

The following supporting information can be downloaded at https://www.mdpi.com/article/10.3390/fishes7020069/s1. Table S1: Detailed information of sequences used in phylogenetic tree construction.

Author Contributions

L.H. and Z.L. conceived of the project; L.H. and Y.D. designed the experiments; W.R. performed the experiments and data analysis; L.H. and W.R. wrote and revised the manuscript. All authors have read and agreed to the published version of the manuscript.

Funding

This work was supported by the National Key Research and Development Program of China (2020YFD0900802, 2018YFD0901405), National Natural Science Foundation of China (No. 31802322), and China Agriculture Research System of MOF and MARA.

Institutional Review Board Statement

In the present study, Sinonovacula constricta clams were collected and used. All experimental procedures were conducted according to the guidelines of the appropriate Institutional Animal Care and Use Committee (IACUC) of Zhejiang Wanli University, China (Approval Code: 20220124001).

Data Availability Statement

Supporting data are stored in Bankit of the Genbank database; the are relative ID numbers are Sc-AQP1, MN186579; Sc-AQP8, MN186580; and Sc-AQP11, MN186581. Other data presented in this study are available upon request from the corresponding author.

Acknowledgments

We would like to thank Ningbo Ocean and Fishery Science and Technology Innovation Base for the provision of experimental field.

Conflicts of Interest

The authors declare no conflict of interest.

References

  1. Hachez, C.; Chaumont, F. Aquaporins: A Family of Highly Regulated Multifunctional Channels. Adv. Exp. Med. Biol. 2010, 679, 1–17. [Google Scholar] [PubMed]
  2. Agre, P.; Preston, G.M.; Smith, B.L.; Jung, J.S.; Raina, S.; Moon, C.; Guggino, W.B.; Nielsen, S. Aquaporin CHIP: The archetypal molecular water channel. Am. J. Physiol.-Renal. Physiol. 1993, 265, F463–F476. [Google Scholar] [CrossRef] [PubMed] [Green Version]
  3. Jung, J.S.; Prestont, G.M.; Smith, B.L.; Guggino, W.B.; Agre, P. Molecular structure of the water channel through aquaporin CHIP. The hourglass model. J. Biol. Chem. 1994, 269, 14648–14654. [Google Scholar] [CrossRef]
  4. Murata, K.; Mitsuoka, K.; Hirai, T.; Walz, T.; Fujiyoshi, Y. Structural determinants of water permeation through aquaporin-1. Nature 2000, 407, 599–605. [Google Scholar] [CrossRef]
  5. Hill, A.E.; Shachar-Hill, B.; Shachar-Hill, Y. What Are Aquaporins For? J. Membr. Biol. 2004, 197, 1–32. [Google Scholar] [CrossRef] [PubMed]
  6. Kosicka, E.; Grobys, D.; Kmita, H.; Lesicki, A.; Pieńkowska, J. Putative new groups of invertebrate water channels based on the snail Helix pomatia L. (Helicidae) MIP protein identification and phylogenetic analysis. Eur. J. Cell Biol. 2016, 95, 543–551. [Google Scholar] [CrossRef]
  7. Ren, G.; Reddy, V.S.; Cheng, A.; Melnyk, P.; Mitra, A.K. Visualization of a water-selective pore by electron crystallography in vitreous ice. Proc. Natl. Acad. Sci. USA 2001, 98, 1398–1403. [Google Scholar] [CrossRef] [PubMed]
  8. Sui, H.; Han, B.G.; Lee, J.K.; Walian, P.; Jap, B.K. Structural basis of water-specific transport through the AQP1 water channel. Nature 2001, 414, 872–878. [Google Scholar] [CrossRef] [Green Version]
  9. Kreida, S.; Törnroth-Horsefield, S. Trnroth-Horsefield. Structural insights into aquaporin selectivity and regulation. Curr. Opin. Struct. Biol. 2015, 33, 126–134. [Google Scholar] [CrossRef]
  10. Wan, Q.; Zhang, Y.; Zhang, Y.H.; Zi-Niu, Y.U. Molecular cloning, characterization, and expression of aquaprorin1 gene in Crassostrea Hongkongensis. Oceanol. Et Limnol. Sinica. 2015, 46, 1078–1087. [Google Scholar]
  11. Ran, Z.; Chen, H.; Ran, Y.; Yu, S.; Li, S.; Xu, J.; Liao, K.; Yu, X.; Zhong, Y.; Ye, M.; et al. Fatty acid and sterol changes in razor clam Sinonovacula constricta (Lamarck 1818) reared at different salinities. Aquaculture 2017, 473, 493–500. [Google Scholar] [CrossRef]
  12. Yan, H.; Li, Q.; Liu, W.; Yu, R.; Kong, L. Seasonal changes in reproductive activity and biochemical composition of the razor clam Sinonovacula constricta (Lamarck 1818). Mar. Biol. Res. 2010, 6, 78–88. [Google Scholar] [CrossRef]
  13. Hu, M.Y.; Sung, P.H.; Guh, Y.J.; Lee, J.R.; Hwang, P.P.; Weihrauch, D.; Tseng, Y.C. Perfused Gills Reveal Fundamental Principles of pH Regulation and Ammonia Homeostasis in the Cephalopod Octopus vulgaris. Front. Physiol. 2017, 8, 162. [Google Scholar] [CrossRef] [PubMed] [Green Version]
  14. Madsen, S.S.; Bujak, J.; Tipsmark, C.K. Aquaporin expression in the Japanese medaka (Oryzias latipes) in freshwater and seawater: Challenging the paradigm of intestinal water transport? J. Exp. Biol. 2014, 217, 3108–3121. [Google Scholar] [PubMed] [Green Version]
  15. Murakami, Y.; Kinoshita, K. 3P030 A Study for the Structural and Physicochemical Properties of Sociable Ligand-Binding Sites in Proteins (01B. Protein: Structure & Function, Poster, The 52nd Annual Meeting of the Biophysical Society of Japan (BSJ2014)). Seibutsu Butsuri 2014, 54, S253. [Google Scholar]
  16. Liu, Y.; Yao, H.; Zhou, T.; Lin, Z.; Dong, Y. The Discovery of Circadian Rhythm of Feeding Time on Digestive Enzymes Activity and Their Gene Expression in Sinonovacula constricta within a Light/Dark Cycle. Front. Mar. Sci. 2021, 8, 744212. [Google Scholar] [CrossRef]
  17. Wang, J.F.; Zhao, Q.L.; Jin, W.B.; You, S.J.; Zhang, J.N. Performance of biological phosphorus removal and characteristics of microbial community in the oxic-settling-anaerobic process by FISH analysis. J. Zhejiang Univ.-SCI. A 2008, 9, 1004–1010. [Google Scholar] [CrossRef]
  18. Politis, S.N.; David, M.; Arianna, S.; Jose-Luis, Z.I.; Miest, J.J.; Jonna, T.; Butts, I.; Chen, T.Y. Salinity reduction benefits European eel larvae: Insights at the morphological and molecular level. PLoS ONE 2018, 13, e0198294. [Google Scholar] [CrossRef] [Green Version]
  19. Yasui, M. Molecular mechanisms and drug development in aquaporin water channel diseases: Structure and function of aquaporins. J. Pharmacol. Sci. 2004, 96, 260–263. [Google Scholar] [CrossRef] [PubMed] [Green Version]
  20. Ishibashi, K.; Hara, S.; Kondo, S. Aquaporin water channels in mammals. Clin. Exp. Nephrol. 2009, 13, 107–117. [Google Scholar] [CrossRef] [PubMed]
  21. Nejsum, L.N.; Zelenina, M.; Aperia, A.; Frøkiær, J.; Nielsen, S.; Nejsum, L.N.; Zelenina, M.; Aperia, A.; Frøkiær, J.; Nielsen, S. Bidirectional regulation of AQP2 trafficking and recycling: Involvement of AQP2-S256 phosphorylation. Am. J. Physiol.-Ren. Physiol. 2005, 57, F930–F938. [Google Scholar] [CrossRef] [PubMed] [Green Version]
  22. Walz, T.; Fujiyoshi, Y.; Engel, A. The AQP Structure and Functional Implications. Handb. Exp. Pharmacol. 2009, 190, 31–56. [Google Scholar]
  23. Törnrothhorsefield, S.; Hedfalk, K.; Fischer, G.; Lindkvistpetersson, K.; Neutze, R. Structural insights into eukaryotic aquaporin regulation. FEBS Lett. 2010, 584, 2580–2588. [Google Scholar] [CrossRef] [PubMed] [Green Version]
  24. Calvanese, L.; Pellegrini-Calace, M.; Oliva, R. In silico study of human aquaporin AQP11 and AQP12 channels. Protein Sci. 2013, 22, 455–466. [Google Scholar] [CrossRef] [Green Version]
  25. Yakata, K.; Tani, K.; Fujiyoshi, Y. Water permeability and characterization of aquaporin-11. J. Struct. Biol. 2011, 174, 315–320. [Google Scholar] [CrossRef] [PubMed]
  26. Ishibashi, K. New Members of Mammalian Aquaporins: AQP10–AQP12. Handb. Exp. Pharmacol. 2009, 190, 251. [Google Scholar]
  27. Giffard-Mena, I.; Boulo, V.; Aujoulat, F.; Fowden, H.; Castille, R.; Charmantier, G.; Cramb, G. Aquaporin molecular characterization in the sea-bass (Dicentrarchus labrax): The effect of salinity on AQP1 and AQP3 expression. Comp. Biochem. Physiol. A Mol. Integr. Physiol. 2007, 148, 430–444. [Google Scholar] [CrossRef] [PubMed]
  28. Pan, X.; Liu, H.; Xu, M.; Xu, H.; Zhang, H.; He, M. Cloning and expression analysis of aquaporin gene AQP4 cDNA from Pinctada fucata martensii. J. Trop. Oceanogr. 2020, 39, 66–75. [Google Scholar]
  29. Pienkowska, J.R.; Kosicka, E.; Wojtkowska, M.; Kmita, H.; Lesicki, A. Molecular identification of first putative aquaporins in snails. J. Membr. Biol. 2014, 247, 239–252. [Google Scholar] [CrossRef] [Green Version]
  30. Drake, L.L.; Boudko, D.Y.; Marinotti, O.; Carpenter, V.K.; Dawe, A.L.; Hansen, I.A. The Aquaporin Gene Family of the Yellow Fever Mosquito, Aedes aegypti. PLoS ONE 2010, 5, e15578. [Google Scholar] [CrossRef] [Green Version]
  31. Hua, G.; Min, W.; Yang, L.; Ying, Z.; Chen, S. Molecular cloning and expression analysis of the aqp1aa gene in half-smooth tongue sole (Cynoglossus semilaevis). PLoS ONE 2017, 12, e0175033. [Google Scholar]
  32. Kamila, F.; Robert, T.B.; Monique, T.R.; Carolina, A.F.; Marta, M.S. Aquaporin in different moult stages of a freshwater decapod crustacean: Expression and participation in muscle hydration control. Comp. Biochem. Physiol. Part A Mol. Integr. Physiol. 2017, 208, 61–69. [Google Scholar]
  33. Pallone, T.L.; Edwards, A.; Ma, T.; Silldorff, E.P.; Verkman, A.S. Requirement of aquaporin-1 for NaCl-driven water transport across descending vasa recta. J. Clin. Investig. 2000, 105, 215–222. [Google Scholar] [CrossRef] [PubMed]
  34. Deane, E.E.; Luk, J.; Woo, N. Aquaporin 1a Expression in Gill, Intestine, and Kidney of the Euryhaline Silver Sea Bream. Front. Physiol. 2011, 2, 39. [Google Scholar] [CrossRef] [Green Version]
  35. Yi, K.K.; Watanabe, S.; Kaneko, T.; Min, D.H.; Park, S.I. Expression of aquaporins 3, 8 and 10 in the intestines of freshwater- and seawater-acclimated Japanese eels Anguilla Japonica. Fish. Sci. 2010, 76, 695–702. [Google Scholar]
  36. Chung, J.S.; Maurer, L.; Bratcher, M.; Pitula, J.S.; Ogburn, M.B. Cloning of aquaporin-1 of the blue crab, Callinectes sapidus: Its expression during the larval development in hyposalinity. Aquat. Biosyst. 2012, 8, 21. [Google Scholar] [CrossRef] [Green Version]
  37. Tsujimoto, H.; Sakamoto, J.M.; Rasgon, J.L. Functional characterization of Aquaporin-like genes in the human bed bug Cimex lectularius. Sci. Rep. 2017, 7, 3214. [Google Scholar] [CrossRef] [Green Version]
  38. Laforenza, U.; Cova, E.; Gastaldi, G.; Tritto, S.; Ventura, U. Aquaporin-8 Is Involved in Water Transport in Isolated Superficial Colonocytes from Rat Proximal Colon1. J. Nutr. 2005, 135, 2329–2336. [Google Scholar] [CrossRef] [Green Version]
  39. Ferri, D.; Mazzone, A.; Liquori, G.E.; Cassano, G.; Svelto, M.; Calamita, G. Ontogeny, distribution, and possible functional implications of an unusual aquaporin, AQP8, in mouse liver. Hepatology 2003, 38, 947–957. [Google Scholar] [CrossRef]
  40. Holm, L.M.; Jahn, T.P.; Mller, A.L.B.; Schjoerring, J.K.; Zeuthen, T. NH3 and NH4+ permeability in aquaporin-expressing Xenopus oocytes. Pflüg. Arch. 2005, 450, 415–428. [Google Scholar] [CrossRef]
  41. Kim, Y.K.; Lee, S.Y.; Kim, B.S.; Kim, D.S.; Nam, Y.K. Isolation and mRNA expression analysis of aquaporin isoforms in marine medaka Oryzias dancena, a euryhaline teleost. Comp. Biochem. Physiol. A Mol. Integr. Physiol. 2014, 171, 1–8. [Google Scholar] [CrossRef]
  42. Tingaud-Sequeira, A.; Calusinska, M.; Finn, R.N.; Chauvigné, F.; Lozano, J.; Cerdà, J. The zebrafish genome encodes the largest vertebrate repertoire of functional aquaporins with dual paralogy and substrate specificities similar to mammals. BMC Evol. Biol. 2010, 10, 38. [Google Scholar] [CrossRef] [PubMed] [Green Version]
  43. Ishibashi, K.; Imai, M.; Sasaki, S. Cellular Localization of Aquaporin 7 in the Rat Kidney. Exp. Nephrol. 2000, 8, 252–257. [Google Scholar] [CrossRef]
  44. Castro-Claros, J.D.; Checa, A.; Lucena, C.; Pearson, J.R.; Salas, C. Shell-adductor muscle attachment and Ca2+ transport in the bivalves Ostrea stentina and Anomia ephippium. Acta Biomater. 2020, 120, 249–262. [Google Scholar] [CrossRef] [PubMed]
  45. Gorelick, D.A.; Praetorius, J.; Tsunenari, T.; Nielsen, S.; Agre, P. Aquaporin-11: A channel protein lacking apparent transport function expressed in brain. BMC Biochem. 2006, 7, 14. [Google Scholar] [CrossRef] [PubMed] [Green Version]
  46. Morishita, Y.; Matsuzaki, T.; Hara-chikuma, M.; Andoo, A.; Shimono, M.; Matsuki, A.; Kobayashi, K.; Ikeda, M.; Yamamoto, T.; Verkman, A.; et al. Disruption of Aquaporin-11 Produces Polycystic Kidneys following Vacuolization of the Proximal Tubule. Mol. Cell. Biol. 2005, 25, 7770–7779. [Google Scholar] [CrossRef] [PubMed] [Green Version]
  47. Gosling, E. Bivalve Molluscs: Biology, Ecology and Culture; John Wiley & Sons: Hoboken, NJ, USA, 2013; pp. 433–435. [Google Scholar]
  48. Tipsmark, C.K.; Sorensen, K.J.; Madsen, S.S. Aquaporin expression dynamics in osmoregulatory tissues of Atlantic salmon during smoltification and seawater acclimation. J. Exp. Biol. 2010, 213, 368–379. [Google Scholar] [CrossRef] [Green Version]
  49. Choi, Y.J.; Shin, H.S.; Kim, N.N.; Cho, S.H.; Yamamoto, Y.; Ueda, H.; Lee, J.; Choi, C.Y. Expression of aquaporin-3 and −8 mRNAs in the parr and smolt stages of sockeye salmon, Oncorhynchus nerka: Effects of cortisol treatment and seawater acclimation. Comp. Biochem. Phys. A 2013, 165, 228–236. [Google Scholar] [CrossRef]
  50. Chino, N.; Arai, T. Migratory history of the giant mottled eel (Anguilla marmorata) in the Bonin Islands of Japan. Ecol. Freshw. Fish 2010, 19, 19–25. [Google Scholar] [CrossRef]
  51. Strathmann, R. Selection for retention or export of larvae in estuaries. In Estuarine Comparisons; Elsevier Inc.: Amsterdam, The Netherlands, 1982; pp. 521–536. [Google Scholar]
  52. Yeste, M.; Morató, R.; Rodríguez-Gil, J.; Bonet, S.; Prieto-Martínez, N. Aquaporins in the male reproductive tract and sperm: Functional implications and cryobiology. Reprod. Domest. Anim. 2017, 52, 12–27. [Google Scholar] [CrossRef] [PubMed] [Green Version]
  53. Cerdà, J. Molecular pathways during marine fish egg hydration: The role of aquaporins. J. Fish Biol. 2010, 75, 2175–2196. [Google Scholar] [CrossRef] [PubMed]
Figure 1. Sc-AQP1, Sc-AQP8, and Sc-AQP11 3′RACE and 5′RACE amplifications.
Fishes 07 00069 g001
Figure 2. Three-dimensional structure of a functional unit of AQP protein predicted by SWISS-MODEL. The functional unit of AQP is a tetramer with each monomer providing an independent channel pore that transports water across the cell membrane (∗).
Fishes 07 00069 g002
Figure 3. Alignment of the amino acid sequences among Sc-AQP1, Sc-AQP8, Sc-AQP11, Cg-AQP1, Cg-AQP8, and Cg-AQP11. The aligned sequences are as follows: Sc-AQP1, QIE08067.1; Sc-AQP8, QIE08068.1; Sc-AQP11, QIE08069.1; Cg-AQP1, XP_011446842.2; Cg-AQP8, XP_011436665.2; Cg-AQP11, XP_019923893.2. Cg indicated the Crassostrea gigas (Thunberg, 1793). Identical (dark blue) and similar (pink and gray) residues were indicated. Conserved NPA and NPC motifs are marked with the red frame.
Fishes 07 00069 g003
Figure 4. Phylogenetic analysis of three Sc-AQPs (Sc-AQP1, Sc-AQP8, and Sc-AQP11) with AQP family members of other species. The phylogeny tree was built by using amino acid sequences of 80 available AQPs. The AQP genes of S. constricta are labeled with star. The sequences are described by the GenBank accession number, and the detailed information of these sequences are included in Supplementary Table S1.
Fishes 07 00069 g004
Figure 5. Quantitative expression analysis of Sc-AQP1, Sc-AQP8, and Sc-AQP11 in different tissues (A,C,E) and developmental stages (B,D,F). Vertical bars represent the mean ± SE (n = 5) and mean ± SE (n = 200) in tissues and developmental stages analysis, respectively. SE represents independent biological replicates. Data were statistically analyzed by using one-way ANOVA, followed by the LSD test. Bars with different letters are significantly different (p < 0.01).
Fishes 07 00069 g005
Figure 6. Temporal expressions of the Sc-AQP1 (A), Sc-AQP8 (B), and Sc-AQP11 (C) after salinity challenge of 3.5, 18, and 35 psu. Vertical bars represent the mean ± SE (n = 15). Data were statistically analyzed by using one-way ANOVA followed by the LSD test. The asterisks (*) show a significant difference between the salinity challenge group (3.5 and 35 psu) and the control group (18 psu) at each sampling time. Note: * p < 0.05; ** p < 0.01.
Fishes 07 00069 g006
Figure 7. Osmotic pressure changes in S. constricta post-exposure to the low- and high-salinity environment. Vertical bars represent the mean ± SE (n = 5). Data were statistically analyzed by using one-way ANOVA, followed by the LSD test. The asterisks (*) show a significant difference between the experimental group (low- and high-salinity group) and the control group at each sampling time. Note: * p < 0.05.
Fishes 07 00069 g007
Figure 8. Relative expression levels of Sc-AQP1 (A), Sc-AQP8 (B), and Sc-AQP11 (C) and osmotic pressure changes (D) in S. constricta post-injection with DEPC-treated water and corresponding dsRNA and siRNA. Vertical bars represent the mean ± SE (n = 5). Data were statistically analyzed by using one-way ANOVA, followed by the LSD test. The asterisks (*) show a significant difference between the RNA interference group (dsRNA and siRNA) and the control group at each sampling time. Note: * p < 0.05; ** p < 0.01.
Fishes 07 00069 g008
Figure 9. Immunofluorescence of Sc-AQP1, Sc-AQP8, and Sc-AQP11 in different tissues. The positive signal of Sc-AQPs genes is indicated in green, and nuclei were stained with DAPI in blue. CCs, columnar cells. ECs, endothelial cells. MCs, muscle cells. Scale bars are 100 µm.
Fishes 07 00069 g009
Table 1. Primers used for Sc-AQP1, Sc-AQP8, and Sc-AQP11 gene cloning; qRT-PCR; and RNA interference.
PrimerPrimer Sequence (5′-3′)PurposeAmplicon Size (bp)
5′RACE-AQP1CCAGCAGTCCACCCACAATAGGC5RACE1126
5′RACE-AQP8CCAGGCTCCACAGTCGTGTCACCAAT5′RACE761
5′RACE-AQP11TCCCCCCACCAAGACTGCCGAAT5′RACE879
3′RACE-AQP1ACACCAGCAACTCCAGCCACCCT3′RACE1167
3′RACE-AQP8TGGTGACACGACTGTGGAGCCTGG3′RACE1498
3′RACE-AQP11CGGCTTTTGGCTCTTTATCGCTGTT3′RACE1381
RT-AQP1FCACCAGCAACTCCAGCCAqRT-PCR142
RT-AQP1RCAGGACCGCCCTCCATAAqRT-PCR
RT-AQP8FCATCTGTCCCCGATTATTGGTqRT-PCR90
RT-AQP8RGGTGAAGACGAGAACCAGTGTqRT-PCR
RT-AQP11FTGCCTGAACCAATCAAAACqRT-PCR120
RT-AQP11RCAGCGATAAAGAGCCAAAAqRT-PCR
18SFTCGGTTCTATTGCGTTGGTTTTqRT-PCR121
18SRCAGTTGGCATCGTTTATGGTCAqRT-PCR
dsRNAi- AQP1F1TAATACGACTCACTATAGGGGTCACCCCTAGCCGTCTACARNAi320
dsRNAi- AQP1R1TAATACGACTCACTATAGGGAGCAGTCCACCCACAATAGGRNAi
dsRNAi- AQP8F1TAATACGACTCACTATAGGGTCGGGGTGACATTGTTTGTARNAi316
dsRNAi- AQP8R1TAATACGACTCACTATAGGGCCAATAATCGGGGACAGATGRNAi
dsRNAi- AQP11F1TAATACGACTCACTATAGGGTGATGCCTGAACCAATCAAARNAi379
dsRNAi- AQP11R1TAATACGACTCACTATAGGGCCGTAAAAGAACGCCACATTRNAi
siRNAi- AQP1F1GATCACTAATACGACTCACTATAGGGTTCAGATGTTCGGACACATTTCATTRNAi22
siRNAi- AQP1R1AATGAAATGTGTCCGAACATCTGAAGTGATCRNAi
siRNAi- AQP1F2AATTCAGATGTTCGGACACATTTCAGTGATCRNAi22
siRNAi- AQP1R2GATCACTAATACGACTCACTATAGGGGCTCCGAAAAATGTTCTGTTGGCTTRNAi
siRNAi- AQP8F1GATCACTAATACGACTCACTATAGGGCTGCTGAATGAAGAACATCGAACTTRNAi22
siRNAi- AQP8R1GCTCCGAAAAATGTTCTGTTGGCGTGATCRNAi
siRNAi- AQP8F2AACTGCTGAATGAAGAACATCGAACGTGATCRNAi22
siRNAi- AQP8R2GATCACTAATACGACTCACTATAGGGGTTCGATGTTCTTCATTCAGCAGTTRNAi
siRNAi- AQP11F1GATCACTAATACGACTCACTATAGGGGCCAACAGAACATTTTTCGGAGCTTRNAi22
siRNAi- AQP11R1AAGCTCCGAAAAATGTTCTGTTGGCGTGATCRNAi
siRNAi- AQP11F2AAGCCAACAGAACATTTTTCGGAGCGTGATCRNAi22
siRNAi- AQP11R2GATCACTAATACGACTCACTATAGGGGCTCCGAAAAATGTTCTGTTGGCTTRNAi
Table 2. Summary of sequence features of Sc-AQP1, Sc-AQP8, and Sc-AQP11.
Sequence FeaturesSc-AQP1Sc-AQP8Sc-AQP11
Gen Bank IDMN186579MN186580MN186581
cDNA length (bp)154622351713
ORF (bp)900771843
Length of amino acids (aa)299256280
Molecular weight (kDa)32.3426.8031.52
Theoretical pI6.196.375.89
GRAVY0.4640.7380.415
Asp + Glu211725
Arg + Lys191520
Instability index35.9731.1331.35
Aliphatic index97.53126.8799.61
5′-UTR (bp)40533693
3′-UTR (bp)2401128777
ATTTA motif684
AATAA motif336
NPA motifs221
NPC motifs001
MIP motifs111
Transmembrane helix666
loops555
Table 3. Amino acid identity and similarity of Sc-AQP1, Sc-AQP8, and Sc-AQP11 putative peptides as compared with other AQP1, AQP8, and AQP11 molecules.
AQP *Sc-AQP1Sc-AQP8Sc-AQP11
Identity
(%)
Similarity
(%)
Identity
(%)
Similarity
(%)
Identity (%)Similarity (%)
Homo sapiens—AQP135.949.330.643.512.322.5
Mus musculus—AQP135.349.73144.21222.8
Gallus gallus—AQP125.738.326.436.410.819
Xenopus tropicalis—AQP134.649.729.842.810.322.1
Danio rerio—AQP132.847.730.741.49.819
Sc-AQP110010027.539.611.321.6
Aplysia californica—AQP14766.223.941.110.623.9
Mizuhopecten yessoensis—AQP144.465.126.440.410.421.1
Helix pomatia—AQP146.463.524.541.511.924.7
Crassostrea hongkongensis—AQP143.759.627.839.811.219.9
Homo sapiens—AQP822.8373754.313.323.5
Mus musculus—AQP822.938.138.257.113.323.5
Gallus gallus—AQP821.434.437.45413.726.7
Alligator sinensis—AQP821.235.437.45312.322.3
Danio rerio—AQP819.932.833.250.614.425
Sc-AQP827.539.610010013.223.2
Crassostrea gigas—AQP823.537.854.767.612.523.1
Mizuhopecten yessoensis—AQP827.742.346.160.311.520.2
Pomacea canaliculata—AQP82638.950.264.113.321.4
Aplysia californica—AQP828.539.85164.112.222.7
Homo sapiens—AQP1113.524.514.124.11831.7
Mus musculus—AQP1113.82614.425.11832.7
Gallus gallus—AQP111223.71630.115.528.3
Xenopus laevis—AQP111221.514.429.119.730
Danio rerio—AQP1111.420.917.230.517.728.2
Sc-AQP1111.321.613.223.2100100
Crassostrea virginica—AQP1111.923.511.622.557.772.2
Crassostrea gigas—AQP1111.42211.121.354.968.9
Biomphalaria glabrata—AQP119.421.112.124.349.163.6
Mizuhopecten yessoensis—AQP111122.815.124.45165.5
* The accession number of the AQP sequences used for this analysis are listed in Supplementary Table S1.
Publisher’s Note: MDPI stays neutral with regard to jurisdictional claims in published maps and institutional affiliations.

