Figure 1.
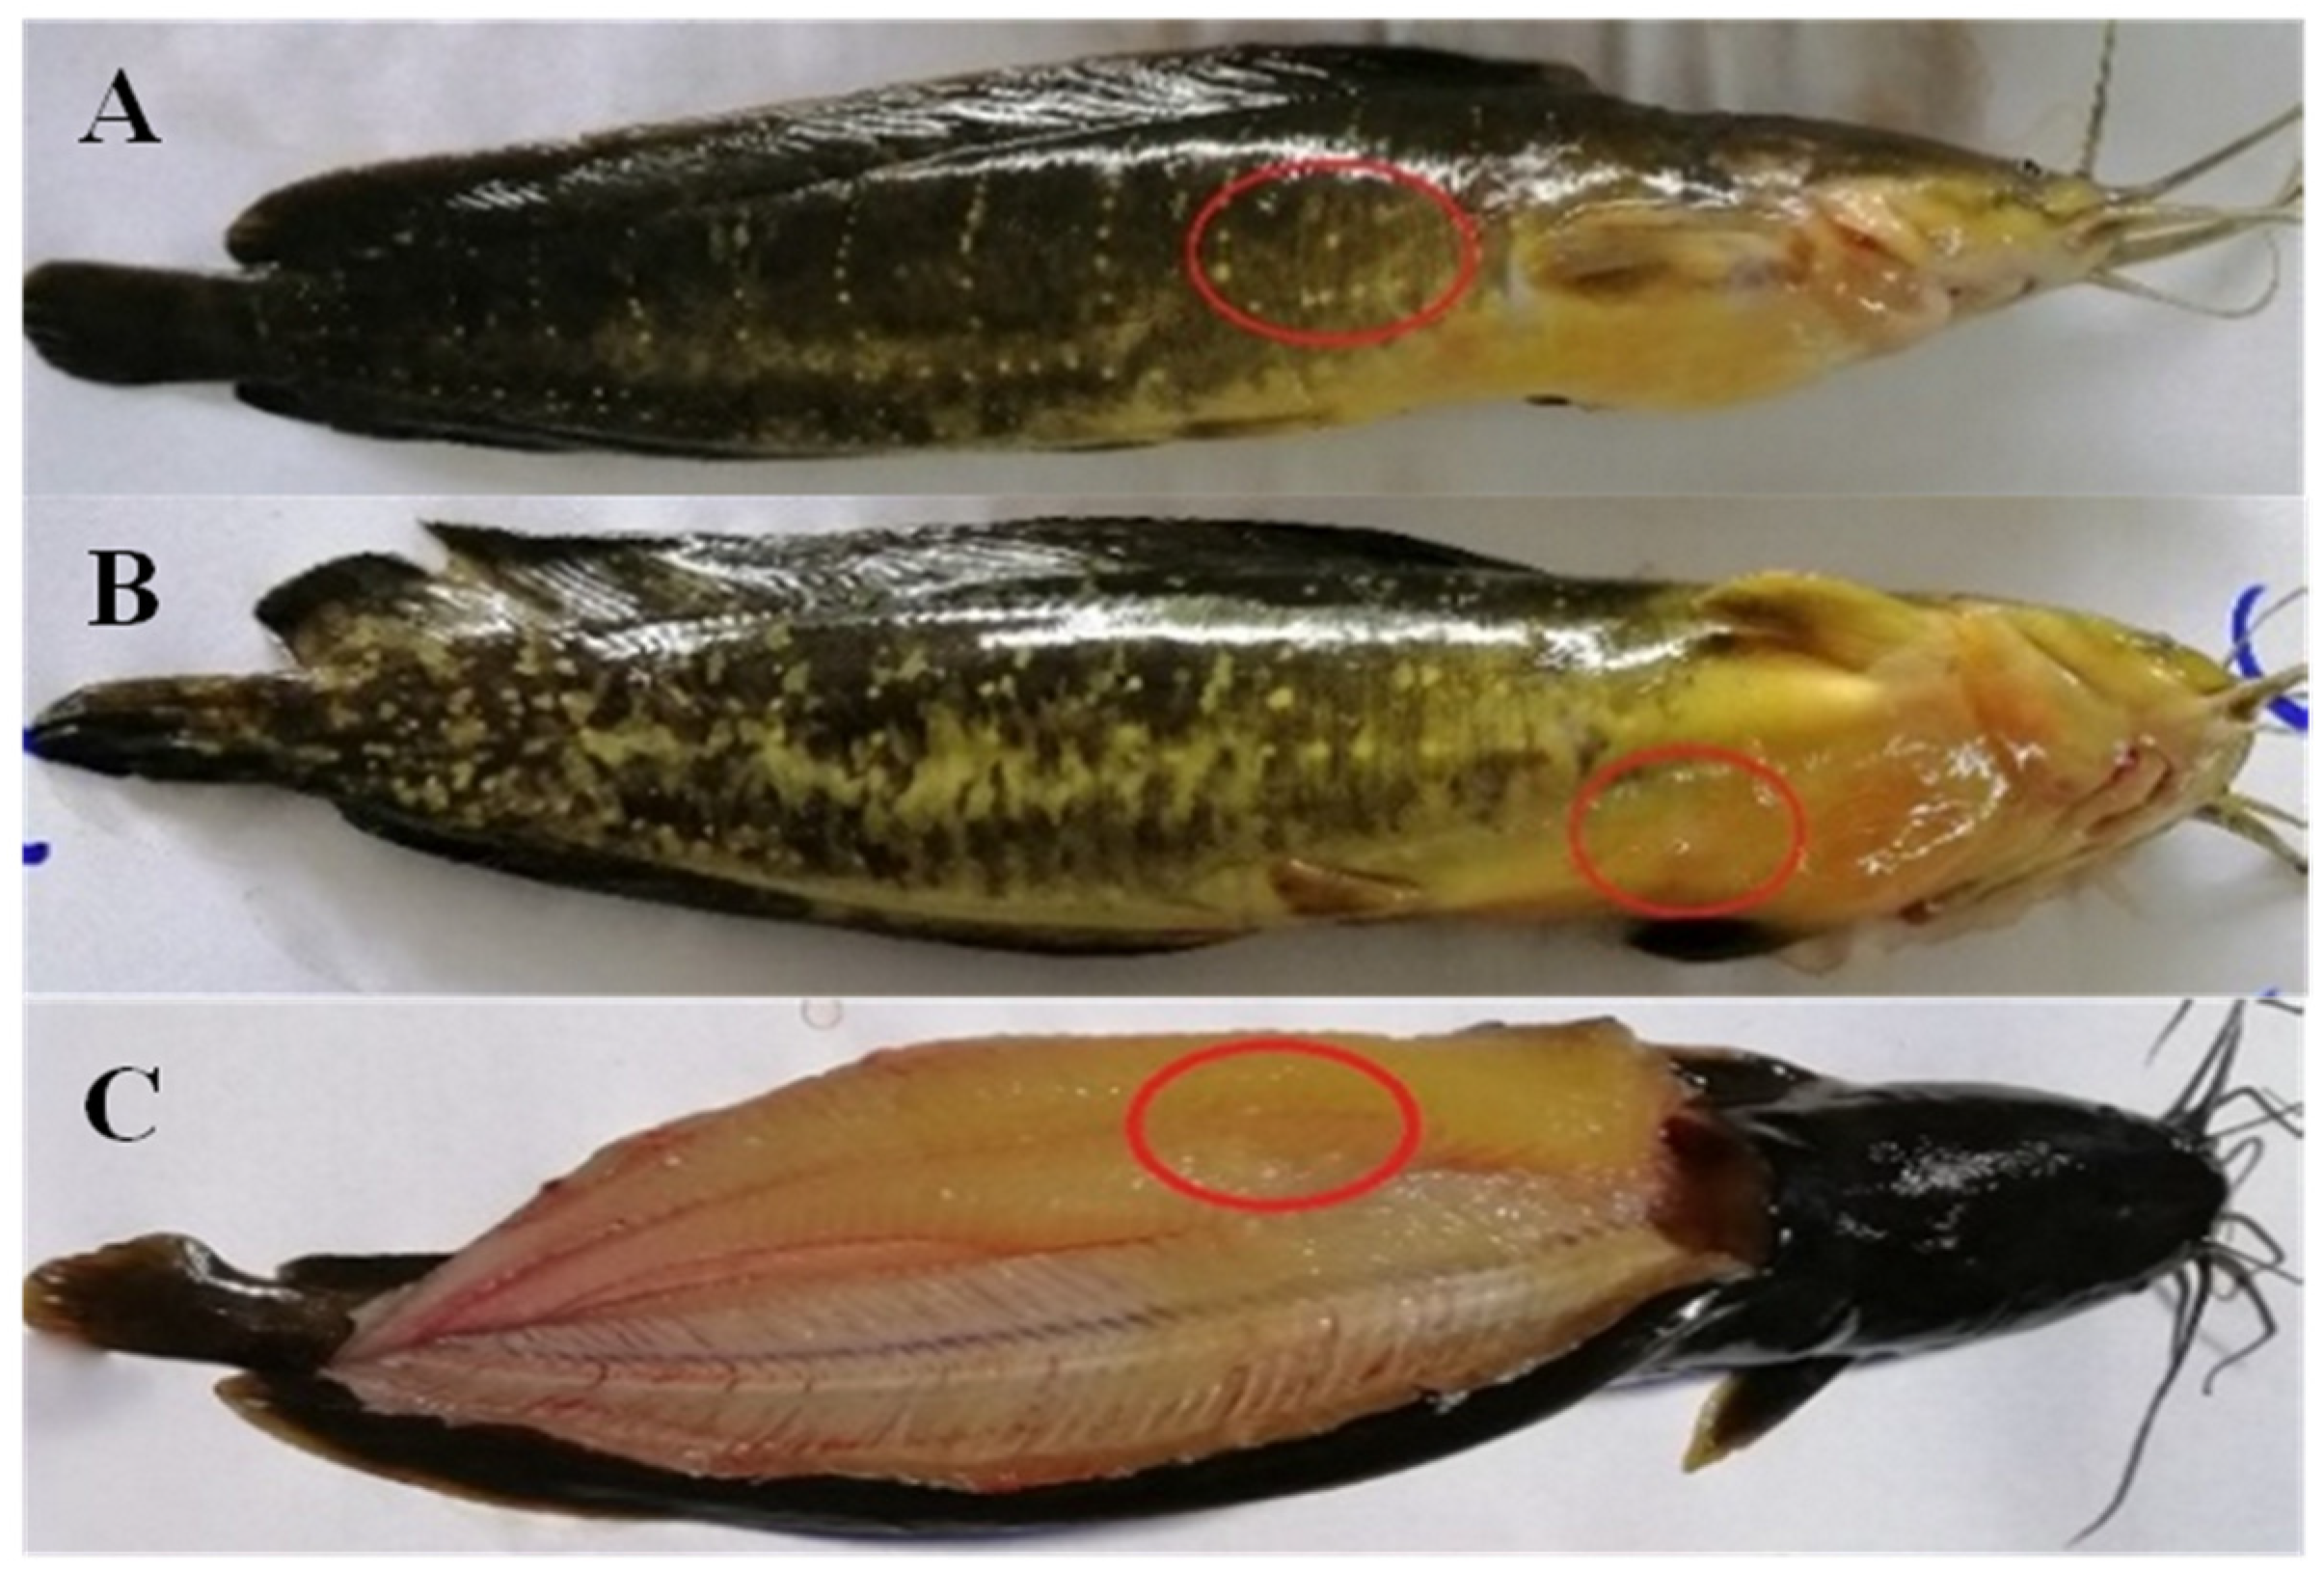
Digital image for site color measurement (circle) of body skin (A), abdominal skin (B), and muscle (C) of bighead catfish.
Figure 1.
Digital image for site color measurement (circle) of body skin (A), abdominal skin (B), and muscle (C) of bighead catfish.
Figure 2.
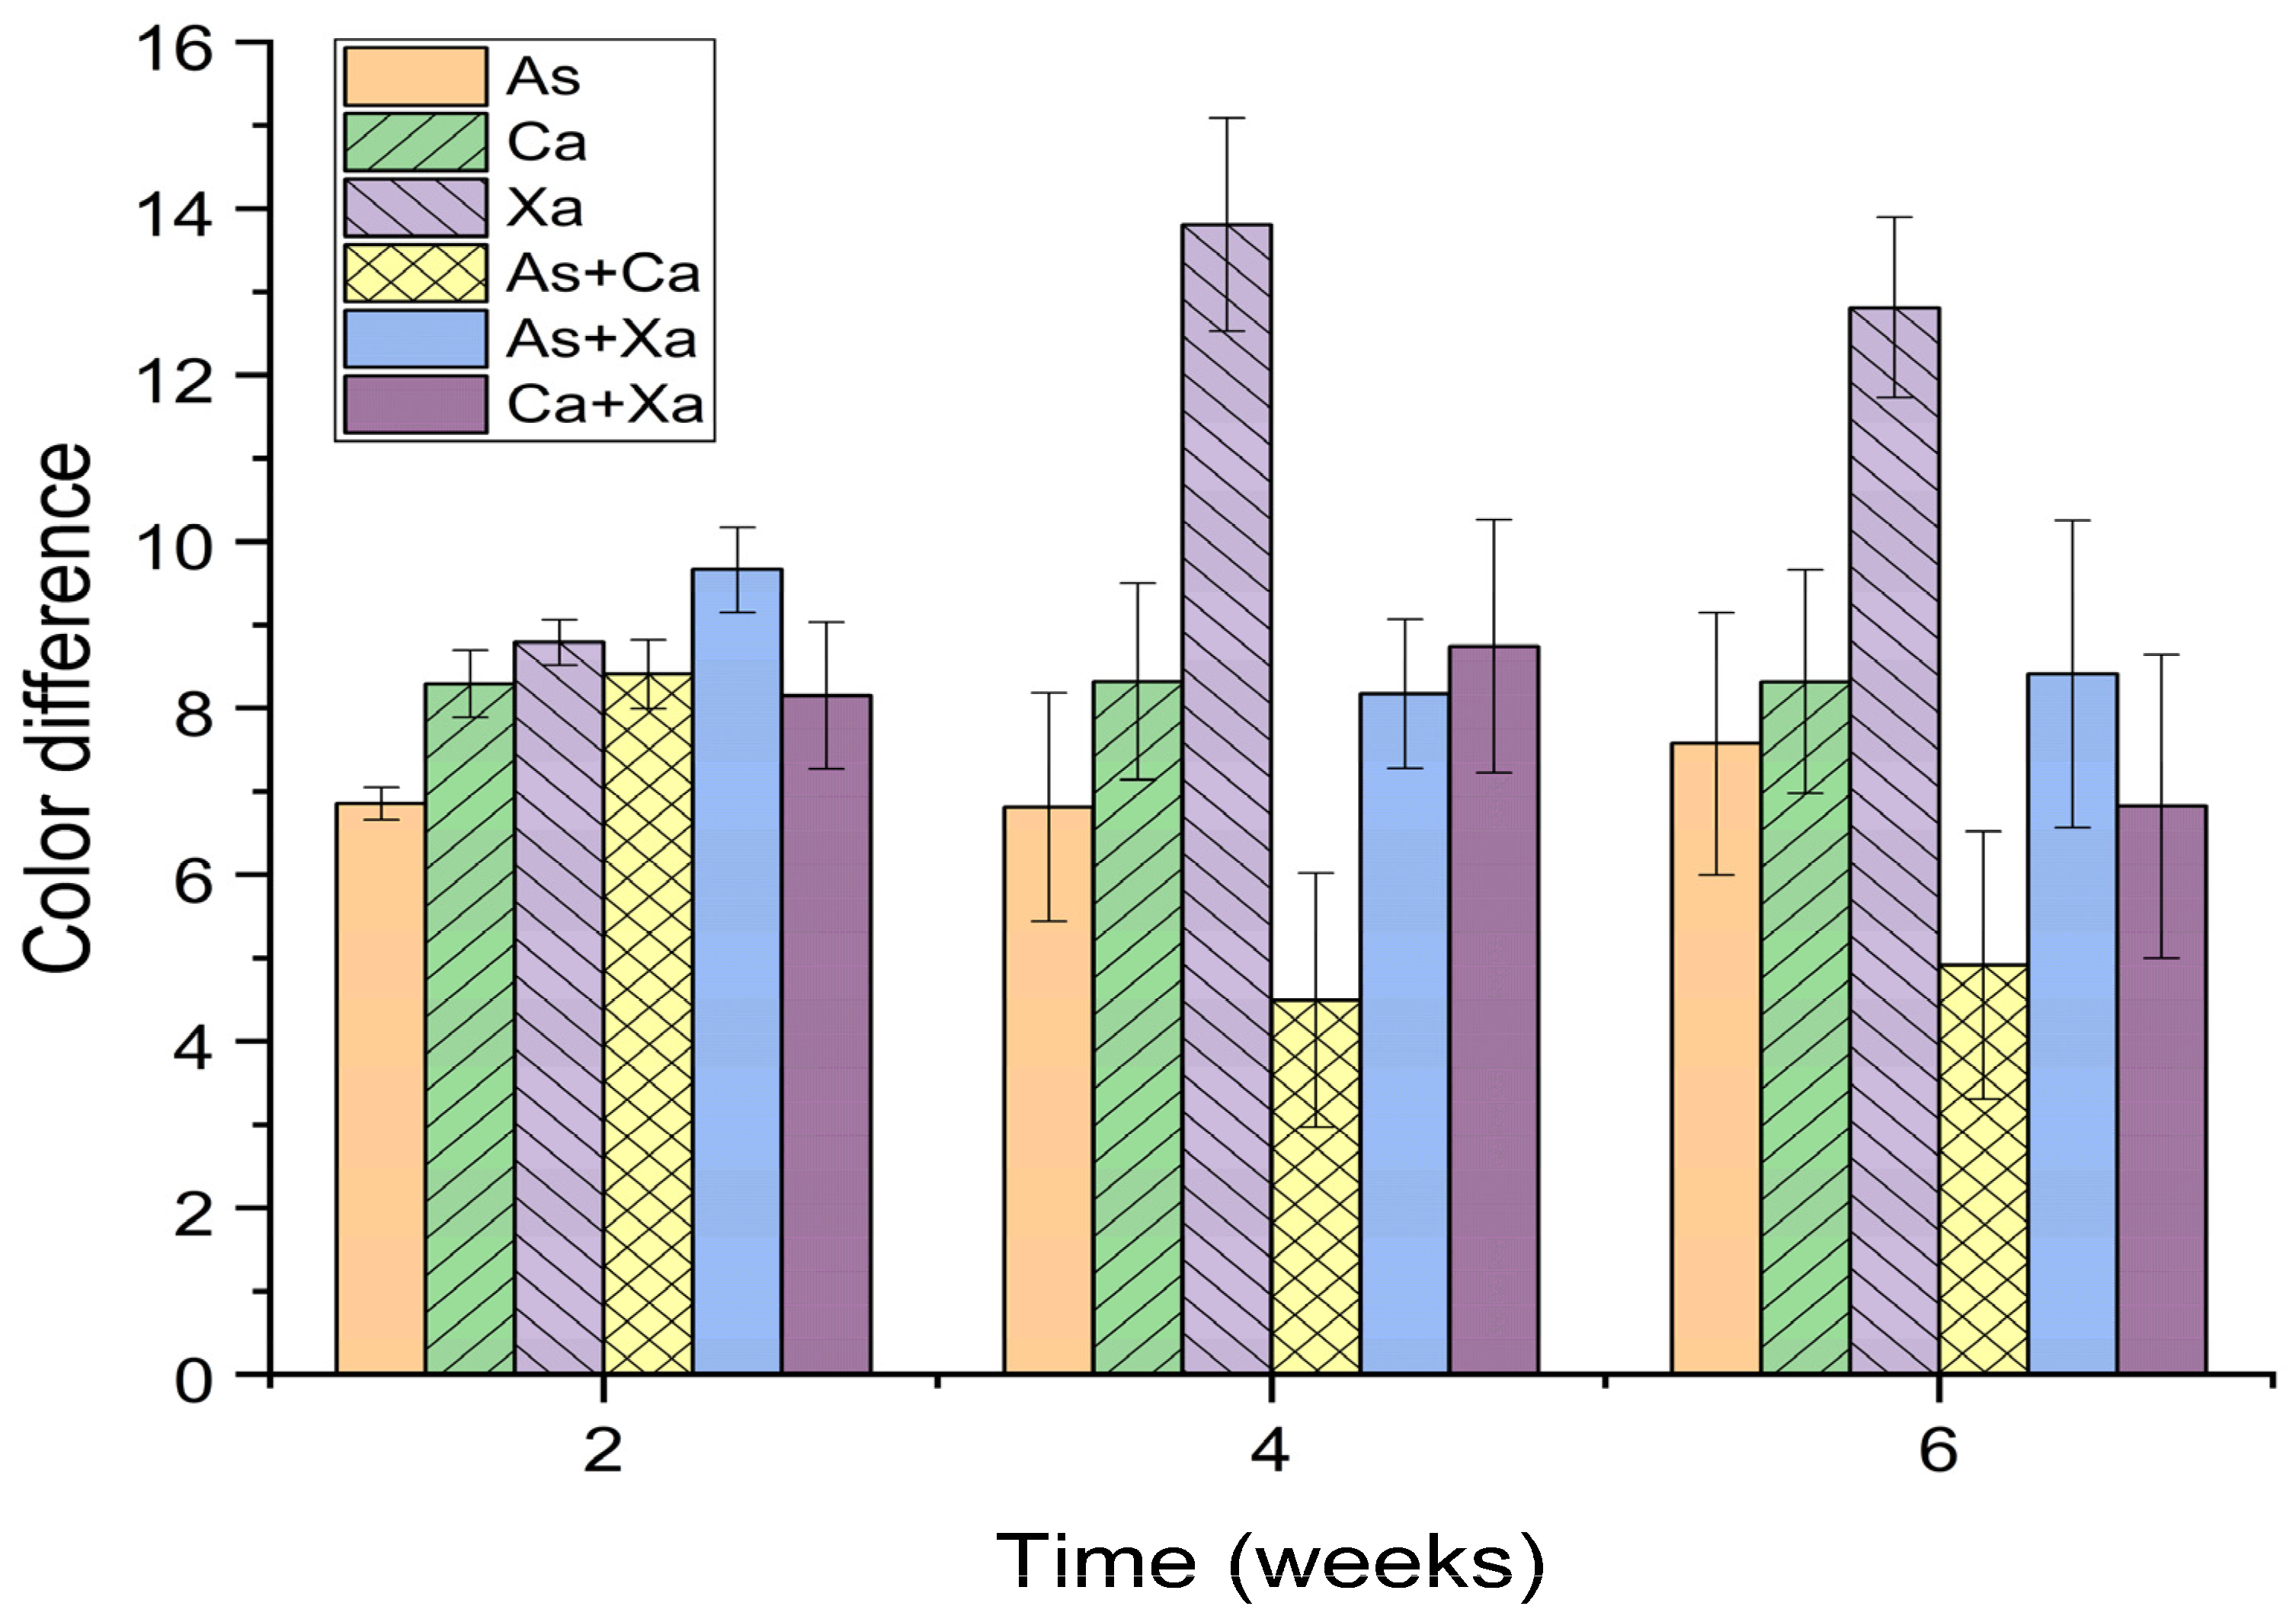
Color performance of bighead catfish fed various dietary pigments at different times of 2, 4, and 6 weeks. Astaxanthin (As), canthaxanthin (Ca), and xanthophyll (Xa).
Figure 2.
Color performance of bighead catfish fed various dietary pigments at different times of 2, 4, and 6 weeks. Astaxanthin (As), canthaxanthin (Ca), and xanthophyll (Xa).
Figure 3.
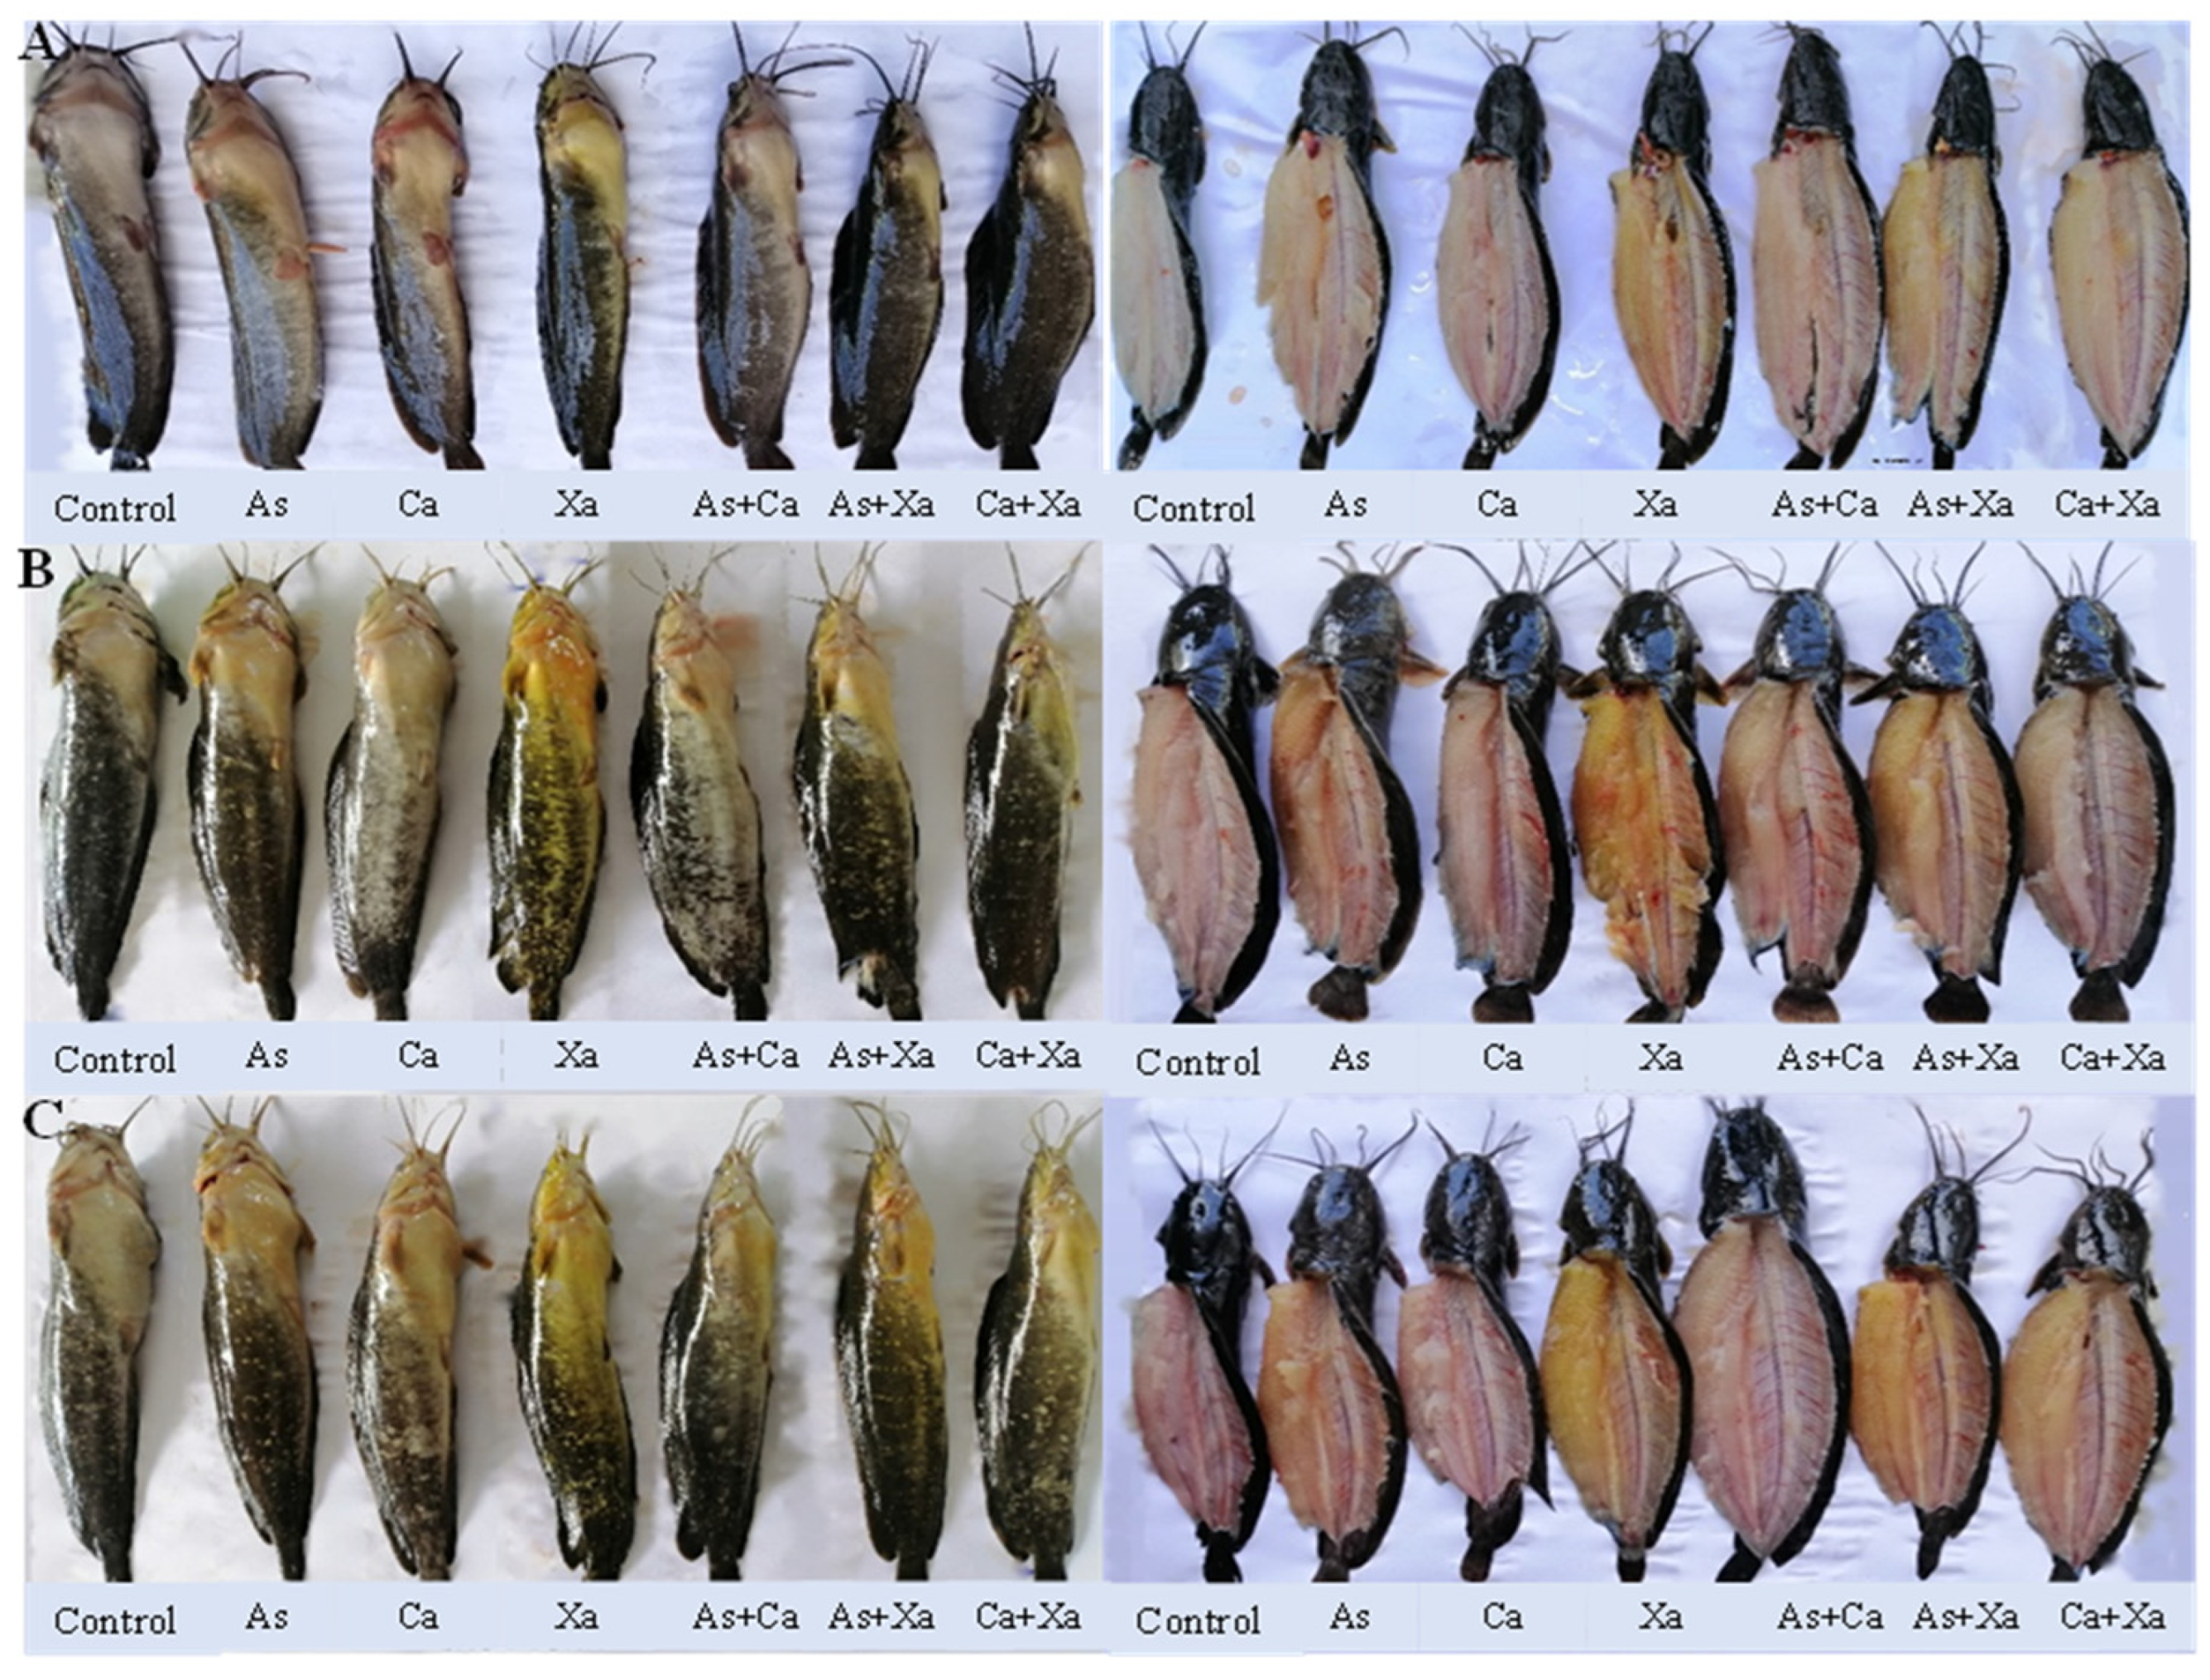
Digital image of body skin and muscle of bighead catfish fed dietary carotenoid pigments for 2 weeks (A), 4 weeks (B), and 6 weeks (C).
Figure 3.
Digital image of body skin and muscle of bighead catfish fed dietary carotenoid pigments for 2 weeks (A), 4 weeks (B), and 6 weeks (C).
Figure 4.
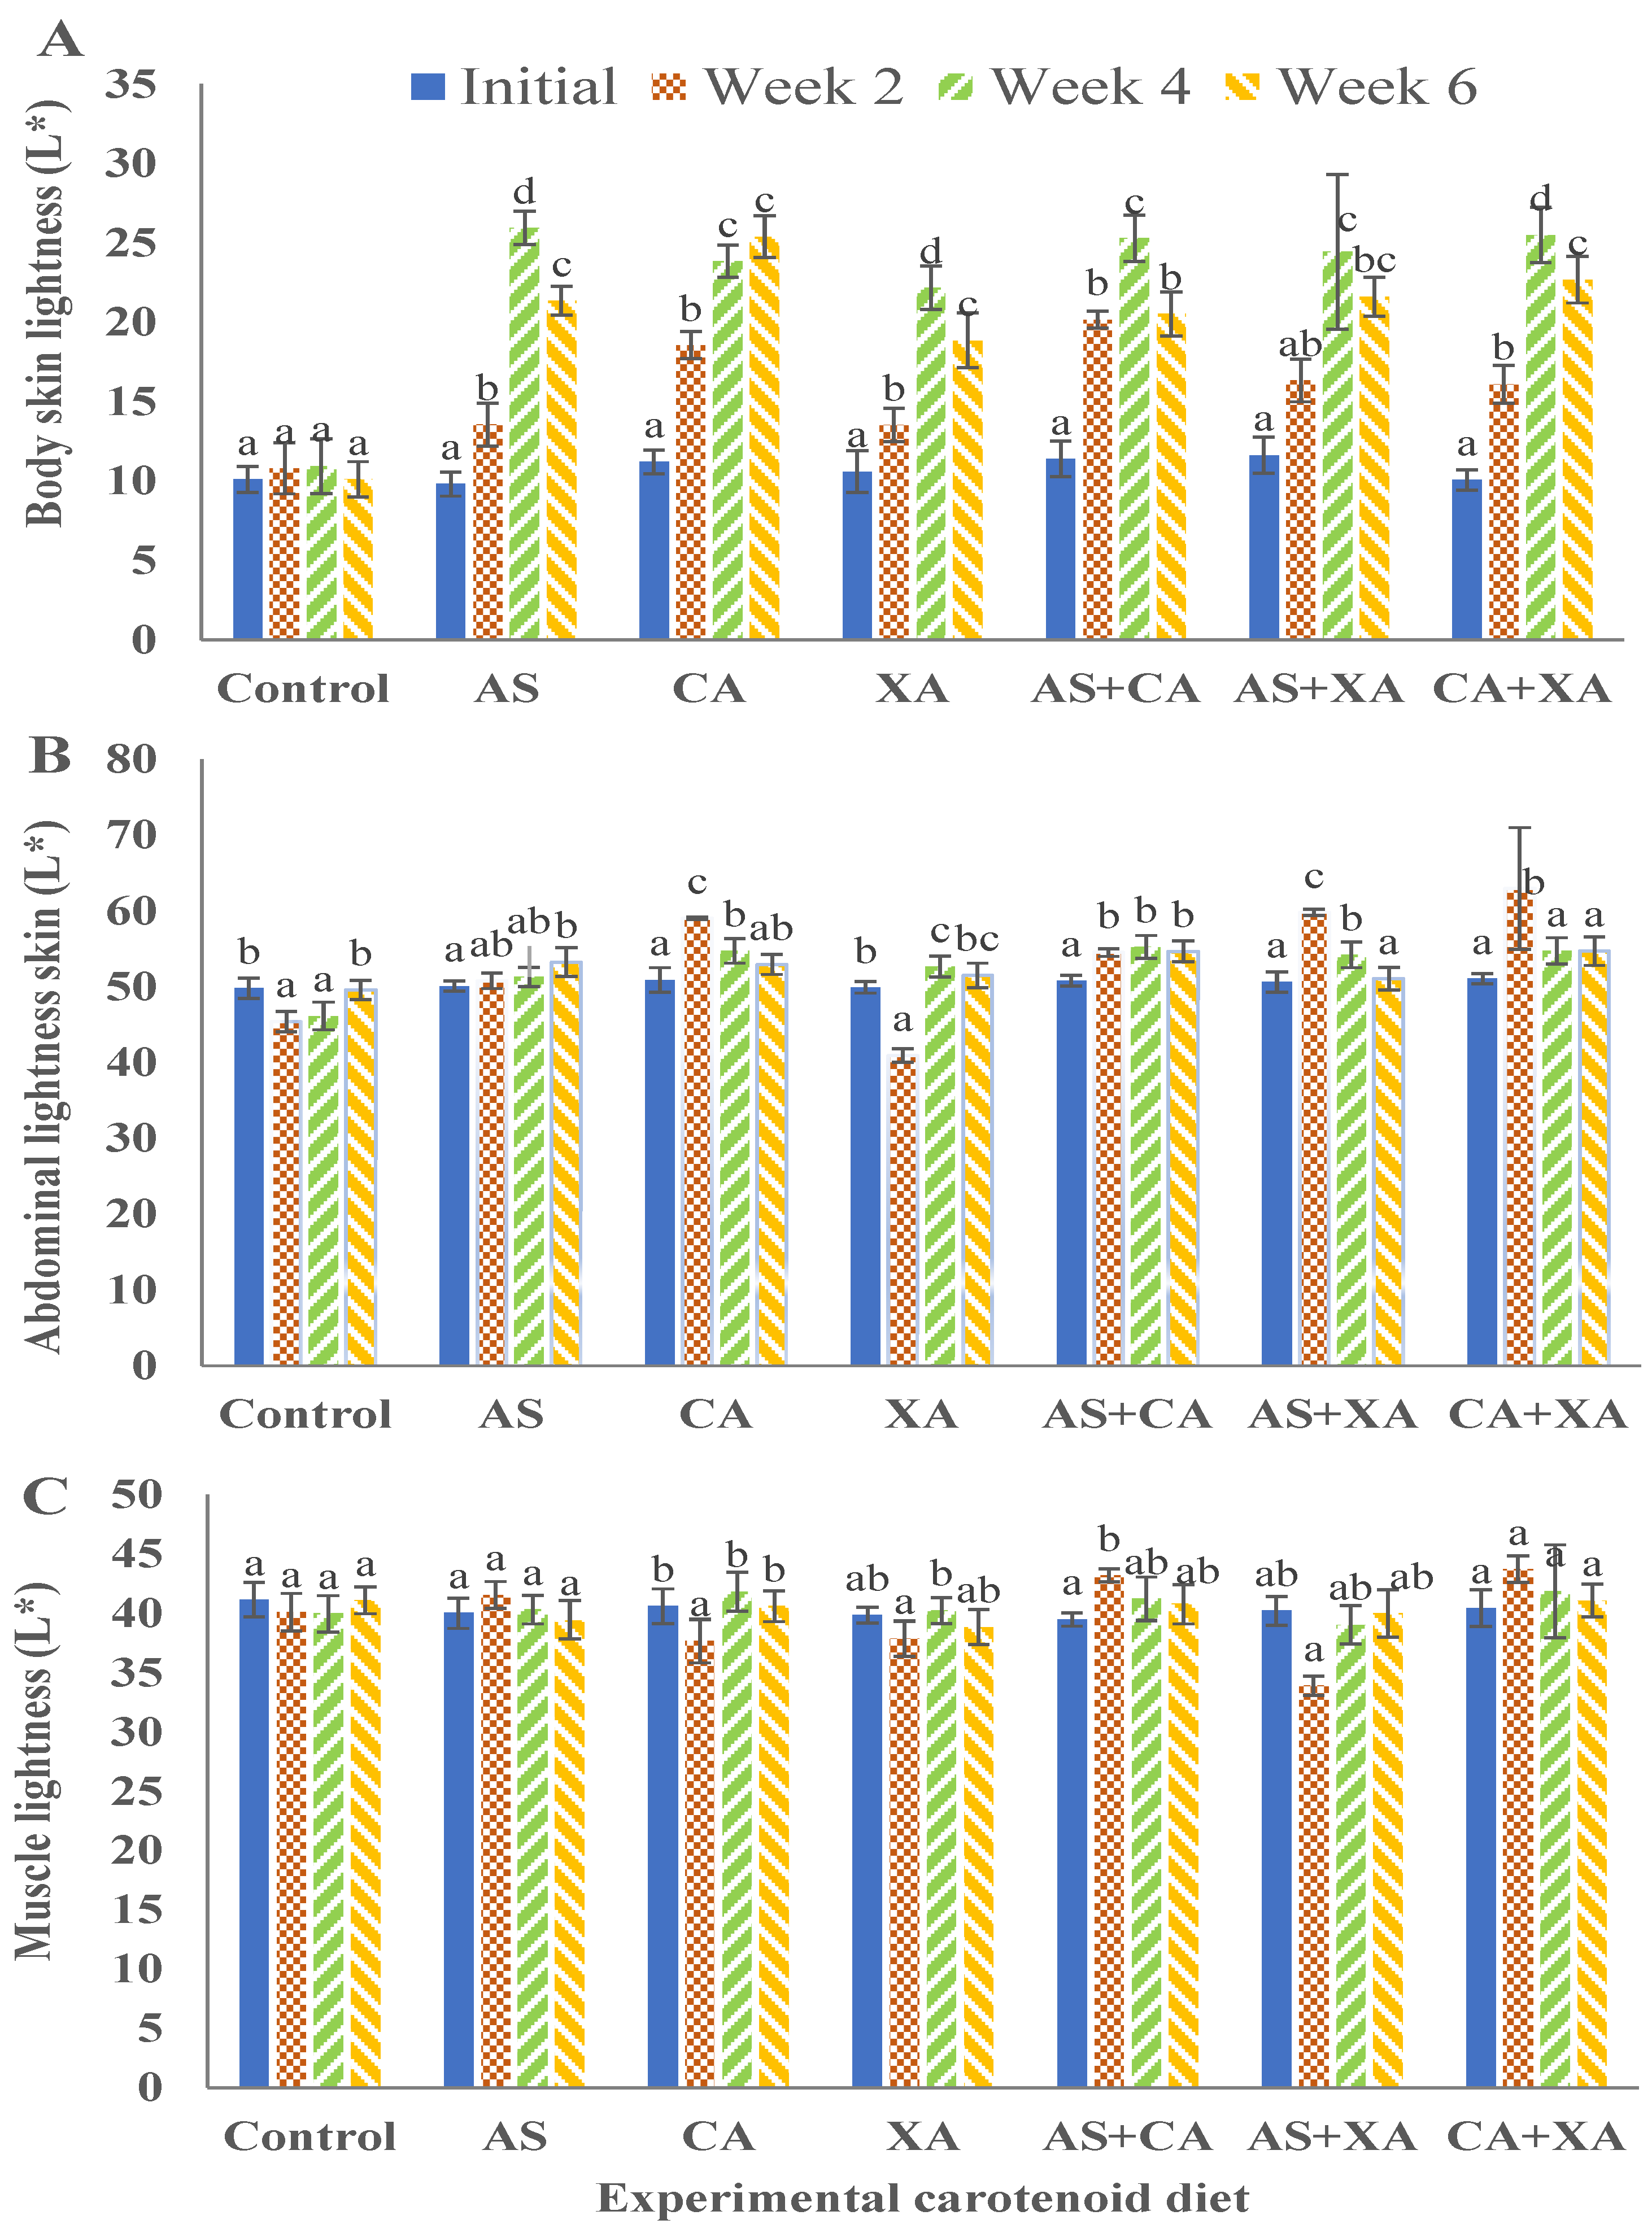
Lightness for body skin (A), abdominal skin (B), and muscle (C) of bighead catfish fed dietary pigments for 2, 4, and 6 weeks. Astaxanthin (As), ccanthaxanthin (Ca), and xanthophyll (Xa). (a, b, c) Average values of different diets at the same sampling time with different letters are significantly different (p < 0.05). Each bar is the mean value of three replicates, three fish per replicate.
Figure 5.
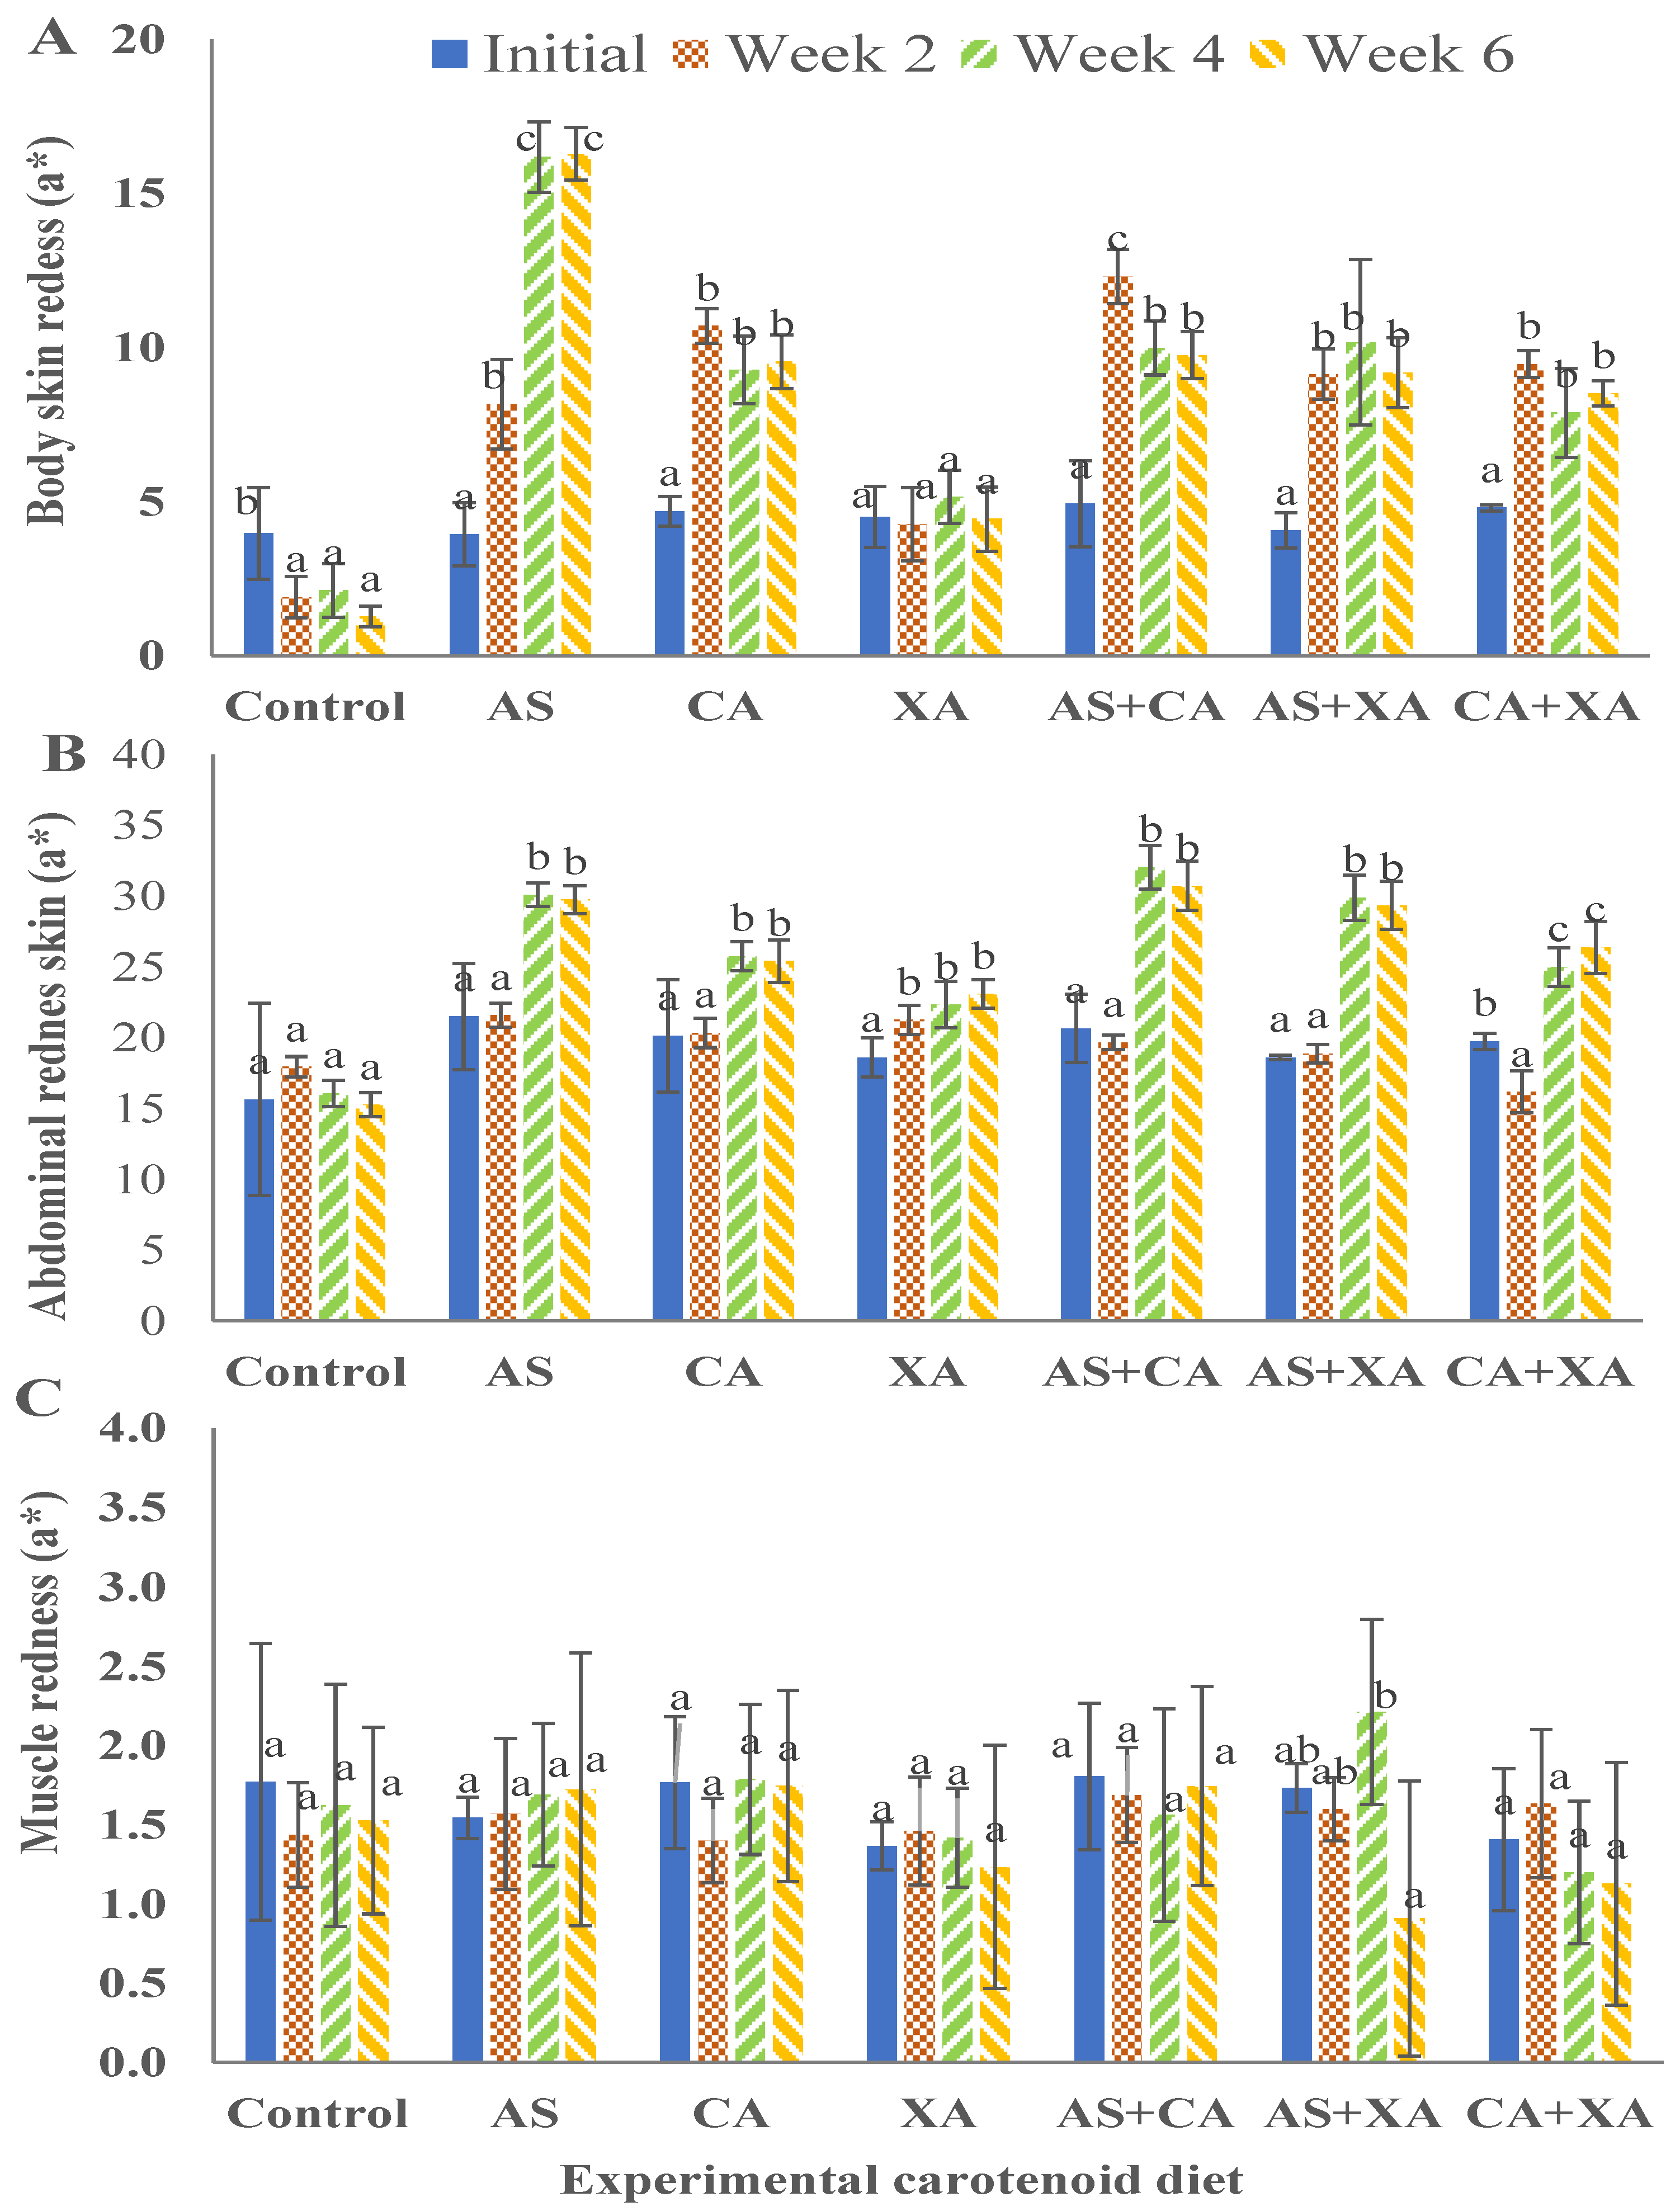
Redness for body skin (A), abdominal skin (B), and muscle (C) of bighead catfish fed dietary pigments for 2, 4, and 6 weeks. Astaxanthin (As), canthaxanthin (Ca), and xanthophyll (Xa). (a, b, c) Average values of different diets at the same sampling time with different letters are significantly different (p < 0.05). Each bar is the mean value of three replicates, three fish per replicate.
Figure 6.
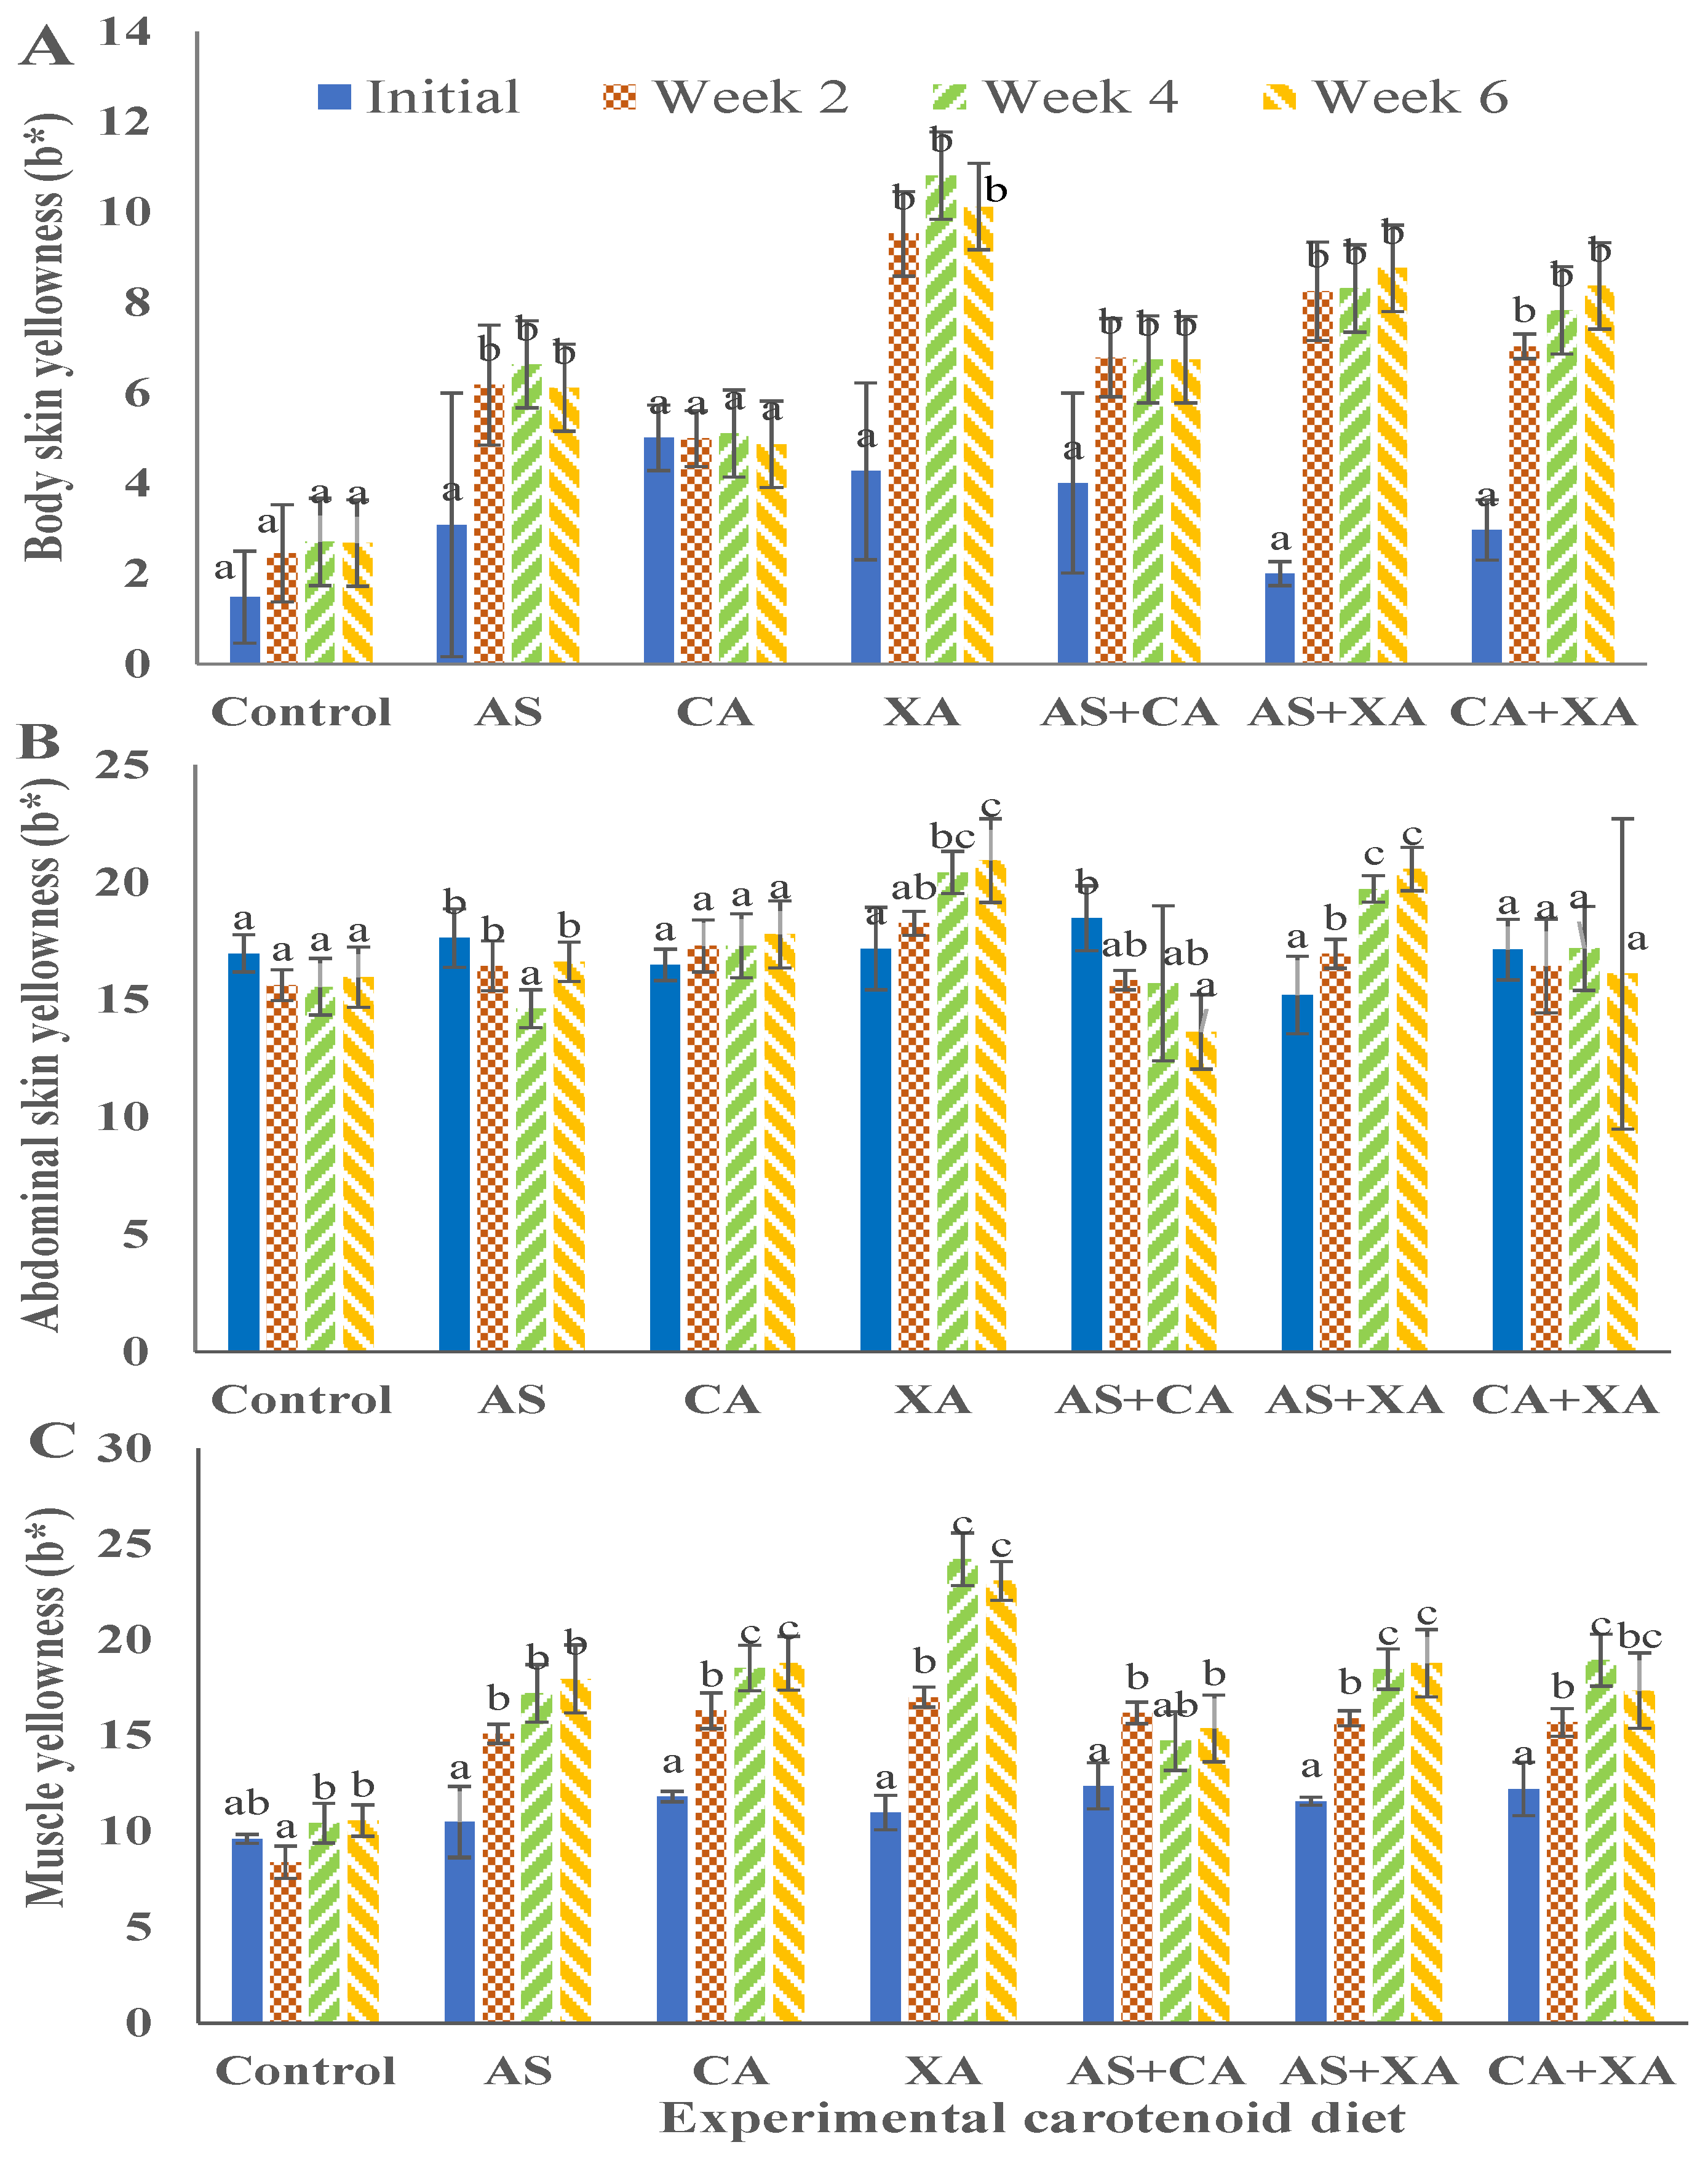
Yellowness (b*) value for body skin (A), abdominal skin (B), and muscle (C) of bighead catfish fed dietary pigments for 2, 4, and 6 weeks. Astaxanthin (As), canthaxanthin (Ca), and xanthophyll (Xa). (a, b, c) Average values of different diets at the same sampling time with different letters are significantly different (p < 0.05). Each bar is the mean value of three replicates, three fish per replicate.
Figure 7.
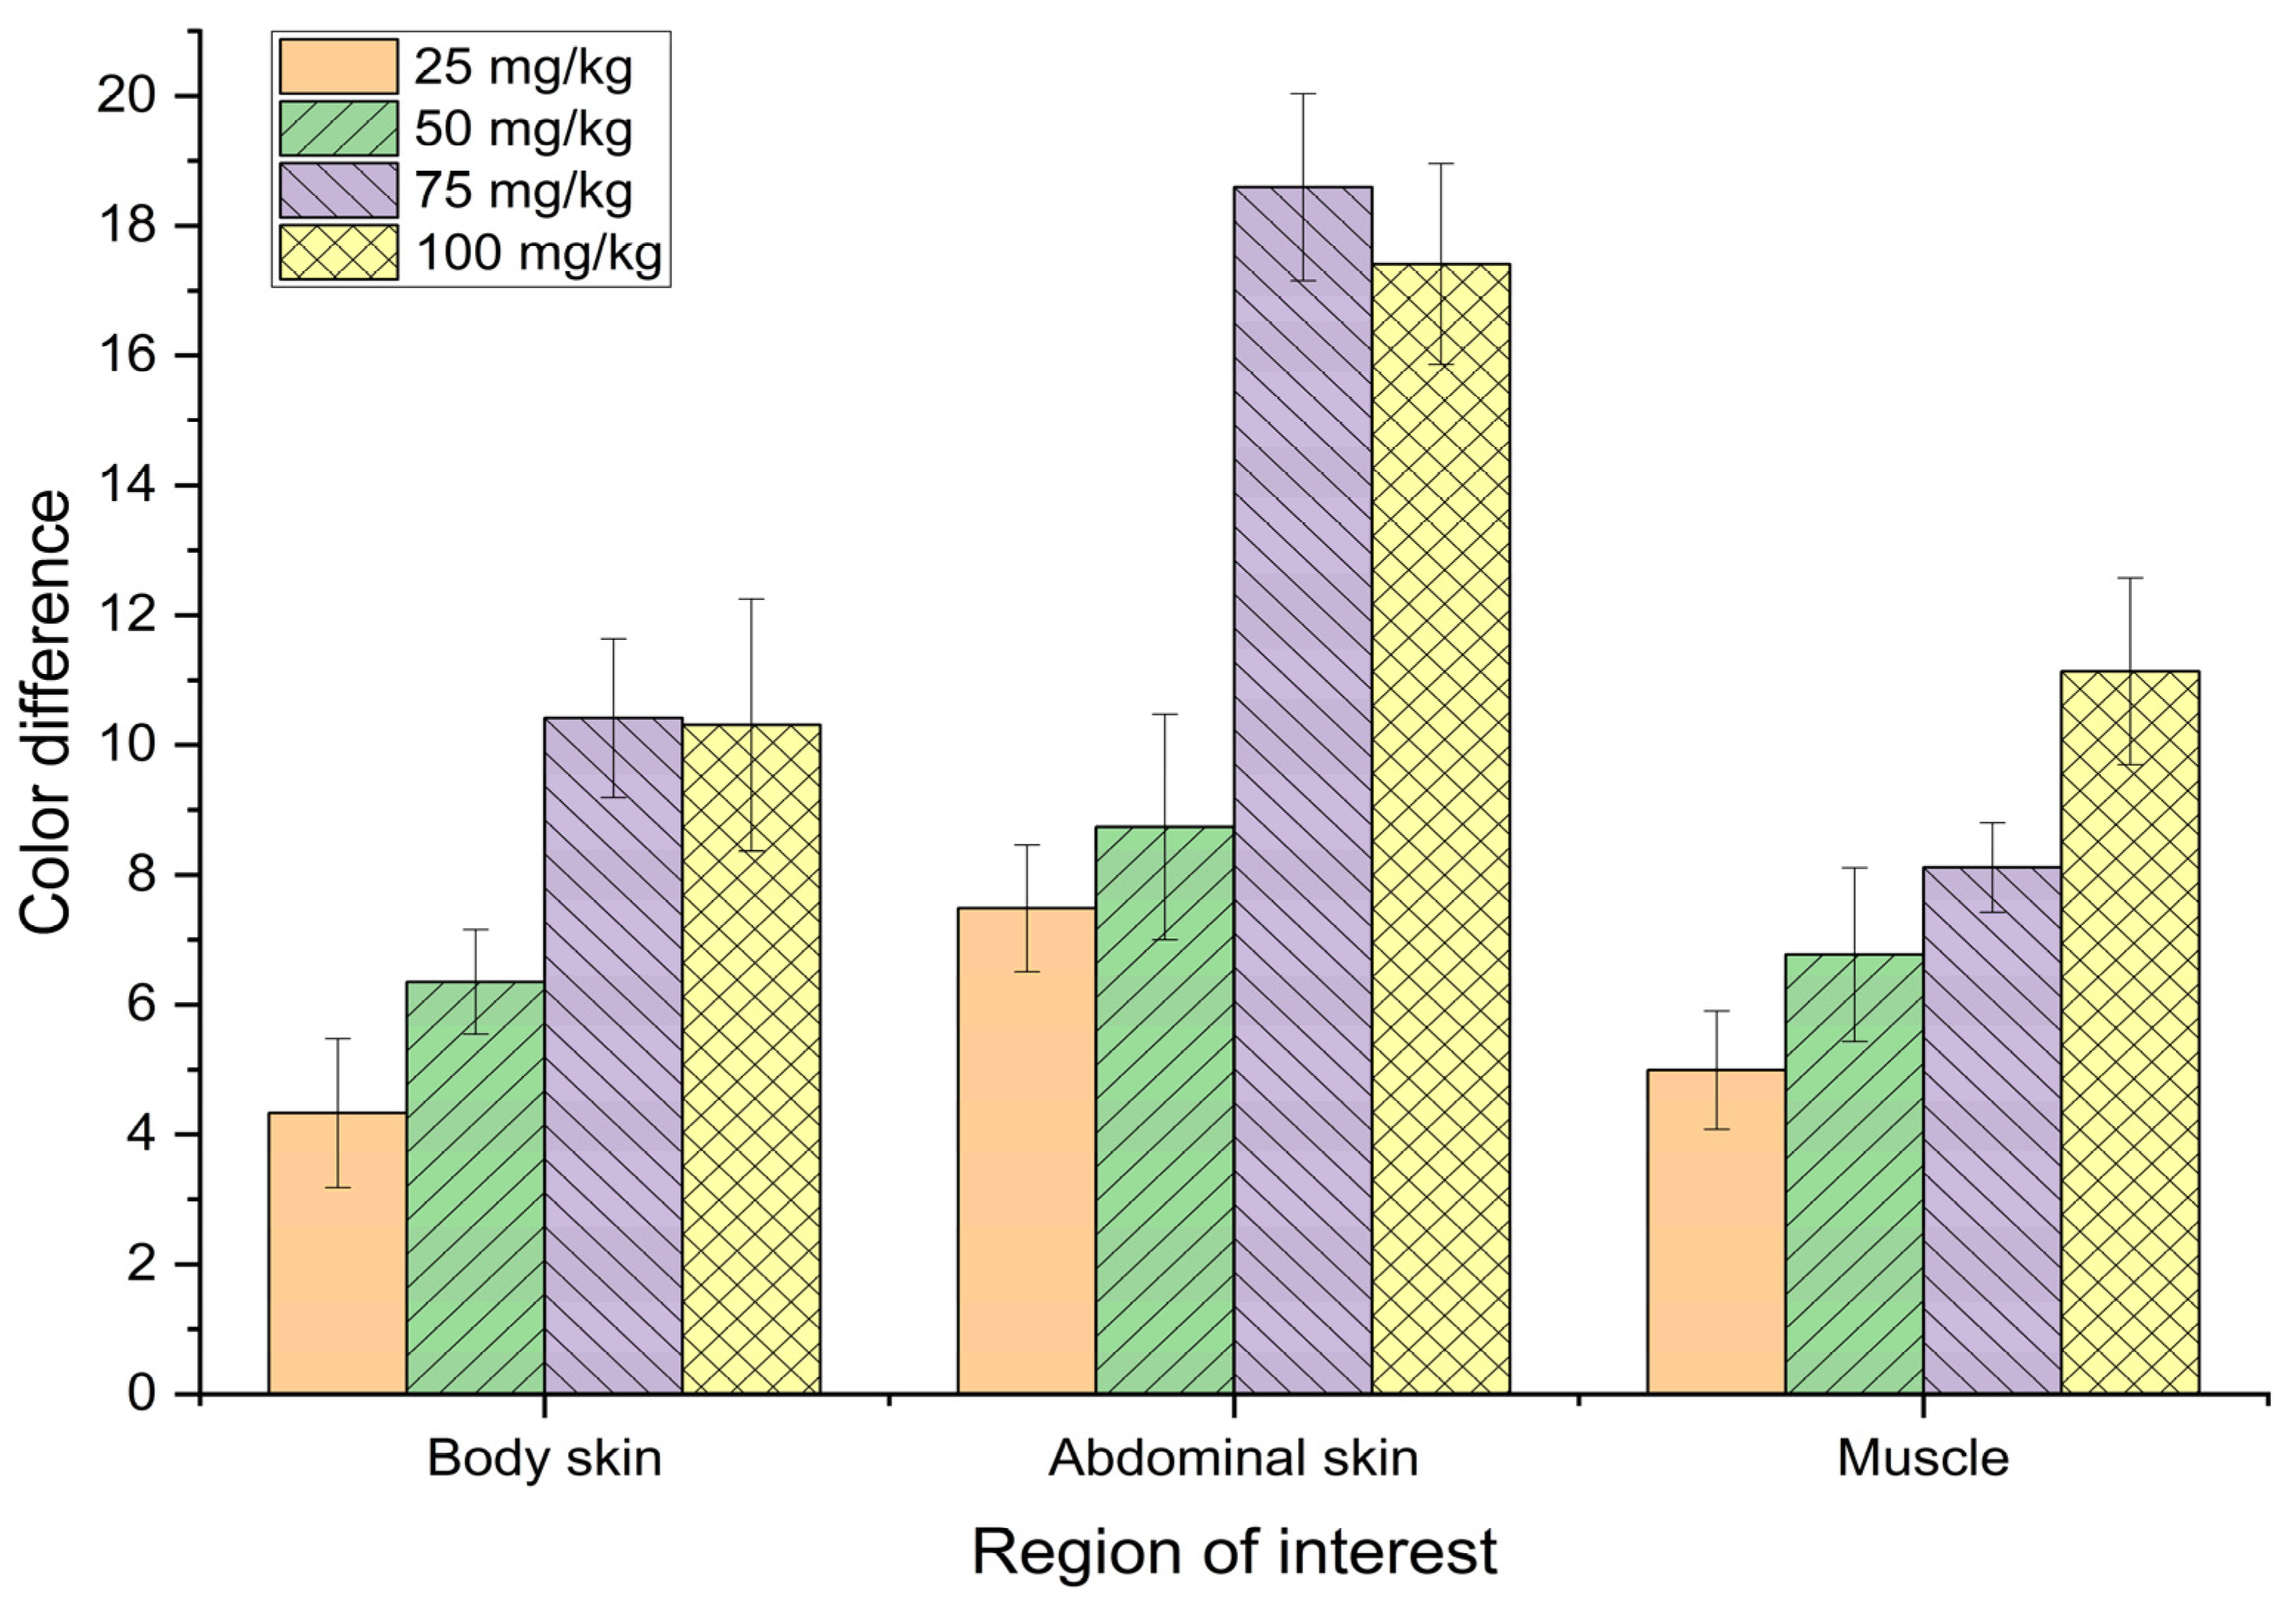
Various colour performance of bighead catfish fed various xanthophyll diets for 4 weeks.
Figure 7.
Various colour performance of bighead catfish fed various xanthophyll diets for 4 weeks.
Figure 8.
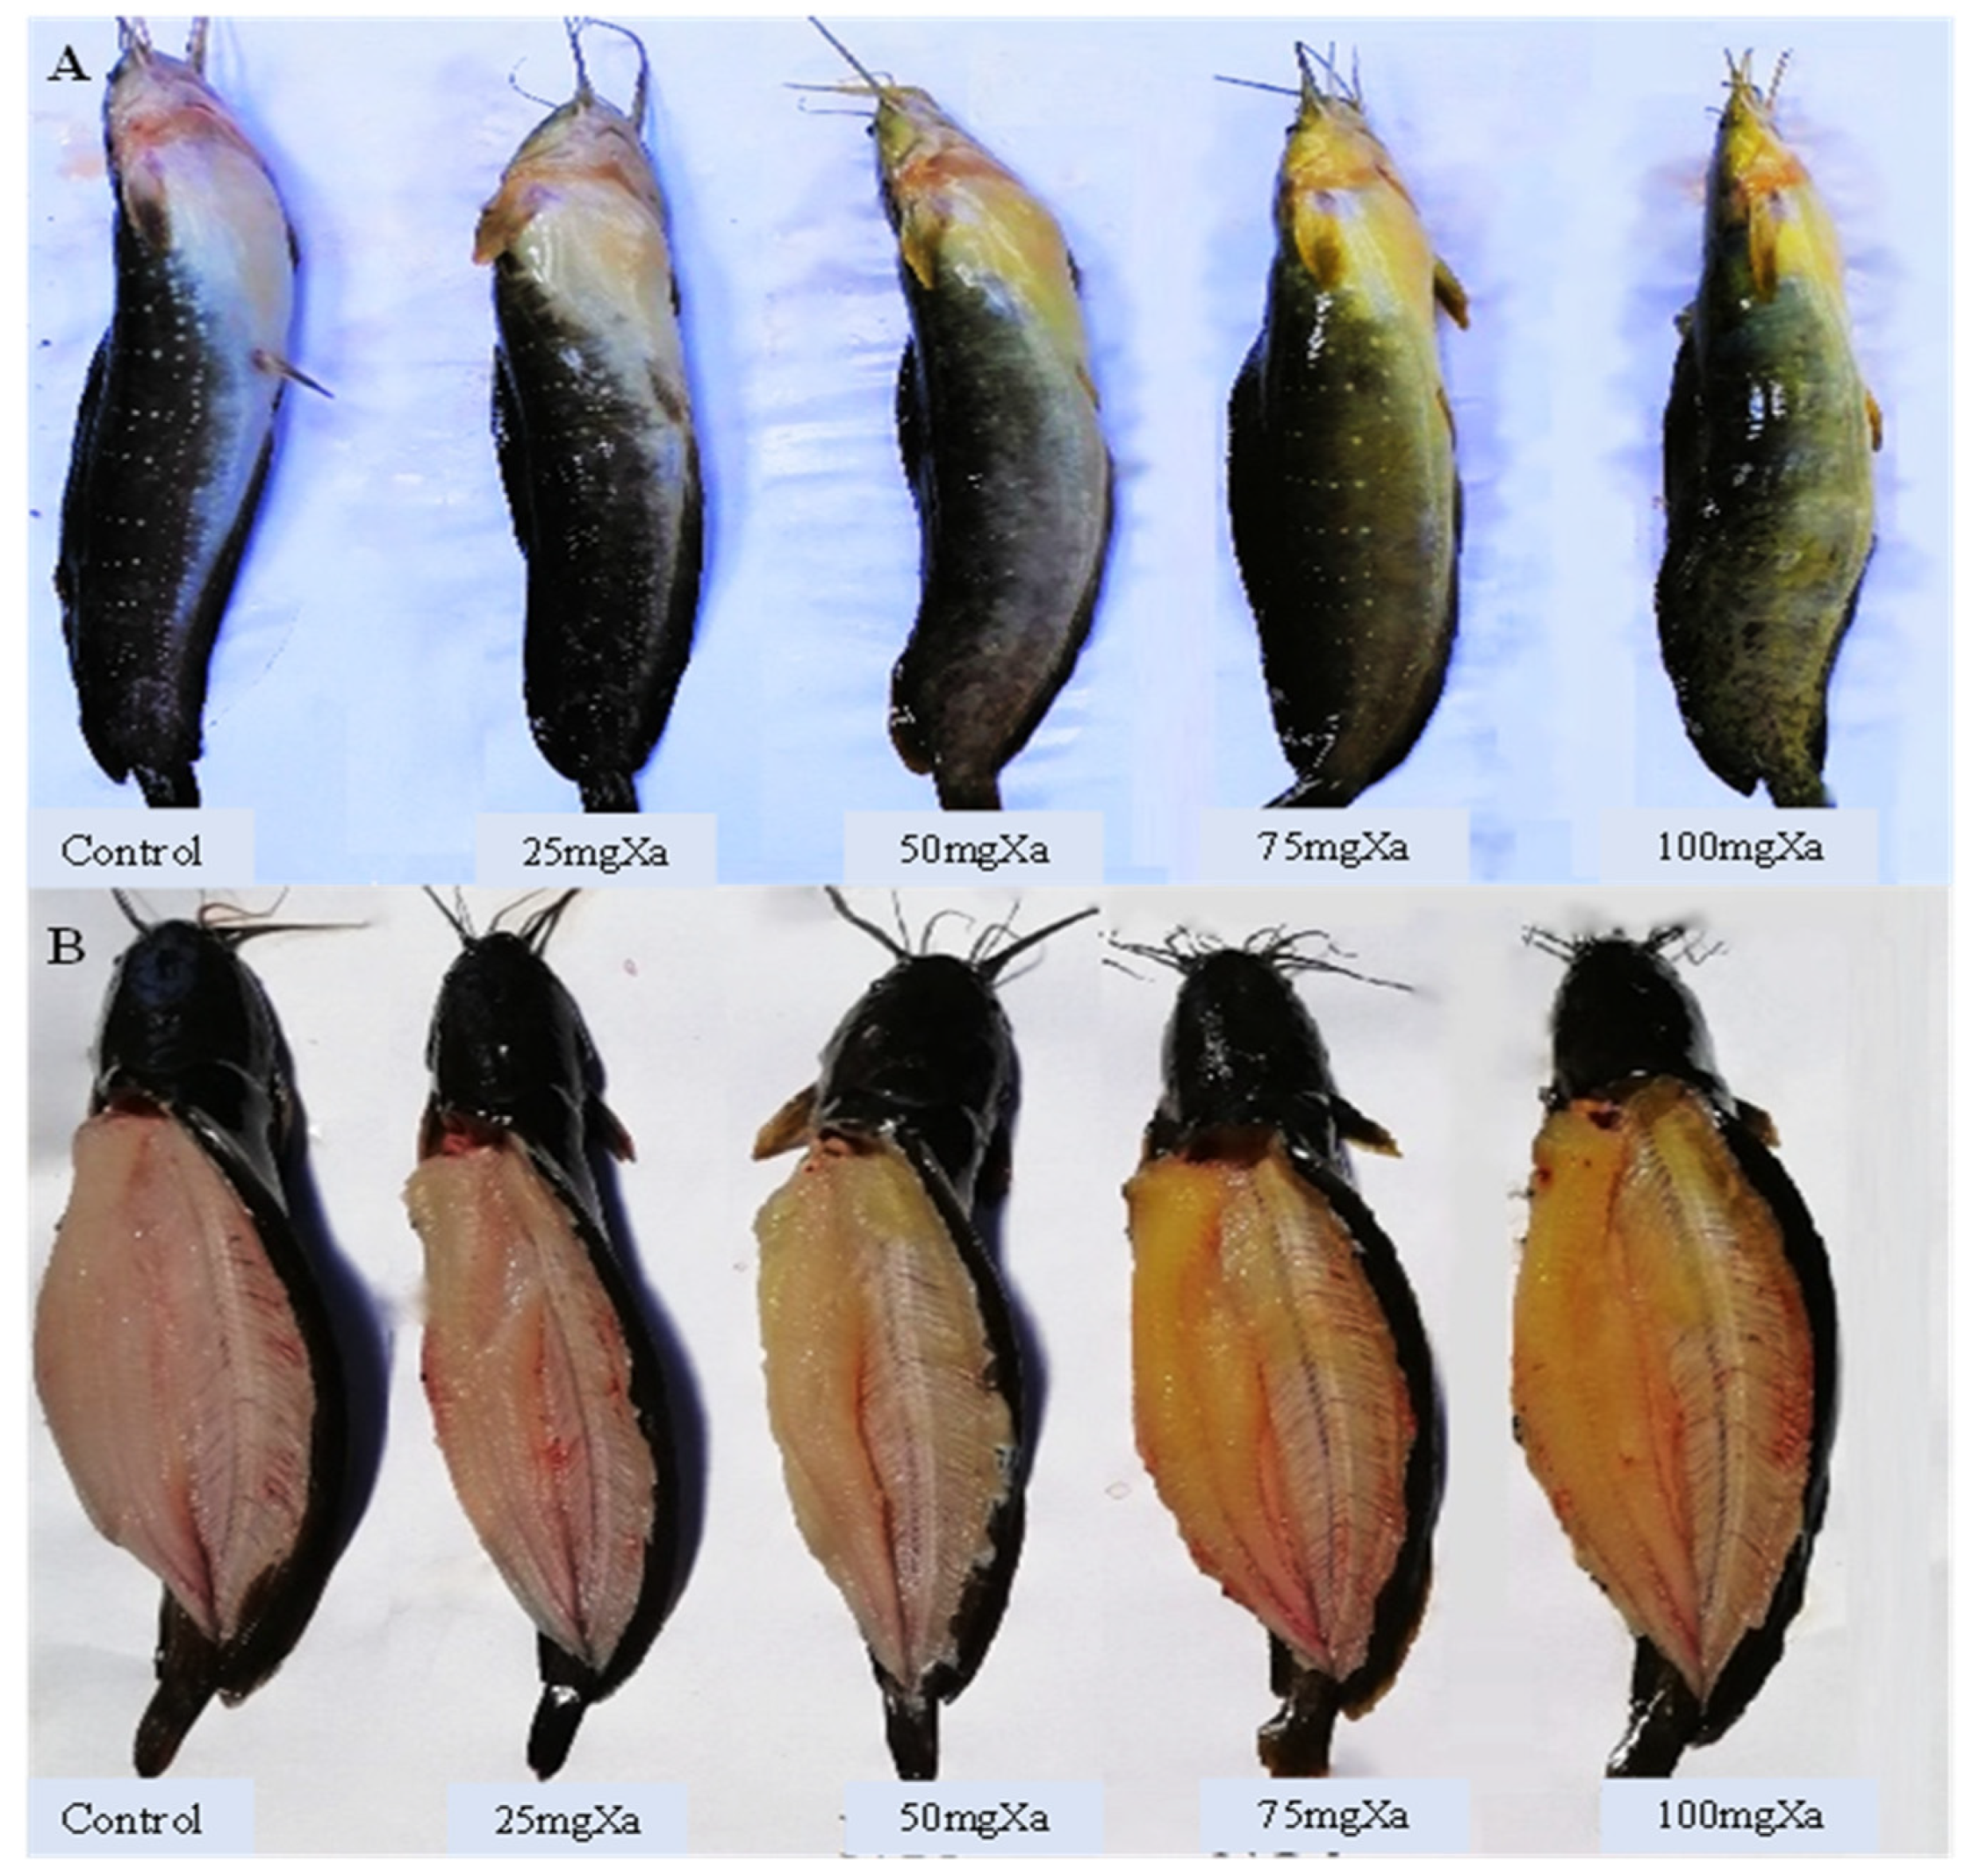
Digital image of body skin (A) and muscle (B) of bighead catfish fed Xa diets for 4 weeks.
Figure 8.
Digital image of body skin (A) and muscle (B) of bighead catfish fed Xa diets for 4 weeks.
Table 1.
Chemical composition of basal diet (dry matter basis).
Table 1.
Chemical composition of basal diet (dry matter basis).
| Ingredient | Amount (%) |
|---|
| Fish meal 1 | 25.0 |
| Defatted soybean meal 2 | 35.0 |
| Blood meal 3 | 7.00 |
| Rice bran 4 | 15.0 |
| Cassava meal 5 | 14.5 |
| Fish oil 6 | 1.00 |
| Premix mineral and vitamin 7 | 1.00 |
| Shrimp soluble extract 8 | 1.00 |
| Guar gum 9 | 0.5 |
| Total | 100 |
| Proximate analysis (% as dry matter basis) | |
| Crude Protein | 43.8 |
| Crude Lipid | 6.82 |
| Ash | 11.9 |
| Carbohydrate | 37.5 |
| Gross energy (KJ/g) | 19.5 |
Table 2.
Growth performance, initial weight (Wi, g/fish), final weight (Wf, g/fish), specific growth rate (SGR, %/day), and survival rate (SR, %) of fish fed dietary pigments for 6 weeks.
Table 2.
Growth performance, initial weight (Wi, g/fish), final weight (Wf, g/fish), specific growth rate (SGR, %/day), and survival rate (SR, %) of fish fed dietary pigments for 6 weeks.
| Treat. | Wi | Wf | SGR | SR (%) |
|---|
| Control | 46.3 ± 0.55 | 57.6 ± 1.22 ab | 0.36 ± 0.43 | 80.8 ± 13.4 |
| As | 45.9 ± 1.06 | 56.8 ± 1.40 b | 0.35 ± 0.01 | 87.9 ± 3.69 |
| Ca | 46.6 ± 0.46 | 59.2 ± 1.43 a | 0.39 ± 0.05 | 85.4 ± 4.38 |
| Xa | 45.8 ± 1.63 | 59.5 ± 2.04 a | 0.43 ± 0.05 | 86.7 ± 3.59 |
| As + Ca | 46.0 ± 1.79 | 58.3 ± 1.08 ab | 0.39 ± 0.09 | 87.1 ± 2.84 |
| As + Xa | 46.2 ± 1.07 | 58.3 ± 0.86 ab | 0.38 ± 0.04 | 89.2 ± 7.00 |
| Ca + Xa | 45.9 ± 1.08 | 58.8 ± 1.77 ab | 0.41 ± 0.02 | 87.9 ± 4.16 |
Table 3.
L*, a*, b* for body skin, abdominal, and muscle of bighead catfish during the trial.
Table 3.
L*, a*, b* for body skin, abdominal, and muscle of bighead catfish during the trial.
| Time (Week) | Treat. | Body Skin | Abdominal Skin | Muscle |
|---|
| L* | a* | b* | L* | a* | b* | L* | a* | b* |
|---|
| 2 | Control | 10.8 ± 1.62 a | 1.89 ± 0.68 a | 2.45 ± 1.07 a | 45.4 ± 0.38 ab | 17.9 ± 0.72 b | 15.6 ± 0.65 a | 40.1 ± 1.57 cd | 1.44 ± 0.33 a | 8.39 ± 0.84 a |
| As | 13.6 ± 1.36 b | 8.16 ± 1.45 c | 6.18 ± 1.32 bc | 50.8 ± 0.99 bc | 21.6 ± 0.87 e | 16.4 ± 1.06 ab | 41.5 ± 1.11 de | 1.57 ± 0.48 a | 15.1 ± 0.50 b |
| Ca | 18.6 ± 0.86 d | 10.7 ± 0.57 de | 4.99 ± 0.62 b | 59.0 ± 0.19 de | 20.3 ± 1.04 cd e | 17.3 ± 1.10 ab | 37.6 ± 1.82 b | 1.40 ± 0.27 a | 16.3 ± 0.93 ab |
| Xa | 13.5 ± 1.06 b | 4.26 ± 1.18 b | 9.52 ± 0.94 e | 40.9 ± 0.89 a | 21.2 ± 1.02 de | 18.3 ± 0.51 ab | 37.9 ± 1.49 bc | 1.46 ± 0.34 a | 16.9 ± 0.53 b |
| As + Ca | 20.2 ± 0.54 d | 12.3 ± 0.87 e | 6.78 ± 0.87 cd | 54.5 ± 0.53 cd | 19.7 ± 0.51 bcd | 15.83 ± 0.41 a | 43.2 ± 0.55 e | 1.69 ± 0.30 a | 16.2 ± 0.55 ab |
| As + Xa | 16.3 ± 1.35 c | 9.13 ± 0.82 cd | 8.24 ± 1.09 de | 59.8 ± 0.43 de | 18.7 ± 0.67 bc | 16.9 ± 0.62 ab | 33.9 ± 0.82 a | 1.60 ± 0.19 a | 15.8 ± 0.39 ab |
| Ca + Xa | 16.1 ± 1.18 c | 9.47 ± 0.44 cd | 7.03 ± 0.27c d | 62.9 ± 8.04 e | 16.2 ± 1.49 a | 16.4 ± 1.99 ab | 43.7 ± 1.13 e | 1.63 ± 0.47 a | 15.7 ± 0.73 b |
| Mean ± SD | 15.6 ± 1.18 A | 8.0 ± 0.44 A | 6.50 ± 0.27 A | 53.3 ± 8.04 A | 19.4 ± 1.49 A | 16.7 ± 1.99 A | 39.7 ± 1.13 | 1.5 ± 0.47 A | 14.9 ± 0.73 A |
| 4 | Control | 10.9 ± 1.71 a | 2.12 ± 0.86 a | 2.70 ± 0.67 a | 46.1 ± 1.83 a | 16.1 ± 0.90 a | 15.6 ± 1.19 ab | 39.9 ± 1.52 ab | 1.62 ± 0.76 ab | 10.4 ± 1.03 a |
| As | 25.9 ± 1.04 c | 16.2 ± 1.13 d | 6.63 ± 1.19 c | 51.3 ± 1.29 b | 30.1 ± 0.83 d | 14.6 ± 0.81 a | 40.3 ± 1.18 ab | 1.69 ± 0.45 ab c | 17.2 ± 1.49 c |
| Ca | 23.8 ± 1.01 bc | 9.27 ± 1.10 c | 5.10 ± 0.90 b | 54.7 ± 1.62 c | 25.7 ± 1.03 c | 17.3 ± 1.36 c | 41.8 ± 1.65 b | 1.79 ± 0.47 bc | 18.5 ± 1.18 c |
| Xa | 22.2 ± 1.37 b | 5.15 ± 0.86 b | 10.8 ± 0.87 e | 52.6 ± 1.38 b | 22.3 ± 1.65 b | 20.4 ± 0.89d | 40.2 ± 1.07 ab | 1.42 ± 0.31 ab | 24.2 ± 1.38 e |
| As + Ca | 25.3 ± 1.46 c | 9.99 ± 0.88 c | 6.74 ± 1.02 c | 55.2 ± 1.48 c | 32.0 ± 1.53 e | 15.7 ± 3.29 abc | 41.2 ± 1.81 b | 1.56 ± 0.67 ab | 14.7 ± 1.52 b |
| As + Xa | 24.4 ± 4.87 c | 10.2 ± 5.33 c | 8.31 ± 1.51 d | 54.2 ± 1.70 c | 29.9 ± 1.59 d | 19.7 ± 0.57 d | 39.0 ± 1.59 a | 2.21 ± 0.59 c | 18.5 ± 1.06 d |
| Ca + Xa | 25.5 ± 5.38 c | 7.88 ± 1.44 c | 7.83 ± 1.53 d | 54.7 ± 1.71 c | 24.9 ± 1.36 c | 17.2 ± 1.79 bc | 41.9 ± 3.89 b | 1.20 ± 0.45 a | 18.9 ± 1.36 d |
| Mean ± SD | 22.6 ± 0.56 B | 8.70 ± 1.52 A | 6.90 ± 1.00 A | 52.7 ± 1.69 A | 25.9 ± 0.59 B | 17.2 ± 0.97 A | 40.6 ± 3.5 | 1.6 ± 0.04 A | 17.5 ± 0.55 B |
| 6 | Control | 10.2 ± 1.12 a | 1.27 ± 0.33 a | 2.68 ± 0.69 a | 49.6 ± 1.23 a | 15.2 ± 0.85 a | 15.9 ± 1.29 ab | 41.1 ± 1.12 b | 1.53 ± 0.59 ab | 10.5 ± 0.82 a |
| As | 21.4 ± 0.92 c | 16.3 ± 0.85 e | 6.11 ± 1.03 c | 53.2 ± 1.89 de | 29.7 ± 0.99 d | 16.6 ± 0.84 b | 39.5 ± 1.59 ab | 1.72 ± 0.86 b | 17.9 ± 1.77 c |
| Ca | 25.4 ± 1.31 e | 9.54 ± 0.87 d | 4.86 ± 0.79 b | 52.9 ± 1.33 cd | 25.4 ± 1.51 c | 17.8 ± 1.42 b | 40.6 ± 1.27 b | 1.74 ± 0.60 b | 18.8 ± 1.40 c |
| Xa | 18.6 ± 1.73 b | 4.43 ± 1.04 b | 10.10 ± 1.21 e | 51.5 ± 1.60 bc | 23.1 ± 0.99 b | 20.9 ± 1.78 c | 38.8 ± 1.46 a | 1.23 ± 0.77 ab | 23.1 ± 1.03 d |
| As + Ca | 20.5 ± 1.38 c | 9.75 ± 0.77 d | 6.74 ± 1.02 c | 54.7 ± 1.38 e | 30.7 ± 1.75 d | 13.6 ± 1.58 a | 40.8 ± 1.54 b | 1.74 ± 0.63 b | 15.4 ± 1.74 b |
| As + Xa | 21.6 ± 1.22 cd | 9.19 ± 1.14 cd | 8.76 ± 1.09 d | 51.1 ± 1.51 b | 29.3 ± 1.72 d | 20.6 ± 0.92 c | 39.9 ± 1.97 ab | 0.91 ± 0.87 a | 18.8 ± 1.76 c |
| Ca + Xa | 22.7 ± 1.46 d | 8.51 ± 0.41 c | 8.37 ± 1.29 d | 54.7 ± 1.87 e | 26.4 ± 1.82 c | 16.1 ± 6.61 ab | 41.0 ± 1.39 b | 1.00 ± 0.85 ab | 17.3 ± 1.97 c |
| Mean ± SD | 20.1 ± 1.91 B | 8.40 ± 0.32 A | 6.80 ± 1.29 A | 52.5 ± 2.08 A | 25.7 ± 0.83 B | 17.4 ± 3.44 A | 40.2 ± 1.93 | 1.40 ± 0.66 A | 17.4 ± 0.47 B |
Table 4.
Sensory evaluation and accumulated carotenoids in the muscle of fish fed various pigments diets after 6 weeks.
Table 4.
Sensory evaluation and accumulated carotenoids in the muscle of fish fed various pigments diets after 6 weeks.
| Treatment | Sensory Evaluation | Accumulated Carotenoid (mg/100 g) |
|---|
| Body Skin | Muscle |
|---|
| Control | 6.00 ± 0.00 e | 6.00 ± 0.00 e | 1.47 ± 0.27 h |
| As | 7.13 ± 0.42 d | 7.33 ± 0.59 d | 4.75 ± 0.13 e |
| Ca | 7.11 ± 0.32 d | 7.16 ± 0.35 d | 5.98 ± 0.23 d |
| Xa | 8.94 ± 0.24 a | 8.89 ± 0.14 a | 16.89 ± 0.60 a |
| As + Ca | 7.28 ± 0.46 d | 7.22 ± 0.43 d | 8.70 ± 0.48 c |
| As + Xa | 8.39 ± 0.61 b | 8.39 ± 0.61 b | 12.67 ± 0.11 b |
| Ca + Xa | 7.72 ± 0.67 c | 7.78 ± 0.73 c | 3.91 ± 0.41 f |
Table 5.
Growth performance, initial weight (Wi), final weight (Wf), specific growth rate (SGR), survival rate (SR), feed conversion ratio (FCR) of bighead catfish fed various xanthophyll diets for 4 weeks.
Table 5.
Growth performance, initial weight (Wi), final weight (Wf), specific growth rate (SGR), survival rate (SR), feed conversion ratio (FCR) of bighead catfish fed various xanthophyll diets for 4 weeks.
| Treatment | Wi (g/fish) | Wf (g/con) | SGR (%/day) | SR (%) | FCR |
|---|
| Control | 39.5 ± 0.44 | 49.9 ± 1.76 | 0.46 ± 0.08 | 92.2 ± 1.92 | 1.38 ± 0.22 |
| 25 mgXa | 39.1 ± 0.63 | 51.8 ± 1.96 | 0.40 ± 0.12 | 93.3 ± 5.77 | 1.38 ± 0.18 |
| 50 mgXa | 39.3 ± 1.21 | 50.3 ± 1.43 | 0.43 ± 0.05 | 94.4 ± 1.93 | 1.34 ± 0.36 |
| 75 mgXa | 39.6 ± 0.65 | 50.8 ± 1.36 | 0.48 ± 0.09 | 92.2 ± 1.92 | 1.05 ± 0.45 |
| 100 mgXa | 39.0 ± 0.45 | 50.8 ± 1.81 | 0.49 ± 0.16 | 92.2 ± 3.85 | 1.11 ± 0.75 |
Table 6.
L*, a*, b* for body skin, abdominal skin, and muscle of bighead catfish fed dietary Xa for 4 weeks.
Table 6.
L*, a*, b* for body skin, abdominal skin, and muscle of bighead catfish fed dietary Xa for 4 weeks.
| Treatment | Body Skin | Abdominal Skin | Muscle |
|---|
| L* | a* | b* | L* | a* | b* | L* | a* | b* |
|---|
| Control | 50.0 ± 1.56 d | −0.1 ± 0.52 a | 2.0 ± 0.58 d | 73.1 ± 1.21 a | −1.6 ± 0.37 a | 4.4 ± 1.60 d | 41.4 ± 1.29 a | 1.3 ± 0.36 a | 12.9 ± 1.03 d |
| 25 mgXa | 52.8 ± 1.67 bc | −0.6 ± 0.18 a | 5.3 ± 1.05 c | 70.8 ± 1.55 b | −3.0 ± 0.62 b | 11.4 ± 1.02 c | 42.3 ± 1.61 a | 1.2 ± 1.10 a | 17.1 ± 1.42 c |
| 50 mgXa | 51.3 ± 1.34 cd | −1.9 ± 0.76 b | 8.0 ± 0.85 b | 72.6 ± 1.57 a | −3.2 ± 0.73 b | 12.9 ± 1.90 b | 41.7 ± 1.45 a | 1.1 ± 0.48 a | 19.7 ± 1.68 b |
| 75 mgXa | 55.2 ± 1.51 a | −3.0 ± 0.79 c | 10.6 ± 0.93 a | 70.7 ± 1.75 b | −3.7 ± 0.62 b | 22.7 ± 1.56 a | 42.7 ± 1.70 a | 1.3 ± 0.69 a | 20.9 ± 0.64 b |
| 100 mgXa | 53.4 ± 1.95 b | −3.2 ± 1.01 c | 11.3 ± 1.89 a | 69.9 ± 0.58 b | −3.4 ± 1.95 b | 21.4 ± 1.64 a | 41.3 ± 1.44 a | 1.1 ± 0.34 a | 23.1 ± 1.70 a |
Table 7.
Sensory evaluation and accumulated carotenoid in muscle of fish fed of bighead catfish fed Xa diets for 4 weeks.
Table 7.
Sensory evaluation and accumulated carotenoid in muscle of fish fed of bighead catfish fed Xa diets for 4 weeks.
| Treatment | Sensory Evaluation | Accumulated Carotenoid (mg/100 g) |
|---|
| Body Skin | Muscle |
|---|
| Control | 6.52 ± 0.51 d | 6.00 ± 0.00 e | 1.30 ± 0.29 d |
| 25 mg Xa | 6.48 ± 0.51 d | 6.52 ± 0.51 d | 2.68 ± 0.42 c |
| 50 mg Xa | 6.96 ± 0.76 c | 7.11 ± 0.64 c | 6.82 ± 0.47 b |
| 75 mg Xa | 8.52 ± 0.51 a | 8.56 ± 0.51 a | 16.93 ± 0.69 a |
| 100 mg Xa | 8.00 ± 0.55 b | 8.04 ± 0.65 b | 16.63 ± 0.51 a |
