Article

Otolith Microchemistry and Demographic History Provide New Insight into the Migratory Behavior and Heterogeneous Genetic Divergence of Coilia grayii in the Pearl River

1
Guangdong Province Key Laboratory for Aquatic Economic Animals, State Key Laboratory of Biocontrol, School of Life Sciences, Sun Yat-sen University, Guangzhou 510006, China
2
State Key Laboratory of Ophthalmology, Zhongshan Ophthalmic Center, Sun Yat-sen University, Guangzhou 510060, China
3
Guangdong Provincial Engineering Technology Research Center for Healthy Breeding of Important Economic Fish, Guangzhou 510006, China
4
Southern Marine Science and Engineering Guangdong Laboratory, Zhuhai 519000, China
*
Author to whom correspondence should be addressed.
These authors contributed equally to this work.
Fishes 2022, 7(1), 23; https://doi.org/10.3390/fishes7010023
Submission received: 1 November 2021 / Revised: 24 December 2021 / Accepted: 12 January 2022 / Published: 17 January 2022
(This article belongs to the Section Biology and Ecology)

Abstract

:
Coilia grayii is the anadromous form of anchovy that is distributed in the East and South China Seas. It is a common fish species in the estuarine area of the Pearl River. Nevertheless, freshwater populations appear upstream in the Pearl River, but the migratory pathway has been mostly impeded by dam construction. Behavioral differences and constrained habitat within tributaries are suspected of promoting genetic divergence in these populations. In this study, we investigated the migratory behavior and genetic divergence of six populations of C. grayii fragmented by dams based on the otolith strontium/calcium (Sr/Ca) ratio, mitochondrial DNA, and microsatellite genotyping. All populations were in freshwater with low Sr/Ca ratios, except the estuarine population (Humen population) hatched in brackish water. Reduced nucleotide diversity corresponding to distance was observed. Populations from distant hydrological regions exhibited a decline in genetic diversity and a significant difference with the remaining populations after fitting the isolation by distance model. Pairwise fixation indices confirmed these results and moderate and significant differentiation was found between Hengxian site and downstream sites. Furthermore, STRUCTURE analyses revealed that all separated populations exhibited an admixed phylogenetic pattern except for individuals from the Hengxian locality. The upstream sites showed significantly increased resistance to gene flow from the estuarine population because of isolation by the dam. The results of the neutrality test and Bayesian skyline plots demonstrated complex demography—individuals’ experienced historical expansion and partial upper-dam populations had recently undergone a colonization, forming a new genetic structure. Accordingly, this study demonstrates differences in the migration pattern and genetic differentiation of C. grayii as a consequence of demographic history and current processes (habitat fragmentation and colonization).

1. Introduction

Improved understanding of anadromous fish population dynamics requires identifying the ecologically different populations, the genetic structure, and a better knowledge of the life histories of individuals in coastal habitats [1,2]. It is difficult to predict the migratory patterns and population diversity of anadromous and estuarine fishes that are not well-resolved, because of variability in movement and great adaptability to the heterogeneous environments [3]. Several organisms even take residence in opposite environments within diverse life histories, potentially derive into subpopulations [4,5], and display population structures that are dependent on the physical limitations of the habitat and their dispersal capability [6], including many anadromous species of salmon [5,7], some species of sturgeon [8,9], Hilsa shad Tenualosa ilisha [10,11]. These has important ramifications for population connectivity, population persistence, and the potential management of fish stocks.
Long-distance dispersal and clear barriers to gene flow affect population connectivity and induce genetic divergence [12,13]. Furthermore, the colonization and isolation of ancestral species can lead to locally adapted lineages associated with environmental heterogeneity [14,15,16]. Thus, strong migratory connectivity of anadromous fish provides an excellent opportunity to study the interaction between long-distance dispersal and geographic barrier. Identifying behavioral polymorphisms and exploring their cause promotes an understanding of how creatures adapt to the brackish water habitat and provides valuable insights for discerning the evolutionary forces on genetic divergence.
Coilia grayii (Clupeiformes: Engraulidae) is a common anchovy that travels long distances in the estuarine area of the Pearl River and is distributed along the coasts from the East China Sea to the South China Sea as a forage fish [17,18]. During the spawning season (March–June), schools of anchovy stocks migrate between their spawning, feeding, and nursery grounds, while traveling in fresh or brackish water [19,20]. Surprisingly, some freshwater anchovies are found in the upper reaches of the Pearl River, which are hundreds of kilometers away from shore. Coilia nasus, a sister taxon of C. grayii, has various migratory behaviors, including freshwater residence, estuarine originating, anadromous, and non-anadromous [21,22]. A recent study revealed the migratory behavior of C. grayii in the Pearl River estuary based on the otolith strontium/calcium (Sr/Ca) ratio using an electron probe microanalysis (EPMA) and indicated that the fish hatches in freshwater [18]. However, it is unclear whether this dispersal behavior has a genetic basis.
Discerning the migratory behavior and genetic structure of C. grayii in the Pearl River is key to identifying phenotypic and genetic polymorphisms and determining the differentiation of the population. We suspect that C. grayii is subject to different evolutionary forces across space within its wide distribution range. For instance, dispersal and isolation have potential consequences for gene flow and exhibit a central role in life-history evolution. The genetic structure of a species with a wide habitat range may exhibit a pattern of isolation by distance (IBD) and reduced gene flow due to restricted movement within rivers. Compared to the estuarine population, geographically distant populations in freshwater have different life histories, and the process of increasing genetic differentiation is commonly assumed to be correlated with increasing geographic distance. If dispersal has a genetic basis, evolutionary forces on the dispersal process may produce predictable differences in dispersal phenotypes among different populations. Additionally, anthropogenic barriers, such as dams, impede upstream migration and produce the founder effect, if some individuals can pass through them, which may lead to another life-history style [23,24,25]. Several hydroelectric dams have been built in the tributaries of the Pearl River during the few last decades, which impede the migratory pathway of long-distance diadromous fish, reduce gene flow, and increase genetic drift [26,27,28]. Fortunately, over the last decade, rapid technological development in the field of genetics has allowed the study of dispersal pathways and population connectivity of long-distance migrants [29]. Diverse genetic markers, such as mitochondrial and microsatellite genotypes, are some of the most robust approaches to disentangling population dispersal patterns [30,31]. For example, the high mutation rate of the mitochondrial D-loop region allows more rapid accumulation of genetic differentiation between local populations and microsatellites serve as a good complement to mitochondrial markers as they have biparental inheritance, thus their combination resulting in better resolution when attempting to differentiate populations [32,33]. In addition, the high degree of resolution better identifies close relatives from different areas that could presumably reflect dispersal processes with potential dispersal events among populations and population structure within a species [34,35].
C. grayii is suspected to be subject to different evolutionary forces across space, in addition to exhibiting diverse migratory behaviors and life histories that interact to accelerate differentiation. We hypothesized that connectivity was lower within upstream populations of C. grayii than within downstream populations with concomitantly higher levels of genetic differentiation. In this study, we used the otolith Sr/Ca ratio to determine the migratory behaviors of C. grayii in the tributaries and estuary of the Pearl River. A comprehensive multi-locus dataset (cytochrome b gene and the D-loop region of mtDNA, microsatellites fragment length) was utilized to investigate the genetic diversity and population structure. Specifically, we tested whether C. grayii displays strong genetic divergence across a large geographical distance. Finally, we distinguished the genetic structure of the individuals captured from the six sites in three watersheds and determined whether it coincided with the geographic distribution pattern, and inferred the drivers and demographic history.

2. Materials and Methods

2.1. Sample Collection

A total of 180 specimens were collected from fish docks or local markets in 6 sites of the Pearl River from November 2015 to May 2016, including Qingyuan (QY) and Lixi (LX) in the Bei River tributary; Boluo (BL) and Huizhou (HZ) in the Dong River tributary; Hengxian (HX) in the Yu River tributary and Humen (HM) near the estuary (Figure 1). They are separated by dam construction at different times (Table 1). We defined Humen (HM) as an estuarine population; populations that are downstream from a dam are downstream populations (BL, QY), the other are upstream populations (HX, LX, HZ). Sagittal otoliths were collected and initially cleaned with 75% ethanol. Standard length and body weight were also measured for each individual. Dorsal muscles were sampled and transferred to the laboratory in liquid nitrogen and then stored at −80 °C for further experiment.

2.2. Otolith Preparation and Microprobe Analysis

Only left sagittal otoliths of 16 specimens (every 3 individuals from the BL, the LX, the QY, the HM; every 2 individuals from the HX and the QY) were selected for otolith analysis whose body length ranges from 172 to 240 mm. The otoliths were cleaned and air-dried and embedded in epoxy resin (Epofix, Struers). The otoliths were then grounded to expose the core in the sagittal plane using a grinding machine equipped with a diamond cup wheel and polished further with 6 and 1 mm diamond paste on an automated polishing wheel. Finally, the otoliths were cleaned in an ultrasonic bath using distilled water, dried at room temperature, and coated with carbon for EPMA (electron probe microanalysis) measurement.
X-ray intensity maps of strontium (Sr) in the sagittal plane of the otoliths of 16 individuals were performed for “life history transect” analyses of Sr and Ca concentrations along the longest axis from the otolith core to the edge using EPMA (JEOL JXA-8230) as described in Dou and Yokkaichi (2012) and Jiang [22]. Calcite (CaCO3) and strontianite (SrCO3) were used as standards. The accelerating voltage and beam current for X-ray intensity maps were 15 kV and 5.0 × 10⁻⁷ A, respectively, and the electron beam was focused on a point 10 μm, pixel size was 7 × 7 μm and counting time was 50 ms. The beam current changed to 2.0 × 10⁻⁸ A to measure the concentrations of Sr and Ca. The electron beam was focused on point 5 μm with measurements spaced at 15 μm and the counting time for each point was 15 s. Statistical analysis was performed in R. Sr/Ca concentration ratios were traditionally determined and represented as Sr/Ca × 1000. The Sr/Ca ratios and X-ray intensity maps of Sr content were used to define the habitat phases in the otolith by comparing them to known patterns of various salinity exposure phases in C. grayii and C. nasus [22,36,37], where a Sr/Ca ratio of ≤3 is considered to be indicative of a freshwater phase and is colored blue; a ratio of 3–5 is considered indicative of a brackish water phase and is colored green-yellow, and a ratio > 5 is considered indicative of a fully seawater phase and is colored red. The color map patterns of otolith Sr were employed to provide more objective and intuitive insights regarding fish migratory patterns and environmental salinity history.

2.3. DNA Extraction, Library Construction, and Sequencing

The genomic DNA of 162 samples was extracted from dorsal muscles using a DNA kit (Tiangen) according to the protocol. The DNA quality was verified by electrophoresis in 1% agarose gel. Mitochondrial DNA was amplified via polymerase chain reaction (PCR) using primers D-loop forward primer (5-CTAACTCCCAAAGCTAGAATTCT-3) and D-loop reverse primer (5-ATCTTAGCATCTTCAGTG-3) for D-loop, cyt b forward primer (5-GACTTGAAAAACCACCGTTG-3), cyt b reverse primer (5-CTCCGATCTCCGGATTACAAGAC-3) [38] for cyt b.
Amplification reactions of the mtDNA were set up in a total of 25 μL volumes, and amplification reaction mixtures consisted of 100 ng DNA template, 12.5 μL 2× Easy Taq® PCR SuperMix (Transgene, Beijing, China), 1 μL of 2.5 µM primers each, with sterilized water added to make up the final volume to 25μL. The optimal conditions were: 95 °C for 5 min, 35 cycles of 95 °C for 50 s, 55 °C for 40 s, and 5 min at 72 °C. The amplification products were analyzed by 1.0% agarose gel electrophoresis. All positive PCR products were sent to the Beijing Genomics Institute (BGI) for sequencing. At last, we got 155 sequences for D-loop and 132 sequences for cytochrome b (cyt b).
34 microsatellite primer pairs previously isolated from Coilia nasus [39] (Fang et al., 2012), of these, only 5 primer pairs amplified fragments of the expected size, which were genotyped for 174 individuals following the protocol of YangQ et al. [21] (2010) (Table S1). Amplification reactions of the microsatellites were also set up in a total of 25 μL volumes, consisting of 12.5 µL 12.5 μL 2× Easy Taq® PCR SuperMix (Transgene, Beijing, China), 1 µL of 5 µM the Tail A (FAM), 0.8 µL of 5 µM the forward primer, 2.5 µL of 5 µM the reverse primer, 25 ng of total DNA and a variable amount of RNase-free water to reach the final volume. All reactions were run in a TGradient thermocycler as follows: 95 for 15 min, 35 cycles of 94 for 30 s, 55 for 90 s, and 72 for 60 s, and the final extension at 72 for 10 min. PCR products were analyzed on 6% denaturing polyacrylamide gels using a Sequi-Gen® GT sequencing apparatus (Bio-Rad, Hercules, CA, USA) with 97 Sharktooth lanes (Bio-Rad), then visualized by silver staining, carried by BGI. The results were diagnosed and evaluated using the GeneMarker v2.2.0 software.

2.4. Data Analysis

The mtDNA sequences were aligned and checked visually in the software Seqman II (DNASTAR) and MEGA 6.0 [40], then refined with Gblock v0.91b [41,42] using default gap penalties. Modeltest v2.3 [43] (Nylander 2004) was used to identify the appropriate model of sequence evolution. Mitochondrial DNA diversity was evaluated using haplotype diversity (Hd) and nucleotide diversity (π) for each population using DnaSP v5.0 [44]. A median-joining network of mtDNA control region and cyt b [45] was estimated in PopART (http://popart.otago.ac.nz, accessed on 12 November 2018). Using the program NETWORK v4.6.1.0 (copyright 2004–2012, Fluxus Technologies Ltd., Colchester, UK; http://www.fluxus-engineering.com, accessed on 12 November 2018), median-joining haplotype networks were drawn to visually illustrate haplotype variability. Evolutionary relationships among haplotypes were reconstructed by Bayesian inference in MrBayes 3.2 [46] with the substitution model selected by the Modeltest 2.3 and mtDNA sequence of C. nasus (NCBI NO. AP009135) as a close relative outgroup. We implemented MrBayes with two independent parallel runs, four incrementally heated Metropolis-coupled Markov chain Monte Carlo (MCMC) in each run, ran for more than 5 million generations with burn-in 1 million until the average standard deviation of split frequency was below 0.01.
Pairwise genetic distances between populations or individuals were estimated using fixation indices (FST, ΦST). The significance of the fixation index was tested by 1000 permutations in Arlequin v3.5. A hierarchical analysis of molecular variance (AMOVA) was used to estimate the differentiation at the population level and the individual level. In addition, we also tested for isolation by distance (IBD) by implementing the Mantel Test [47], testing the correlation between the geographic distance and genetic distance (the FST distance matrix based on the 5 microsatellite loci and ΦST distance matrix based on D-loop sequences). The genetic distance was measured using FST/(1 − FST) or ΦST /(1 − ΦST), while the geographical distance was estimated from corresponding coordinate distances of all sites along the surface of the earth. All the analyses were performed in the R packages “SoDA” and “vegan”.
To investigate past demographic expansion, two neutrality tests, Tajima’s D [48] and Fu’s Fs [49], as well as mismatch distributions [50] were implemented in DnaSP version 5.1 [44]. The Bayesian skyline plot was used to infer the historical population dynamics of Coilia grayii based on the sampled sequences of the control region. It was computed in BEAST v 2.5.1 [51] with a chain length of 100 million generations and a sampling interval of 10,000. The chain convergence and the skyline plot graphic were visualized in the software Tracer v1.5 [52], keeping the effective sample size (ESS) higher than 200. We performed the EBSP—Extended Bayesian Skyline Plot method [53].
Based on microsatellite genotypes, we used Popgene v1.32 and GENALEX v6.5 to assess deviation from Hardy–Weinberg equilibrium (HWE), including polymorphism information content (PIC), observed heterozygosity (Ho), expected heterozygosity (He), the heterozygote deficit within populations (FIS) for each population, and AMOVA. Pair FST was calculated by Arlequin v3.5, and Nm is inferred from FST (Nm = 0.25(1 − FST)/FST). STRUCTURE v2.3.4 [54] was also used to test population structures based on microsatellites. The iterations of the burn-in period and the number of Monte Carlo Markov chain (MCMC) runs were fixed at 200,000 and 1,000,000 under the admixture model and the assumption of correlated allele frequencies among populations. We conducted five replicated runs for each cluster value of K from 1 to 6. The results from STRUCTURE were uploaded on the website of STRUCTURE HARVESTER based on the ΔK method [55]. After defining K’s value, we used CLUMPP v1.1.2 [56] (Jakobsson and Rosenberg 2007) to merge results, and created bar plotting results with DISTRUCT v1.1 [57] (Rosenberg 2004).
BOTTLENECK 1.2 software [58] (Piry et al., 1999) was used to assess possible deviations in mutation-drift equilibrium in C. grayii. To analyze the data set of microsatellite genotypes, we used the sign test and Wilcoxon signed-rank test with the infinite allele (IAM), the stepwise mutation (SMM), and two-phase mutation (TPM) models (90% stepwise and 10% multistep mutations 1000 iterations).

3. Results

3.1. Microchemistry Analysis

Otolith concentrations of Sr and Ca provide information on habitat and migration patterns over the lifetime of individual fish. The microchemistry analysis of C. grayii revealed two distinct life history types in the overall population: otoliths from all populations, except HM, had bluish areas (low Sr) from the otolith core to the outermost regions on the X-ray intensity map (Figure 2). The mean Sr/Ca ratios from the core to the edge of each otolith were 0.79 ± 0.66, 0.59 ± 0.59, 0.75 ± 0.49, 0.52 ± 0.42, 0.59 ± 0.48, 0.88 ± 0.51, 0.98 ± 0.63, 0.98 ± 0.54, 0.63 ± 0.57, 0.48 ± 0.39, 0.39 ± 0.34, 0.92 ± 0.57, and 0.49 ± 0.43 (mean ± SD) for HX01, HX07, BL01, BL02, BL03, HZ17, HZ24, HZ25, LX28, LX29, LX30, QY15, and QY27, respectively (Figure 3). Low Sr concentrations throughout the otoliths of the populations were consistent with the type exclusively residing in freshwater involving no long-distance migration from a freshwater habitat to a seawater habitat.
The otolith microchemistry of Humen was indicative of the different migration patterns (estuarine migratory). The Sr/Ca ratios of individuals examined from the otolith core to the outermost regions (HM01, HM02, and HM08) were 2.44 ± 1.19, 2.54 ± 1.20, and 3.82 ± 1.53 (Figure 3), which were higher than those collected in freshwater. The X-ray intensity maps revealed that all estuarine otoliths had yellowish or reddish areas in the core region (higher Sr: 3.91 ± 0.69, 4.04 ± 0.85, and 5.11 ± 1.20 for HM01, HM08, and HM02, respectively) as a high signal recorded in Figure 2 and the Sr/Ca ratio subsequently dropped beginning at a range of about 300–500 µm away from the otolith core. These core markers indicated that individuals migrated in chemically distinct environments. The peak Sr/Ca ratio values in the life-history transects of the three estuarine samples were in the core region, which was consistent with migrating between freshwater and seawater, and there were fewer fluctuations of Sr concentration in the peripheral/outermost regions. Marked Sr deposition co-occurred with rapid growth during the early life history of C. grayii with migration into and residency in saltwater (Humen).

3.2. Phylogenetic Analyses

A 1091-bp segment of the mitochondrial control region was amplified from 155 individuals for the six localities. This process produced 40 segregating sites and 37 haplotypes (Table S2). Three dominant haplotypes were shared by four or five populations, while seven haplotypes were distributed in two or three populations, and the remaining haplotypes were single haplotypes (Table S3). Only two haplotypes were detected in the HX population in Yu River and only two dominant haplotypes were found in the LX population of the Bei River upstream. Spatial variations (including long-distance) were observed in the levels of genetic diversity. High haplotype diversity (Hd) in combination with low nucleotide diversity (π) (HdD-loop = 0.853 ± 0.000284, πD-loop = 0.0039 ± 0.00011) was derived from numerous closely associated haplotypes. Among the six populations, the highest Hd and π were recorded in the HM and QY populations, while the HX population presented the lowest Hd and π. For the cytochrome b gene (cyt b), the sequence data were obtained from 132 individuals of C. grayii, which yielded 18 haplotypes and segregated 22 sites (Table S4). The Hd and π values were lower compared to the D-loop (Hdcyt b = 0.306 ± 0.000284, πcyt b = 0.00051 ± 0.00011).
Based on genetic distances, the Neighbor-Net networks within the D-loop exhibited all of the predicted linking haplotypes in C. grayii, and many less frequently occurring haplotypes differed from the abundant haplotype by a single nucleotide, particularly in the HM assemblages, whereas the BL and QY populations had haplotypes with less frequency and multiple mutations, with few haplotypes among the LX and HX populations (Figure 4b). The cyt b network displayed only 18 haplotypes and one distinct dominant haplotype in the whole population, with several low-frequency haplotypes joining the dominant haplotype (Figure 4a).
In addition, five simple sequence repeat markers were amplified in 174 specimens, ranging from 7 to 17 alleles with an average of 13.8 per locus (Table 2). We determined that a large number of homozygotes were apparent in DJ360, which also exhibited the highest FIS value (FIS = 0.4378) and likely suffered allelic dropout. Much lower observed heterozygosity (HO) was detected in samples from two upstream populations (LX and HX) than other populations. These results indicate the upstream populations were in a departure from Hardy–Weinberg equilibrium (HWE) and the possibility of inbreeding, although many genetic polymorphisms (PIC > 0.5) were observed in all populations.

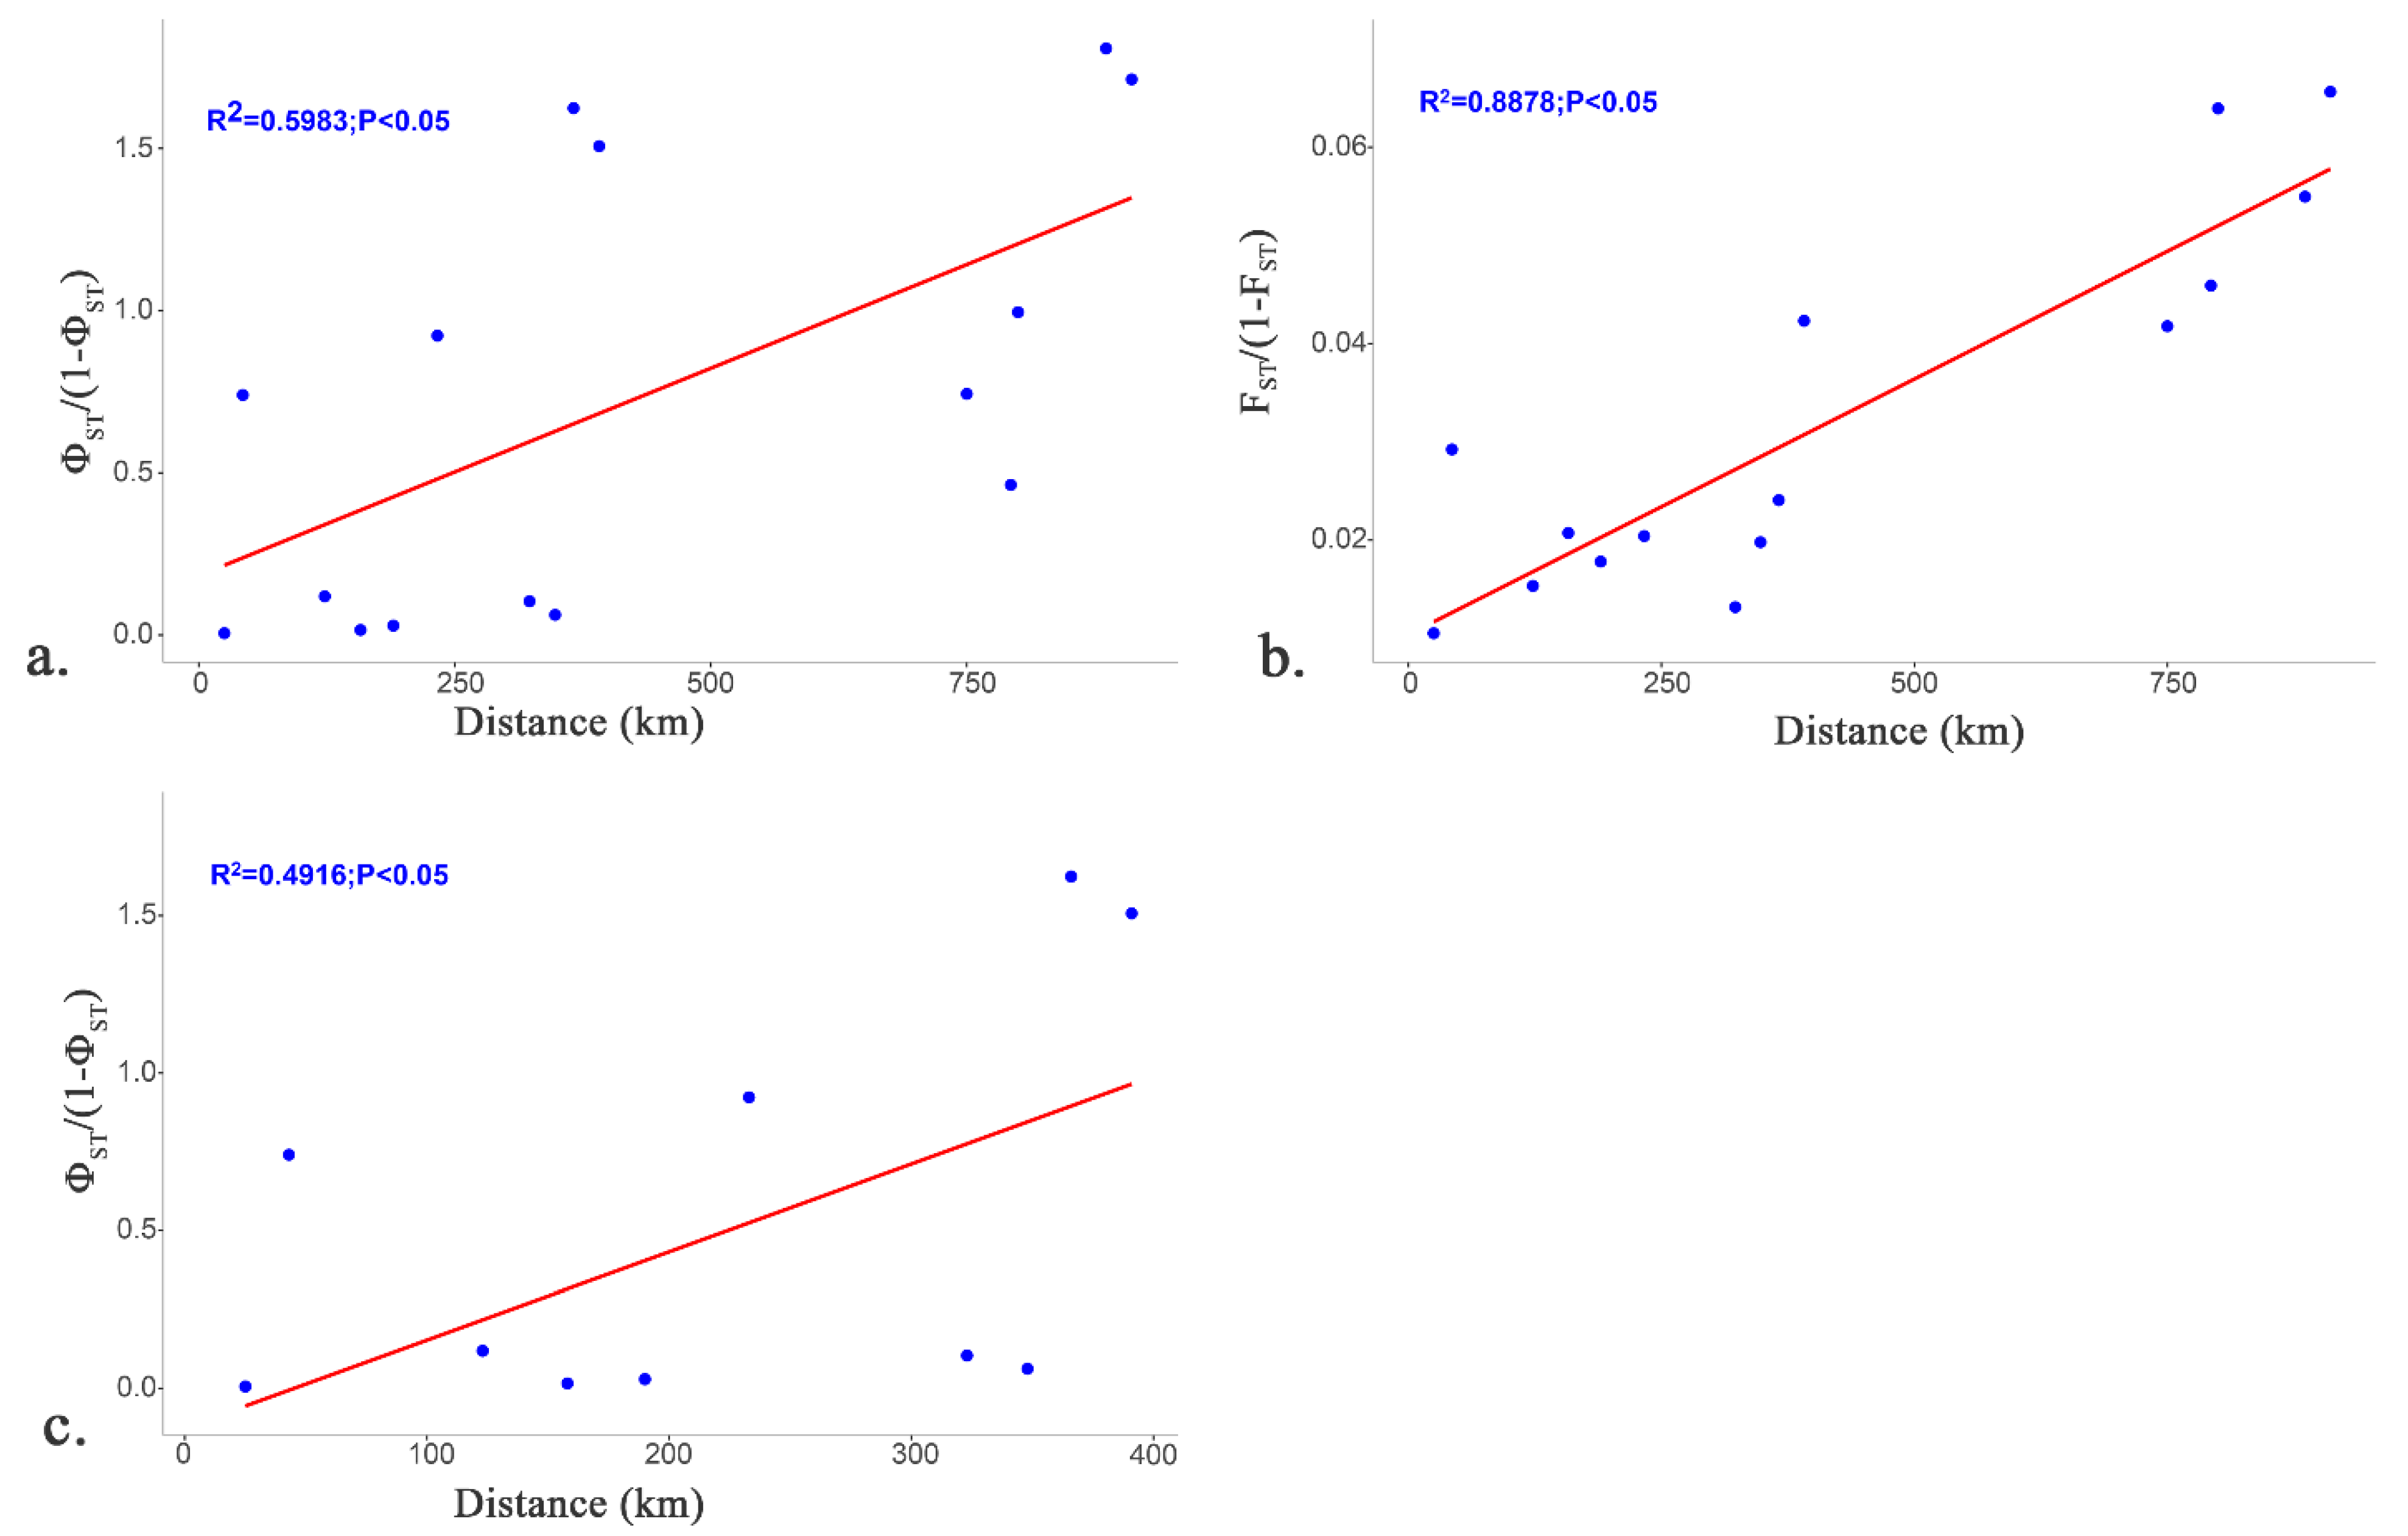
3.3. Population Genetics and Structure

Analysis of molecular variance based on two mitochondrial genes was employed to show that most of the genetic variability (Table 3) was due to variance within populations rather than among populations. These results were further corroborated by the microsatellite database. The genetic variance based on the cyt b haplotypes was low and not well resolved, nor was there a clear signature of genetic differentiation among the populations. However, the mtDNA control region analyses resulted in high variance among populations, coupled with a significant difference in ΦST, suggesting that genetic variation between sampling sites accounted for more than 30% of the total variation. Most genetic differentiation was observed in the HX population: its pairwise genetic distance analysis showed at least a moderate differentiation level (ΦST > 0.25; Wright 1984) compared with the other populations (Table 4). A similar phenomenon of most genetic differentiation within the farthest population (HX) has been reported in microsatellite data (Table S5). The genetic differentiation between HM and the other two upstream populations was higher than the others. The pairwise ΦSTD-Loop results also denoted the fact that genetic variation originated from geographical populations among different tributaries and the estuary (ΦSTD-Loop = 0.0658–0.5720, p < 0.01).
Figure 5 provides plots of pairwise genetic distance vs. geographic distance to distinguish the correlations between genetic distance and geographic distance among the populations based on the D-loop sequences and microsatellite data. The Mantel test showed that the divergence of the C. grayii geographic populations in the Pearl River was consistent with the geographical isolation model (IBD model). The genetic differentiation among populations was positively correlated with the geographical distance of the pairwise populations (R2 = 0.5983, p = 0.0028 **) (Figure 5a) or all six populations, excluding Hengxian (R2 = 0.4916, p = 0.0167 *) (Figure 5c). Furthermore, a strong correlation was detected with the microsatellite data (R2 = 0.8878, p = 0.0056 **) (Figure 5b).
Bayesian clustering analyses based on microsatellite loci using the ΔK method suggested that the best K value was 3 (Figure 6). No distinct genetic structure was observed between up and downstream populations except HX. In three cluster assignments, all individuals from the HX population tended to form a distinct cluster well separated from the rest.

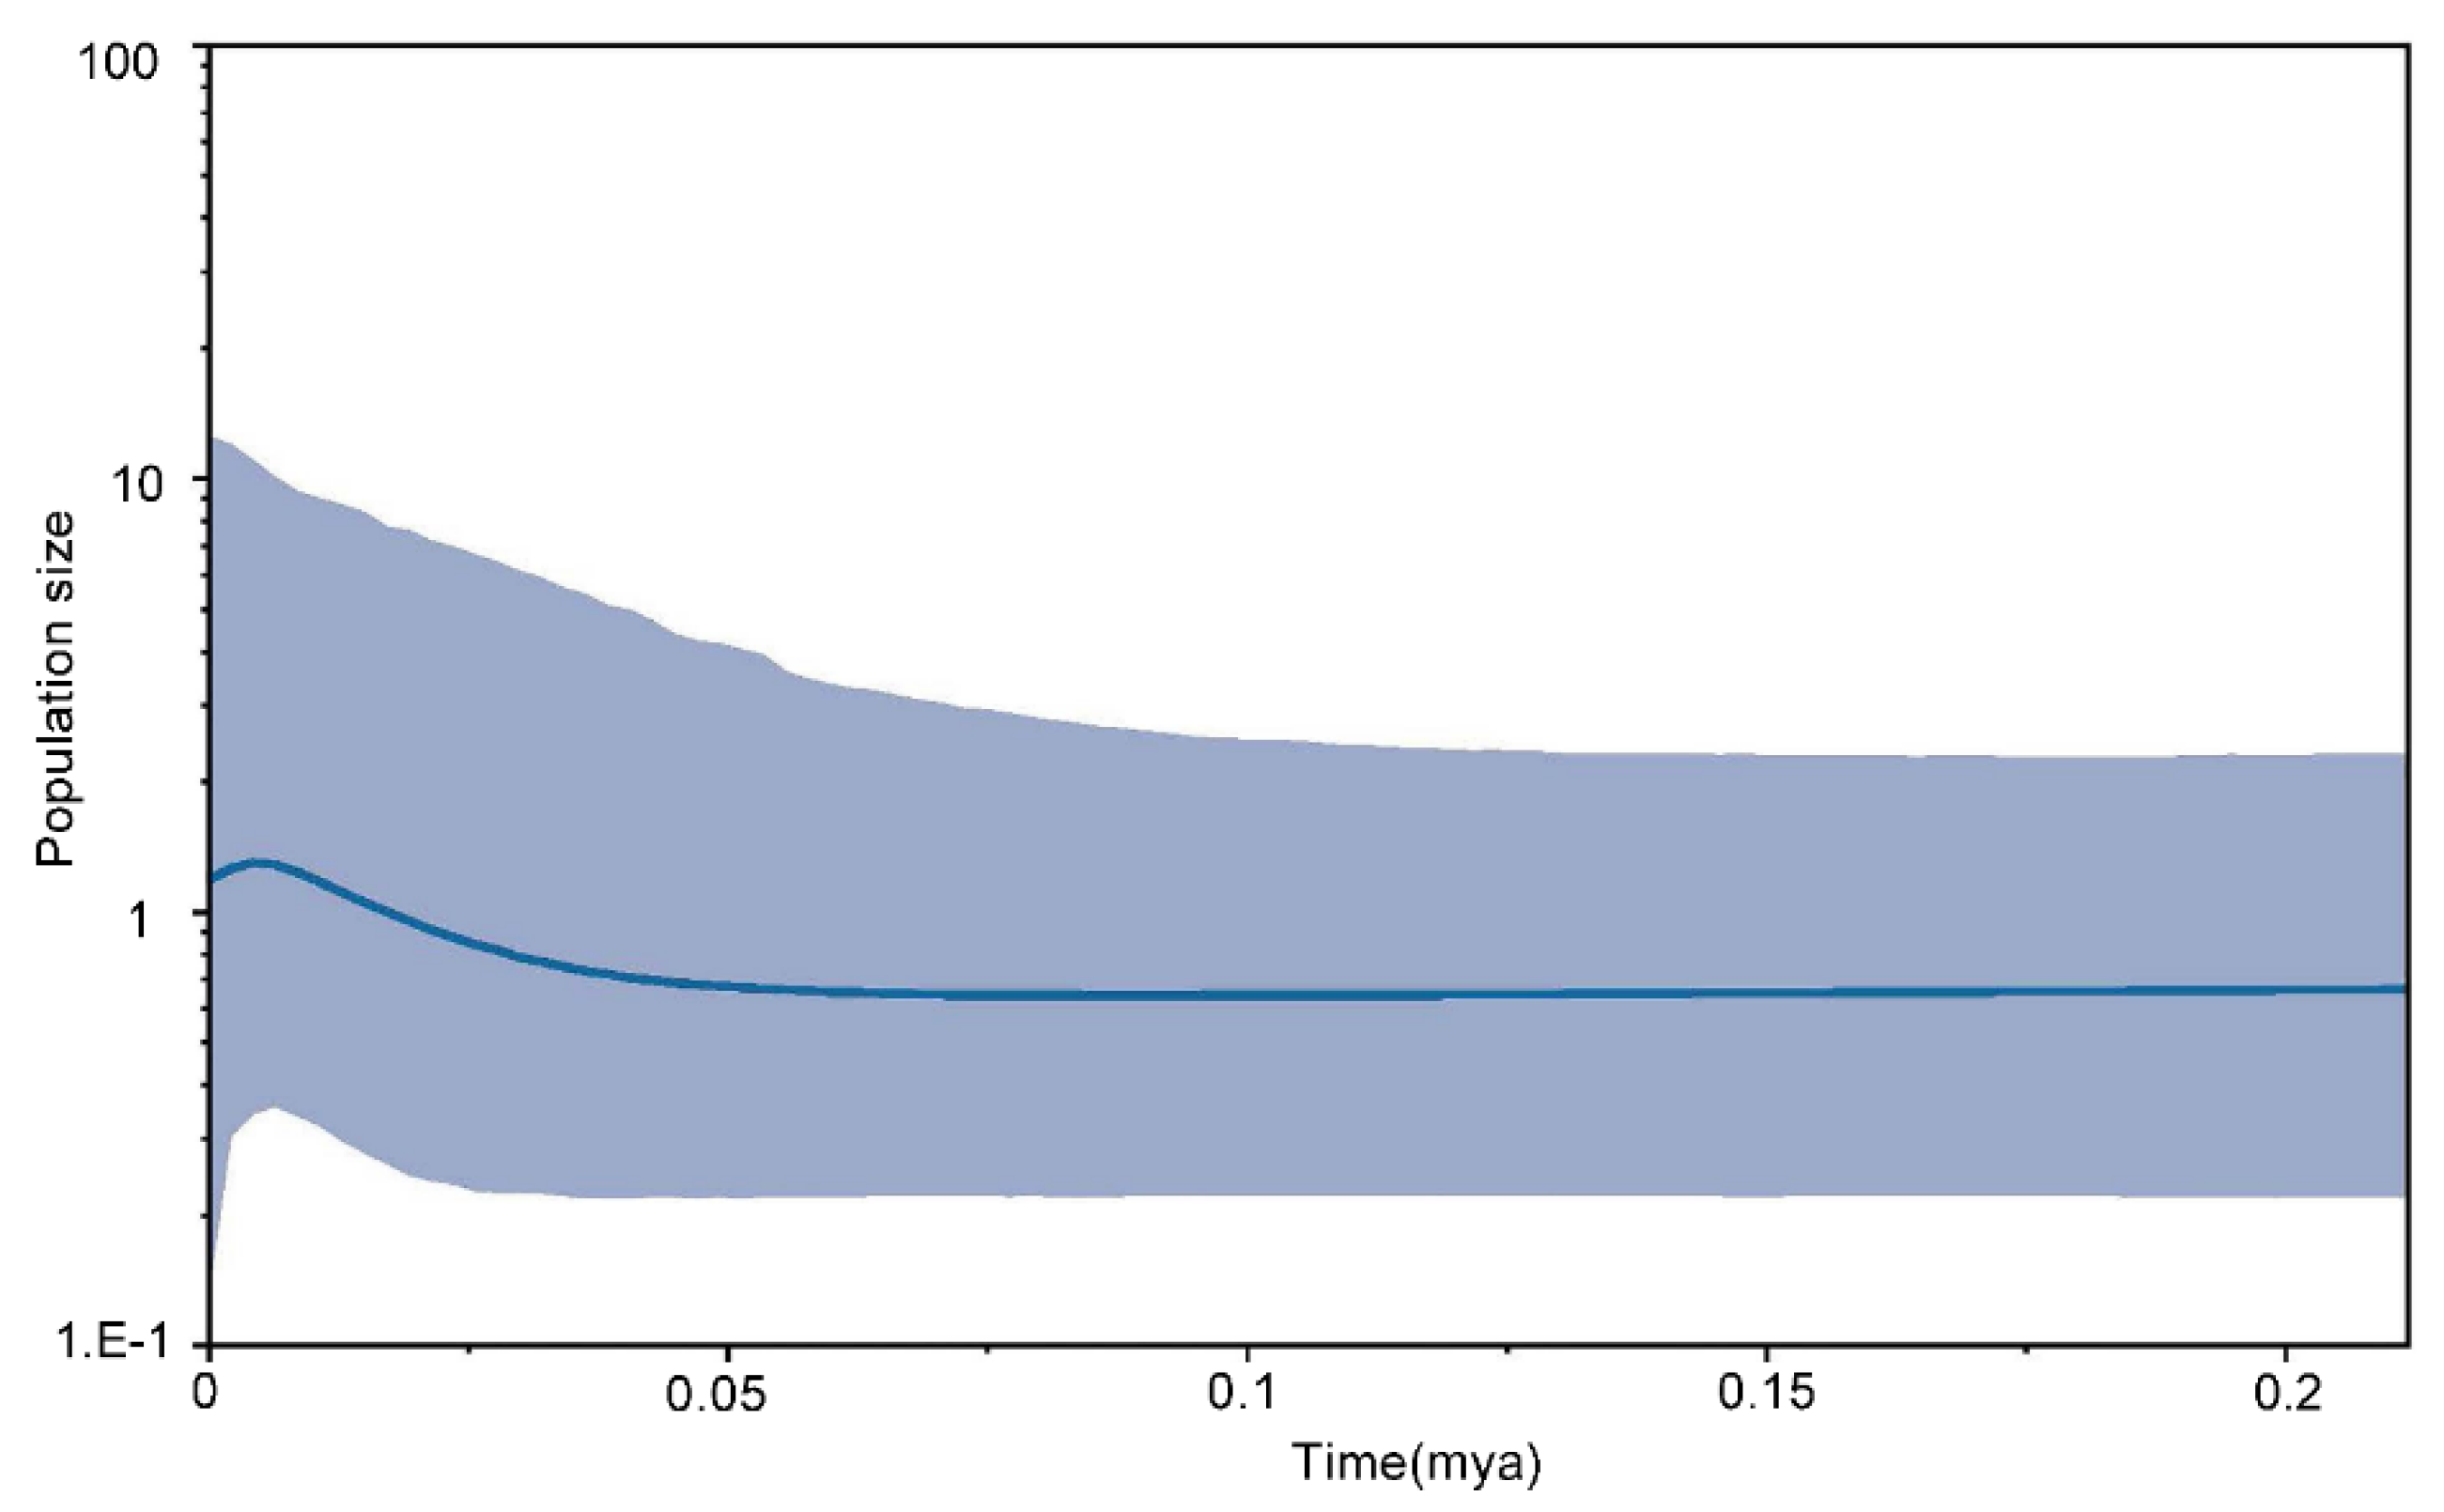
3.4. Demography History

Fu’s Fs-test and Tajima’s D-test based on the mtDNA markers (cyt b and D-loop sequences) yielded negative and non-significant values in the majority of the populations, while the total population results were significant because of the population structure. The significantly negative values manifested an excess of rare haplotypes and low-frequency variants among the populations. We performed an analysis using the BOTTLENECK 1.2 software to test possible deviations in mutation-drift equilibrium. The results were significant (p < 0.050) for the IAM on the Wilcoxon test (Table 5) among three upper-dam populations (HX, LX, and HZ). In part agreement with these findings, the allele frequency distribution pattern of HX was inconsistent with a standard L shape (Figure 7). These results suggested that the populations have recently undergone a colonization and founder effect. Further analysis of the population demographic history is shown by the Bayesian skyline plot of the D-loop sequences—the species has experienced significant expansion in the past 20 thousand years (Figure 8). Thus, the colonization and recent historical population expansion were the main causes of the demographic changes in the overall population.

4. Discussion

4.1. Migratory Behavioral Variations

The elemental concentrations in otoliths differed significantly among locations. These concentrations are strongly related to the chemical compositions of the environment in which individuals reside during a particular period of time [59,60]. This study offers new insight into the life history of C. grayii and contributes to determining migratory behavior using otolith microchemistry. We discovered two types of life histories using EPMA—a life history from residency in freshwater, and the migratory life history from the residency of the Humen population in the estuary. This phenomenon reveals that C. grayii is capable of migrating among chemically distinct environments, which is particularly important in poorly studied polymorphic migratory behaviors. The results were consistent with previous findings that both migratory and freshwater resident types are present in C. nasus which is the most closely related sister species of C. grayii in Poyang Lake [61]. The Sr/Ca ratio has been used in many studies as a marker to indicate a shift between freshwater and marine environments in anadromous fish and to study population structure and plasticity in different habitats [62]. Most studies have been conducted in nearshore environments, either within estuaries or on shallow coastal reefs [63,64].
It is generally accepted that C. grayii juveniles in the Pearl River Estuary are migratory fish that complete their early life stages in freshwater [22]. The results of the EPMA analysis of sixteen individuals collected in the estuary and three tributaries appeared in two migratory patterns. All tributary samples were freshwater residents (Sr/Ca ratio < 3), suggesting that they may never enter seawater during their early stages, while estuarine samples presented high Sr/Ca ratios (2–5) and hatched in brackish water. The microchemical traces in the otoliths were consistent with juveniles drifting with the current into the estuary to grow [65,66].
There were two sites with distinct water chemistry that may have produced distinct signatures in the otolith cores of the fish captured there. The distinct chemical “zones” of high and low Sr/Ca ratios found in the estuarine otoliths suggest that individuals in the Humen population (HM) spent multiple growing seasons in several chemically distinct environments, which was behaviorally distinct from the freshwater fish. The Sr/Ca ratios observed in the present study (Figure 3) varied widely, but are easily explained as the signature of entry into brackish water from freshwater. Further studies with more extensive sampling will be necessary to clarify these life-history details and determine how common these hypothesized behaviors may be within this widespread species.

4.2. Genetic Diversity

The high haplotype diversity (Hd) of the mtDNA D-loop marker in the present study could be attributed to active migration of the anadromous anchovy, particularly in the case of HM (higher derived locus frequency). Populations with a larger effective population size result in a greater number of haplotypes compared to those with smaller effective population sizes [67,68]. The high haplotype diversity values were similar to those reported for widely distributed anadromous fish and semi-migratory fish, such as sardines [69] and Atlantic herring Clupea harengus [10,11]
By contrast, low nucleotide diversity implies a high number of closely related haplotypes with very minimal differences between them [70]. Although the numbers of haplotypes identified for all species were large, genetic differences between haplotypes were considerably low. This high haplotype diversity with low nucleotide diversity is similar to many marine taxa inferred using mtDNA sequence data [71,72]. When a new population develops from a small group, novel mutations are accumulated rapidly, accompanied by the increase in population size, but the nucleotide variation does not accumulate in the short term, resulting in a group with high haplotype heterogeneity and low nucleotide diversity [73]. This group usually has one or two widely existing central haplotypes, and the remaining branch haplotypes are derived from the central haplotype (high frequency of latest mutation singletons or doubletons with a widely distributed haplotype giving rise to a star-shaped network) [74]. Overall, the genetic diversity of the C. grayii populations was low (πD-loop < 0.005), while total haplotype diversity was high (HdD-loop > 0.5) indicating rapid population expansion. It was noteworthy that low observed heterozygosity (HO) was apparent in two upstream populations from microsatellite markers analysis, which indicates the possibility of the presence of inbreeding or Wahlunds’ effect from population substructure [75,76]. Combining both results, it is reasonable to speculate that upstream populations are based on a few founders, which often occur at the edge of an expanding species range exhibiting lower genetic diversity [77], particularly dam separated them in this research.

4.3. Population Structure and Habitat Fragmentation

A clear geographic structure was inferred based on the genetic data—the distinctive HX population was separated from the remaining populations and the increasing tendency towards genetic differentiation between LX population and the downstream populations, indicating that the edge population of an expanding species presented genetic differentiation. These patterns raised an intriguing question: why was HX isolated from the remaining populations, while the others were not? Taken together, the complex separation suggests that geographic distances are likely to be related to the population genetics of C. grayii, as distinct levels of genetic differentiation were observed among long-distance sites, for instance, the river pathway between Hengxian and Humen is more than 890 km long. Furthermore, HX is not only just the farthest population, based on the map, its geographical distance to the closest population seems to be much larger than the largest distance among the remaining populations. It is generally accepted that a long geographic distance promotes increased genetic differentiation and decreased genetic diversity [78]. The Mantel test showed that the population genetic distance of C. grayii in the Pearl River was consistent with the geographical isolation model (IBD model). Genetic differentiation among the populations was positively correlated with geographical distance. Considering that the HX population was farthest from the other populations, the result excluding Hengxian was also significant (R2 = 0.4916, p = 0.0167 *). Similar phylogeographic divergence has been reported in other aquatic organisms (i.e., red swamp crayfish and darters) in the Pearl River basin [79,80]. The IBD pattern also agrees well with the life history of this species.
Barriers that strongly impact wildlife migratory behavior, such as dams, are considered as a driver for affecting genetic connectivity within the river network, resulting in altered genetic structure and favoring genetic divergence, and possibly hindering the recovery of populations [25,81,82]. Genetic differentiation is often identified among populations that are up- or downstream of these types of physical barriers for species including Chinook salmon, brook trout, and chum salmon [83,84]. We demonstrated a reduction of nucleotide diversity presented in the upper-dam populations in the study, which might be due to restricted gene flow and genetic drift. We speculate that the level of population differentiation is positively correlated with the amount of time that a dam has blocked migratory access, although no statistical evidence can be presented. The above-dam population in the Yu River has experienced long-term isolation. The dam was built in 1985 and the river had significantly low genetic diversity (πD-loop = 0.00039, HdD-loop = 0.071) with only two haplotypes and low gene flow. The upstream populations with long forming time properly have undergone a colonization and founder effect, and the effective population size of the isolated population became smaller. Thus, genetic drift and genetic differentiation among populations increased [85]. Interestingly, the HM and HZ populations had higher divergence than QY, although the distance between Humen and Qingyuan is nearly twice as far as that from Humen to Huizhou.
Strong evidence demonstrates that both geographic distance and habitat fragmentation affect spatial genetic variation; however, we cannot distinguish the interaction between the two components, and the presence of barriers may have a considerable impact on IBD patterns [86]. For instance, the obvious genetic differentiation of population BL and HZ separated by the Jiantan dam should have been observed, but the gene flow still was apparent due to the short distance between the two populations. In this research, the founder effect is a force that could not be neglected and is also capable to contribute to the interaction effect. This is a modest dataset in terms of sample sizes, and we need a broader sampling scheme to eliminate spatial correlation in the loci frequency distributions caused by barriers that are under investigation and test the validity of these hypotheses in the future. Another important issue must be pointed out: By establishing a set of microsatellite markers to use in each analysis for the given species, the number of the markers to employ should be sufficient and highly discriminating. Considering the limitation of the low number of microsatellite markers in this research, the lack of resolution found may be a consequence of that.

4.4. Fluctuations in Demography and Migration

The low genetic diversity of the isolated populations (HX) from the distant upper-dam was probably a consequence of decreased heterozygosity (Ho), which led to a decrease in population size and changes in the genetic structure of the population [87]. The microsatellite analysis revealed that the farthest upstream population has undergone colonization, supported by strongly negative values from Fu’s Fs indices and Tajima’s D neutrality test, which were most likely the result of population declines. These populations are distributed in an isolated watershed with few opportunities to disperse across barriers or long distances. This genetic drift has not taken place in all subpopulations. The downstream populations along the Pearl River Estuary exhibited stable size, where diverse haplotypes and high gene flow precludes the possibility of deep population structuring and impedes speciation [19]. For instance, the high genetic diversity of the specimens from HM, as well as the many haplotypes (singletons or doubletons with a widely distributed haplotype giving rise to a star-shaped network) and high polymorphism are consistent with population stability in this region [20]. The population without restricted movement within the river presented unique genotypes and high levels of diversity, more ancient alleles, and many private D-loops. This pattern is supported by the major role of productive estuarine systems. High local gene flow and a lack of genetic structure also coincide with studies on eastern two-winged flyingfish in the Pacific Ocean [88].
Two distinct life history types (anadromous vs. freshwater resident) in the population reminded us to infer the population dynamic history. Notably, non-significant Tajima’s D values in the majority of the populations and Bayesian skyline plot provided evidence that the whole population underwent an episode of recent demographic expansion. These findings confirm that the increase in sea level after the Late Pleistocene resulted in greater availability of habitats when favorable conditions emerged. Similar results have been reported for the expansions of other fish, for example, salmon and silversides [17,77]. New habitats with more ecological resources, such as food, encourage more long-distance dispersal and thus favoring demographic expansion [89,90]. As an anadromous or semi-migratory fish, C. grayii might colonize and some populations take up residence in freshwater, even upstream where there are increases in anthropogenic activities, then, the separated populations are affected by reduced gene flow, ultimately resulting in genetic divergence. Undoubtedly, the heterozygosity of migratory behavior originated from these historical events, and severe environmental fluctuations and early founders could increase the evolutionary load.
In summary, these strongly suggest the impact of isolation and demographic history on the genetic structure and polymorphic migratory behaviors of C. grayii populations, which is considered suitable material for founder effect and divergence research.

5. Conclusions

The combination of otolith microchemistry and genetic analyses suggested anadromous Coilia grayii were observed in the estuarine population which migrated among chemically distinct environments. Furthermore, we also demonstrated that habitat fragmentation and long geographic distance had a significant effect on the genetic diversity of the upstream populations. The isolation driven by behavior and the dam restricted gene flow and reduced genetic diversity. We offer a robust validation that anthropogenic barriers affect migratory behaviors, genetic diversity, population demographics of wild individuals. Here, we provide a better knowledge of the life histories of C. grayii in coastal and freshwater habitats and their fisheries management should be implemented to assure the connectivity of the habitat and the genetic integrity in these C. grayii stocks, building a foundation and guidelines for wild population protection.

Supplementary Materials

The following supporting information can be downloaded at: https://www.mdpi.com/article/10.3390/fishes7010023/s1, Table S1. Information of Microsatellite primer in this study. Table S2. Mitochondrial molecular (D-loop & cyt b) indices. Table S3. Distribution of haplotypes and polymorphic sites based on D-loop. Table S4. Distribution of haplotypes and polymorphic sites based on cyt b. Table S5. Pairwise FST (lower diagonal) and Nm (upper diagonal) between populations based on 5 microsatellite loci.

Author Contributions

G.L. conceived the study; G.L. and Q.T. designed the experiments; Q.T., D.G. and L.Z. collected the samples; Q.T., Z.C. did the experiments; Q.T. and G.W. prepared the figures and tables; G.W. and G.L. drafted the work or revised it critically for important content; H.L. made other contributions. All authors have read and agreed to the published version of the manuscript.

Funding

This research was supported by the National Key R&D Program of China (2019YFD0901202), the Guangdong Basic and Applied Basic Research Foundation (No.2019B1515120065), the Innovation Group Project of Southern Marine Science and Engineering Guangdong Laboratory (Zhuhai)(No.311021004), and the NSFC-Guangdong Joint Fund (No. U1901209).

Institutional Review Board Statement

All the experimental protocols concerning the handling of fish were in accordance with the requirements of the Institutional Animal Care and Use Committee of Sun Yat-sen University, P. R. China. During the sampling, Coilia grayii was obtained from dead individuals and they are not endangered or protected. Therefore, there was no need to apply for a license for collection or approval by the Animal Ethics Committee.

Data Availability Statement

Supporting data is stored in Bankit of the Genbank database, there are relative ID numbers: D-Loop sequences: BankIt2283624:MN717276-MN717430; cyt b sequences: BankIt2288895:MN764902-MN765033; Microsatellite data was provided as additional files.

Acknowledgments

We would like to thank the Wuhan University of Technology for the EPMA analysis, in addition to Lang Xiong for her help with the English writing. We also wanted to thank local fishermen for their help in surveys and fish sampling.

Conflicts of Interest

This manuscript is an original submission that has not been published before and that is not currently under review at any other publication outlet. No conflict of interest exits in the submission of this manuscript, and manuscript is approved by all authors for publication.

References

  1. Yamane, K.; Shirai, K.; Nagakura, Y.; Otake, T. Assessing the usefulness of otolith elemental compositions for evaluating the population structure of the Pacific herring Clupea pallasii in northern Japan. Fish. Sci. 2012, 78, 295–307. [Google Scholar] [CrossRef]
  2. Bae, S.E.; Kim, J.-K. Otolith microchemistry reveals the migration patterns of the flathead grey mulletMugil cephalus(Pisces: Mugilidae) in Korean waters. J. Ecol. Environ. 2020, 44, 21. [Google Scholar] [CrossRef]
  3. Barradas, J.R.S.; Silva, L.G.; Harvey, B.C.; Fontoura, N.F. Estimating migratory fish distribution from altitude and basin area: A case study in a large Neotropical river. Freshw. Biol. 2012, 57, 2297–2305. [Google Scholar] [CrossRef]
  4. Roffe, A.J. Drift as constitutive: Conclusions from a formal reconstruction of population genetics. Hist. Philos. Life Sci. 2019, 41, 55. [Google Scholar] [CrossRef] [PubMed]
  5. Palstra, F.P.; Ruzzante, D.E. A temporal perspective on population structure and gene flow in Atlantic salmon (Salmo salar) in Newfoundland, Canada. Can. J. Fish. Aquat. Sci. 2010, 67, 225–242. [Google Scholar] [CrossRef]
  6. Crookes, S.; Shaw, P.W. Isolation by distance and non-identical patterns of gene flow within two river populations of the freshwater fish Rutilus rutilus (L. 1758). Conserv. Genet. 2016, 17, 861–874. [Google Scholar] [CrossRef] [Green Version]
  7. Beacham, T.D.; Withler, R.E. Population structure of sea-type and lake-type sockeye salmon and kokanee in the Fraser River and Columbia River drainages. PLoS ONE 2017, 12, e0183713. [Google Scholar] [CrossRef] [Green Version]
  8. Waldman, J.R.; King, T.; Savoy, T.; Lorraine, M. Stock origins of subadult and adult atlantic sturgeon, acipenser oxyrinchus, in a non-natal estuary, long island sound. Estuaries Coasts 2013, 36, 257–267. [Google Scholar] [CrossRef] [Green Version]
  9. Florentina, O.D.; Daniela, H.; Radu, S. Management applications of genetic structure of anadromous sturgeon populations in the lower danube river (ldr), romania. scientific annals of the danube delta institute. Sci. Ann. Danub. Delta Inst. 2013, 19, 129–138. [Google Scholar]
  10. Chiesa, S.; Piccinini, A.; Lucentini, L.; Filonzi, L.; Marzano, F.N. Genetic data on endangered twaite shad (clupeidae) assessed in landlocked and anadromous populations: One or more species? Rev. Fish Biol. Fish. 2014, 24, 659–670. [Google Scholar] [CrossRef]
  11. Wahab, M.A.; Rahman, M.M.; Mariom; Wong, L. Morpho-genetic divergence and adaptation of anadromous hilsa shad (Tenualosa ilisha) along their heterogenic migratory habitats. Front. Mar. Sci. 2020, 7, 554. [Google Scholar]
  12. Waples, R.S. Separating the wheat from the Chaff: Patterns of genetic differentiation in high gene flow species. J. Hered. 1998, 89, 438–450. [Google Scholar] [CrossRef]
  13. Hauser, L.; Carvalho, G.R. Paradigm shifts in marine fisheries genetics: Ugly hypotheses slain by beautiful facts. Fish Fish. 2008, 9, 333–362. [Google Scholar] [CrossRef]
  14. Schlotfeldt, B.E.; Kleindorfer, S. Adaptive divergence in the Superb Fairy-wren (Malurus cyaneus): A mainland versus island comparison of morphology and foraging behaviour. Emu-Austral Ornithol. 2006, 106, 309–319. [Google Scholar] [CrossRef] [Green Version]
  15. Hsieh, Y.C.; Chung, J.D.; Wang, C.N.; Chang, C.T.; Chen, C.Y.; Hwang, S.Y. Historical connectivity, contemporary isolation and local adaptation in a widespread but discontinuously distributed species endemic to Taiwan, Rhododendron oldhamii (Ericaceae). Heredity 2013, 111, 147–156. [Google Scholar] [CrossRef] [Green Version]
  16. Wang, I.J.; Summers, K. Genetic structure is correlated with phenotypic divergence rather than geographic isolation in the highly polymorphic strawberry poison-dart frog. Mol. Ecol. 2010, 19, 447–458. [Google Scholar] [CrossRef]
  17. Beheregaray, L.B.; Sunnucks, P. Fine-scale genetic structure, estuarine colonization and incipient speciation in the marine silverside fish Odontesthes argentinensis. Mol. Ecol. 2001, 10, 2849–2866. [Google Scholar] [CrossRef]
  18. Jiang, T.; Zheng, C.; Huang, H.; Xuan, Z.; Qiu, C.; Liu, H.; Yang, J. Landmark-based morphometric comparison of otolith for Coilia mystus and C. grayii from Pearl River estuary and Jiulong River estuary. South China Fish. Sci. 2018, 14, 10–16. [Google Scholar]
  19. Einfeldt, A.L.; Jesson, L.K.; Addison, J.A. Historical human activities reshape evolutionary trajectories across both native and introduced ranges. Ecol. Evol. 2020, 10, 6579–6592. [Google Scholar] [CrossRef]
  20. Zhang, H.X.; Wang, Q.; Jia, S.W. Genomic Phylogeography of Gymnocarpos przewalskii (Caryophyllaceae): Insights into Habitat Fragmentation in Arid Northwestern China. Divers.-Basel 2020, 12, 335. [Google Scholar] [CrossRef]
  21. Yang, Q.L.; Han, Z.Q.; Sun, D.R.; Xie, S.G.; Lin, L.S.; Gao, T.X. Genetics and phylogeny of genus Coilia in China based on AFLP markers. Chin. J. Oceanol. Limnol. 2010, 28, 795–801. [Google Scholar] [CrossRef]
  22. Jiang, T.; Liu, H.; Huang, H.; Yang, J. Otolith microchemistry of coilia grayii from the pearl river estuary, china. Acta Hydrobiol. Sin. 2015, 39, 816–821. [Google Scholar]
  23. Lucas, M.C.; Frear, P.A. Effects of a flow-gauging weir on the migratory behaviour of adult barbel, a riverine cyprinid. J. Fish Biol. 1997, 50, 382–396. [Google Scholar] [CrossRef]
  24. Geeraerts, C.; Ovidio, M.; Verbiest, H.; Buysse, D.; Coeck, J.; Belpaire, C.; Philippart, J.C. Mobility of individual roach Rutilus rutilus (L.) in three weir-fragmented Belgian rivers. Hydrobiologia 2007, 582, 143–153. [Google Scholar] [CrossRef]
  25. Esguicero, A.L.H.; Arcifa, M. Fragmentation of a Neotropical migratory fish population by a century-old dam. Hydrobiologia 2010, 638, 41–53. [Google Scholar] [CrossRef]
  26. Yamamoto, S.; Morita, K.; Koizumi, I.; Maekawa, K. Genetic differentiation of white-spotted charr (Salvelinus leucomaenis) populations after habitat fragmentation: Spatial-temporal changes in gene frequencies. Conserv. Genet. 2004, 5, 529–538. [Google Scholar] [CrossRef]
  27. Hollatz, C.; Vilaca, S.T.; Redondo, R.A.F.; Marmontel, M.; Baker, C.S.; Santos, F.R. The Amazon River system as an ecological barrier driving genetic differentiation of the pink dolphin (Inia geoffrensis). Biol. J. Linn. Soc. 2011, 102, 812–827. [Google Scholar] [CrossRef] [Green Version]
  28. Catarino, L.; Martins, E.S.; Diniz, M.A. Vegetation structure and ecology of the Cufada Lagoon (Guinea-Bissau). Afr. J. Ecol. 2002, 40, 252–259. [Google Scholar] [CrossRef]
  29. Irwin, D.E.; Irwin, J.H.; Smith, T.B. Genetic variation and seasonal migratory connectivity in Wilson’s warblers (Wilsonia pusilla): Species-level differences in nuclear DNA between western and eastern populations. Mol. Ecol. 2011, 20, 3102–3115. [Google Scholar] [CrossRef]
  30. Jacobson, B.; Peres-Neto, P.R. Quantifying and disentangling dispersal in metacommunities: How close have we come? How far is there to go? Landsc. Ecol. 2010, 25, 495–507. [Google Scholar] [CrossRef]
  31. Christie, M.R.; Meirmans, P.G.; Gaggiotti, O.E.; Toonen, R.J.; White, C. Disentangling the relative merits and disadvantages of parentage analysis and assignment tests for inferring population connectivity. Ices J. Mar. Sci. 2017, 74, 1749–1762. [Google Scholar] [CrossRef] [Green Version]
  32. Hedrick, P.W. Perspective: Highly variable loci and their interpretation in evolution and conservation. Evolution 1999, 53, 313–318. [Google Scholar] [CrossRef] [PubMed]
  33. Estoup, A.; Jarne, P.; Cornuet, J.M. Homoplasy and mutation model at microsatellite loci and their consequences for population genetics analysis. Mol. Ecol. 2002, 11, 1591–1604. [Google Scholar] [CrossRef] [PubMed]
  34. Bohonak, A.J. Dispersal, gene flow, and population structure. Q. Rev. Biol. 1999, 74, 21–45. [Google Scholar] [CrossRef] [PubMed]
  35. Ramos, R.; Song, G.; Navarro, J.; Zhang, R.Y.; Symes, C.T.; Forero, M.G.; Lei, F.M. Population genetic structure and long-distance dispersal of a recently expanding migratory bird. Mol. Phylogenet. Evol. 2016, 99, 194–203. [Google Scholar] [CrossRef]
  36. Yang, J.; Arai, T.; Liu, H.; Miyazaki, N.; Tsukamoto, K. Reconstructing habitat use of Coilia mystus and Coilia ectenes of the Yangtze River Estuary, and of Coilia ectenes of Taihu Lake, based on otolith strontium and calcium. J. Fish. Biol. 2006, 69, 1120–1135. [Google Scholar] [CrossRef]
  37. Yang, J.; Jiang, T.; Liu, H. Are there habitat salinity markers of the Sr:Ca ratio in the otolith of wild diadromous fishes? A literature survey. Ichthyol. Res. 2011, 58, 291–294. [Google Scholar] [CrossRef]
  38. Xiao, W.H.; Zhang, Y.P.; Liu, H.Z. Molecular systematics of Xenocyprinae (Teleostei: Cyprinidae): Taxonomy, biogeography, and coevolution of a special group restricted in east Asia. Mol. Phylogenet. Evol. 2001, 18, 163–173. [Google Scholar] [CrossRef] [Green Version]
  39. Liu, K.; Duan, J.-r.; Xu, D.-p.; Zhang, M.-y.; Fang, D.-a.; Shi, W.-g. Present situation of Coilia nasus population features and yield in Yangtze River estuary waters in fishing season. Shengtaixue Zazhi 2012, 31, 3138–3143. [Google Scholar]
  40. Tamura, K.; Stecher, G.; Peterson, D.; Filipski, A.; Kumar, S. MEGA6: Molecular Evolutionary Genetics Analysis Version 6.0. Mol. Biol. Evol. 2013, 30, 2725–2729. [Google Scholar] [CrossRef] [Green Version]
  41. Castresana, J. Selection of conserved blocks from multiple alignments for their use in phylogenetic analysis. Mol. Biol. Evol. 2000, 17, 540–552. [Google Scholar] [CrossRef] [PubMed] [Green Version]
  42. Talavera, G.; Castresana, J. Improvement of phylogenies after removing divergent and ambiguously aligned blocks from protein sequence alignments. Syst. Biol. 2007, 56, 564–577. [Google Scholar] [CrossRef] [PubMed] [Green Version]
  43. Nylander, J.A.A.; Ronquist, F.; Huelsenbeck, J.P.; Nieves-Aldrey, J.L. Bayesian phylogenetic analysis of combined data. Syst. Biol. 2004, 53, 47–67. [Google Scholar] [CrossRef] [PubMed] [Green Version]
  44. Librado, P.; Rozas, J. DnaSP v5: A software for comprehensive analysis of DNA polymorphism data. Bioinformatics 2009, 25, 1451–1452. [Google Scholar] [CrossRef] [Green Version]
  45. Bandelt, H.J.; Alves-Silva, J.; Guimaraes, P.E.M.; Santos, M.S.; Brehm, A.; Pereira, L.; Coppa, A.; Larruga, J.M.; Rengo, C.; Scozzari, R.; et al. Phylogeography of the human mitochondrial haplogroup L3e: A snapshot of African prehistory and Atlantic slave trade. Ann. Hum. Genet. 2001, 65, 549–563. [Google Scholar] [CrossRef] [PubMed]
  46. Ronquist, F.; Teslenko, M.; van der Mark, P.; Ayres, D.L.; Darling, A.; Hohna, S.; Larget, B.; Liu, L.; Suchard, M.A.; Huelsenbeck, J.P. MrBayes 3.2: Efficient Bayesian Phylogenetic Inference and Model Choice Across a Large Model Space. Syst. Biol. 2012, 61, 539–542. [Google Scholar] [CrossRef] [PubMed] [Green Version]
  47. Sokal, R.R. Genetic, geographic, and linguistic distances in Europe. Proc. Natl. Acad. Sci. USA 1988, 85, 1722–1726. [Google Scholar] [CrossRef] [PubMed] [Green Version]
  48. Tajima, F. Statistical method for testing the neutral mutation hypothesis by DNA polymorphism. Genetics 1989, 123, 585–595. [Google Scholar] [CrossRef]
  49. Fu, Y.-X. Statistical tests of neutrality of mutations against population growth, hitchhiking and background selection. Genetics 1997, 147, 915–925. [Google Scholar] [CrossRef]
  50. Rogers, A.R.; Harpending, H. Population growth makes waves in the distribution of pairwise genetic differences. Mol. Biol. Evol. 1992, 9, 552–569. [Google Scholar]
  51. Bouckaert, R.; Heled, J.; Kuhnert, D.; Vaughan, T.; Wu, C.H.; Xie, D.; Suchard, M.A.; Rambaut, A.; Drummond, A.J. BEAST 2: A Software Platform for Bayesian Evolutionary Analysis. PLoS Comput. Biol. 2014, 10, e1003537. [Google Scholar] [CrossRef] [PubMed] [Green Version]
  52. Drummond, A.J.; Suchard, M.A.; Xie, D.; Rambaut, A. Bayesian Phylogenetics with BEAUti and the BEAST 1.7. Mol. Biol. Evol. 2012, 29, 1969–1973. [Google Scholar] [CrossRef] [Green Version]
  53. Heled, J.; Drummond, A.J. Bayesian inference of population size history from multiple loci. BMC Evol. Biol. 2008, 8, 289. [Google Scholar] [CrossRef] [PubMed] [Green Version]
  54. Pritchard, J.K.; Stephens, M.; Rosenberg, N.A.; Donnelly, P. Association mapping in structured populations. Am. J. Hum. Genet. 2000, 67, 170–181. [Google Scholar] [CrossRef] [PubMed] [Green Version]
  55. Earl, D.A.; Vonholdt, B.M. STRUCTURE HARVESTER: A website and program for visualizing STRUCTURE output and implementing the Evanno method. Conserv. Genet. Resour. 2012, 4, 359–361. [Google Scholar] [CrossRef]
  56. Jakobsson, M.; Rosenberg, N.A. CLUMPP: A cluster matching and permutation program for dealing with label switching and multimodality in analysis of population structure. Bioinformatics 2007, 23, 1801–1806. [Google Scholar] [CrossRef] [PubMed] [Green Version]
  57. Rosenberg, N.A. DISTRUCT: A program for the graphical display of population structure. Mol. Ecol. Notes 2004, 4, 137–138. [Google Scholar] [CrossRef]
  58. Piry, S.; Luikart, G.; Cornuet, J.M. BOTTLENECK: A computer program for detecting recent reductions in the effective population size using allele frequency data. J. Hered. 1999, 90, 502–503. [Google Scholar] [CrossRef]
  59. Gahagan, B.I.; Vokoun, J.C.; Whitledge, G.W.; Schultz, E.T. Evaluation of Otolith Microchemistry for Identifying Natal Origin of Anadromous River Herring in Connecticut. Mar. Coast. Fish. 2012, 4, 358–372. [Google Scholar] [CrossRef]
  60. Thomas, O.R.B.; Thomas, K.V.; Jenkins, G.P.; Swearer, S.E. Spatio-temporal resolution of spawning and larval nursery habitats using otolith microchemistry is element dependent. Mar. Ecol. Prog. Ser. 2020, 636, 169–187. [Google Scholar] [CrossRef]
  61. Jiang, T.; Zhou, X.; Liu, H.; Liu, H.; Yang, J. Two microchemistry patterns in otoliths of Coilia nasus from Poyang Lake, China. J. Fish. China 2013, 37, 239–244. [Google Scholar] [CrossRef]
  62. Nachon, D.J.; Bareille, G.; Drouineau, H.; Tabouret, H.; Taverny, C.; Boisneau, C.; Berail, S.; Pecheyran, C.; Claverie, F.; Daverat, F. 1980s population-specific compositions of two related anadromous shad species during the oceanic phase determined by microchemistry of archived otoliths. Can. J. Fish. Aquat. Sci. 2020, 77, 164–176. [Google Scholar] [CrossRef]
  63. Chittaro, P.M.; Usseglio, P.; Sale, P. Variation in fish density, assemblage composition and relative rates of predation among mangrove, seagrass and coral reef habitats. Environ. Biol. Fishes 2005, 72, 175–187. [Google Scholar] [CrossRef]
  64. Ruttenberg, B.I.; Hamilton, S.L.; Warner, R.R. Spatial and temporal variation in the natal otolith chemistry of a Hawaiian reef fish: Prospects for measuring population connectivity. Can. J. Fish. Aquat. Sci. 2008, 65, 1181–1192. [Google Scholar] [CrossRef] [Green Version]
  65. Elsdon, T.S.; Gillanders, B.M. Reconstructing migratory patterns of fish based on environmental influences on otolith chemistry. Rev. Fish Biol. Fish. 2003, 13, 219–235. [Google Scholar] [CrossRef]
  66. Hsu, C.C.; Tzeng, W.N. Validation of Annular Deposition in Scales and Otoliths of Flathead Mullet Mugil cephalus. Zool. Stud. 2009, 48, 640–648. [Google Scholar]
  67. Ewens, W.J. Concepts of substitutional load in finite populations. Theor. Popul. Biol. 1972, 3, 153–161. [Google Scholar] [CrossRef]
  68. Bucklin, A.; Wiebe, P.H. Low mitochondrial diversity and small effective population sizes of the copepods Calanus finmarchicus and Nannocalanus minor: Possible impact of climatic variation during recent glaciation. J. Hered. 1998, 89, 383–392. [Google Scholar] [CrossRef] [Green Version]
  69. Bowen, B.W.; Grant, W.S. Phylogeography of the sardines (Sardinops spp.): Assessing biogeographic models and population histories in temperature upwelling zones. Evolution 1997, 51, 1601–1610. [Google Scholar] [CrossRef] [PubMed]
  70. Duan, L.J.; Li, S.Y.; Liu, Y.; Jiang, T.; Failler, P. A trophic model of the Pearl River Delta coastal ecosystem. Ocean Coast. Manag. 2009, 52, 359–367. [Google Scholar] [CrossRef]
  71. Dudgeon, C.L.; Gust, N.; Blair, D. No apparent genetic basis to demographic differences in scarid fishes across continental shelf of the Great Barrier Reef. Mar. Biol. 2000, 137, 1059–1066. [Google Scholar] [CrossRef]
  72. Pedrosa-Gerasmio, I.R.; Agmata, A.B.; Santos, M.D. Genetic diversity, population genetic structure, and demographic history of Auxis thazard (Perciformes), Selar crumenophthalmus (Perciformes), Rastrelliger kanagurta (Perciformes) and Sardinella lemuru (Clupeiformes) in Sulu-Celebes Sea inferred by mitochondrial DNA sequences. Fish. Res. 2015, 162, 64–74. [Google Scholar] [CrossRef]
  73. Grant, W.S.; Clark, A.M.; Bowen, B.W. Why restriction fragment length polymorphism analysis of mitochondrial DNA failed to resolve sardine (Sardinops) biogeography: Insights from mitochondrial DNA ochrome b sequences. Can. J. Fish. Aquat. Sci. 1998, 55, 2539–2547. [Google Scholar] [CrossRef]
  74. Avise, J.C.; Zink, R.M. Molecular Genetic Divergence between Avian Sibling Species: King and Clapper Rails, Long-billed and Short-billed Dowitchers, Boat-tailed and Great-tailed Grackles, and Tufted and Black-crested Titmice. Auk 2008, 105, 516–528. [Google Scholar] [CrossRef]
  75. Nei, M. Molecular Evolutionary Genetics; Columbia University Press: New York, NY, USA, 1987. [Google Scholar]
  76. Sharma, R.; Kumar, B.; Arora, R.; Ahlawat, S.; Mishra, A.K.; Tantia, M.S. Genetic diversity estimates point to immediate efforts for conserving the endangered Tibetan sheep of India. Meta Gene 2016, 8, 14–20. [Google Scholar] [CrossRef] [PubMed]
  77. Scribner, K.T.; Soiseth, C.; McGuire, J.; Sage, G.K.; Thorsteinson, L.; Nielsen, J.L.; Knudsen, E. Genetic assessment of the effects of streamscape succession on coho salmon Oncorhynchus kisutch colonization in recently deglaciated streams. J. Fish Biol. 2017, 91, 195–218. [Google Scholar] [CrossRef]
  78. Saastamoinen, M.; Bocedi, G.; Cote, J.; Legrand, D.; Guillaume, F.; Wheat, C.W.; Fronhofer, E.A.; Garcia, C.; Henry, R.; Husby, A.; et al. Genetics of dispersal. Biol. Rev. 2018, 93, 574–599. [Google Scholar] [CrossRef] [PubMed] [Green Version]
  79. Huang, J.L.; Tang, S.Q.; Cai, F.J.; Lin, Y.F.; Wu, Z.J. Microsatellite evidence of dispersal mechanism of red swamp crayfish (Procambarus clarkii) in the Pearl River basin and implications for its management. Sci. Rep. 2017, 7, 8272. [Google Scholar] [CrossRef] [Green Version]
  80. Camak, D.T.; Piller, K.R. Going with the Flow: Testing the Role of Habitat Isolation among Three Ecologically Divergent Darter Species. Copeia 2018, 106, 375–387. [Google Scholar] [CrossRef] [Green Version]
  81. Neraas, L.P.; Spruell, P. Fragmentation of riverine systems: The genetic effects of dams on bull trout (Salvelinus confluentus) in the Clark Fork River system. Mol. Ecol. 2001, 10, 1153–1164. [Google Scholar] [CrossRef]
  82. Thorstad, E.B.; Okland, F.; Aarestrup, K.; Heggberget, T.G. Factors affecting the within-river spawning migration of Atlantic salmon, with emphasis on human impacts. Rev. Fish Biol. Fish. 2008, 18, 345–371. [Google Scholar] [CrossRef]
  83. Neville, H.M.; Dunham, J.B.; Peacock, M.M. Landscape attributes and life history variability shape genetic structure of trout populations in a stream network. Landsc. Ecol. 2006, 21, 901–916. [Google Scholar] [CrossRef]
  84. Torterotot, J.B.; Perrier, C.; Bergeron, N.E.; Bernatchez, L. Influence of Forest Road Culverts and Waterfalls on the Fine-Scale Distribution of Brook Trout Genetic Diversity in a Boreal Watershed. Trans. Am. Fish. Soc. 2014, 143, 1577–1591. [Google Scholar] [CrossRef]
  85. Nason, J.D.; Aldrich, P.R.; Hamrick, J.L. Dispersal and the dynamics of genetic structure in fragmented tropical tree populations. Trop. For. Remn. Ecol. Manag. Conserv. Fragm. Communities 1997, 304–320. [Google Scholar]
  86. Meirmans, P.G. The trouble with isolation by distance. Mol. Ecol. 2012, 21, 2839–2846. [Google Scholar] [CrossRef]
  87. Lowe, W.H. Factors affecting stage-specific distribution in the stream salamander Gyrinophilus porphyriticus. Herpetologica 2005, 61, 135–144. [Google Scholar] [CrossRef]
  88. Lewallen, E.A.; Bohonak, A.J.; Bonin, C.A.; van Wijnen, A.J.; Pitmans, R.L.; Lovejoy, N.R. Population Genetic Structure of the Tropical Two-Wing Flyingfish (Exocoetus volitans). PLoS ONE 2016, 11, e0163198. [Google Scholar] [CrossRef]
  89. Whitfield, J.A. Studies of the Diversity and Evolution of Soldier Aphids; University of Cambridge: Cambridge, UK, 1998. [Google Scholar]
  90. Lu, K.X. Fishes and Fishery Resources of Pearl River System; Guangdong Science of Technology Press: Guangzhou, China, 1990; (In Chinese with English Abstract). [Google Scholar]
Figure 1. Map of 6 collection sites (red dots) in the three tributaries and estuary of the Pearl River, China. The HX, LX, and HZ are located upstream from dams, defined as upstream populations. Black lines represent dams.
Fishes 07 00023 g001
Figure 2. X-ray intensity maps of strontium (Sr) in the sagittal plane of the 16 representative otoliths of Coilia grayii collected from 6 populations; HX, HZ, and LX are located upstream of the dam while QY and BL are located downstream and HM is near the estuary. The uniform bluish pattern indicated a freshwater residence while the yellowish and reddish pattern suggested a brackish water origin.
Fishes 07 00023 g002
Figure 3. Changes in Sr: Ca ratios from core to the edge of sagittal otolith of Coilia grayii collected from HM, HX, QY, LX, HZ, BL. The Sr: Ca ratios lowering than 3 were considered to be indicative of a freshwater phase and the Sr: Ca ratios ranging from 3 to 5 were considered to be indicative of a brackish water experience.
Fishes 07 00023 g003
Figure 4. Median-joining network of haplotypes of (a) mitochondrial cyt b (18 haplotypes) and (b) D-loop (37 haplotypes) sequences. The frequency is represented by the circle size and numbers. Each black dot suggests one mutational step. Different colors represent different localities.
Fishes 07 00023 g004
Figure 5. Correlation between geographic and genetic distances. (a) Mantel tests based on 1091 bp D-loop region sequences for all six locations; (b) Mantel tests based on the 5 microsatellite loci for all six locations; (c) Mantel tests based on D-loop region sequences for all six locations excluding individuals from the Hengxian.
Fishes 07 00023 g005
Figure 6. Results of the Bayesian clustering analysis performed in STRUCTURE based on microsatellite loci for 6 populations using an admixture model, assuming K from 2 to 6 (the optimal Delta K = 3). The genetic clusters are coded by distinct colors. Each vertical line represents one individual and implies the probability of membership to a genetic cluster. (a) plot of L(K) values from structure analysis, (b) plot of delta K values from structure analysis, and (c) bar plot from structure clustering analysis with K = 3.
Fishes 07 00023 g006
Figure 7. Allele frequency distribution graph of the six populations based on microsatellite markers. A mode shift can be seen in an upstream population (HX), while other populations followed a normal L-shape graph.
Fishes 07 00023 g007
Figure 8. Bayesian skyline plot derived from 1091 bp of D-loop sequences (n = 155). The thick solid line represents the median estimate, and the light blue area corresponds to the 95% highest posterior density (HPD).
Fishes 07 00023 g008
Table 1. Detailed information on the sample sites in this work.
SiteSampleNumberLongitudeLatitudeLocationRegionDamBuilding Time
HMNovember 20153022.80° N113.67° EestuaryEstuaryXijin, Wuzhou1958
HXSemptember 20153022.07° N109.25° EupstreamYu River1993
LXMay 20153023.92° N113.27° EupstreamBei RiverFeilaixia1994
QYMarch 20163023.68° N113.05° EdowmstreamBei River
HZDecember 20153023.10° N114.40° EupstreamDong RiverJiantan2004
BLDecember 20153023.17° N114.28° EdownstreamDong River
QY (Qingyuan) and LX (Lixi) in the Bei River tributary; BL (Boluo) and HZ (Huizhou) in the Dong River tributary; HX (Hengxian) in the Yu River tributary and HM (Humen) near the estuary. We defined Humen (HM) as an estuarine population; populations that are downstream from a dam are downstream populations (BL, QY), the others are upstream populations (HX, LX, HZ).
Table 2. Summary statistics for the 5 microsatellite loci.
PopulationNNaNeHoHePIC
HM30105.34530.7550.80810.7546
HX306.23.44080.64160.69550.6379
LX287.64.36120.57420.75080.7059
QY269.84.53070.7520.72630.6785
BL3010.65.11440.7380.80460.7674
HZ309.85.26320.740.81260.7718
The population genetic statistics includes N: total number of individuals sampled in the population; Ne: average number of nucleotide differences; Na: Polymorphic loci; He: expected heterozygosity, Ho: observed heterozygosity, PIC: The average polymorphism information content.
Table 3. AMOVA analysis of 6 populations based on D-loop and cyt b sequences.
Source of D-Loopd.f.Sum of SquaresMean of SquaresEst. Var.Variation (%)
Among Pops5114.80522.9610.83537%
Within Pops149212.4471.4261.42663%
Total154327.252 2.261100%
Fixation IndicesΦST = 0.369, p = 0.001 **
Source of cyt-bd.f.Sum of SquaresMean of SquaresEst. Var.Variation (%)
Among Pops52.2550.4510.0083%
Within Pops12635.0330.2780.27897%
Total13137.288 0.286100%
Fixation IndicesΦST = 0.028, p = 0.036 *
Source of Microsatesd.f.Sum of SquaresMean of SquaresEst. Var.Variation (%)
Among tributaries312.8691.460.020781.46%
Among populations25.021.390.019771.34%
Within populations342472.8597.151.382697.20%
Total347490.739 1.42315
Fixation IndicesFST = 0.02849, p = 0.016 *
** p < 0.01, * p < 0.05.
Table 4. Pairwise ΦST (lower diagonal) between populations based on D-loop and cyt b sequences.
SequencePopulationHMHXQYLXBLHZ
D-loopHM0
HX0.4988 **0
QY0.02810.4264 **0
LX0.4799 **0.3164 **0.4253 **0
BL0.10650.6439 **0.09440.6189 **0
HZ0.01540.6314 **0.05850.6011 **0.00570
SequencePopulationHMHXQYLXBLHZ
cyt bHM0
HX0.0140
QY0.00200
LX0.0210.070 *0.073 *0
BL0.0320.079 *0.066 *0.0270
HZ0.0060.040.0000.0000.0370
** p < 0.01, * p < 0.05.
Table 5. Bottleneck analysis for Coilia grayii populations using Sign test and Wilcoxon rank test (Probability for one-tail test, heterozygosity excess) under infinite allele, stepwise mutation, and two-phase model. Parameters for TPM: variance = 10%, proportion of SMM = 90%, estimation based on 1000 replications).
PopulationHMHXLXQYHZBL
Sign test
IAM0.673210.318780.328880.677440.337880.68019
TPM0.08990.331330.668680.338350.646850.09749
SMM0.328860.093960.654220.097640.328510.10088
Wilcoxon signed-rank test
IAM0.50000.03125 *0.04688 *0.68750.04688 *0.3125
TPM0.953130.68750.50.890630.406250.95313
SMM0.968750.953130.68750.968750.953130.98438
* p < 0.05.
Publisher’s Note: MDPI stays neutral with regard to jurisdictional claims in published maps and institutional affiliations.

