Article

Oxygen Consumption and Ammonia Excretion of Marphysa sanguinea (Polychaeta: Eunicidae) in Relation to Body Mass and Temperature

1
Key Laboratory of Marine Bio-Resources Restoration and Habitat Reparation in Liaoning Province, Dalian Ocean University, Dalian 116023, China
2
Key Laboratory of North Mariculture, Ministry of Agriculture, Dalian Ocean University, Dalian 116023, China
*
Author to whom correspondence should be addressed.
Fishes 2021, 6(4), 52; https://doi.org/10.3390/fishes6040052
Submission received: 6 September 2021 / Revised: 14 October 2021 / Accepted: 14 October 2021 / Published: 21 October 2021

Abstract

:
(1) Background: Marphysa sanguinea is a polychaete with high economic value and ecological importance. Information on metabolism is important to understand the physiological action of organisms. (2) Methods: The rates of oxygen consumption (R) and ammonia excretion (U) were measured using different temperatures (T) and body mass (M) levels. The activation energy (E)was calculated using the universal temperature dependence theory. (3) Results: Oxygen consumption presented a curve with an upward trend first, and then a downward trend, and ammonia excretion displayed a “U” curve. The effects of temperature and body size on oxygen consumption and ammonia excretion rates were extremely significant. Small individuals had higher metabolic rates than large polychaetes at the same temperature. The relationship between oxygen consumption, ammonia excretion, and M was expressed as Y = a·Mb, bR = 0.56 ± 0.09, and bU = 0.35 ± 0.30. The oxygen consumption activation energy was ER = 0.68 eV, and the ammonia excretion activation energy was EU = 0.53 eV. The O:N ratio at different temperatures and body sizes was in the range of 3.55–56.44. (4) Conclusions: The results not only provide basic data on the metabolism of M. sanguinea but also insights to understand the relationship between animal metabolism and ecological factors from different perspectives.

1. Introduction

Marphysa sanguinea is a widely distributed polychaete in the sedimentary zone of intertidal areas worldwide. As a dominant species that lives in the rock block of the upper and low intertidal regions, M. sanguinea feeds on organic debris and benthic macroalgae. The worm and its larvae are suitable food for marine predatory fish and shrimp. Thus, M. sanguinea is an important species in energy flow and substance circulation in intertidal ecology systems. M. sanguinea is used as an important bioremediation species to the polluted marine sediment environment due to its ability to biotransform organic pollutants, and some molecular markers are used as a sentinel indicator for pollution in coastal sediments [1,2,3,4]. Following the development of aquatic industries and recreational fisheries, M. sanguinea is used widely as an excellent food source for factory-cultured crustaceans and excellent bait that is popular among the public and has a high price in the market [5,6]. The price of M. sanguinea is approximately 100 US dollars (USD) per kilogram in Japan, South Korea and Europe, and this species is known as one of the top expensive polychaete worms in the world [7]. As an indispensable member of marine drug development, M. sanguinea has new peptides and compounds with antioxidant and anticoagulant activities [8,9].
The widespread use of M. sanguinea in many fields has rendered the development of basic biology, artificial breeding, and aquaculture techniques as important. For example, some new species are found in the M. sanguinea complex due to the development of technology and deep sea surveys [10,11,12]. The lifespan [13], oogenesis and spermatogenesis [14], and specific dynamic action [15] have been studied. Artificial breeding [16], larva development [6], and food selection [17] have also been investigated. These findings can provide valuable insights into the biology of this species. However, the basal metabolism of M. sanguinea has not been reported yet.
Metabolism plays an important role in biological research, which can provide a theoretical basis for understanding the physiological action of organisms. Oxygen consumption and ammonia excretion are the most basic life processes of organisms. Temperature (T) and body mass (M) are common factors that affect the metabolism of an animal [18,19]. Research on metabolism not only elucidates the relationship between life reaction and ecological factors but also identifies general patterns of life activity of organisms. According to the calculation of the oxygen consumption rates in different species from germs to vertebrates at different temperatures, “universal temperature dependence” (UTD) theory was developed, and its core is that temperature rules the metabolic ratio of organisms, and each organism needs energy (E) to activate enzymatic reactions in vivo; the E value ranges from 0.2 eV to 1.2 eV in different organisms, with an average of approximately 0.65 eV, it shows the universal. UTD not only helps in determining the effect of ecological factors on metabolic rate but also in understanding the mechanism of metabolism depending on temperature, especially considering the current global warming situation. In the last two decades, the metabolic rates of several polychaetes have been studied [20,21,22,23,24,25,26]. Most polychaete worms live in sediments; for this reason, determining the accurate metabolism rate in sediments or keeping the worm under normal living conditions without sediments is difficult.
In this study, we determined the oxygen consumption and ammonia excretion rates of M. sanguinea with different body mass levels at different temperatures by simulating the natural habitat in U-shaped plastic tubes, where worms could live and grow normally and could reflect their normal physiological conditions. The relationship of metabolism with temperature was analyzed using classical methods and “UTD” methods, and the activation energy of M. sanguinea was calculated. Results not only provide a basis for applying basic metabolic laws to understand polychaete worms but also elucidate the metabolism mechanism.

2. Materials and Methods

2.1. Worm Selection and Temporary Culture

M. sanguinea worms were collected from the intertidal zone of Dalian, China (east longitude 121°44′–121°49′, north latitude 39°01′–39°04′). Intact robust worms were selected and divided into three groups based on wet weight (±SD) as follows: small (S): 1.24 ± 0.06 g, intermediate (I): 4.00 ± 0.30 g, and large (L): 8.54 ± 1.08 g. Each worm was placed into a hollow U-shaped plastic tube, which has an internal diameter similar to the body width of the worm [15]. This set-up could simulate the natural tube of M. sanguinea and ensure that worms are in good living condition. Each group of worms in the U-shaped tube was placed in one tank (100 × 80 × 80 cm). Seawater for culture and exchange was sand filtered and had a stable salinity level of 31–32‰. Water temperature was controlled by a heater (3000 KW) and automatic thermostat (CS-611-H, Chang Shin Co. Ltd., Gyeonggido, Korea). Fresh Ulva lactuca was fed after changing the water every night.
M. sanguinea was kept in seawater at 10 °C for 1 week, and the water temperature was increased by 1 °C every day. Eight temperatures were used, namely, 10, 12, 16, 20, 24, 27, 30, and 32 °C. After the test temperature was reached, the worms were acclimated for 7 days, and various tests were carried out.

2.2. Measurement of Oxygen Consumption and Ammonia Excretion Rates

M. sanguinea was starved for 2 days to avoid the specific dynamic action after feeding and then placed in a 650 mL bottle. L and I groups had one worm per bottle, and S group had two worms per bottle. Three repetitions of the experiment were set per group, and two blank controls were prepared. The bottle was sealed with a plastic film and filled with sea water. No bubbles were observed in the bottle, which was then heated in a constant temperature water bath (±0.2 °C) for 3 h. Water sample was extracted by the siphon method to measure dissolved oxygen and ammonia nitrogen contents.
Winkler iodometry was used to determine the dissolved oxygen concentration in the water sample due to its accuracy [27]. Oxygen consumption rate was determined by the following formula:
R′ = V (O0Ot)/(t·M)
where R′ is the oxygen consumption rate (mg/[g·h]); O0 (mg/L) and Ot (mg/L) are the dissolved oxygen contents in the water of the control and experimental groups at the end of the experiment, respectively; t is the time (h); V is the water volume (L); and M is the dry weight of M. sanguinea (g).
Ammonia nitrogen concentration in water was measured by sodium hypobromite oxidation method and calculated by the following formula [28]:
U′ = V (NtN0)/(t·M)
where U′ is the ammonia excretion rate (μg/[g·h]); N0 (μg/L) and Nt (μg/L) are ammonia concentrations in the water of the control and experimental groups at the end of the experiment, respectively; t is the time (h); V is the water volume (L); and M is the dry weight of M. sanguinea (g).

2.3. Classic Q10 and Ratio of O:N

Classic Q10 is widely used to evaluate the effect of change in temperature on the metabolism rate. This parameter was calculated by the following formula:
Ql0_C = (R′2/R′1)10/(Tc2−Tc1)
where Tc is the temperature (°C); and R′1 and R′2 are the oxygen consumption rates at temperatures Tc1 and Tc2, respectively.
The ratio of O:N is a parameter of substrate utilization for animal respiration. This parameter represents the ratio of protein to fat and carbohydrate catabolism in animals and was calculated by the following formula [29]:
O:N = (R′/16)/(U′/14)
where R′ is the oxygen consumption rate, and U′ is the ammonia excretion rate.

2.4. Activation Energy, UTD Value and Q10 of UTD Calculation

The power function of the metabolic rate and dry weight of the worm (M, in g) is as follows:
Y = a·Mb ↔ lnY = a + blnM,
where a is the constant that is characteristic of the kind of organism, and b represents the rate at which the oxygen consumption rate increases with increasing M. The equations of lnM and lnY were obtained by taking the logarithm of the two sides; b is the slope of the equation, and Y is the oxygen consumption (R) or ammonia excretion rate (U). The ordinary least squares (OLS) method was used to calculate the slope of the regression equation of M. sanguinea lnR (or U) and M at different temperatures. A variance significance test was used to determine the relationship between b (bR for R, bU for U) and temperature. Basing on the studies of Gillooly et al. (2001) [18], we obtained the following formula:
( R 0   or   U 0 ) = c · e E / kT     ln R 0 ( or   U 0 ) = ln c E k T ,
where R0 = R/MbR and U0 = U/MbU are the mass-normalized oxygen consumption and ammonia excretion rates, respectively; E is the activation energy; k is the Boltzmann constant (k = 8.618 × 10⁵ eV K−1); and T is the absolute temperature (K). The metabolic rate dependence on temperature (UTD) was represented by the following formula [18]:
UTD = exp(ETc/kTT0) = exp[ETc/kT02(1+ Tc/T0)],
where Tc is the temperature (°C), T0 = 273.15 K (water freezing temperature), and T is the absolute temperature (K). Thus, E can be calculated by Equation (2), and UTD can be calculated by Equation (3). We also calculated Q10 by using the E value (Q10_E), and it reflects the change under temperature dependence condition by using the following formula [18].
Q10_E = exp(10E/[kT02(1 + Tc/T0)]),

2.5. Statistical Analysis

Statistical analyses were performed using SPSS (version 13.0). A two-way ANOVA was applied to determine significant differences among groups. Stepwise regression was used to determine the relationship of oxygen consumption rate to temperature and body weight.

3. Results

3.1. Oxygen Consumption and Ammonia Excretion of M. sanguinea with Different Body Sizes at Different Temperatures

The oxygen consumption rate of M. sanguinea with different body sizes at different temperatures is shown in Figure 1. The oxygen consumption rate decreased at 10 to 12 °C, increased at 12 to 27 °C, and reached the maximum at 27 °C, with values of 1.31 ± 0.24, 0.49 ± 0.03, and 0.42 ± 0.05 mg·g−1·h−1 in S, I, and L groups, respectively. The oxygen consumption rate decreased significantly at temperatures higher than 32 °C. For the body size, the S group had a significantly higher oxygen consumption rate than the I and L groups at the same temperature. Based on two-way ANOVA, the effect of temperature on oxygen consumption rate was highly significant (F = 32.42, p < 0.01), and the effect of body weight (M) on oxygen consumption rate was also highly significant (F = 23.92, p < 0.01). The relationship of oxygen consumption rate to M and temperature was obtained by stepwise regression analysis with the following formula:
R = 0.54 + 0.01Tc − 0.25W (F = 23.20, p < 0.01)
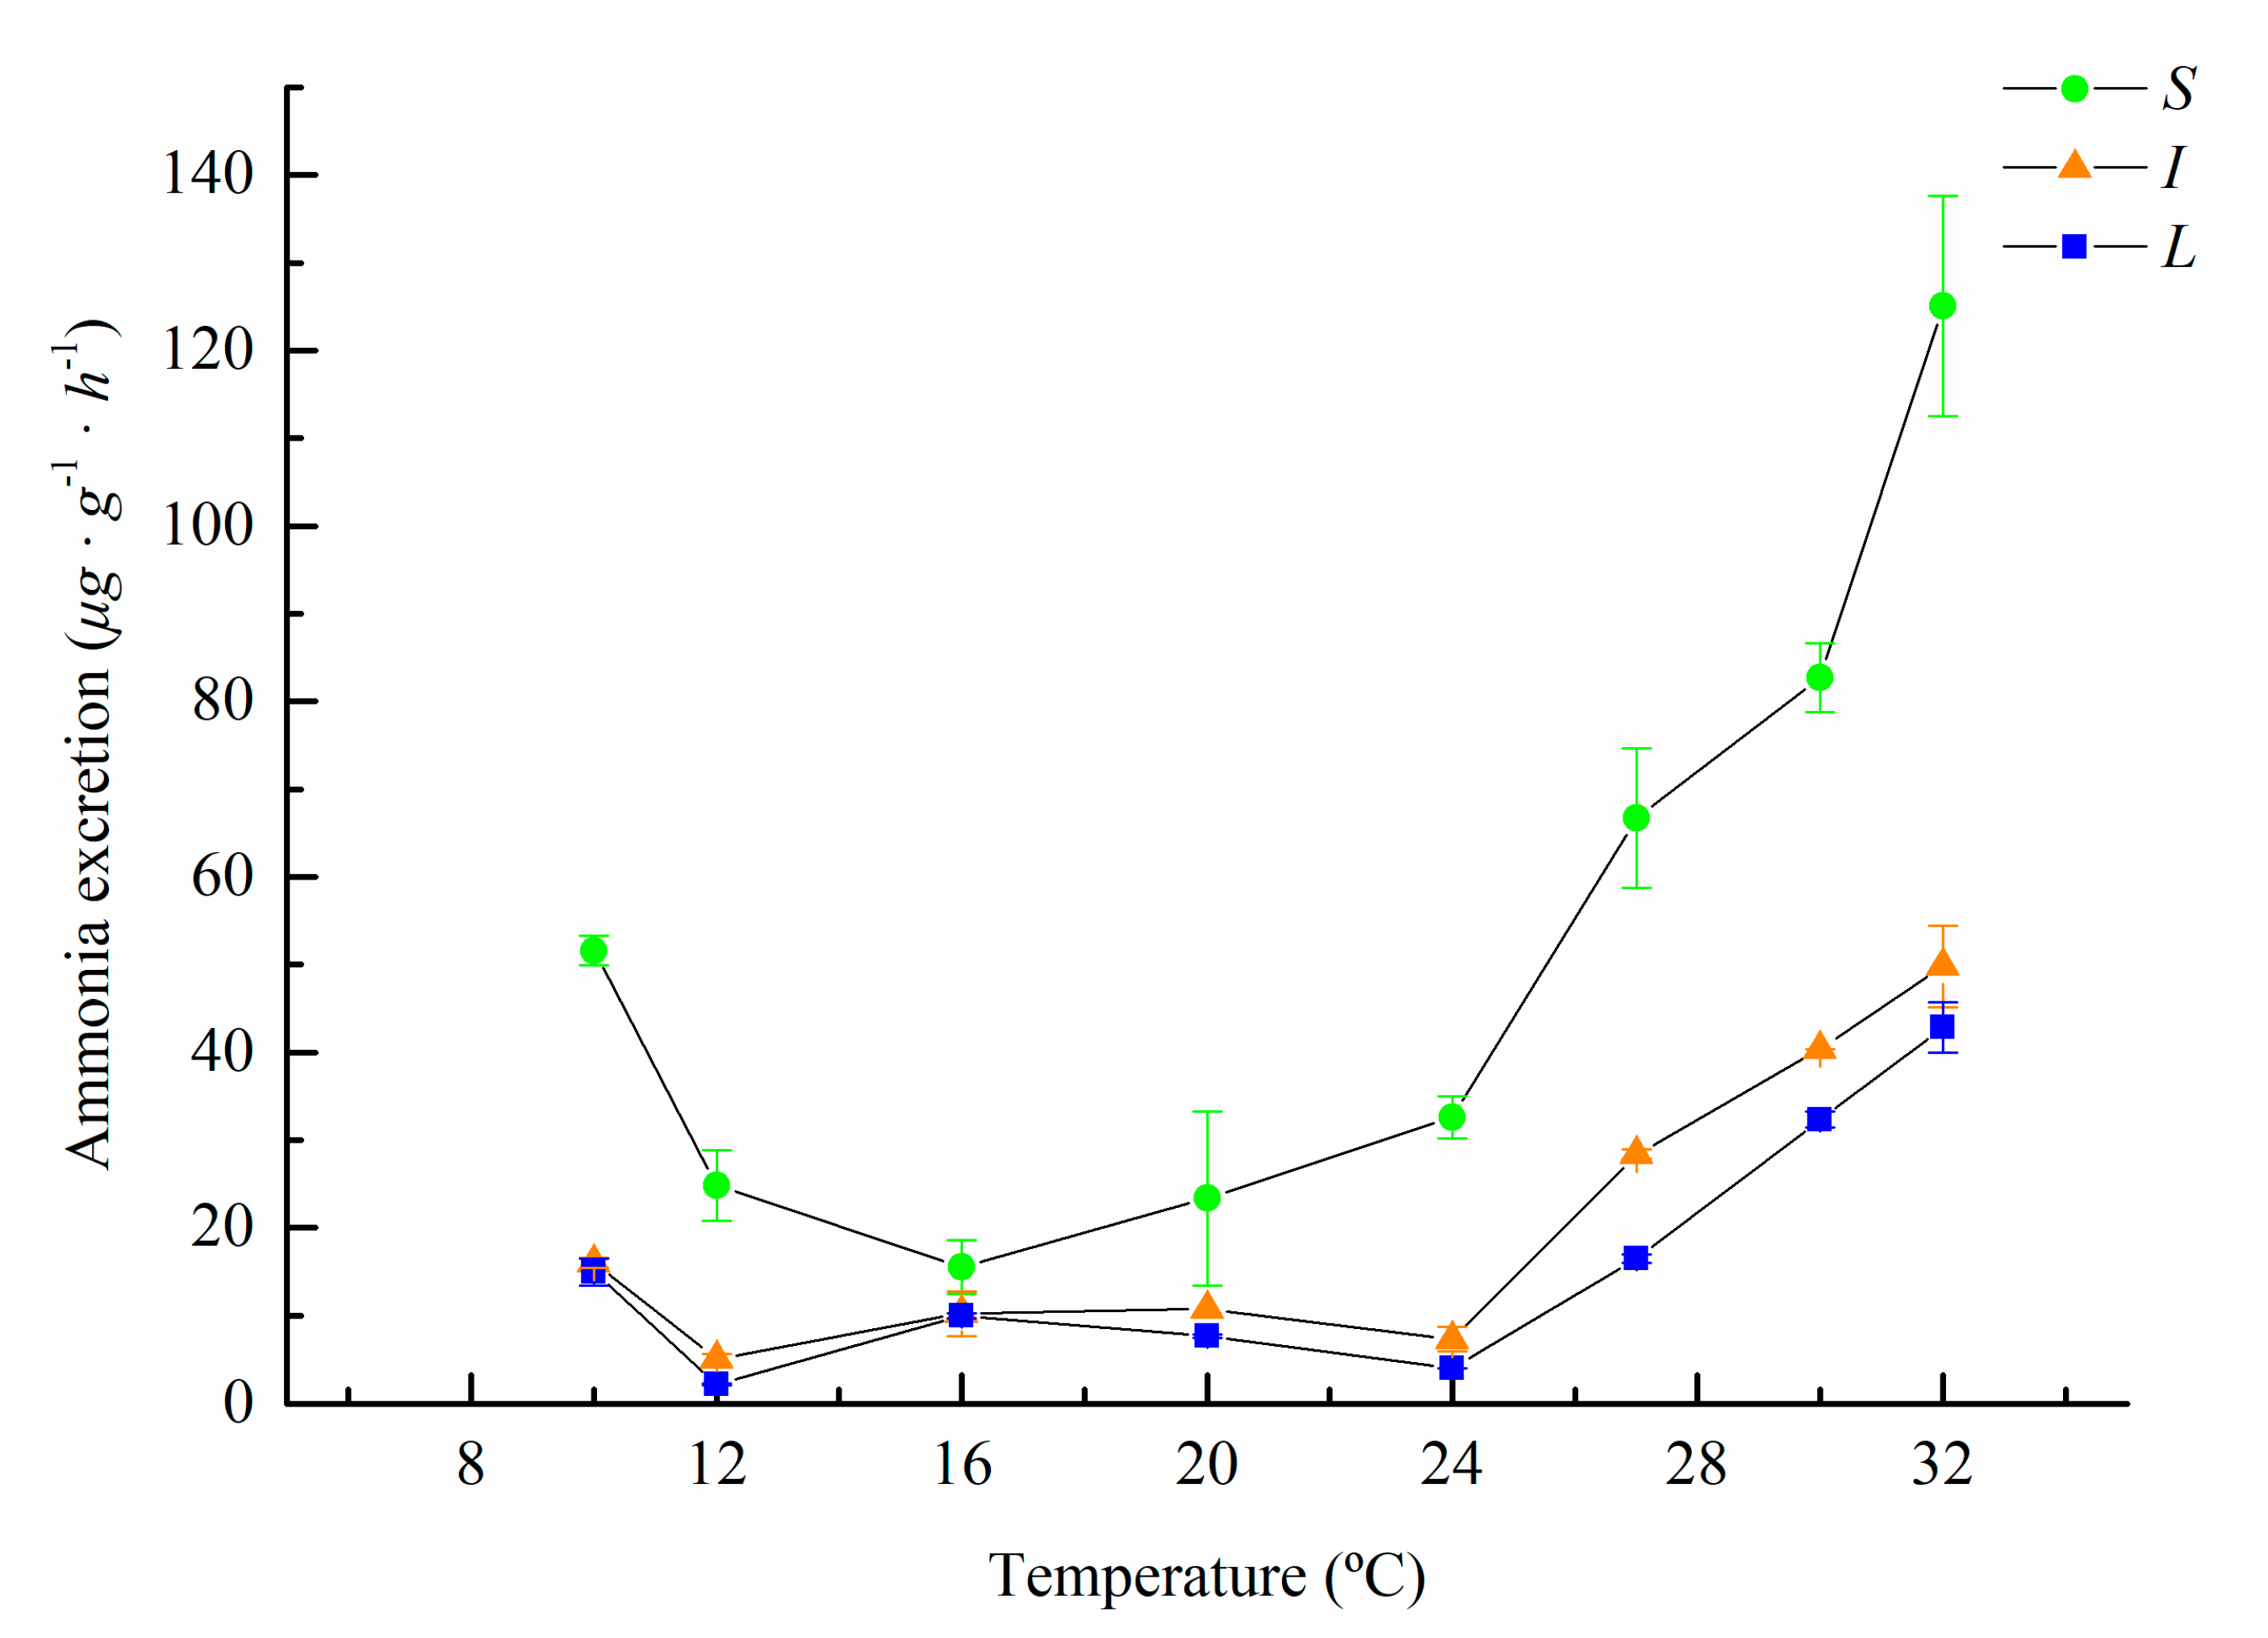
The ammonia excretion rates of M. sanguinea are shown in Figure 2. The ammonia excretion rate decreased at 10 to 12 °C and kept stable at 12 to 24 °C. The rate increased significantly with a further increase in temperature. The ammonia excretion rate of small individuals was higher than that of large individuals at the same temperature. The result of two-way ANOVA showed the extremely significant effect of temperature and body size on the ammonia excretion rate (p < 0.05). The relationship of ammonia excretion rate to body weight and temperature was obtained using the following formula:
U = −1.54 + 1.94Tc − 11.22W, (F = 17.75, p < 0.01)

3.2. Classical Q10 and O:N Ratio of M. sanguinea Metabolism

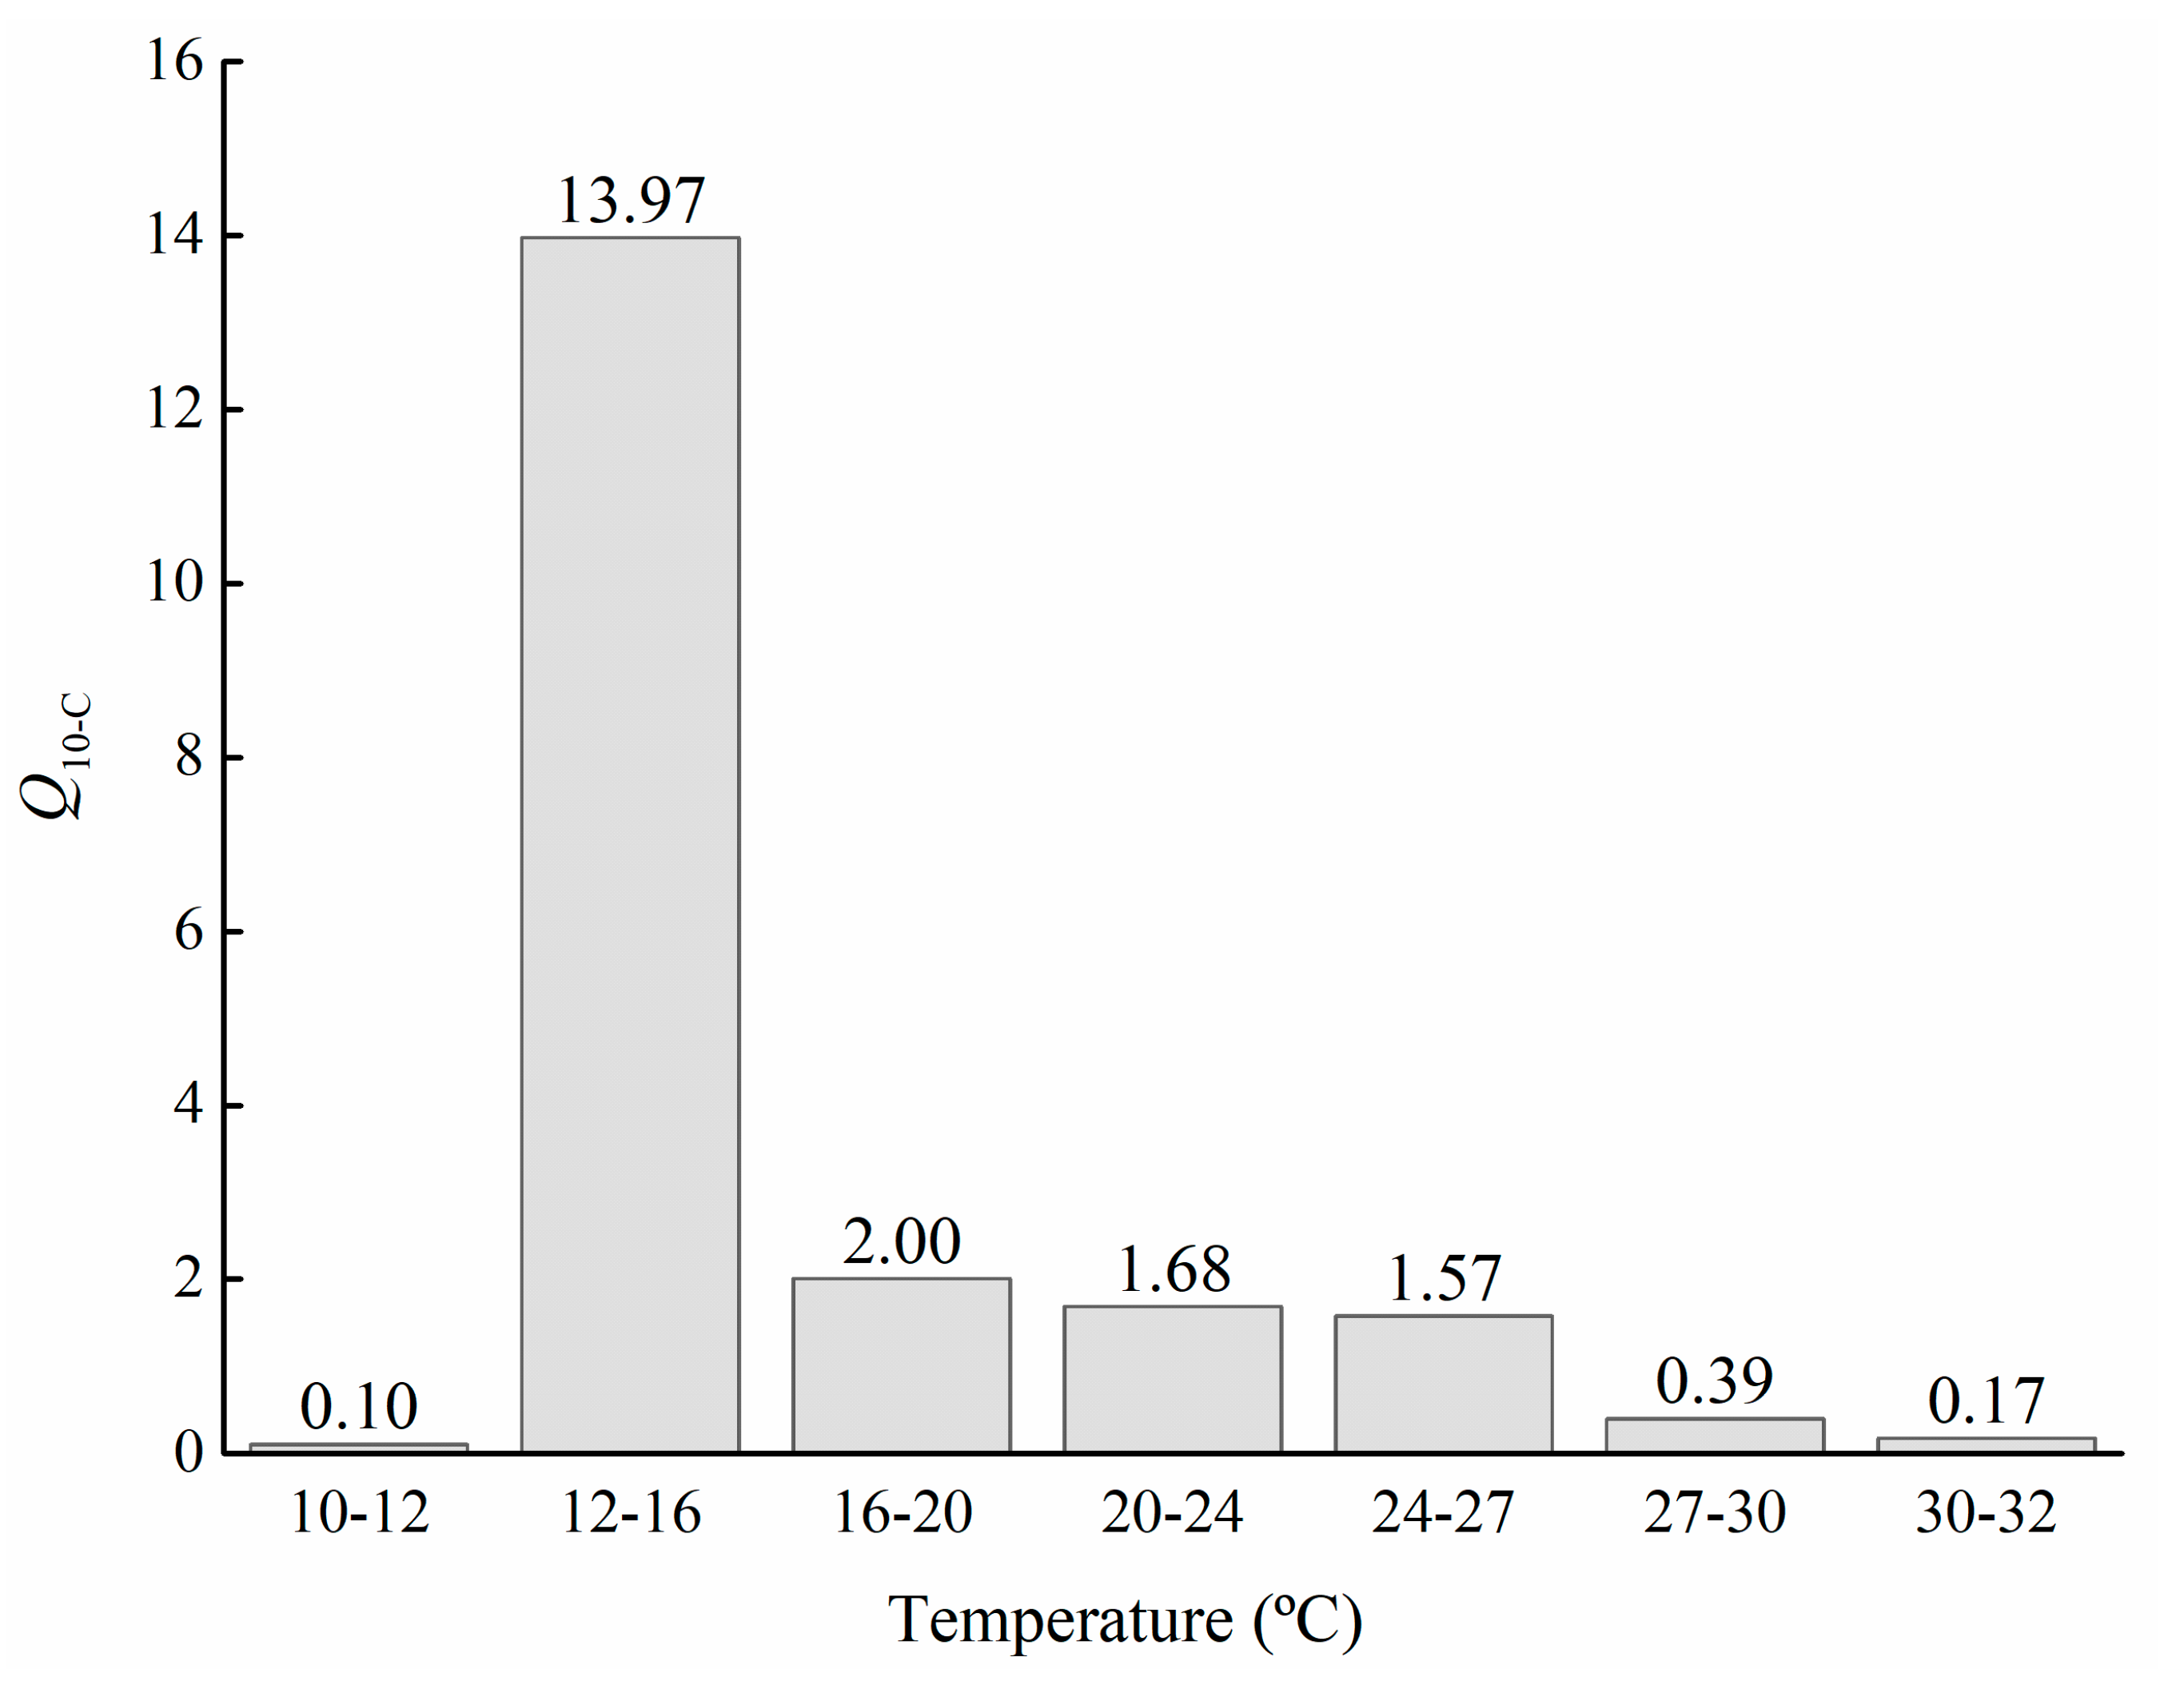
The classical Q10 (Q10_C) values are shown in Figure 3, and the lowest value of 0.10 was found at 10 to 12 °C. When the temperature was increased to 12 to 16 °C, the Q10 significantly increased to 13.97, indicating that the respiratory metabolism of M. sanguinea became strong at 12 to 16 °C following the increase in temperature. The Q10_C value was low at 16 to 27 °C, but its value remained higher than 1. The Q10_C value was less than 1 when the temperature was increased to 27–32 °C.
The O:N ratios of M. sanguinea with different body sizes at different temperatures are shown in Table 1. Each body weight group displayed the same trend of increasing first and then decreasing. The maximum O:N ratio was obtained at 24 °C, and its values were 35.43, 50.55, and 56.44 in the S, I, and L groups, respectively. Except 16, 30 and 32 °C, the O:N ratio in the L group was higher than those in the I and S groups, and the value was the lowest in the S group. The results showed that fat and carbohydrate are the main energy sources of M. sanguinea metabolism when the water temperature was 24 °C. Protein gradually becomes the main energy source following the increase in temperature to 32 °C [30,31].

3.3. Activation Energy, UTD Value, and Q10 of UTD of M. sanguinea at Different Temperatures

A previous paper on the optimal temperature of M. sanguinea in natural habitats and oxygen consumption rate was referenced in this experiment. E was calculated using data at 12 to 27 °C [15]. The relationships of oxygen consumption and ammonia excretion with different M values and body temperatures are shown in Table 2 and Table 3. The regression of lnR or lnU with lnM at different temperatures was significant (p < 0.05). Thus, the mean bR (±SE) or bU (±SE) values of bR = 0.56 ± 0.09 and bU = 0.35 ± 0.30 can be obtained.
The linear equation between T and lnR0 was presented as Equation (2) using bR obtained from the data in Table 2 through OLS method.
ln R 0 = 25.989 7941.516 · 1 T ,
The regression of 1/T with lnR0 at different temperatures was remarkable (p < 0.05). The slope of the 95% confidence intervals (CIs) for lnR0 was 7941.52 ± 6811.97 K.
The activation energy (E) of the oxygen consumption in 95% CIs was obtained using Equations (2) and (5), as follows:
ER = 0.68 ± 0.59Ev,
The relationship of a = lnR0 can be obtained from Equations (1) and (2). Thus, the combined effects of temperature and M on R can be represented by the following formula:
R (mg·h−1) = a·Mb = e25.99–7941.52/T·M0.56,
where the unit of M is g, and T is the absolute temperature. Equation (7) is valid at 12 to 27 °C (285.15–300.15 K).
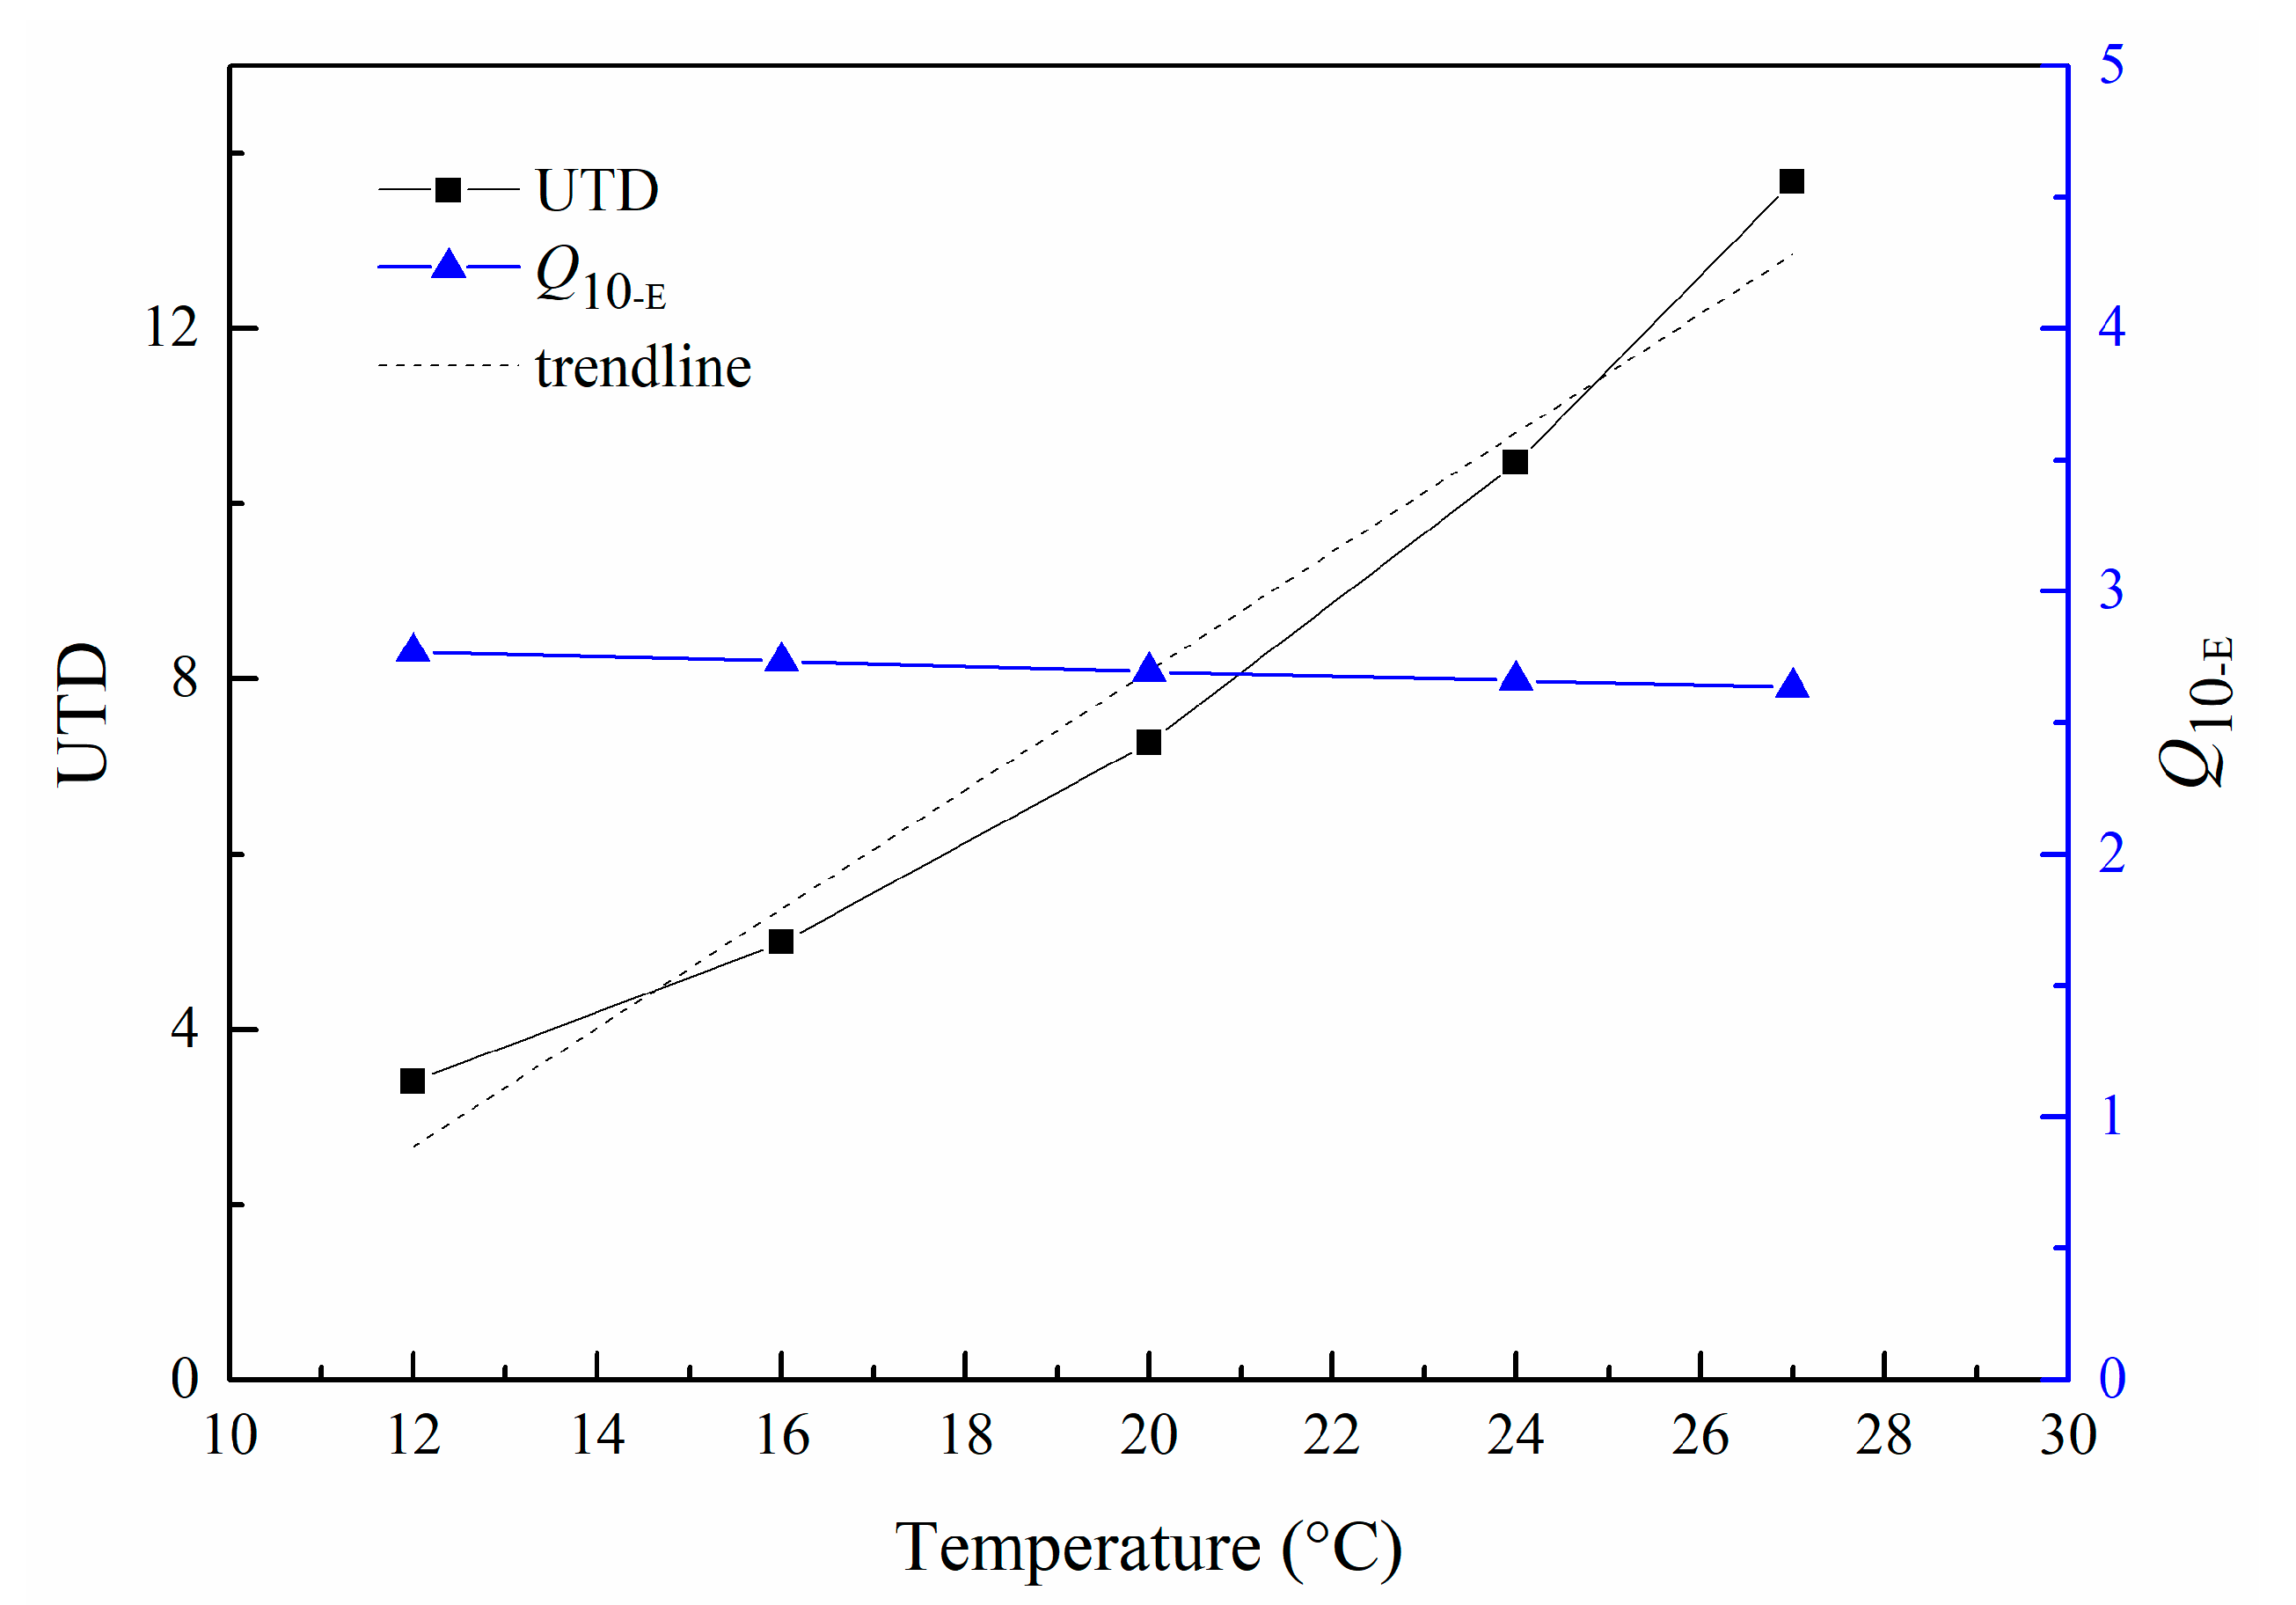
UTD and Q10_E were calculated by Equations (3) and (4), respectively. Figure 4 shows that the UTD value increased with temperature, and the trend was approximately a straight line at 12 to 27 °C. The Q10_E value did not change significantly with increasing temperature, thereby confirming that the activation energy was stable at different temperatures.

4. Discussion

The relationship between metabolic rate and body weight (M) has been a classical physiological issue. Kleiber (1932) found that the metabolic rate of the whole organism is a function of 3/4 power with M and increases exponentially with temperature [32]. The 3/4 power theory is based on the fractal-like design of exchange surfaces and distribution networks in plants [33] and animals [34]. However, this theory is not valid for all species [35]. For example, the theory that the b value of basal metabolism is <0.75 was proposed, and several scientists have statistically calculated the relationship between metabolism and body weight of many species; the b value is significantly different between different species at the same temperature [35,36,37]. A calculation of the data for 69 teleost fish species and obtained the b value of 0.79, which also confirmed that the theory of 0.75 is not completely applicable [38]. In the present study, the bR of M. sanguinea was 0.56. The bR value was less than the theoretical value of 0.75, consistent with the theory that the b value is <0.75 [37]. M. sanguinea that lives in the intertidal zone has a complex living environment that may be physiologically different from those of other species. The study of the relationship between metabolism and M will provide a scientific basis for other aspects of research on M. sanguinea and the metabolism of other polychaetes. Many b values of polychaetes have been studied and proposed in the literature. Shumway (1979) studied the relationship among 18 polychaete metabolic rates and M and obtained b values ranging from 0.41 to 0.79 [20]. The b values of Perinereis aibuhitensis and Neanthes japonica have also been proposed, and the results are similar to those of M. sanguinea [23,24]. Therefore, M. sanguinea has the same b value of <0.75 as those of other polychaetes.
Temperature directly affects the metabolic rate of organisms. In an appropriate temperature range, the oxygen consumption rate of aquatic invertebrates increased with increasing temperature. High temperatures can cause physiological dysfunction. For example, the concept of oxygen and capacity-limited thermal tolerance (OCLTT) explains that a gradual increase in temperature reaching the limit temperature of an organism affects the physiology of the organism [39], thereby decreasing the oxygen consumption rate [40,41]. In the present study, the oxygen consumption rate of M. sanguinea increased with increasing temperature from 10 to 27 °C, and the maximum value was reached at 27 °C. When the temperature was continuously increased to 32 °C, the oxygen consumption rate began to decrease and conformed to OCLTT theory. However, M. sanguinea survived at 32 °C. At 10 to 32 °C, M. sanguinea had strong adaptability to low and high temperatures. The inflection point of the oxygen consumption rate of M. sanguinea appeared at 27 °C. We also analyzed the temperature inflection points of other polychaetes and found the oxygen consumption rate inflection points of P. aibuhitensis [24] and N. japonica [23] at 27 °C. However, Ophelia bicornis has no inflection point at 5 to 35 °C [42]. This result may be due to differences among species or domestication time, and the experimental temperature did not exceed the tolerance temperature of the animals.
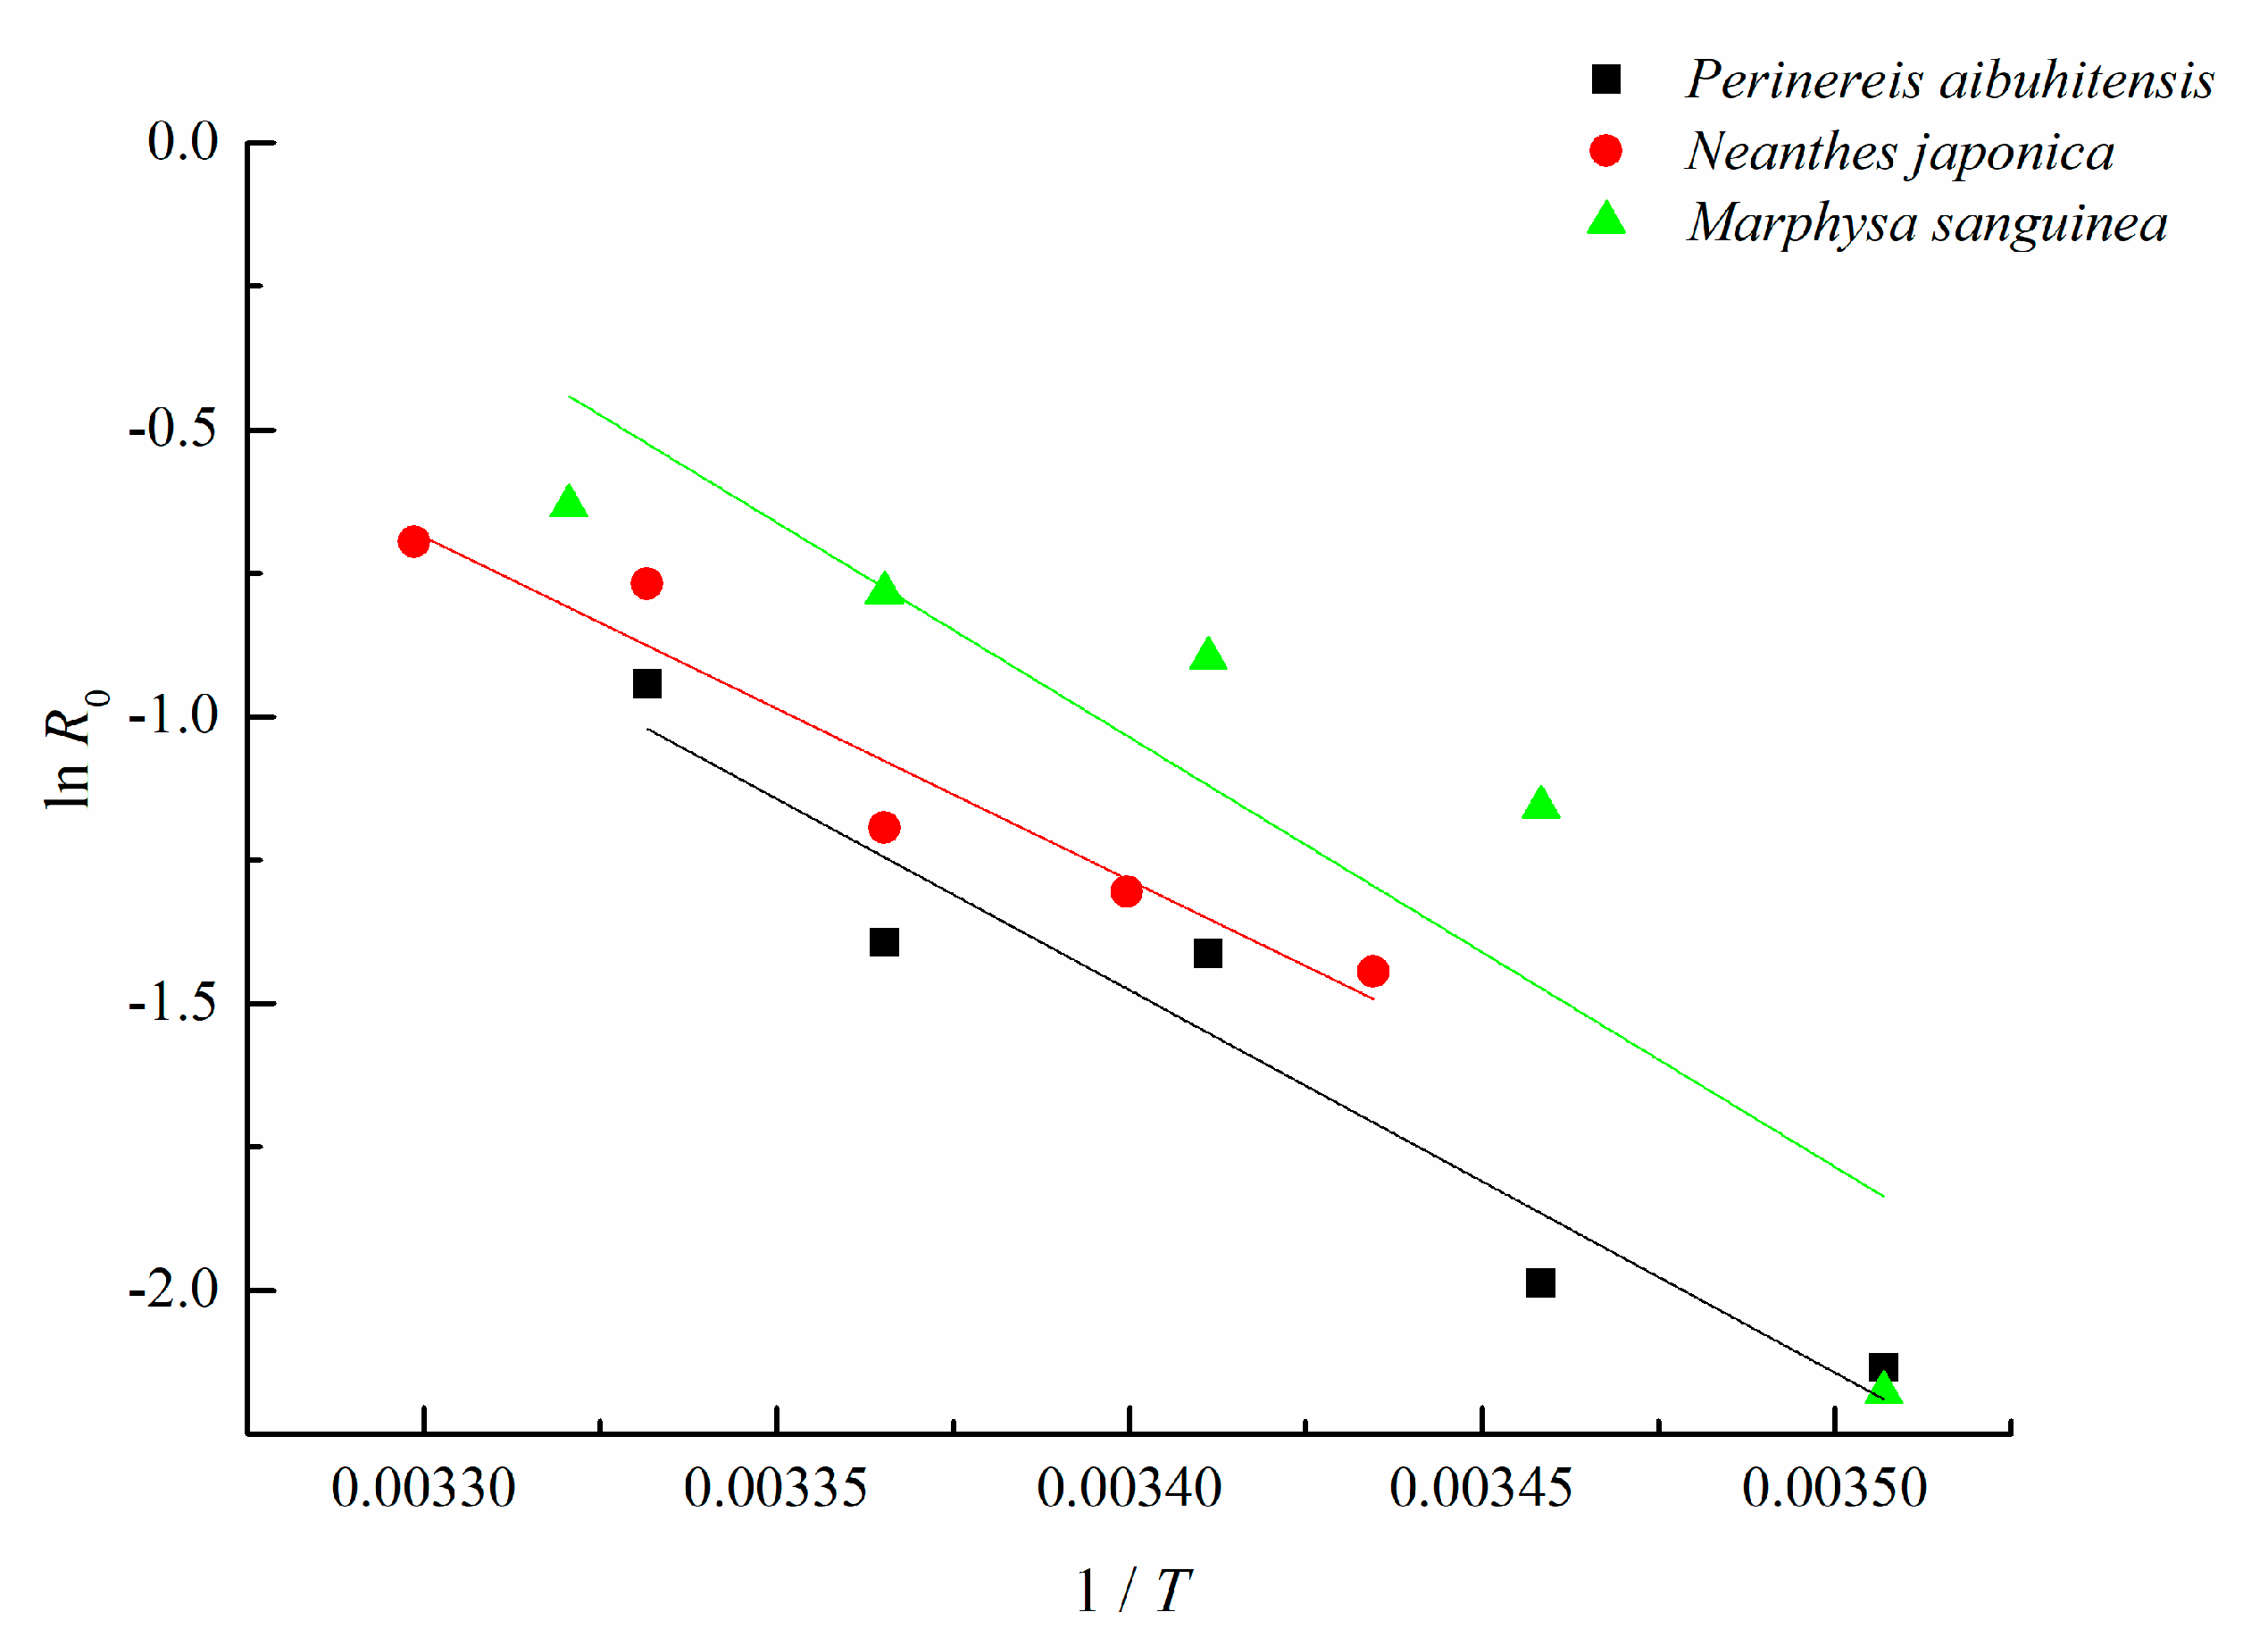
UTD theory was proposed to discuss the correlation between basal metabolic rate and temperature of M. sanguinea; the theory contains the term e-E/kT that reveals the relationship between metabolic rate and temperature, and E is the activation energy required for the metabolism of the organism [18]. Although UTD theory has met several challenges after its introduction [38,43,44,45], it remains accepted widely and has been used as a basis for the introduction of the metabolic theory in ecology. The activation energy is the core of UTD theory and reveals the relationship between metabolism and temperature. The E value ranged from 0.2 to 1.2 eV, with an average of approximately 0.65 eV, consistent with those of bacteria to vertebrate animals and shows the universal of cross species [18,45,46]. In the present study, the temperature was set to 10–32 °C for the measurement of the effect of temperature on metabolic rate. However, several points with good linearity were selected to calculate E. We selected the range of 12 to 27 °C to simulate the temperature that may occur in the life activities of M. sanguinea; this range is closer to the real temperature range of the living environment of this organism and had the best regression. The E of M. sanguinea was 0.68 eV, which is close to the mid-value of 0.2–1.2 eV. We also calculated E at 10 to 32 °C and found that the data points were poorly normalized and not convincing. The E values of the ammonia emission of M. sanguinea were also calculated in the same manner, and the value was 0.53 eV, which did not have good regression in the calculation (p > 0.05). Except for the UTD theory, dynamic energy budget (DEB) theory also was used widely in the relationship of temperature and metabolic rate [47]. The metabolism of Arenicola marina and Hediste diversicolor were calculated by the DEB methods [25,48]. The metabolic data of M. sanguinea could also be analyzed by the DEB theory and merging whole temperature scale of this experiment. However, different from these two species (A.marina and H.diversicolor) that live on the surface of sediment, M. sanguinea can dig tubes in sediment more than one meter deep, and they can adjust their living depth in sediment to adapt to the change of temperatures. Based on the initial adaptability of M. sanguinea to temperature, we chose the UTD methods and calculated the temperature to 27 °C. At this temperature, the oxygen consumption rate had an inflection point, indicating that M. sanguinea had a critical value in maintaining normal physiological function at this temperature and that the calculated E may be representative. We also calculated the metabolic E values of the polychaetes N. japonica and P. aibuhitensis from the data of published papers [23,24]. The temperature dependence relationship of metabolism can also be obtained after mass normalization. The b values of M with metabolic rate in P. aibuhitensis and N. japonica were 0.54 ± 0.04 and 0.65 ± 0.06, respectively. The E values of P. aibuhitensis and N. japonica were 0.57 ± 0.29 and 0.52 ± 0.25 eV, respectively (Figure 5). According to the recent study of Kraemer in 2017, the E value for benthic ecosystem respiration was approximately 0.55 eV, which is lower than that for pelagic ecosystem respiration in lake ecosystems [49]. Thus, the E values of P. aibuhitensis and N. japonica are close to the general values of benthic animals. M. sanguinea has higher E than P. aibuhitensis and N. japonica, indicating that sensitivity improves with increasing temperature.
The Q10 value was calculated by classical metabolic rate and activation energy (E) and reflected the different levels to understand the relationship between temperature and metabolism. The classical Q10_C revealed the change in metabolic rate following the fluctuation of temperature directly [50,51]. The scale of the classical Q10_C value of M. sanguinea is within 0.10–13.97, indicating the sensitive and intuitive change in metabolism following the change in temperature and showed that temperature rules the metabolic rate. However, the Q10_E calculated using E value showed a stable and not significant change under the experimental temperature scale. The core mechanism of such a stable Q10_E is the activation energy; for a specific organism, the energy required to catalyze an enzymatic reaction is approximately constant in the suitable temperature range of the species. This type of trend can be observed in other aquatic species, such as octopus [52], marine turtles [53], and semi-terrestrial crab [54]. Thus, application of the two different methods can better elucidate the phenomenon and mechanism through which temperature affects animals metabolism.

5. Conclusions

As an intertidal living polychaete, M. sanguinea showed a strong temperature and metabolic adaptation ability. Oxygen consumption and ammonia excretion had similar trends in M. sanguinea with different body sizes and following the increase in temperature. Small individuals showed more active metabolic capacity. The O:N ratio revealed the energy utilization strategy of the species at different temperatures. The activation energy levels for oxygen consumption and ammonia excretion were 0.68 and 0.53 eV, respectively. The Q10 of classic and UTD methods could reveal the phenomenon and essence in which biological metabolism with different temperature was better. Given that polychaetes dig in sediment [55], the relationship between metabolism and temperature is difficult to determine. If activation energy can be obtained in more polychaete species in the future, then the general activity energy of polychaetes can be calculated. Hence, we can predict the metabolism rate of polychaetes at different temperatures. The prediction not only can be used in the polychaete aquaculture but can also provide a method to understand the effect of climate change on marine zoobenthos [56,57].

Author Contributions

Biological samples collection and experimental analyses, C.W. and X.L.; writing preparation, C.W. and N.K.; writing—review, editing and supervision, D.Y. All authors have read and agreed to the published version of the manuscript.

Funding

This research was funded by National Key R&D program of China, grant number “2019YFC1407704”, and Dalian Science Fund for Distinguished Young Scholars, grant number “2016RJ06” and the project of Xingliao talent plan of Liaoning Province, grant number “XLYC1805009”.

Institutional Review Board Statement

The study was conducted according to the guidelines of the Declaration of Helsinki, and approved by the Ethic Committee of College of Fisheries and Life science, Dalian Ocean University (protocol code, 20200521002 and date of 21 May 2020).

Data Availability Statement

All the data are available from the first author, and can be delivered if required.

Acknowledgments

We thank the anonymous reviewers whose comments/suggestions helped improve and clarify this manuscript.

Conflicts of Interest

The authors declare no conflict of interest.

References

  1. Jang, M.; Shim, W.J.; Han, G.M.; Song, Y.K.; Hong, S.H. Formation of microplastics by polychaetes (Marphysa sanguinea) inhabiting expanded polystyrene marine debris. Mar. Pollut. Bull. 2018, 131, 365–369. [Google Scholar] [CrossRef]
  2. Nel, H.; Froneman, P. Presence of microplastics in the tube structure of the reef-building polychaete Gunnarea gaimardi (Quatrefages 1848). Afr. J. Mar. Sci. 2018, 40, 87–89. [Google Scholar] [CrossRef]
  3. Mdaini, Z.; Tremblay, R.; Pharand, P.; Gagné, J.-P. Spatio-temporal variability of biomarker responses and lipid composition of Marphysa sanguinea, Montagu (1813) in the anthropic impacted lagoon of Tunis. Mar. Pollut. Bull. 2019, 144, 275–286. [Google Scholar] [CrossRef]
  4. Fries, E.; Dekiff, J.H.; Willmeyer, J.; Nuelle, M.-T.; Ebert, M.; Remy, D. Identification of polymer types and additives in marine microplastic particles using pyrolysis-GC/MS and scanning electron microscopy. Environ. Sci. Process. Impacts 2013, 15, 1949–1956. [Google Scholar] [CrossRef] [Green Version]
  5. Olive, P.W. Polychaeta as a world resource: A review of patterns of exploitation as sea angling baits and the potential for aquaculture based production. Mémoires Muséum National D’histoire Naturelle 1994, 162, 603–610. [Google Scholar]
  6. Garcês, J.; Pereira, J. Effect of salinity on survival and growth of Marphysa sanguinea Montagu (1813) juveniles. Aquac. Int. 2011, 19, 523–530. [Google Scholar] [CrossRef]
  7. Pombo, A.; Baptista, T.; Granada, L.; Ferreira, S.M.; Gonçalves, S.C.; Anjos, C.; Sá, E.; Chainho, P.; da Fonseca, L.C.; e Costa, P.F. Insight into aquaculture’s potential of marine annelid worms and ecological concerns: A review. Rev. Aquac. 2020, 12, 107–121. [Google Scholar] [CrossRef]
  8. Park, Y.R.; Park, C.-I.; Soh, Y. Antioxidant and Anti-Inflammatory Effects of NCW Peptide from Clam Worm (Marphysa sanguinea). J. Microbiol. Biotechnol. 2020, 30, 1387–1394. [Google Scholar] [CrossRef]
  9. Yeon, S.J.; Shim, K.H.; Hong, J.S.; Shin, H.S. Identification of a new serine protease from polychaeta, Marphysa sanguinea, for its thrombolytic and anticoagulant activity. Korean J. Chem. Eng. 2017, 34, 781–786. [Google Scholar] [CrossRef]
  10. Wang, Z.; Zhang, Y.; Qiu, J.-W. A new species in the Marphysa sanguinea complex (Annelida, Eunicidae) from Hong Kong. Zool. Stud. 2018, 57, e48. [Google Scholar]
  11. Molina-Acevedo, I.C.; Carrera-Parra, L.F. Reinstatement of three species of the Marphysa sanguinea complex (Polychaeta: Eunicidae) from the Grand Caribbean Region. Zootaxa 2015, 3925, 37–55. [Google Scholar] [CrossRef]
  12. Lavesque, N.; Daffe, G.; Bonifácio, P.; Hutchings, P. A new species of the Marphysa sanguinea complex from French waters (Bay of Biscay, NE Atlantic) (Annelida, Eunicidae). ZooKeys 2017, 761, 1. [Google Scholar] [CrossRef]
  13. Prevedelli, D.; N’Siala, G.M.; Ansaloni, I.; Simonini, R. Life cycle of Marphysa sanguinea (Polychaeta: Eunicidae) in the Venice lagoon (Italy). Mar. Ecol. 2007, 28, 384–393. [Google Scholar] [CrossRef]
  14. Elbarhoumi, M.; Scaps, P.; Djediat, C.; Zghal, F. Ultrastructural study of oogenesis in Marphysa sanguinea (Annelida: Polychaeta: Eunicida) from the Lagoon of Tunis. Sci. Mar. 2014, 78, 99–113. [Google Scholar]
  15. Yang, D.; Chen, F.; Zhou, Y.; Xiu, Z. Diel variation in metabolism and ammonia excretion of Marphysa sanguinea (Polychaeta: Eunicidae). Chin. J. Oceanol. Limnol. 2016, 34, 1209–1217. [Google Scholar] [CrossRef]
  16. Yang, D.; Zhou, Y.; Chen, A.; Cao, X.; Liu, Y. The artificial breeding in Marphysa sanguinea (MONTAGU) in a laboratory. Fish. Sci. 2011, 30, 572–574. [Google Scholar]
  17. Kim, K.H.; Kim, B.K.; Kim, S.K.; Phoo, W.W.; Maran, B.V.; Kim, C.-H. Appropriate feeding for early juvenile stages of eunicid polychaete Marphysa sanguinea. Fish. Aquat. Sci. 2017, 20, 1–9. [Google Scholar] [CrossRef] [Green Version]
  18. Gillooly, J.F.; Brown, J.H.; West, G.B.; Savage, V.M.; Charnov, E.L. Effects of size and temperature on metabolic rate. Science 2001, 293, 2248–2251. [Google Scholar] [CrossRef] [PubMed] [Green Version]
  19. Brown, J.H.; Gillooly, J.F.; Allen, A.P.; Savage, V.M.; West, G.B. Toward a metabolic theory of ecology. Ecology 2004, 85, 1771–1789. [Google Scholar] [CrossRef]
  20. Shumway, S.E. The effects of body size, oxygen tension and mode of life on the oxygen uptake rates of polychaetes. Comp. Biochem. Physiol. Part A Physiol. 1979, 64, 273–278. [Google Scholar] [CrossRef]
  21. Cammen, L.M. Ingestion rate: An empirical model for aquatic deposit feeders and detritivores. Oecologia 1979, 44, 303–310. [Google Scholar] [CrossRef] [PubMed]
  22. Nielsen, A.M.; Eriksen, N.T.; Iversen, J.L.; Riisgård, H.U. Feeding, growth and respiration in the polychaetes Nereis diversicolor (facultative filter-feeder) and N. virens (omnivorous)-a comparative study. Mar. Ecol. Prog. Ser. 1995, 125, 149–158. [Google Scholar] [CrossRef] [Green Version]
  23. Liu, Y.; Xian, W.; Sun, S. Metabolism of polychaete Neanthes japonica Izuka: Relations to temperature, salinity and body weight. Chin. J. Oceanol. Limnol. 2009, 27, 356–364. [Google Scholar] [CrossRef]
  24. Wang, L.; Chen, A.; Zhao, X.; Wang, L.; Zhang, J.; Zhou, Y. Effect of temperature and body weight on respiration and excretion in Perinereis aibuhitensis Grube. J. Dalian Fish. Univ. 2004, 19, 176–181. (In Chinese) [Google Scholar]
  25. Galasso, H.L.; Richard, M.; Lefebvre, S.; Aliaume, C.; Callier, M.D. Body size and temperature effects on standard metabolic rate for determining metabolic scope for activity of the polychaete Hediste (Nereis) diversicolor. PeerJ 2018, 6, e5675. [Google Scholar] [CrossRef] [PubMed] [Green Version]
  26. De Cubber, L.; Lefebvre, S.; Lancelot, T.; Denis, L.; Gaudron, S.M. Annelid polychaetes experience metabolic acceleration as other Lophotrochozoans: Inferences on the life cycle of Arenicola marina with a Dynamic Energy Budget model. Ecol. Model. 2019, 411, 108773. [Google Scholar] [CrossRef]
  27. Montgomery, H.; Thom, N.; Cockburn, A. Determination of dissolved oxygen by the Winkler method and the solubility of oxygen in pure water and sea water. J. Appl. Chem. 1964, 14, 280–296. [Google Scholar] [CrossRef]
  28. Friedman, A.H.; Morgulis, S. The oxidation of amino acids with sodium hypobromite. J. Am. Chem. Soc. 1936, 58, 909–913. [Google Scholar] [CrossRef]
  29. Snow, N.; Williams, P.L. A simple method to determine the O: N ratio of small marine animals. J. Mar. Biol. Assoc. U. K. 1971, 51, 105–109. [Google Scholar] [CrossRef]
  30. Conover, R.; Mayzaud, P. Respiration and nitrogen excretion of neritic zooplankton in relation to potential food supply. In Proceedings of the 10th European Symposium on Marine Biology, Ostend, Belgium, 17–23 September 1975. [Google Scholar]
  31. Ikeda, T. Nutritional ecology of marine zooplankton. Mem. Fac. Fish. Hokkaido Univ. 1974, 22, 1–97. [Google Scholar]
  32. Kleiber, M. Body size and metabolic rate. Physiol. Rev. 1947, 27, 511–541. [Google Scholar] [CrossRef]
  33. Enquist, B.J.; Brown, J.H.; West, G.B. Allometric scaling of plant energetics and population density. Nature 1998, 395, 163–165. [Google Scholar] [CrossRef]
  34. West, G.B.; Brown, J.H.; Enquist, B.J. A general model for the origin of allometric scaling laws in biology. Science 1997, 276, 122–126. [Google Scholar] [CrossRef]
  35. White, C.R.; Seymour, R.S. Mammalian basal metabolic rate is proportional to body mass2/3. Proc. Natl. Acad. Sci. USA 2003, 100, 4046–4049. [Google Scholar] [CrossRef] [Green Version]
  36. McKechnie, A.E.; Wolf, B.O. The allometry of avian basal metabolic rate: Good predictions need good data. Physiol. Biochem. Zool. 2004, 77, 502–521. [Google Scholar] [CrossRef] [Green Version]
  37. White, C.R.; Phillips, N.F.; Seymour, R.S. The scaling and temperature dependence of vertebrate metabolism. Biol. Lett. 2006, 2, 125–127. [Google Scholar] [CrossRef] [Green Version]
  38. Clarke, A.; Fraser, K. Why does metabolism scale with temperature? Funct. Ecol. 2004, 18, 243–251. [Google Scholar] [CrossRef] [Green Version]
  39. Pörtner, H.O.; Knust, R. Climate change affects marine fishes through the oxygen limitation of thermal tolerance. Science 2007, 315, 95–97. [Google Scholar] [CrossRef] [Green Version]
  40. Lasserre, P. Metabolic activities of benthic microfauna and meiofauna. In The Benthic Boundary Layer; Springer: Berlin/Heidelberg, Germany, 1976; pp. 95–142. [Google Scholar]
  41. Ott, J.; Schiemer, F. Respiration and anaerobiosis of free living nematodes from marine and limnic sediments. Neth. J. Sea Res. 1973, 7, 233–243. [Google Scholar] [CrossRef]
  42. Beis, I.; Manousis, A.; Barrett, J. Studies on the respiration of the polychaete Ophelia bicornis. Comp. Biochem. Physiol. Part A Physiol. 1980, 67, 303–305. [Google Scholar] [CrossRef]
  43. Clarke, A. Is there a universal temperature dependence of metabolism? Funct. Ecol. 2004, 18, 252–256. [Google Scholar] [CrossRef] [Green Version]
  44. Brauer, V.S.; De Jonge, V.N.; Buma, A.G.; Weissing, F.J. Does universal temperature dependence apply to communities? An experimental test using natural marine plankton assemblages. Oikos 2009, 118, 1102–1108. [Google Scholar] [CrossRef]
  45. Gillooly, J.; Allen, A.; Savage, V.; Charnov, E.; West, G.; Brown, J. Response to Clarke and Fraser: Effects of temperature on metabolic rate. Funct. Ecol. 2006, 20, 400–404. [Google Scholar] [CrossRef]
  46. Dell, A.I.; Pawar, S.; Savage, V.M. Systematic variation in the temperature dependence of physiological and ecological traits. Proc. Natl. Acad. Sci. USA 2011, 108, 10591–10596. [Google Scholar] [CrossRef] [Green Version]
  47. Kooijman, B.; Kooijman, S. Dynamic Energy Budget Theory for Metabolic Organization; Cambridge University Press: Cambridge, UK, 2010. [Google Scholar]
  48. De Cubber, L.; Lefebvre, S.; Lancelot, T.; Duong, G.; Gaudron, S.M. Investigating down-shore migration effects on individual growth and reproduction of the ecosystem engineer Arenicola marina. J. Mar. Syst. 2020, 211, 103420. [Google Scholar] [CrossRef]
  49. Kraemer, B.M.; Chandra, S.; Dell, A.I.; Dix, M.; Kuusisto, E.; Livingstone, D.M.; Schladow, S.G.; Silow, E.; Sitoki, L.M.; Tamatamah, R. Global patterns in lake ecosystem responses to warming based on the temperature dependence of metabolism. Glob. Chang. Biol. 2017, 23, 1881–1890. [Google Scholar] [CrossRef]
  50. Clarke, A.; Johnston, N.M. Scaling of metabolic rate with body mass and temperature in teleost fish. J. Anim. Ecol. 1999, 68, 893–905. [Google Scholar] [CrossRef]
  51. Hansen, P.J.; Bjørnsen, P.K.; Hansen, B.W. Zooplankton grazing and growth: Scaling within the 2-2,-μm body size range. Limnol. Oceanogr. 1997, 42, 687–704. [Google Scholar] [CrossRef]
  52. Katsanevakis, S.; Stephanopoulou, S.; Miliou, H.; Moraitou-Apostolopoulou, M.; Verriopoulos, G. Oxygen consumption and ammonia excretion of Octopus vulgaris (Cephalopoda) in relation to body mass and temperature. Mar. Biol. 2005, 146, 725–732. [Google Scholar] [CrossRef]
  53. Weber, S.B.; Blount, J.D.; Godley, B.J.; Witt, M.J.; Broderick, A.C. Rate of egg maturation in marine turtles exhibits ‘universal temperature dependence’. J. Anim. Ecol. 2011, 80, 1034–1041. [Google Scholar] [CrossRef] [Green Version]
  54. Katsanevakis, S.; Xanthopoulos, J.; Protopapas, N.; Verriopoulos, G. Oxygen consumption of the semi-terrestrial crab Pachygrapsus marmoratus in relation to body mass and temperature: An information theory approach. Mar. Biol. 2007, 151, 343–352. [Google Scholar] [CrossRef]
  55. Qian, P.-Y. Larval settlement of polychaetes. Reproductive strategies and developmental patterns in annelids. In Developments in Hydrobiology; Springer: Berlin/Heidelberg, Germany, 1999; pp. 239–253. [Google Scholar]
  56. Iles, A.C. Toward predicting community-level effects of climate: Relative temperature scaling of metabolic and ingestion rates. Ecology 2014, 95, 2657–2668. [Google Scholar] [CrossRef]
  57. Deutsch, C.; Ferrel, A.; Seibel, B.; Pörtner, H.-O.; Huey, R.B. Climate change tightens a metabolic constraint on marine habitats. Science 2015, 348, 1132–1135. [Google Scholar] [CrossRef] [PubMed] [Green Version]
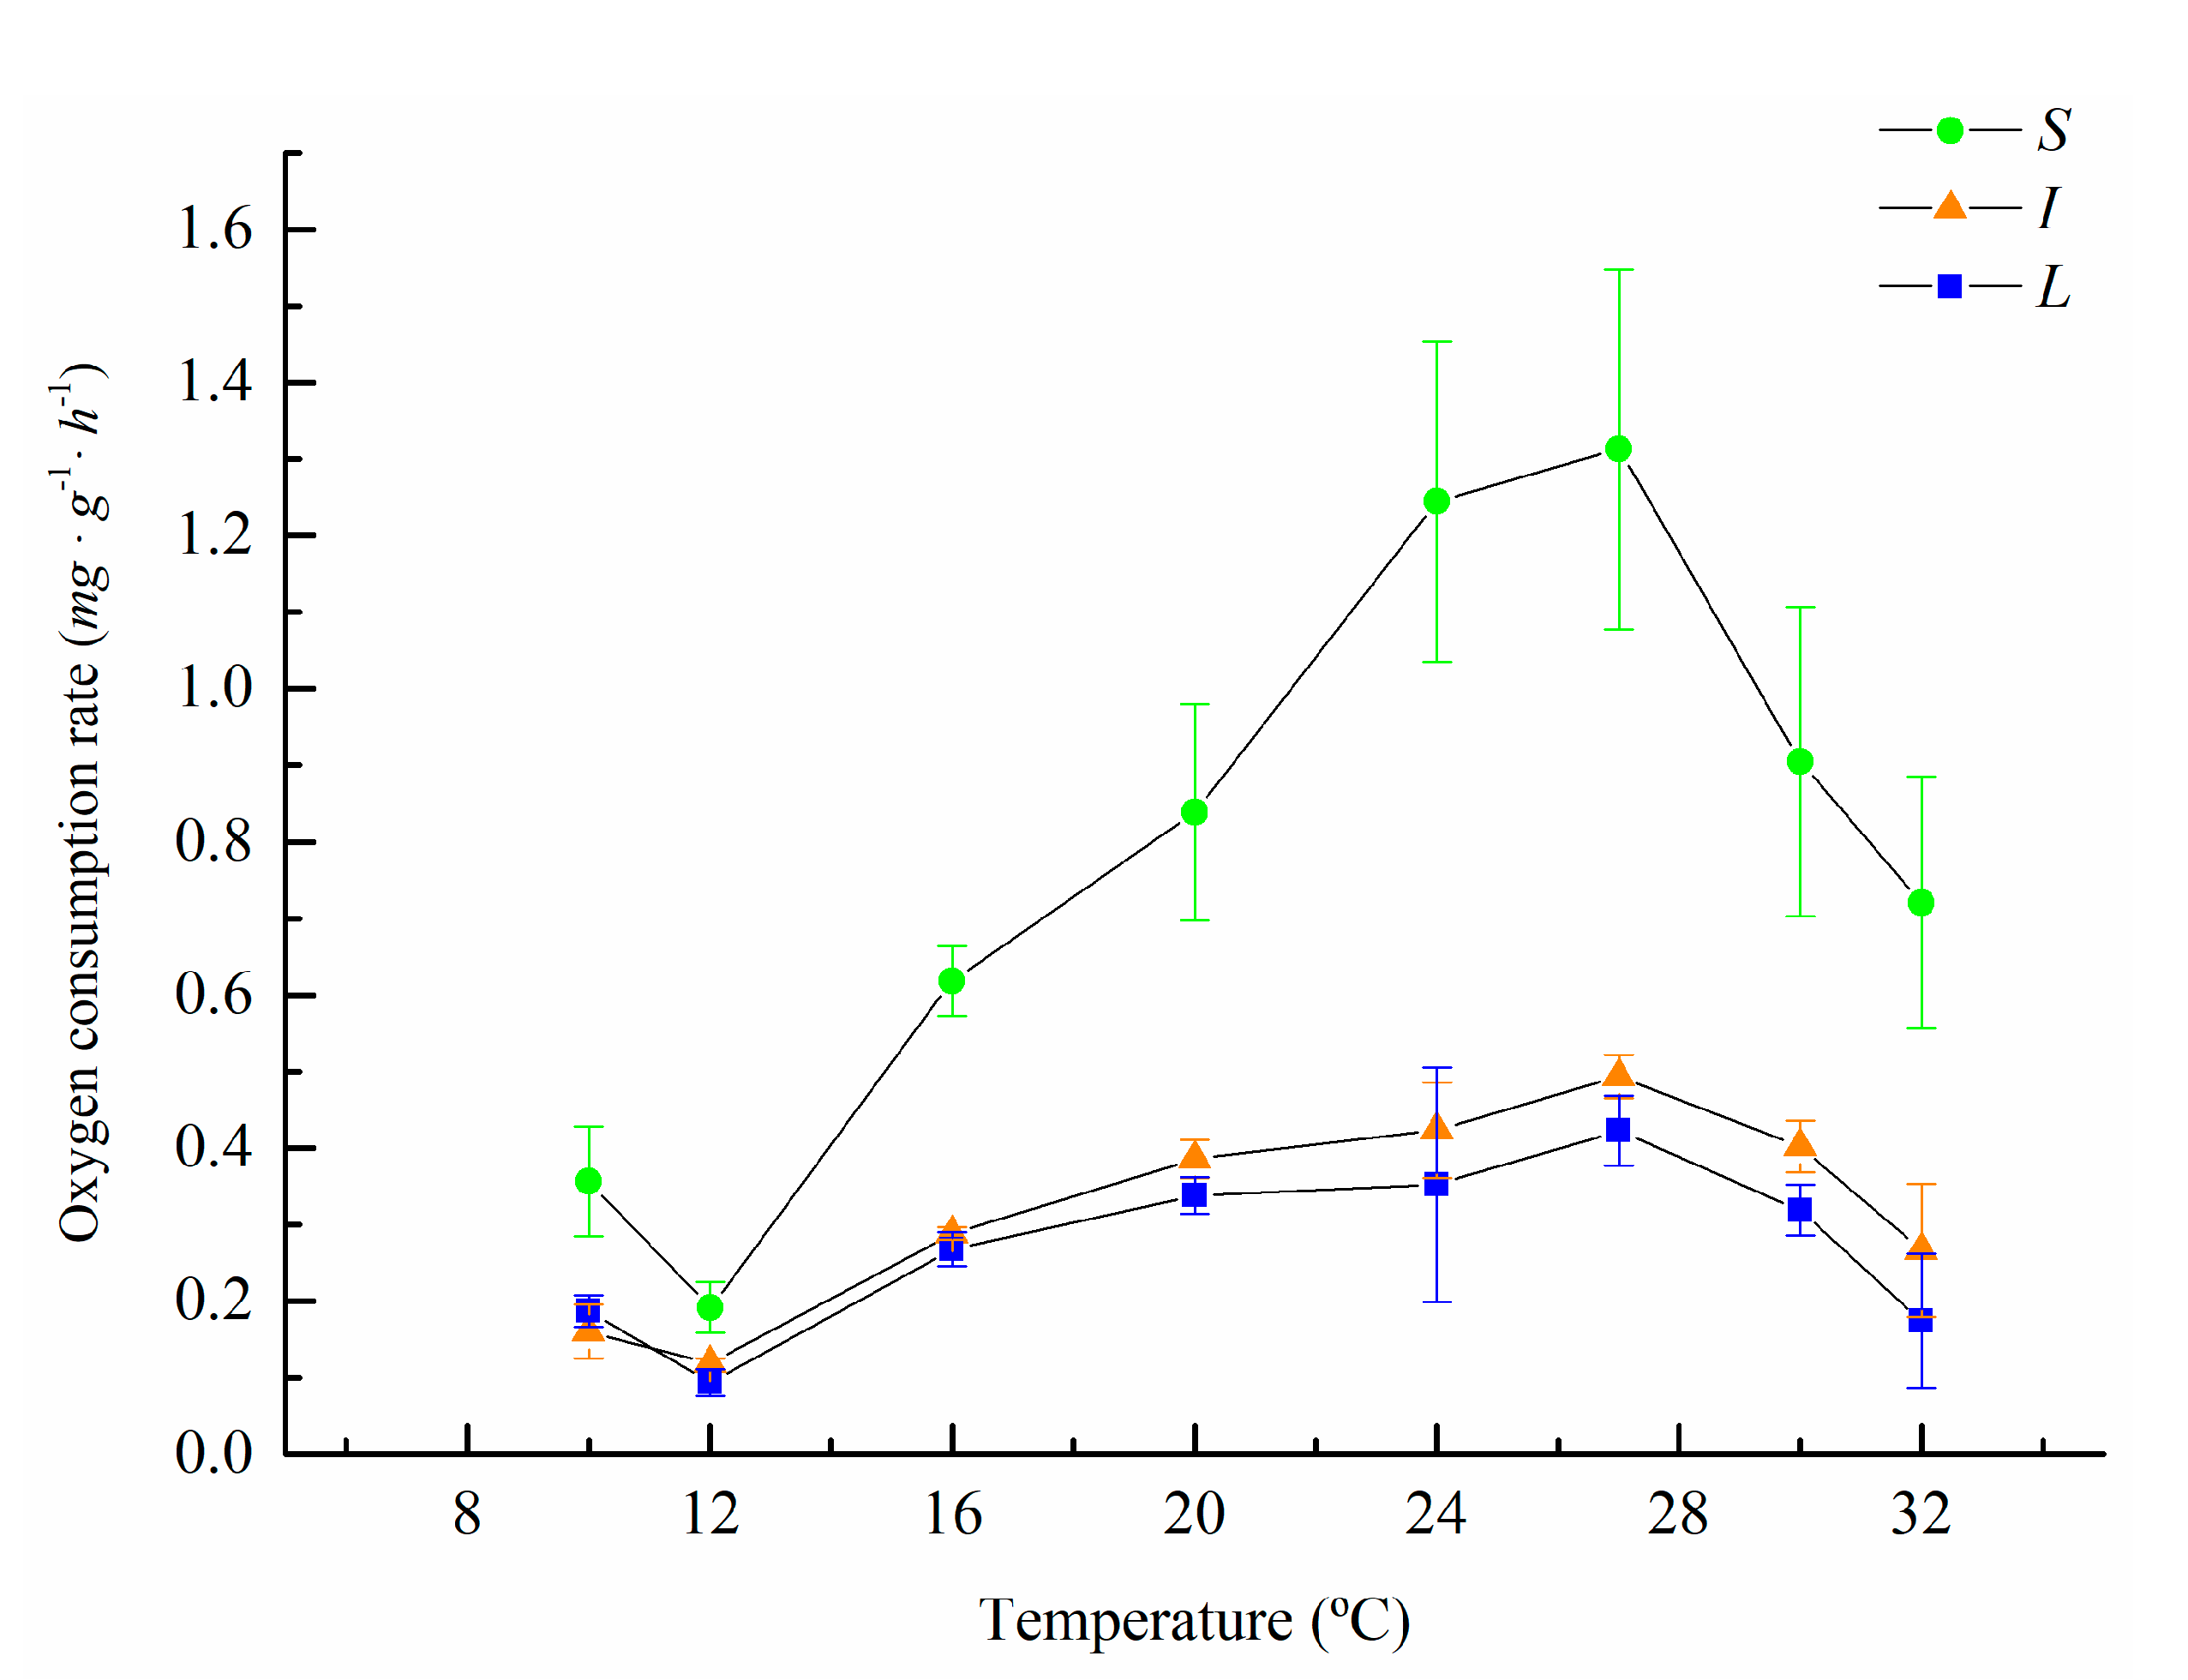
Figure 1. Oxygen consumption rate of Marphysa sanguinea with different body sizes at different temperatures.
Fishes 06 00052 g001
Figure 2. Ammonia excretion rate of Marphysa sanguinea with different body sizes at different temperatures.
Fishes 06 00052 g002
Figure 3. Classical Q10_C changes in Marphysa sanguinea at different temperatures.
Fishes 06 00052 g003
Figure 4. Effect of the relationship of UTD and Q10_E to temperature on the oxygen consumption rate of Marphysa sanguinea.
Fishes 06 00052 g004
Figure 5. Plot of log-transformed oxygen consumption rates as a function of 1/T for three polychaete species.
Fishes 06 00052 g005
Table 1. O:N ratios of different groups of Marphysa sanguinea at different temperatures.
Temperature (°C)Body Weight Groups
SIL
106.048.7510.94
126.7520.4637.01
1634.8524.6823.47
2031.4331.4938.48
2435.4350.5556.44
2717.2215.2022.40
309.578.718.63
325.044.683.55
Table 2. Regression equations of oxygen consumption rate (R, mg·h−1) against dry weight (M, g) at different temperatures.
Temperature (°C)Regression EquationR2
12lnR = −2.1281 + 0.6876lnM0.9997
16lnR = −1.1052 + 0.6194lnM0.9705
20lnR = −0.8354 + 0.5908lnM0.9758
24lnR = −0.6968 + 0.4318lnM0.9183
27lnR = −0.5535 + 0.4890lnM0.9426
Table 3. Regression equations of ammonia excretion rate (U, μg·h−1) against dry weight (M, g) at different temperatures.
Temperature (°C)Regression EquationR2
12lnU = 1.6246 − 0.0504lnM0.8956
16lnU = 2.4235 + 0.8016lnM0.9973
20lnU = 2.3882 + 0.5099lnM0.9893
24lnU = 2.0717 + 0.0834lnM0.5816
27lnU = 3.3072 + 0.3988lnM0.9968
Publisher’s Note: MDPI stays neutral with regard to jurisdictional claims in published maps and institutional affiliations.