
Phylogeographic Structure of Freshwater Tor sp. in River Basins of Sabah, Malaysia


Abstract
1. Introduction
2. Materials and Methods
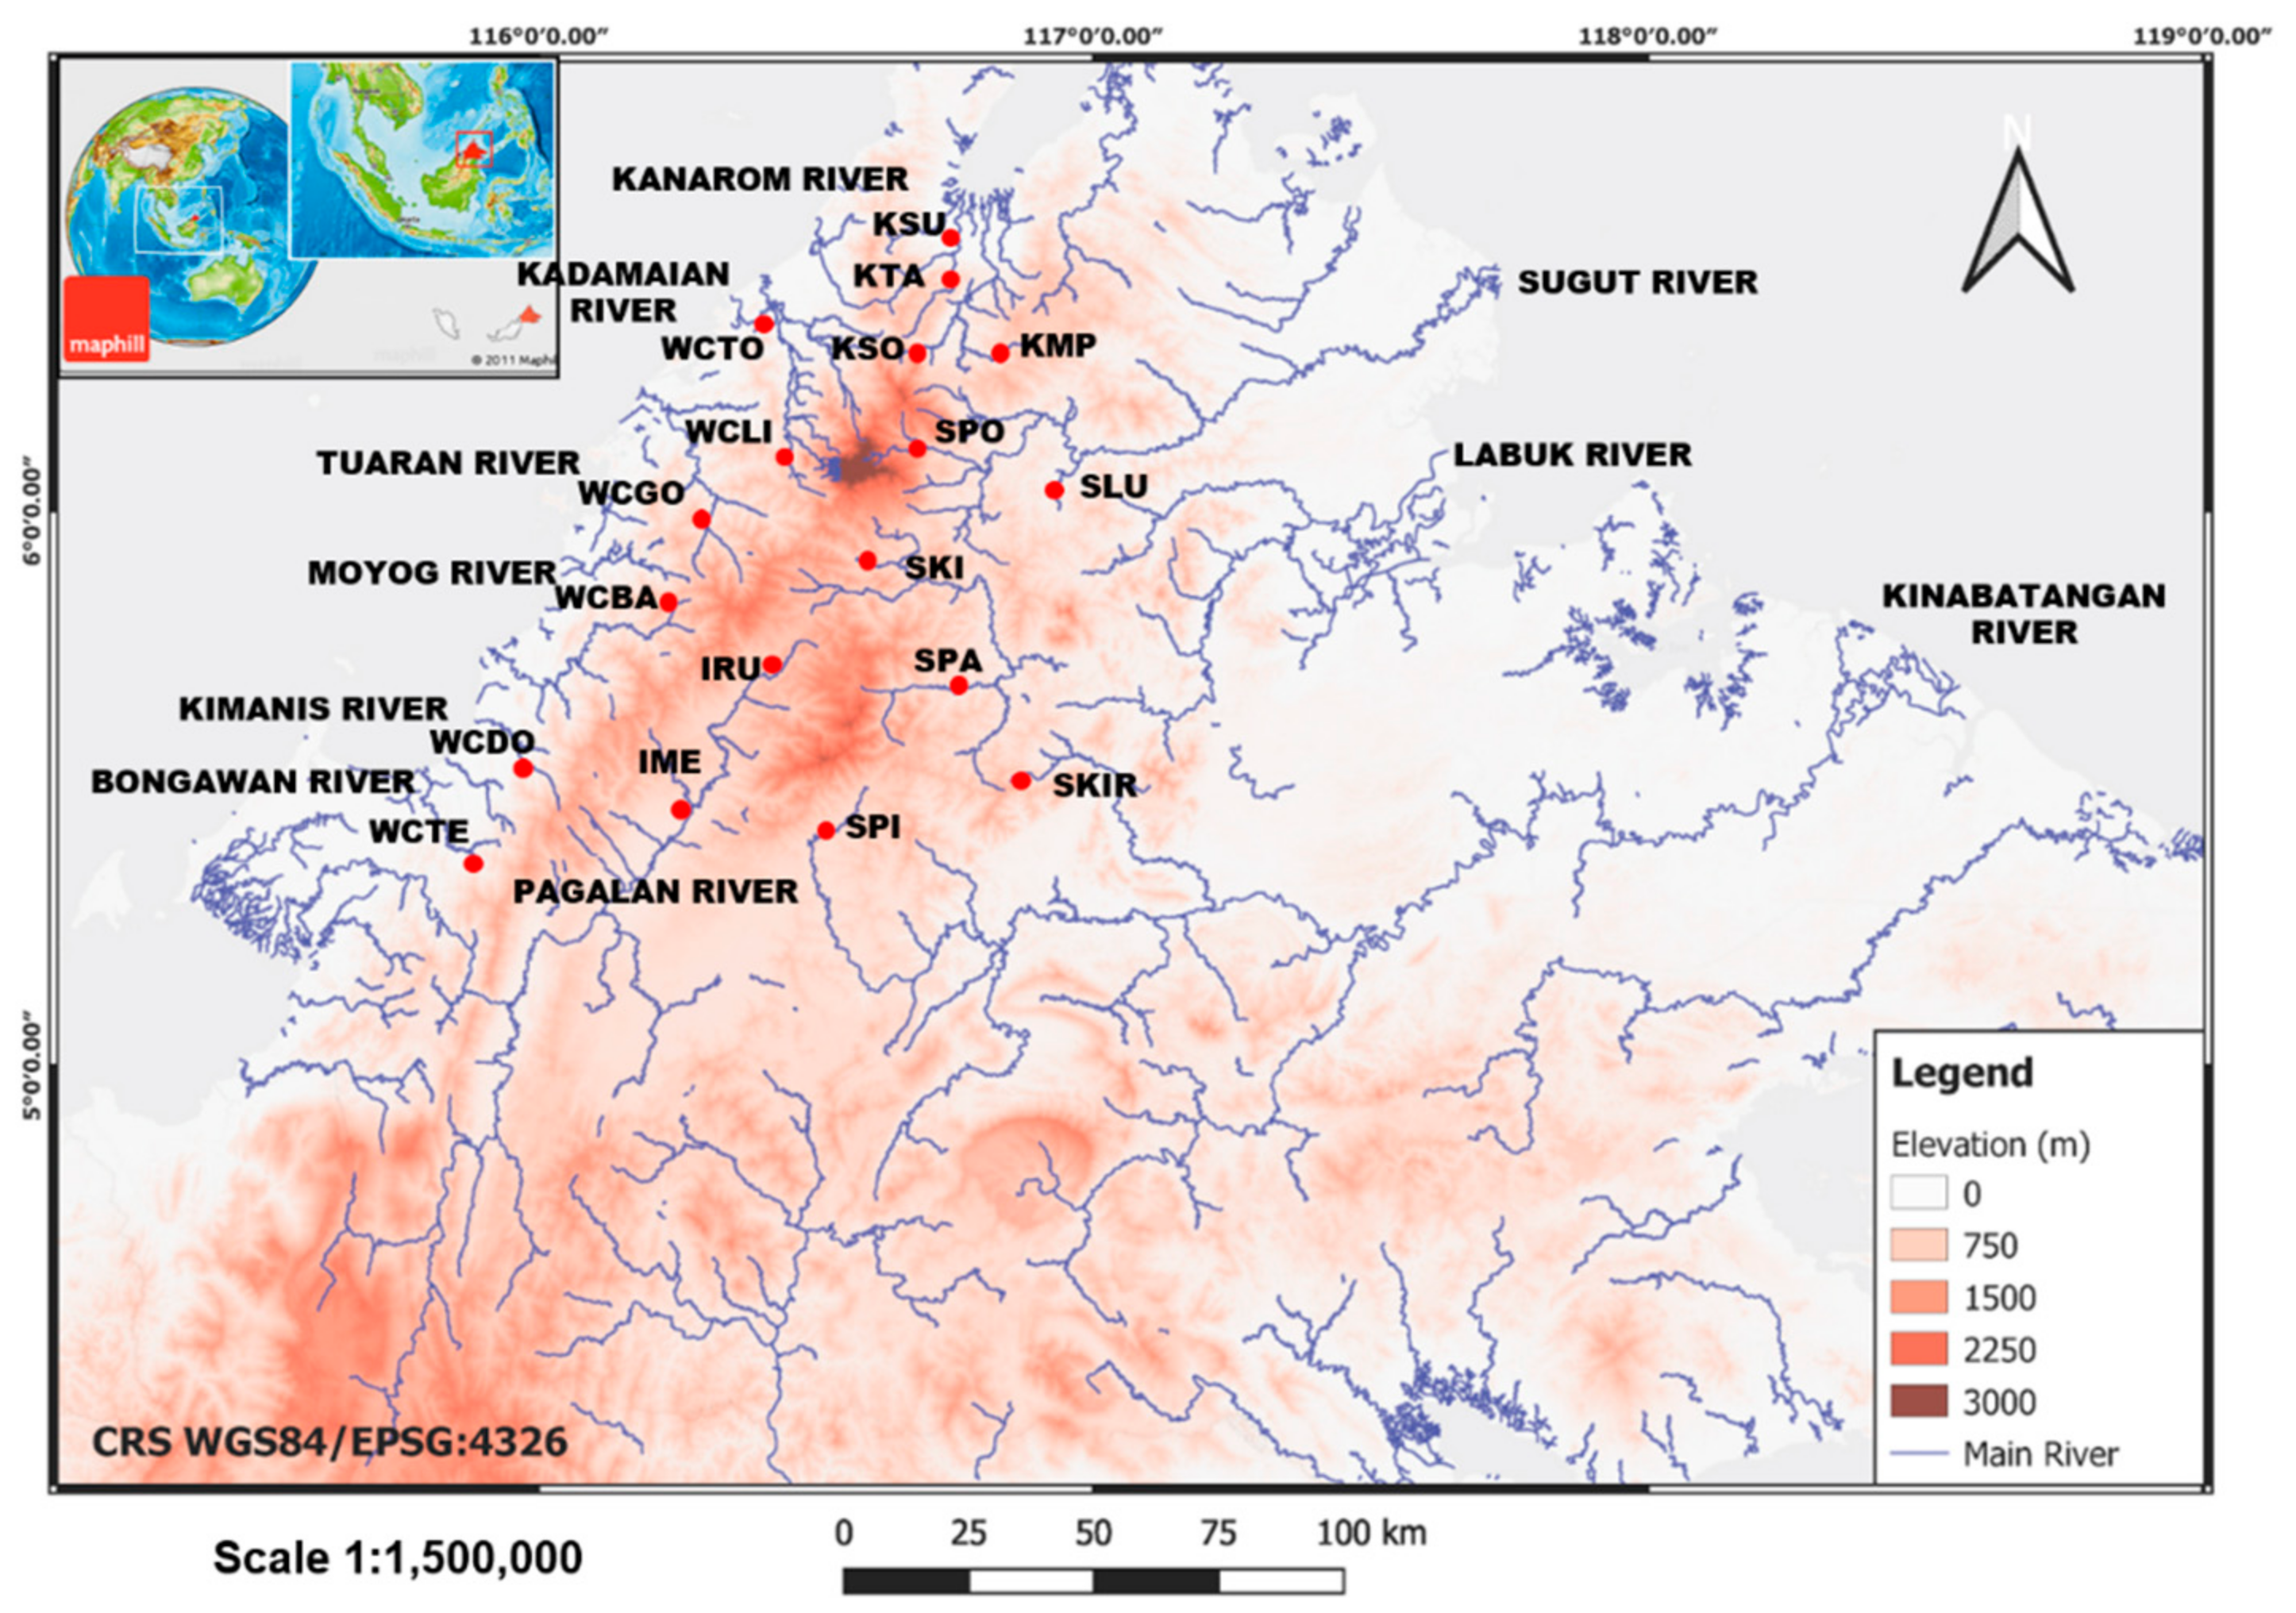
2.1. Collection of Samples
2.2. Laboratory Analysis
2.3. Data Analysis
2.3.1. Genetic Diversity
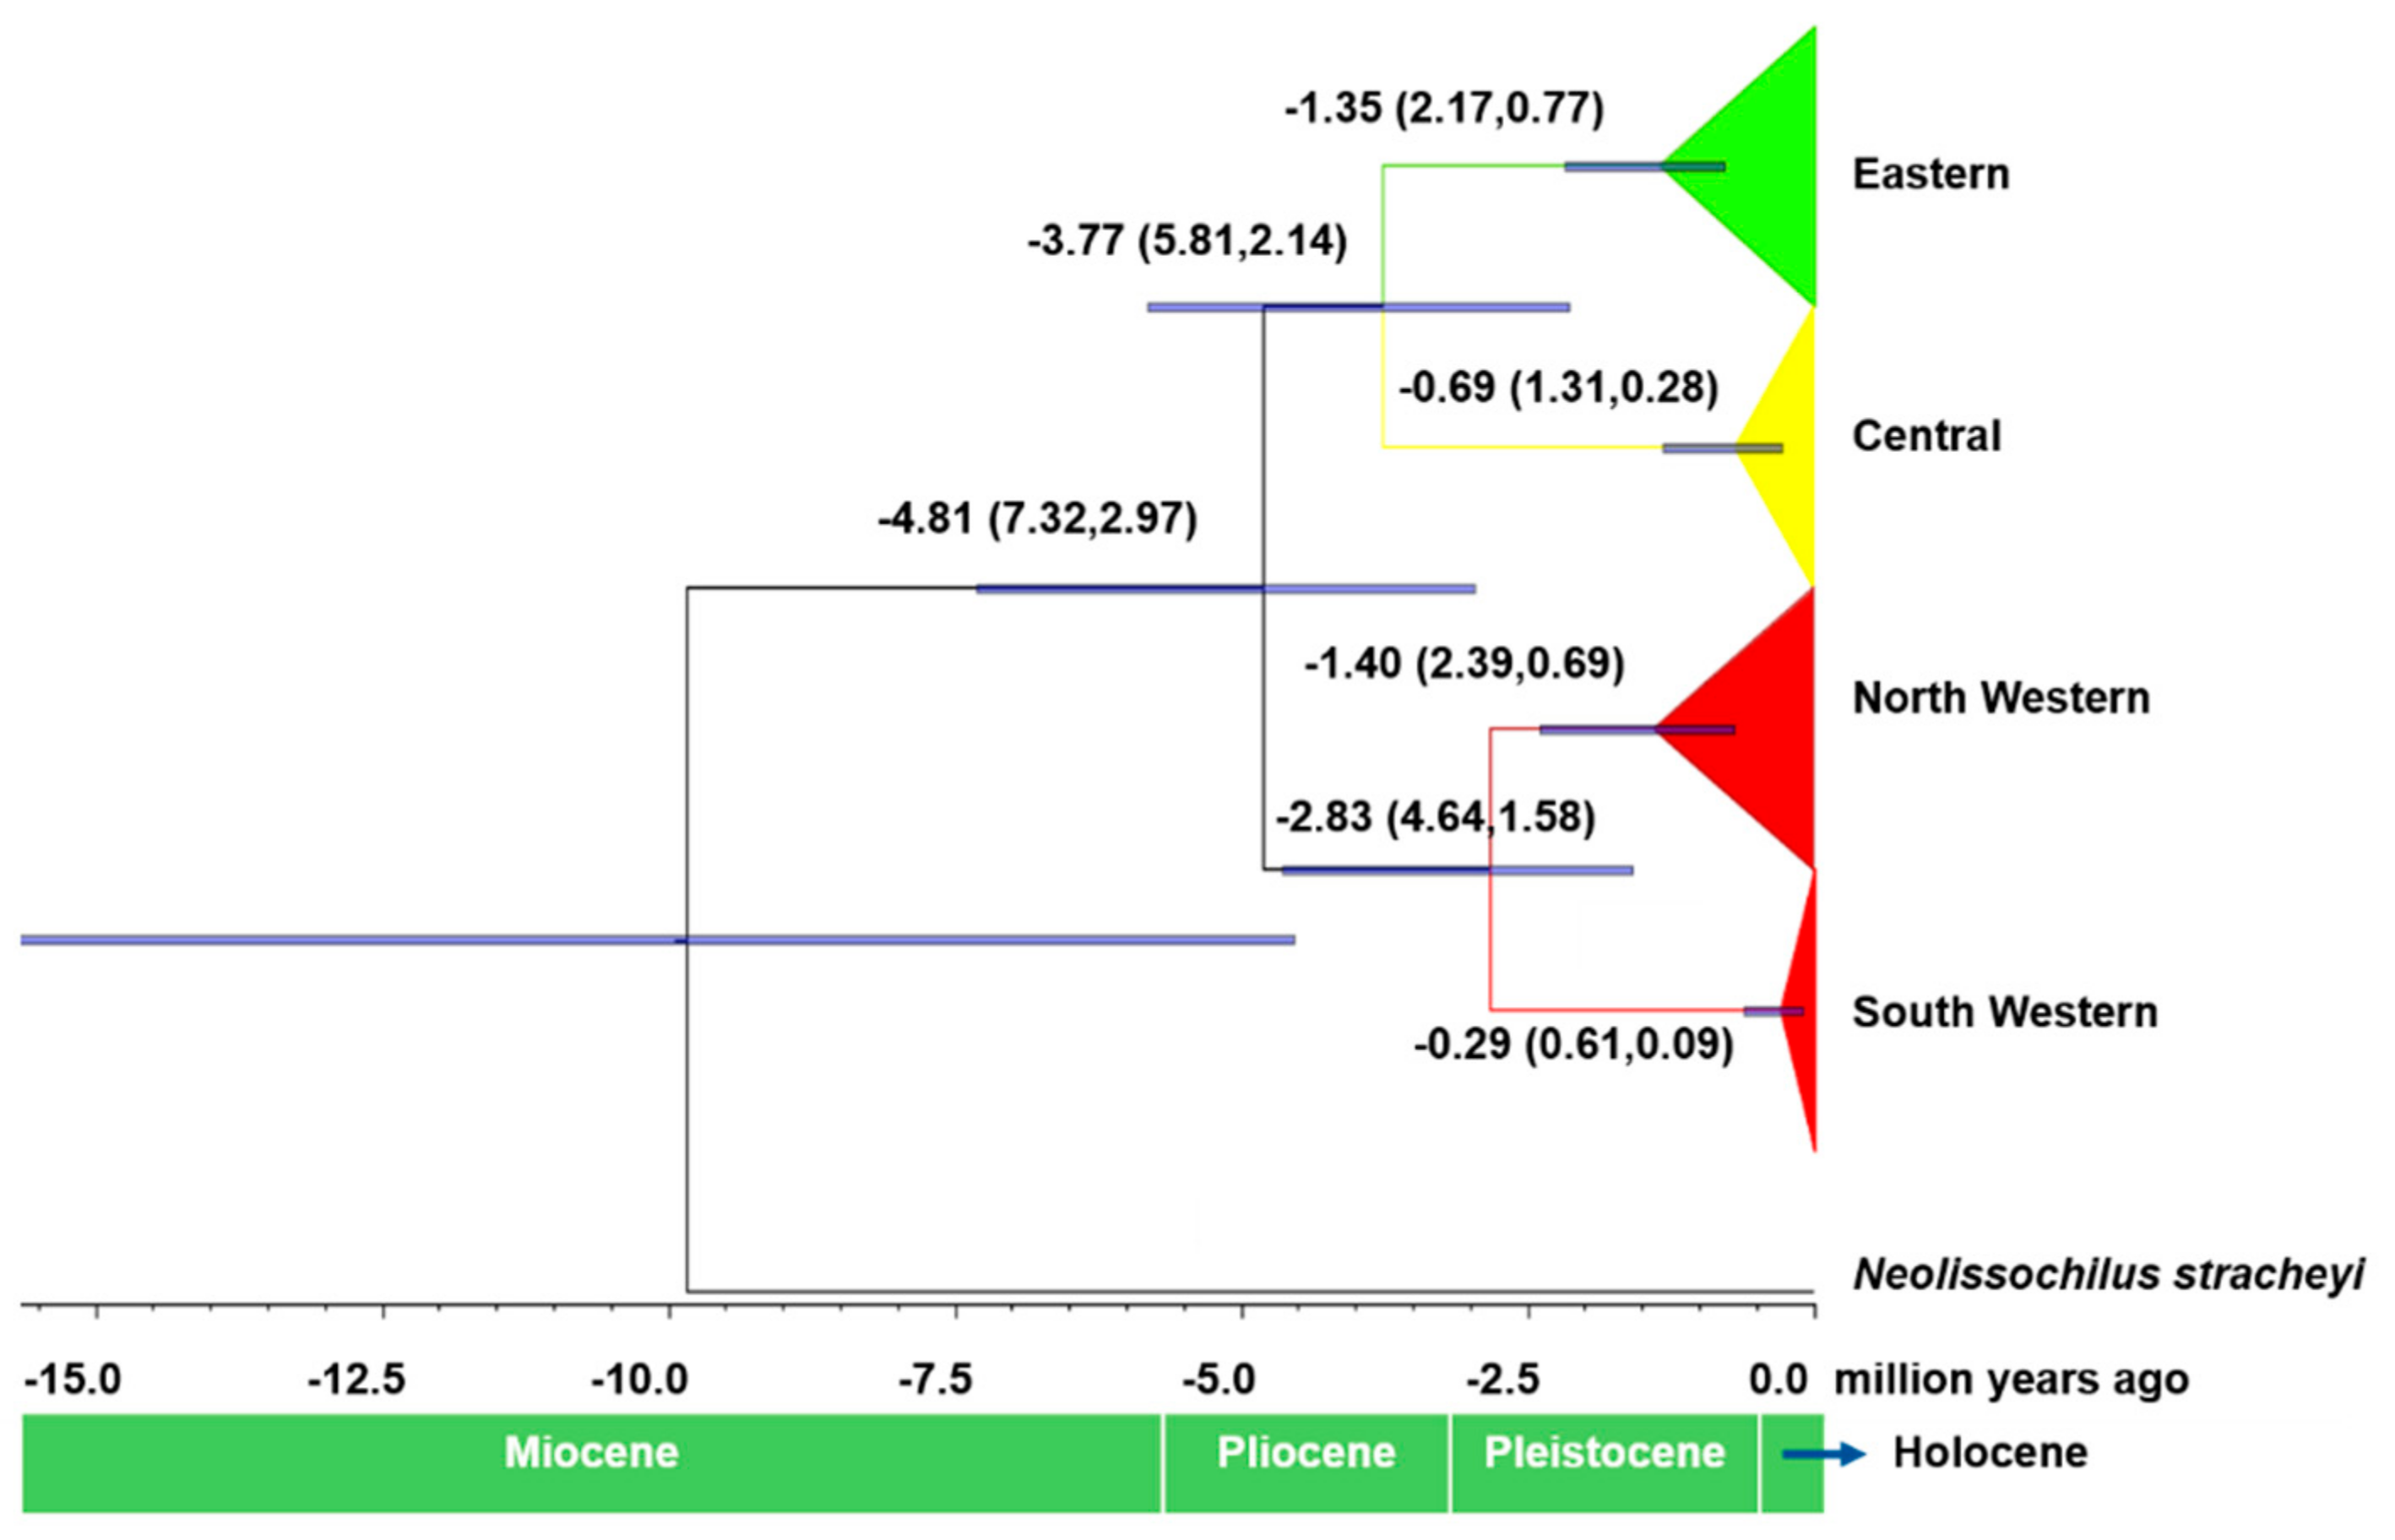
2.3.2. Haplotype Relationship, Divergence Time
2.3.3. Genetic Differentiation and Population Structure
2.3.4. Demography
3. Results
3.1. Genetic Diversity
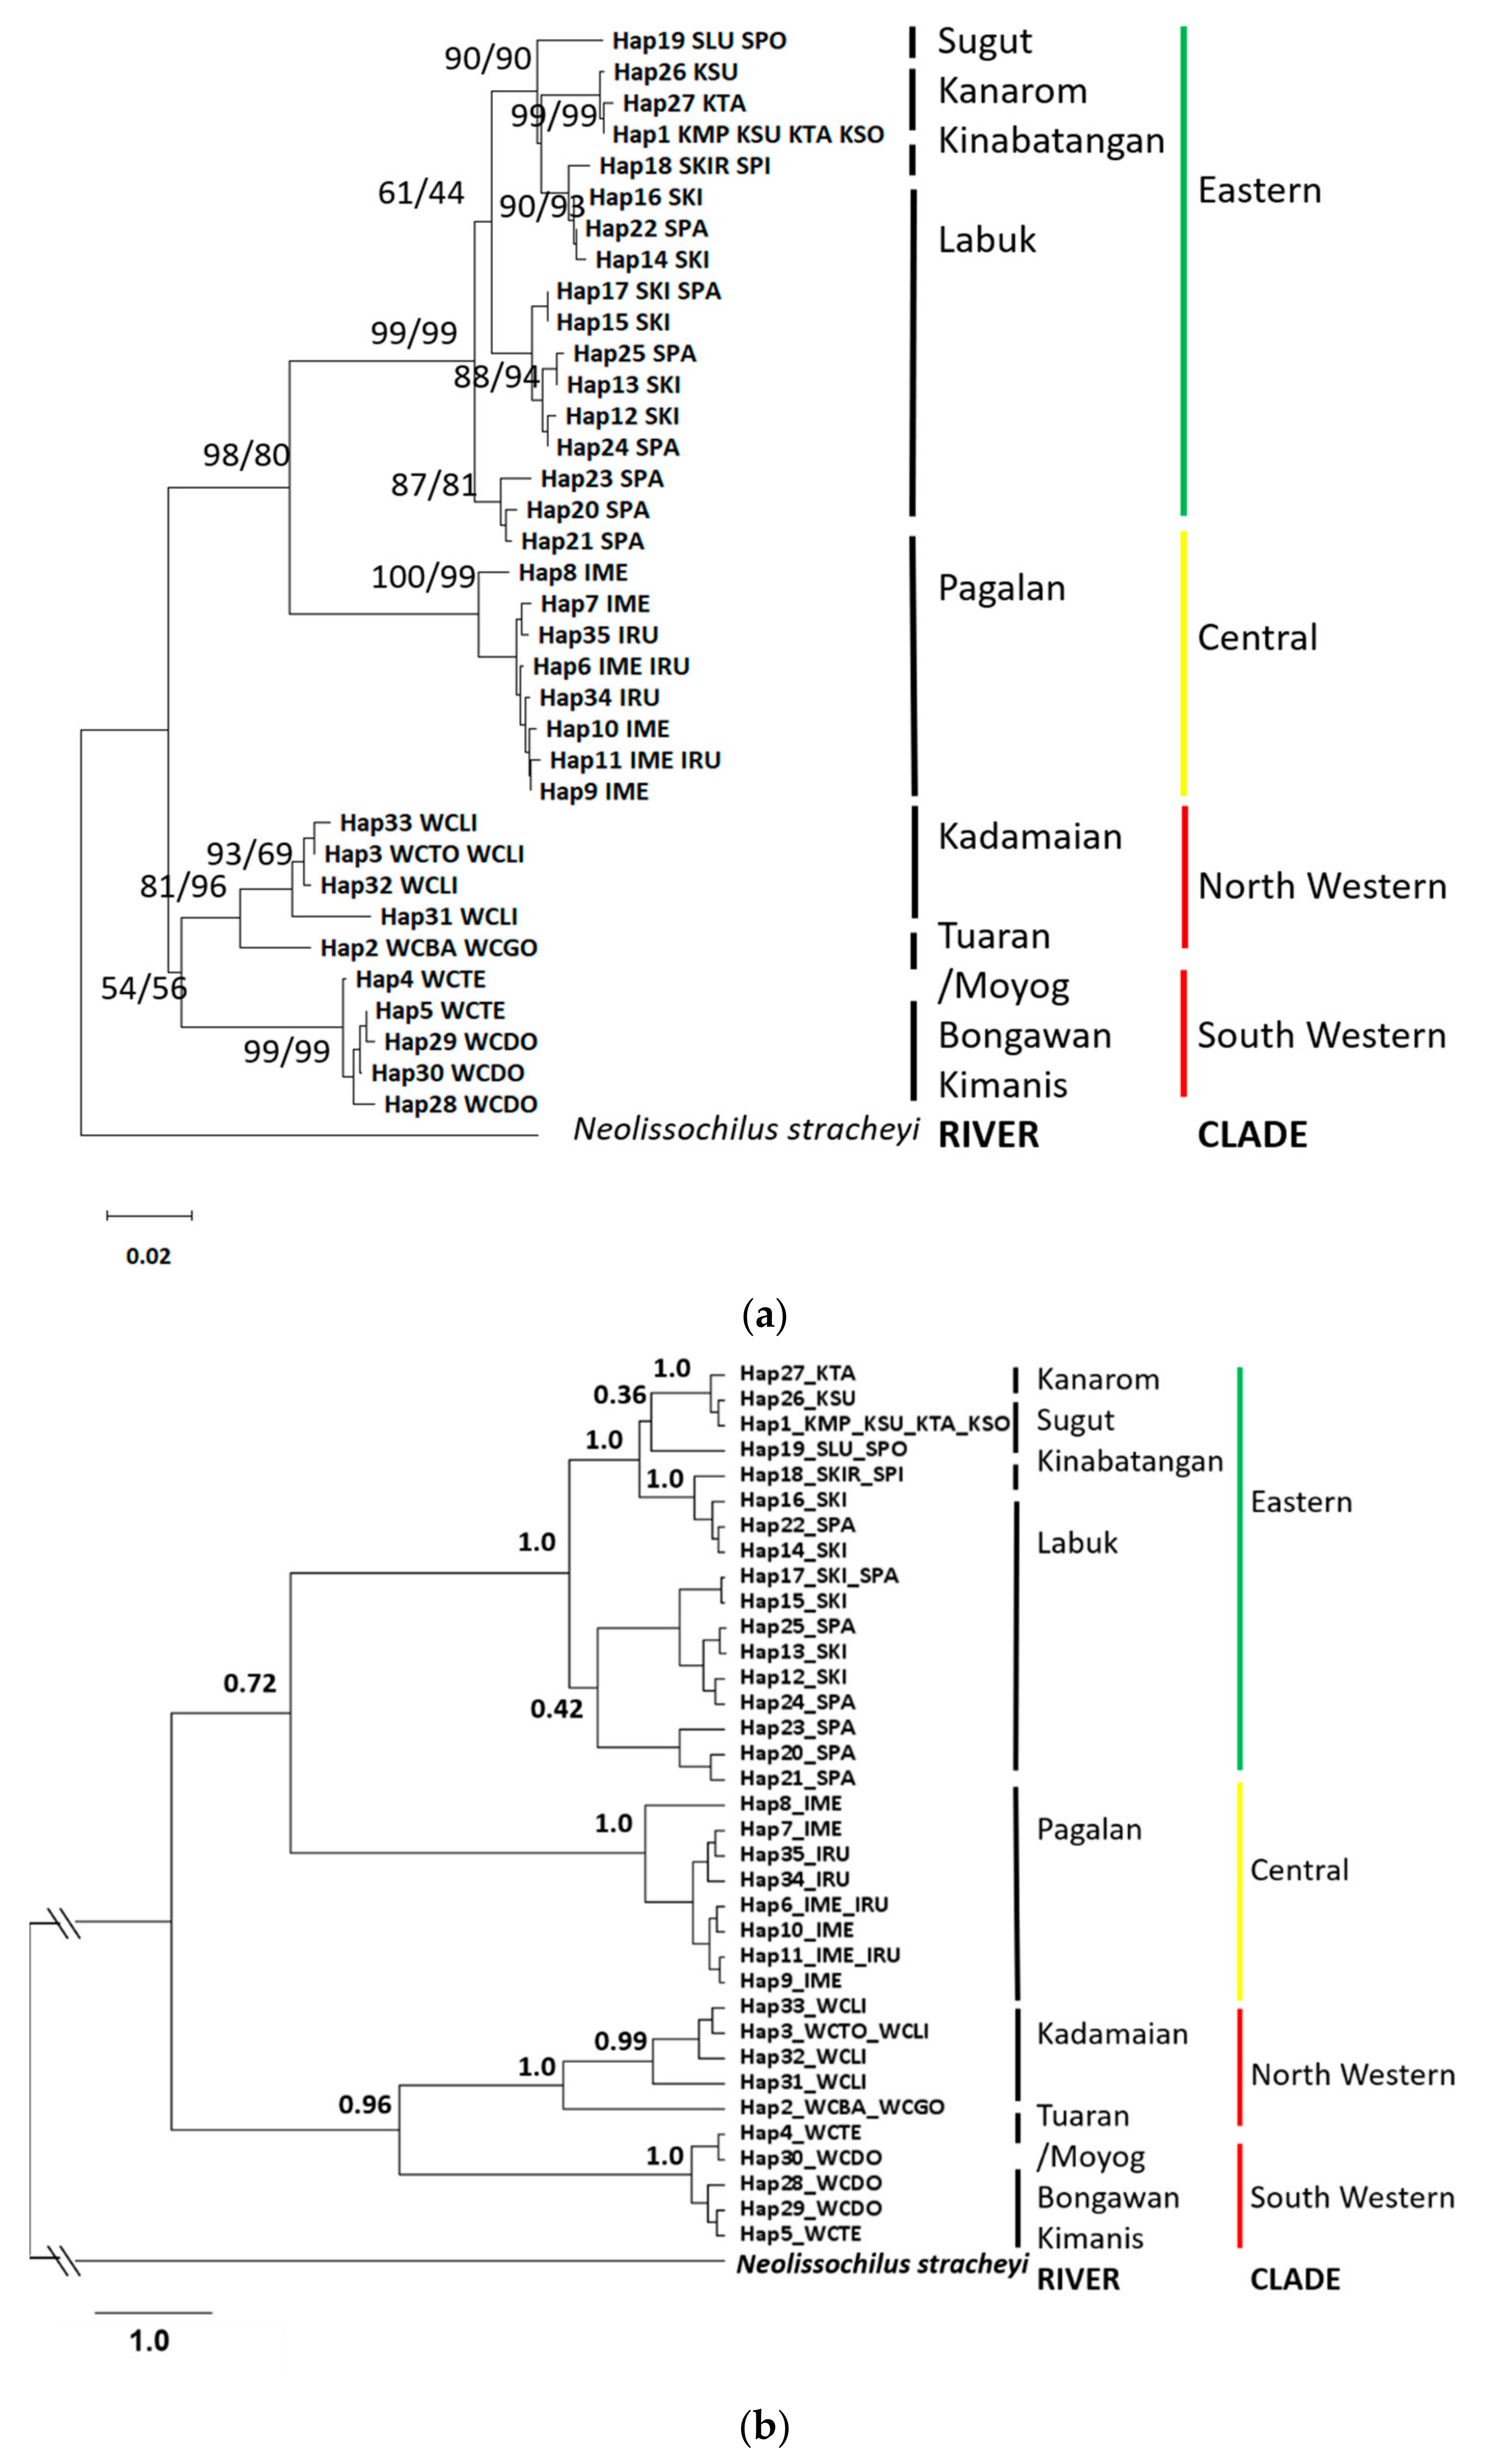
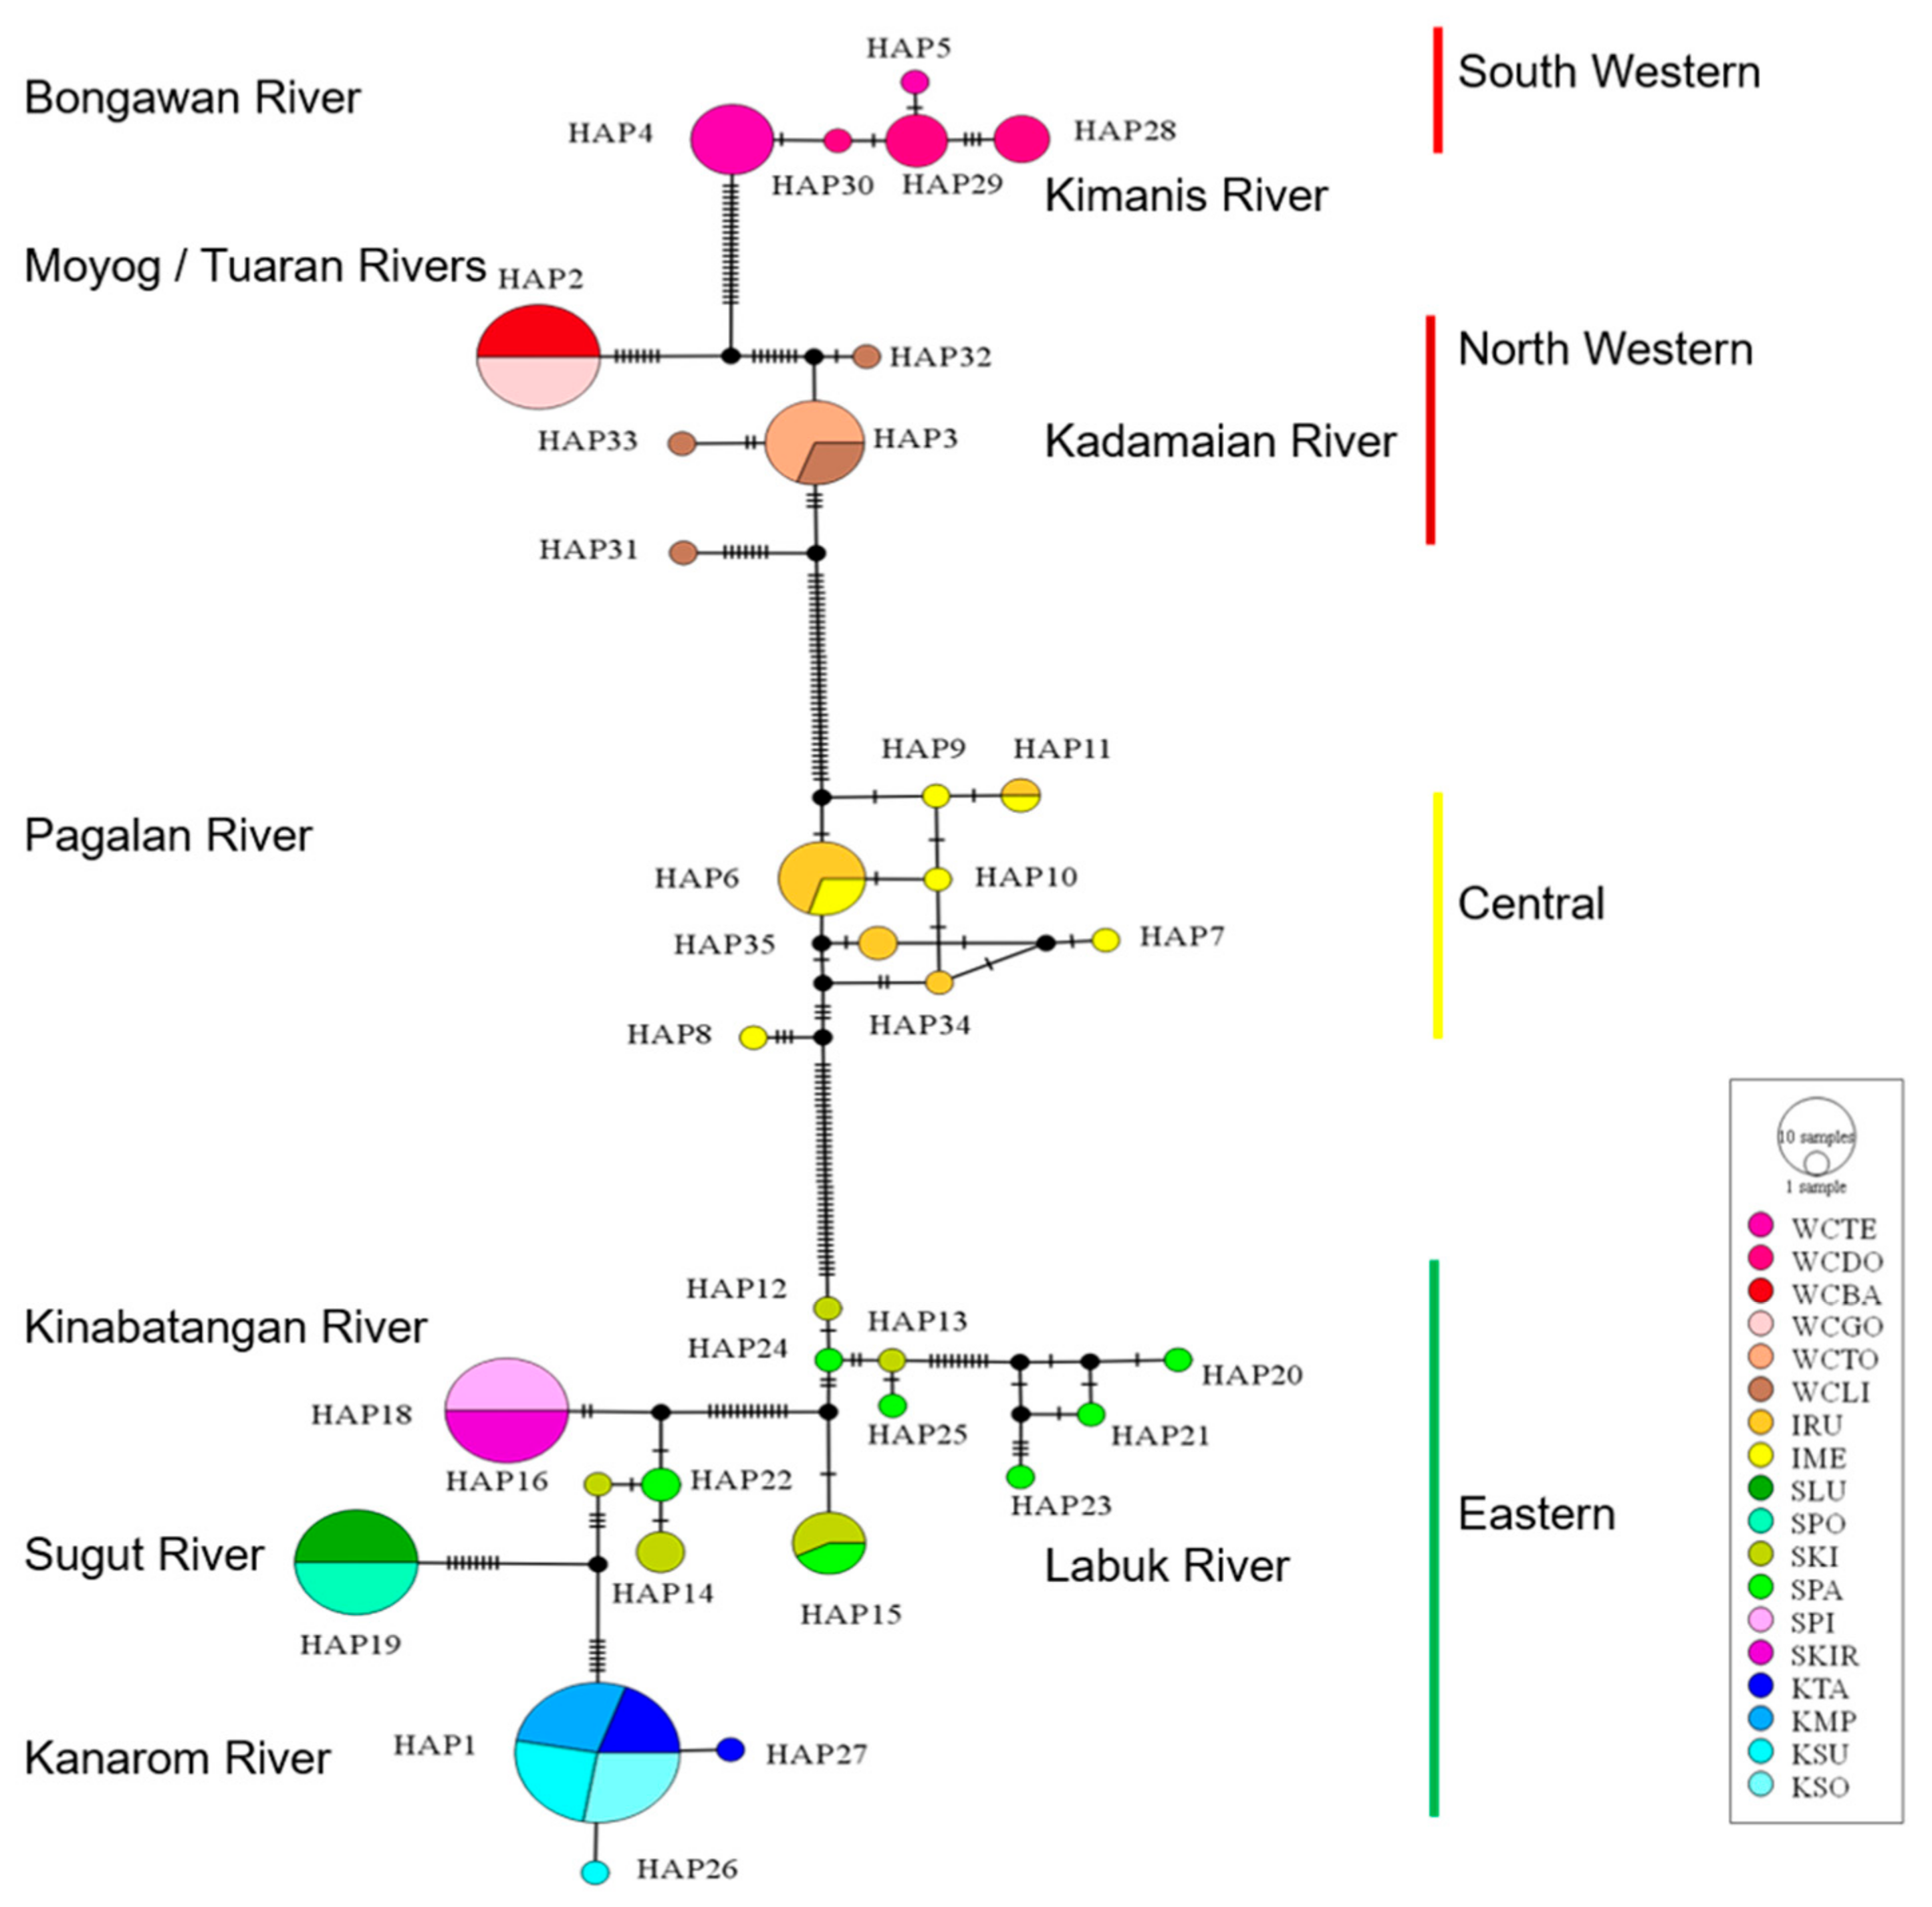
3.2. Molecular Phylogeny and Divergence Times
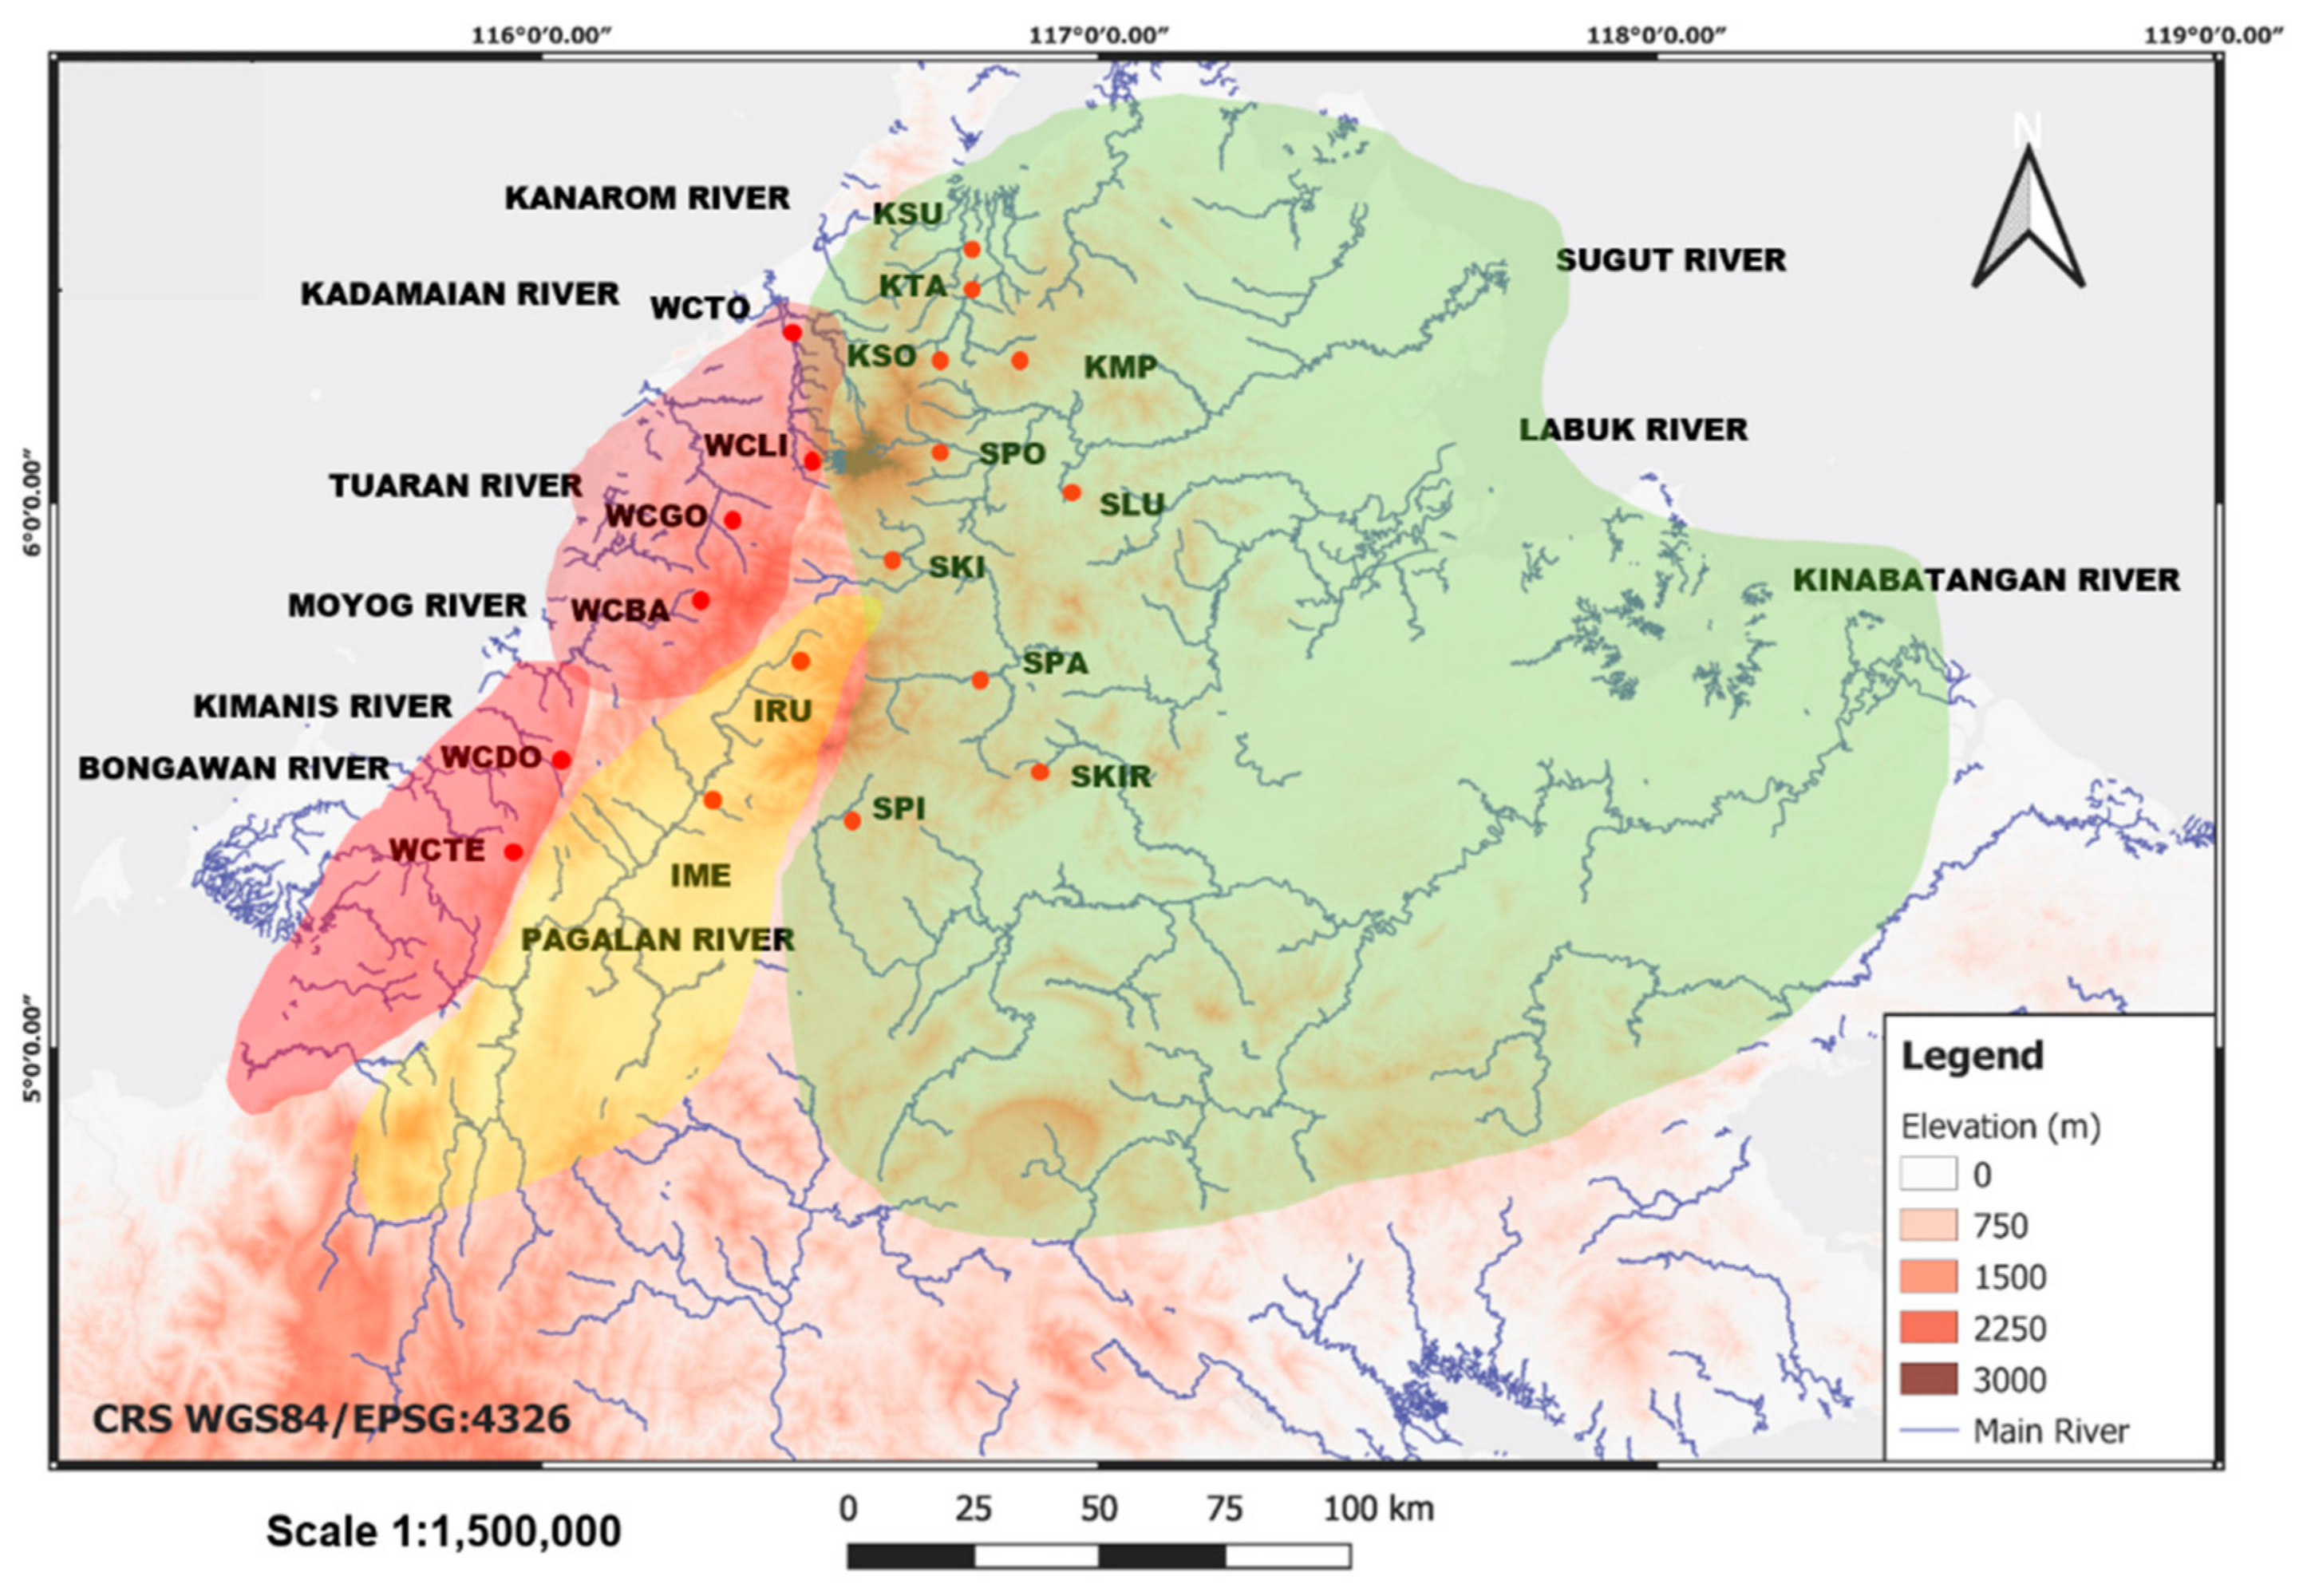
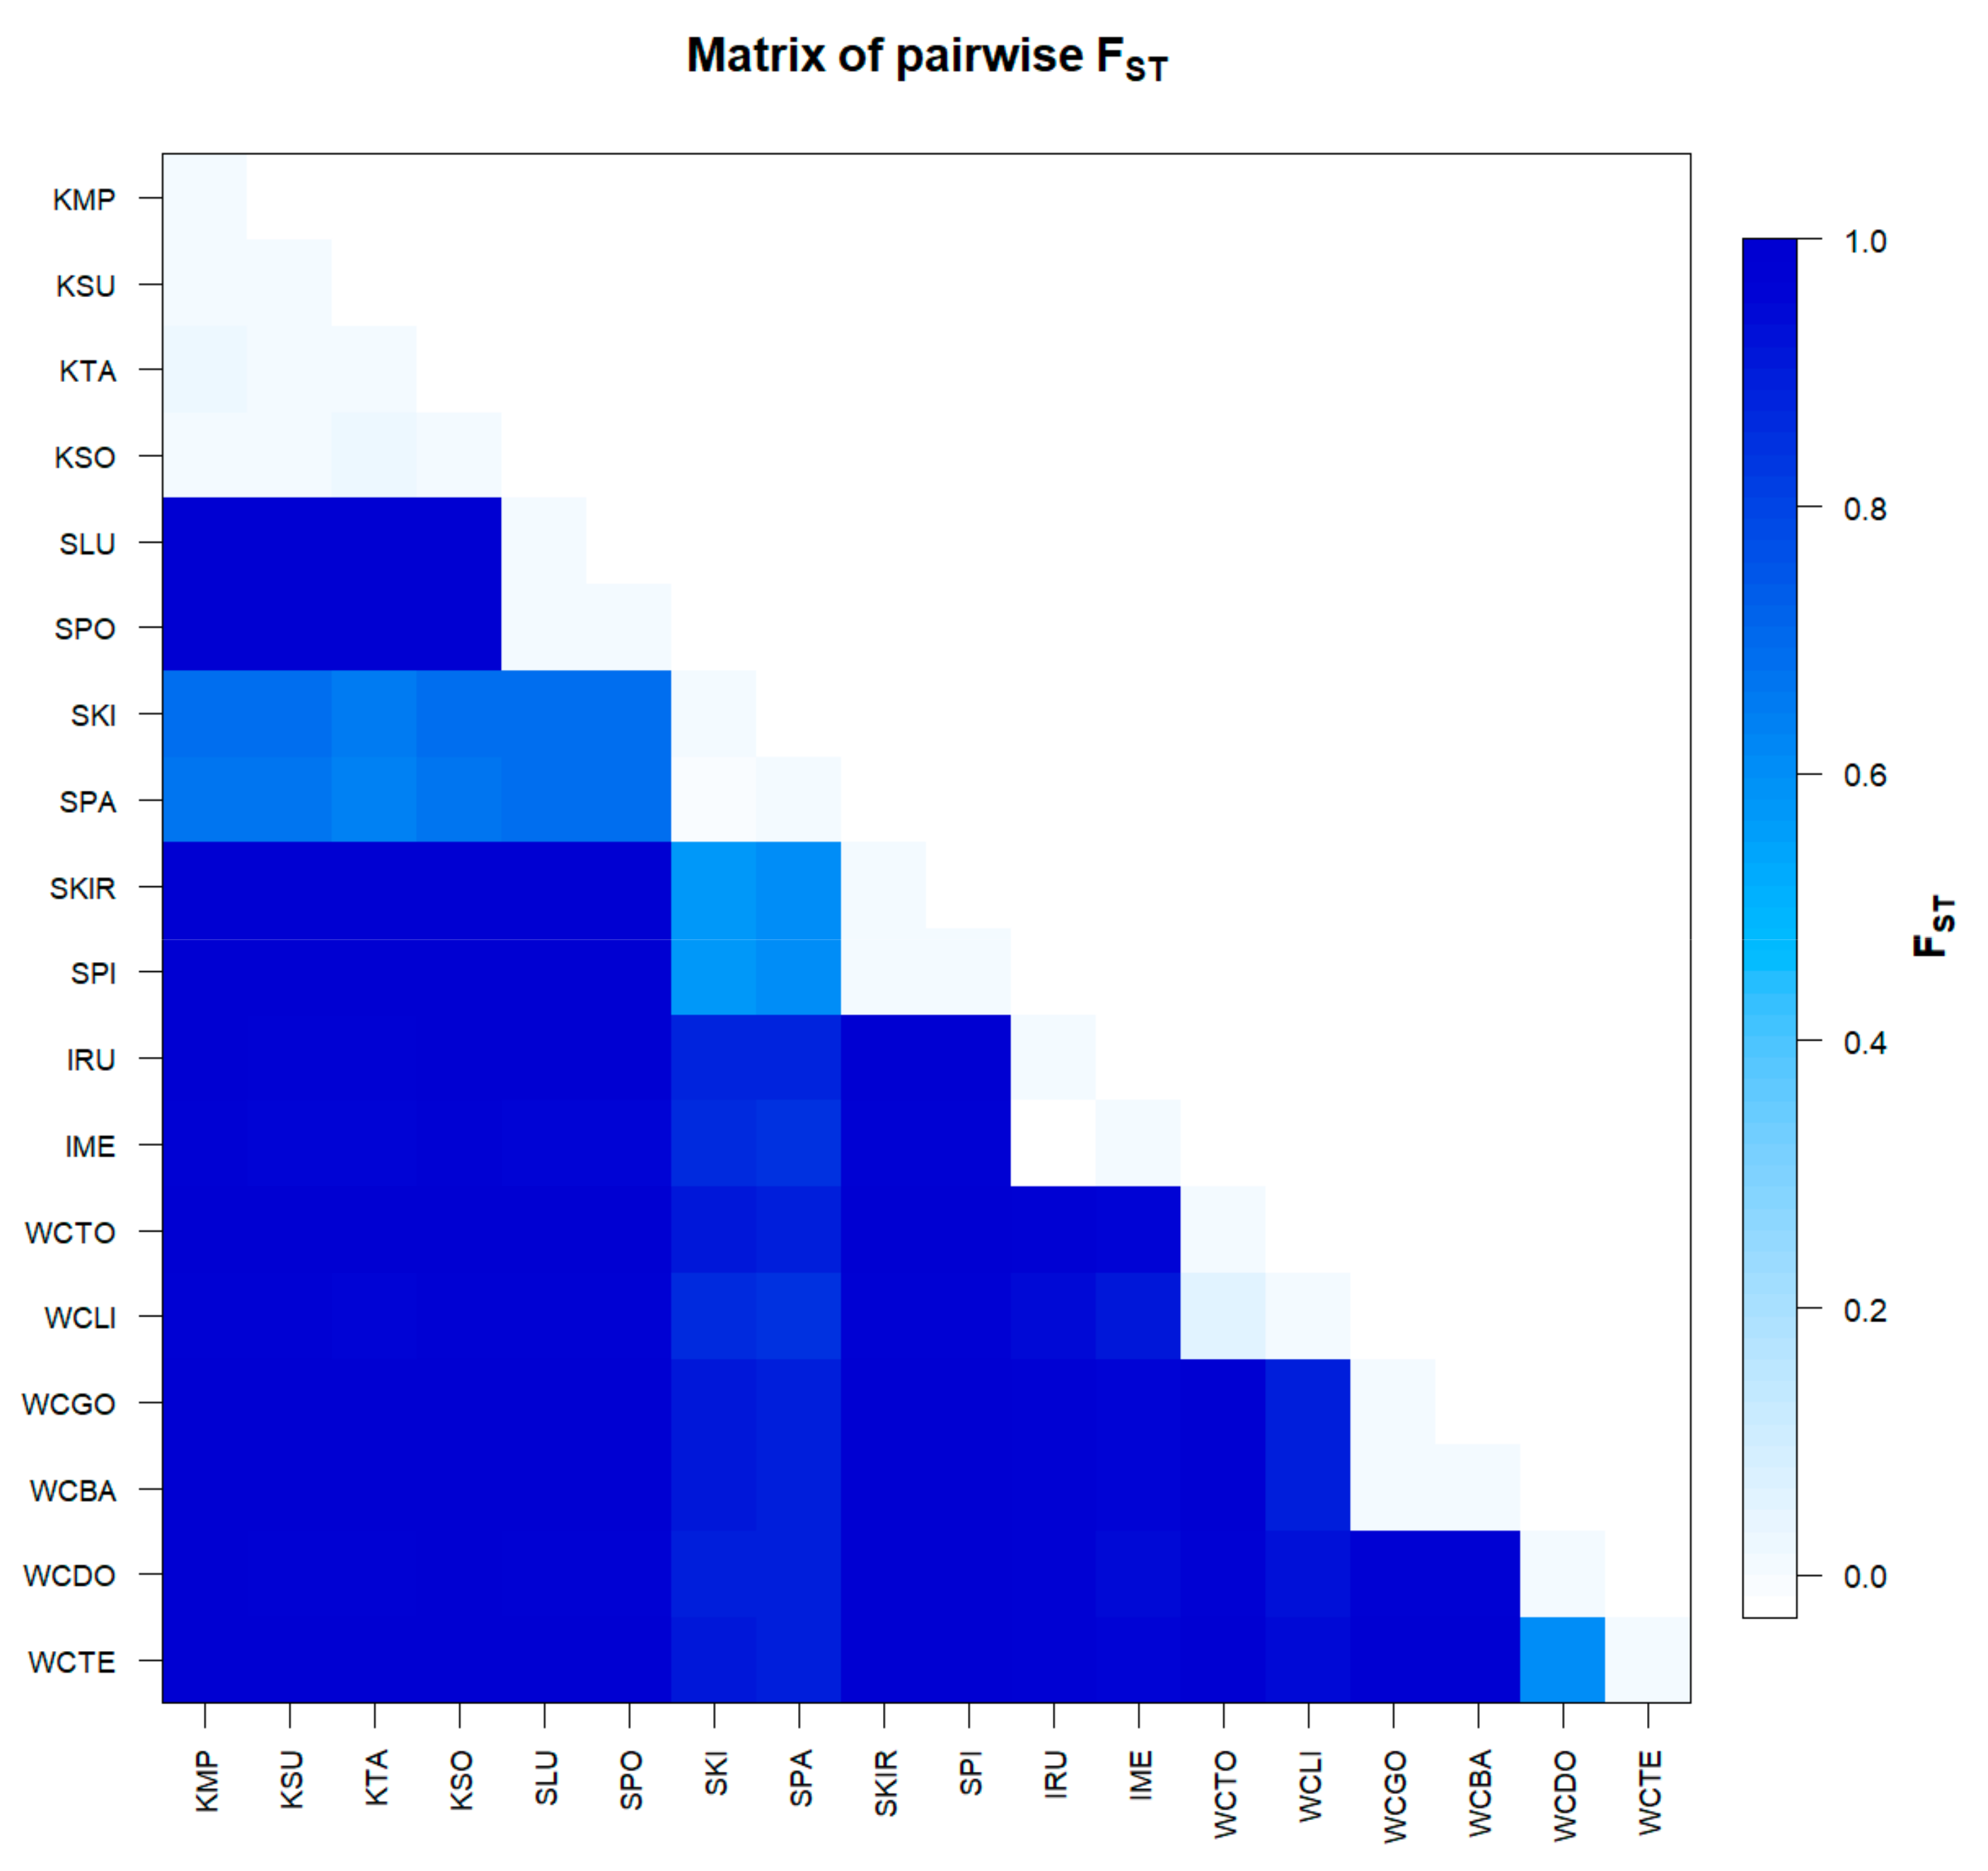
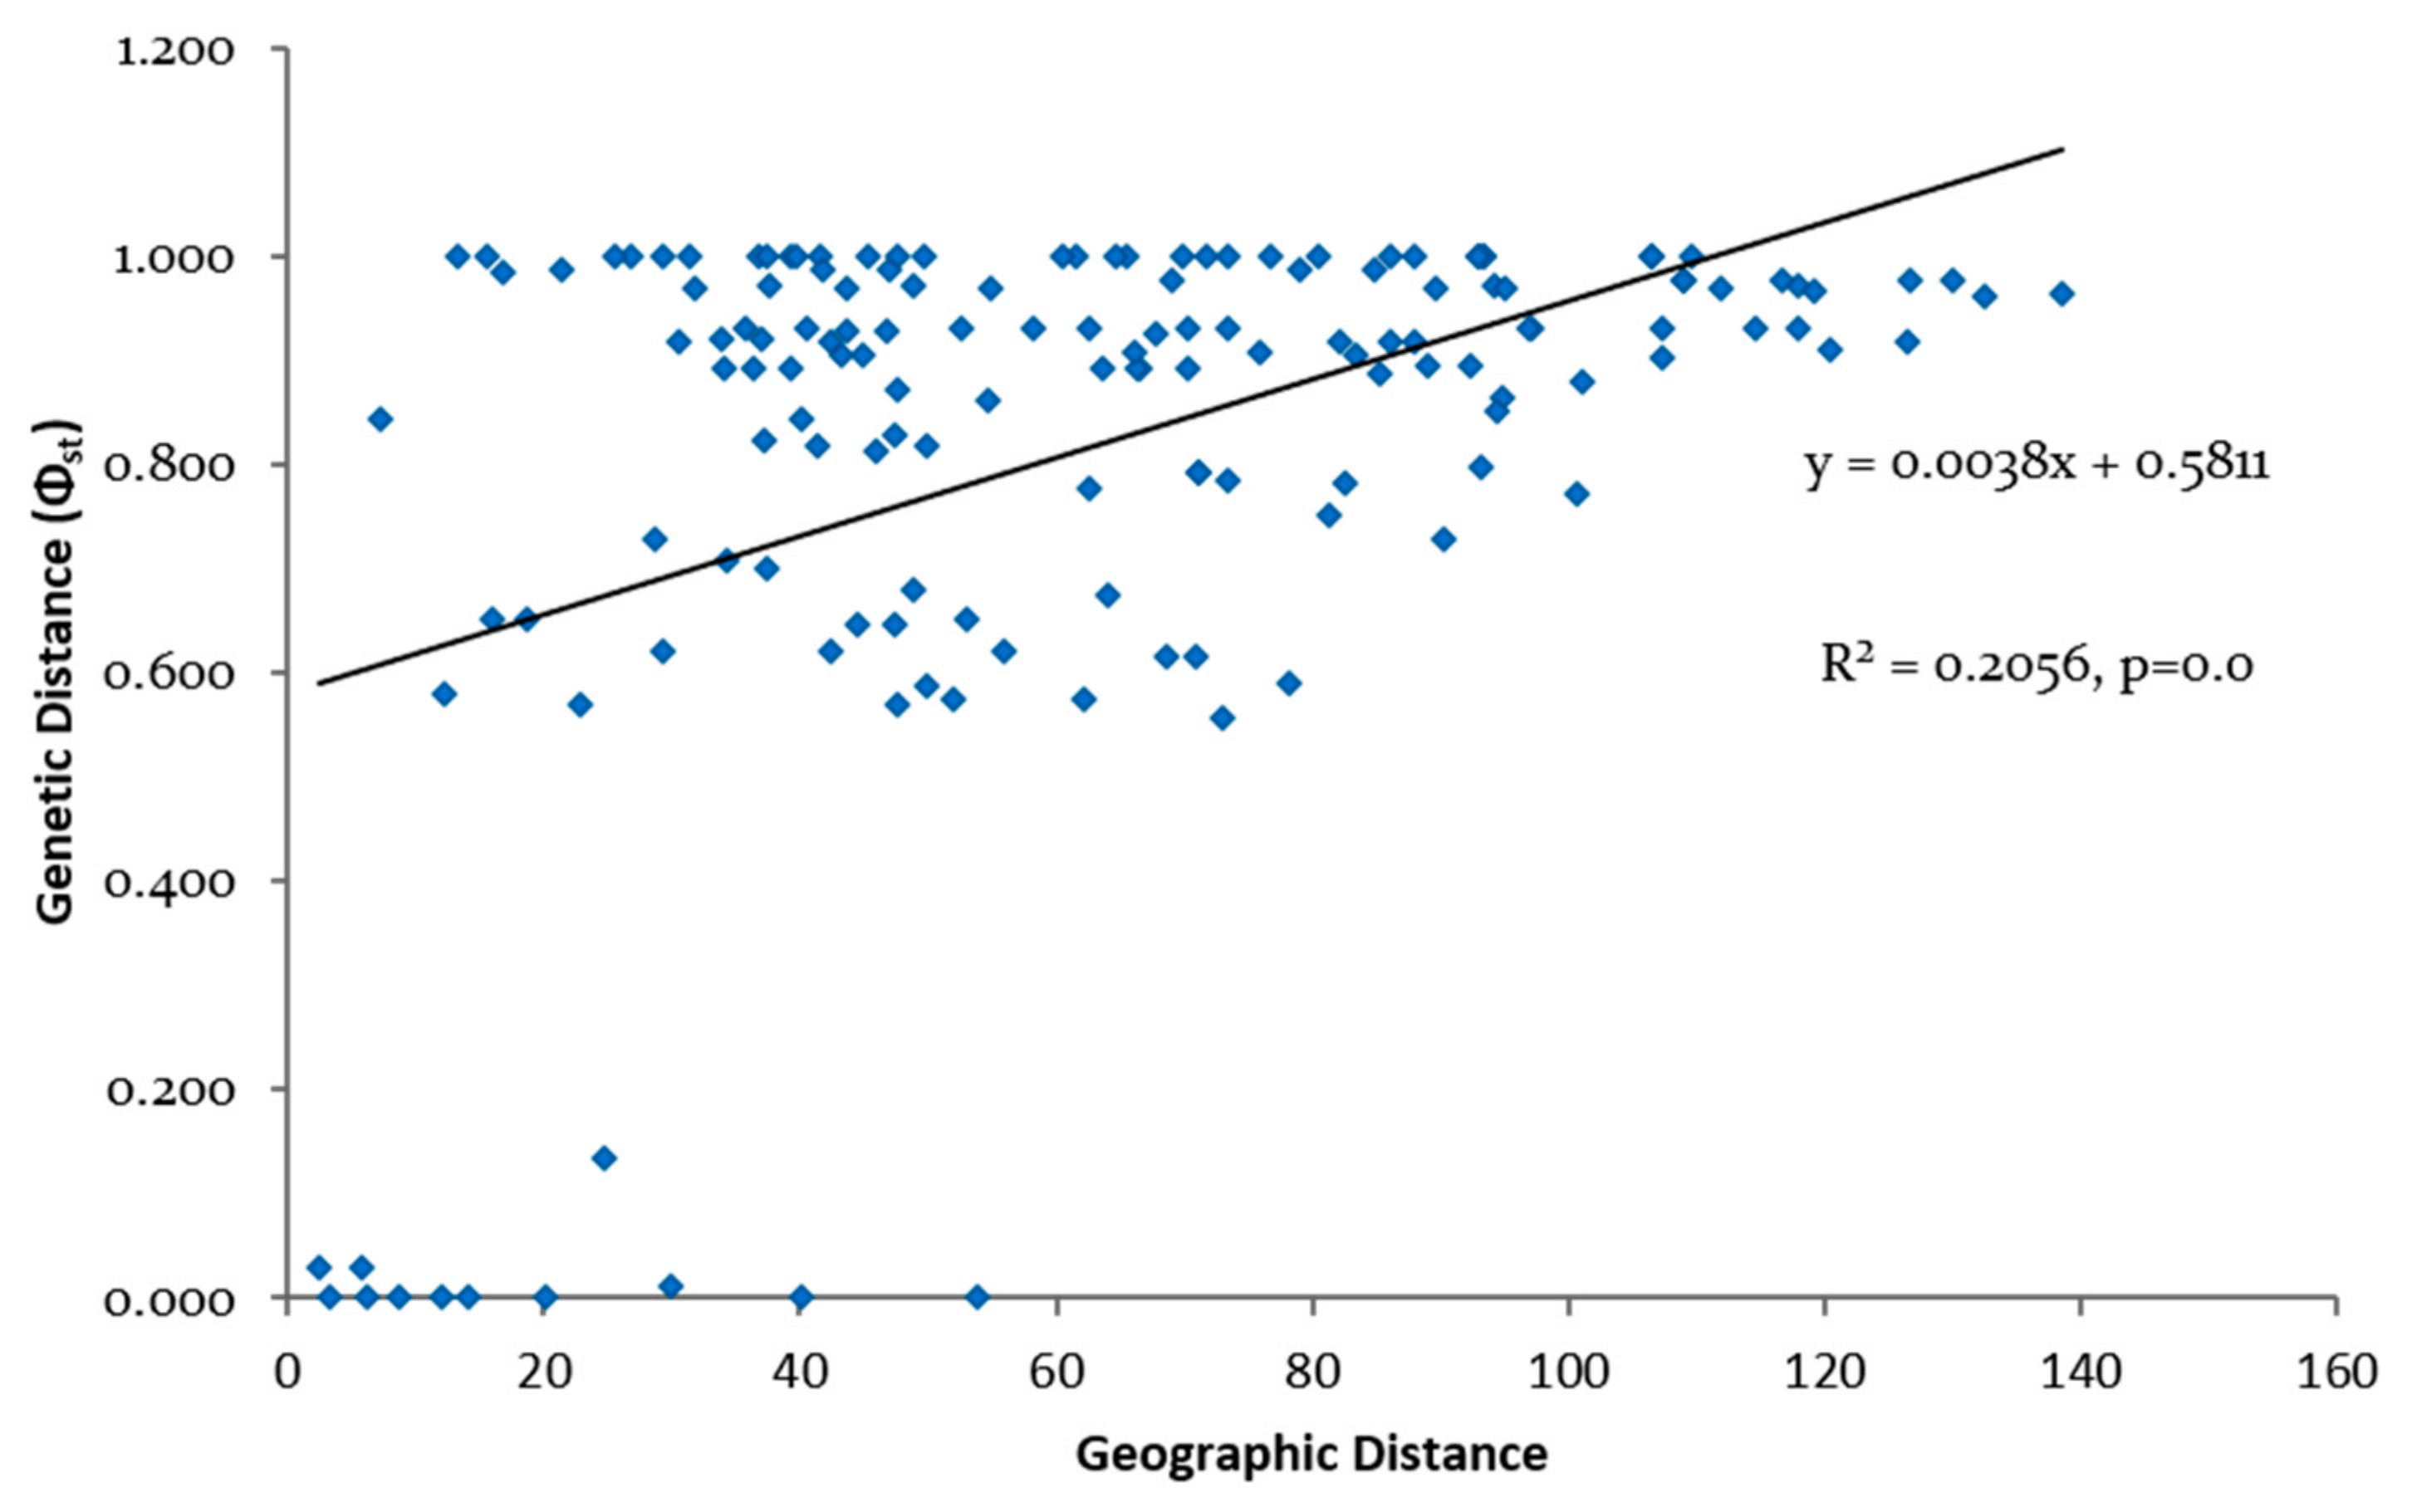
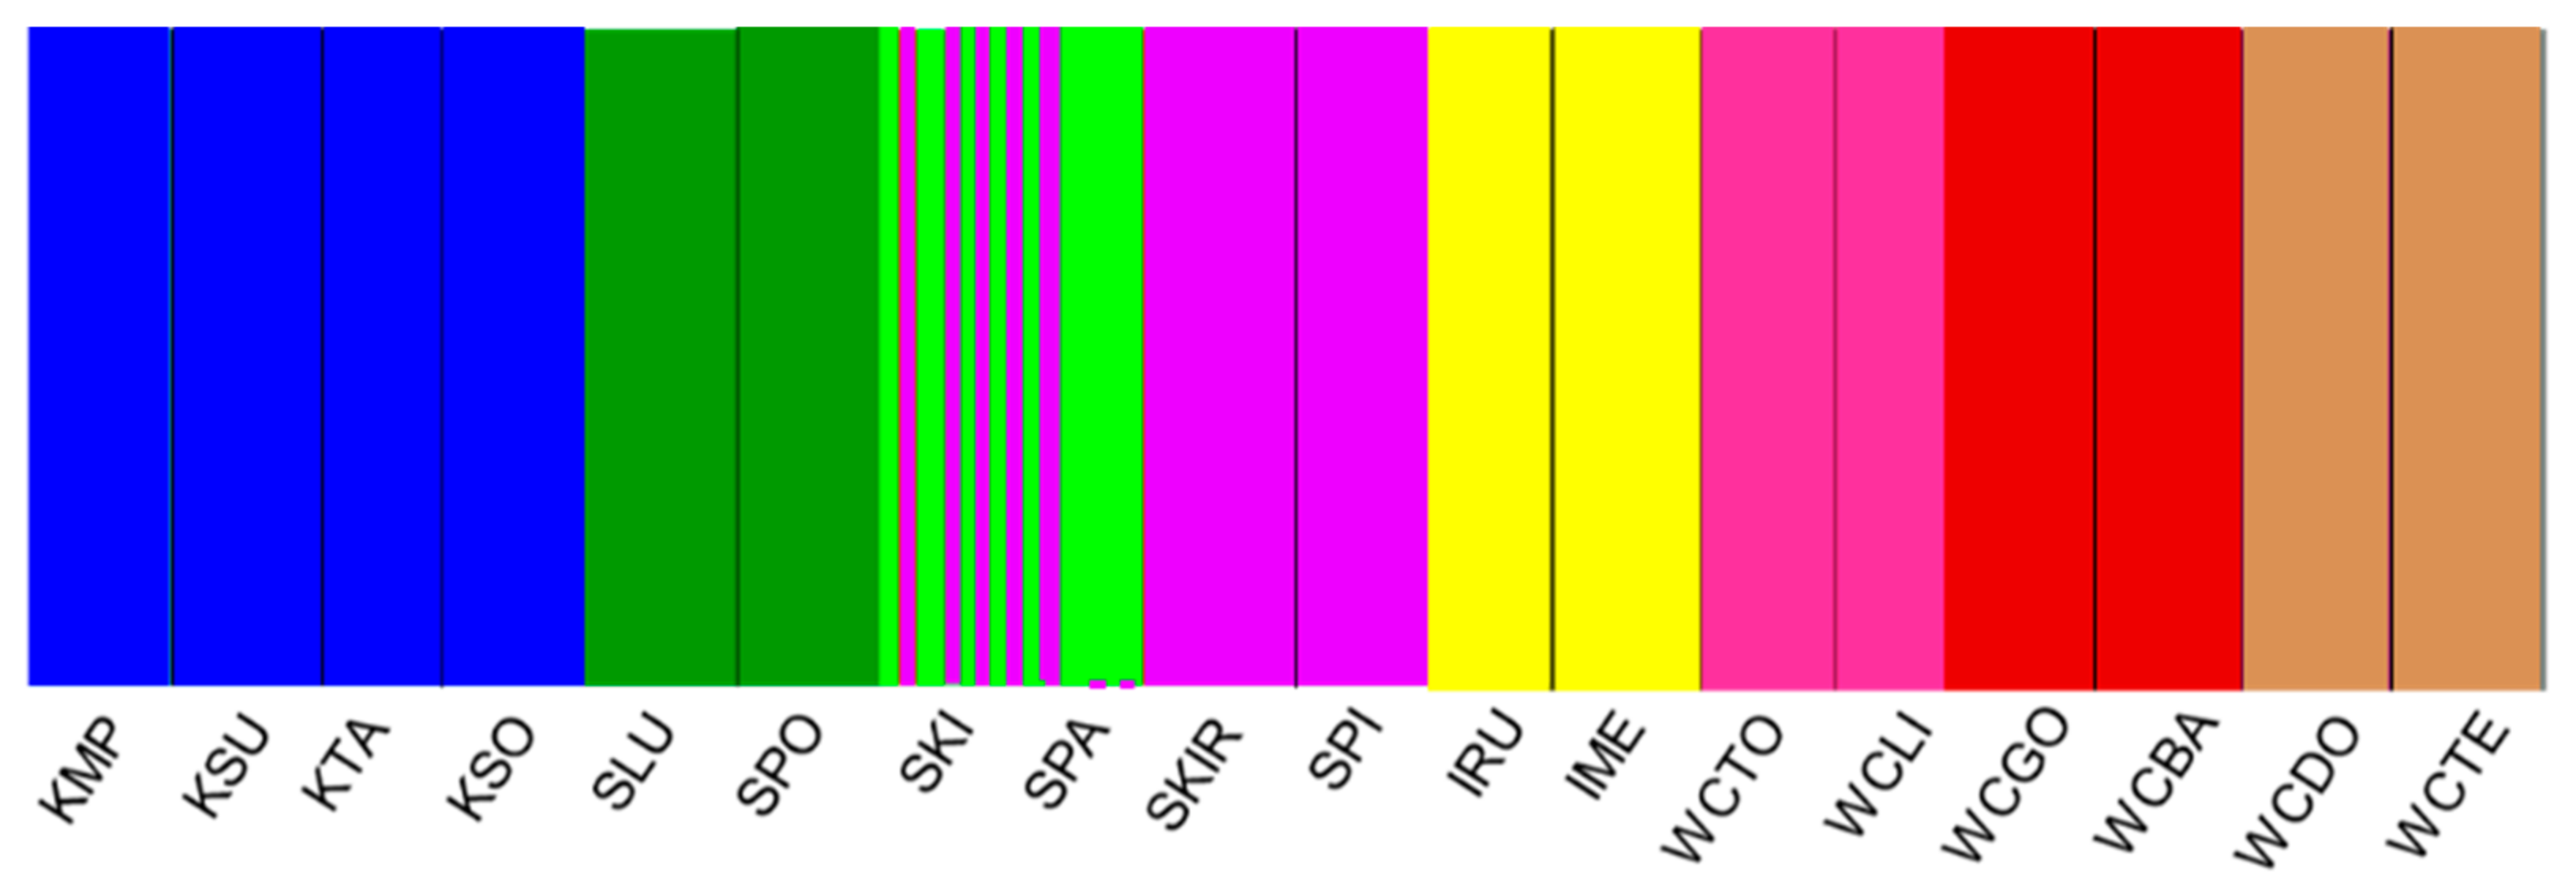
3.3. Genetic Differentiation and Population Structure
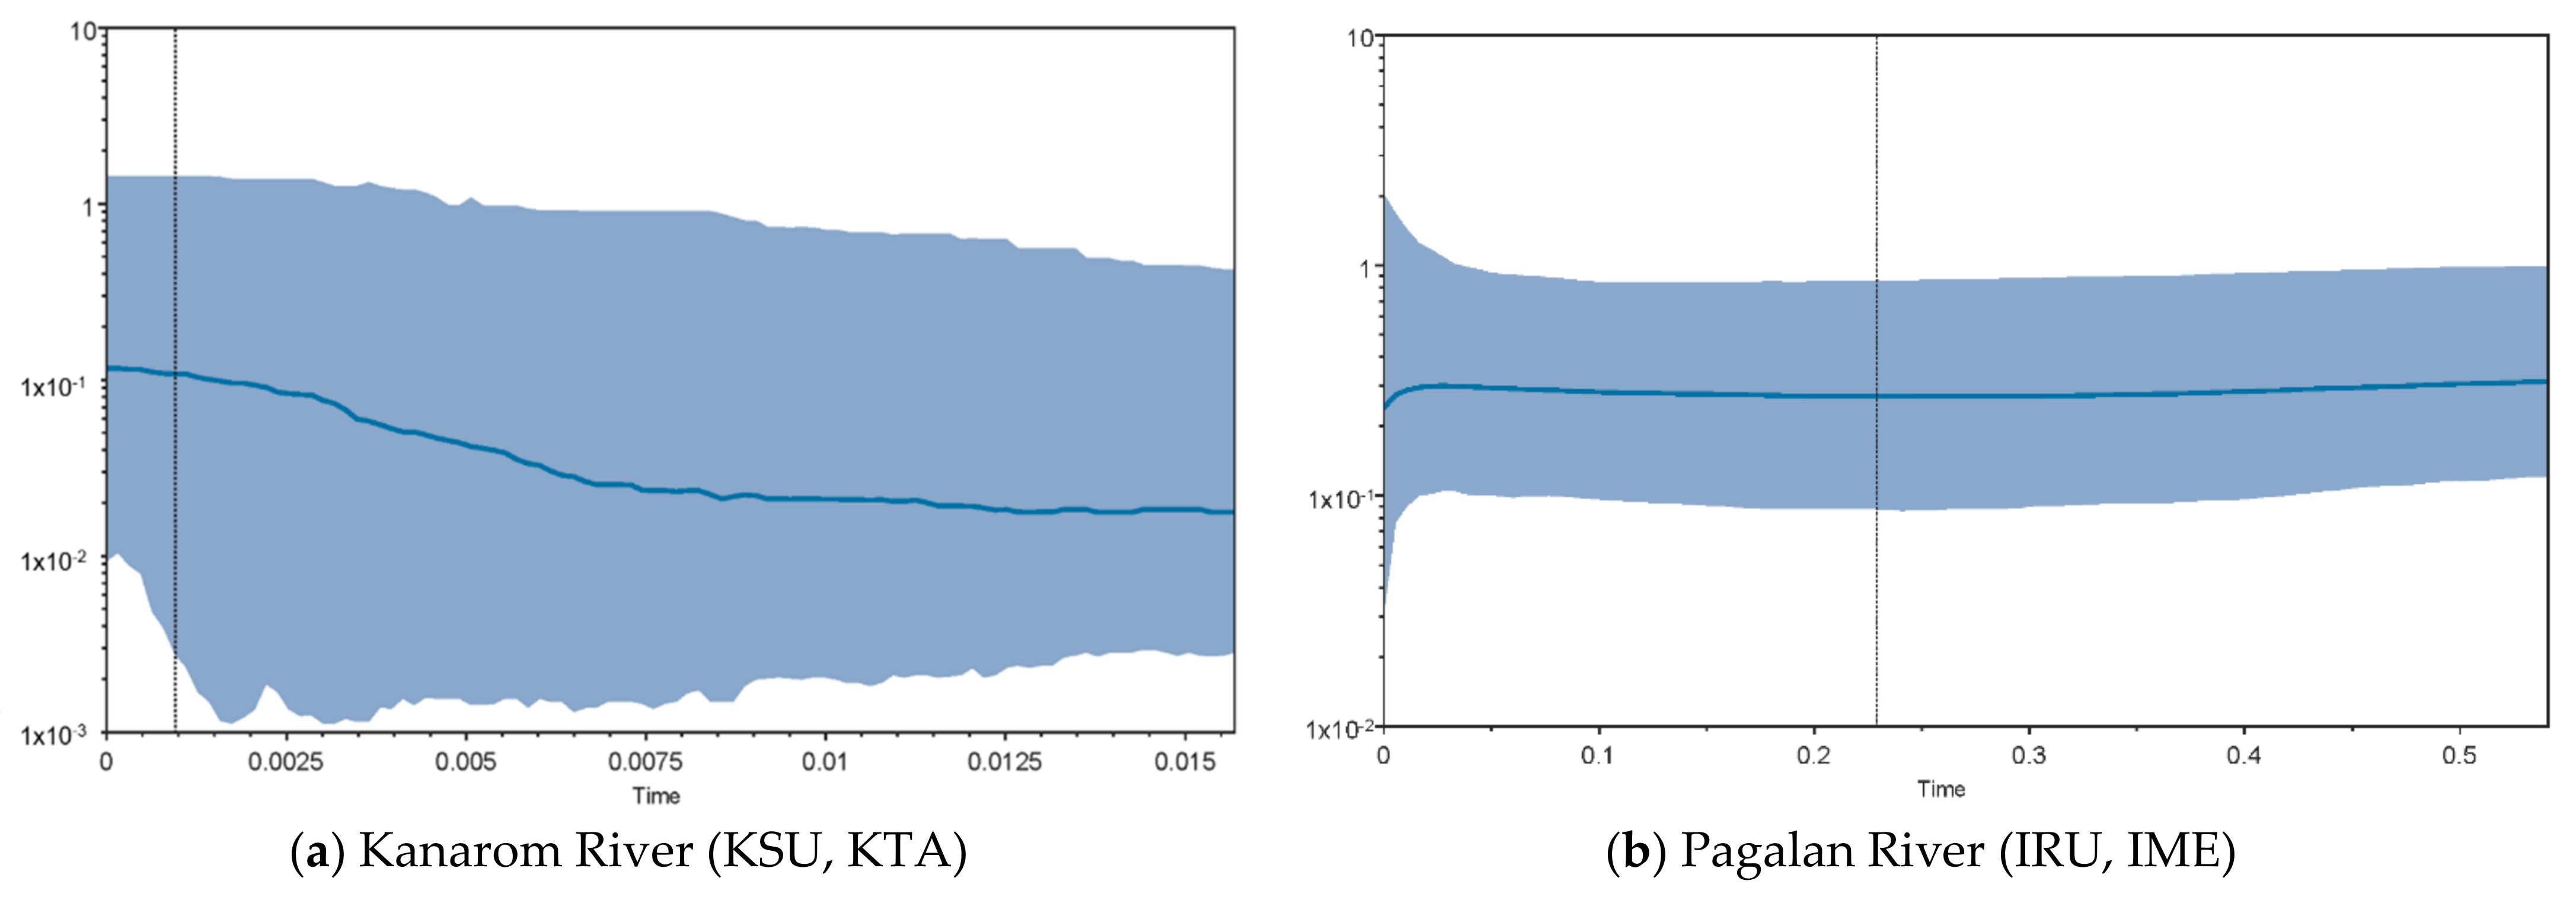
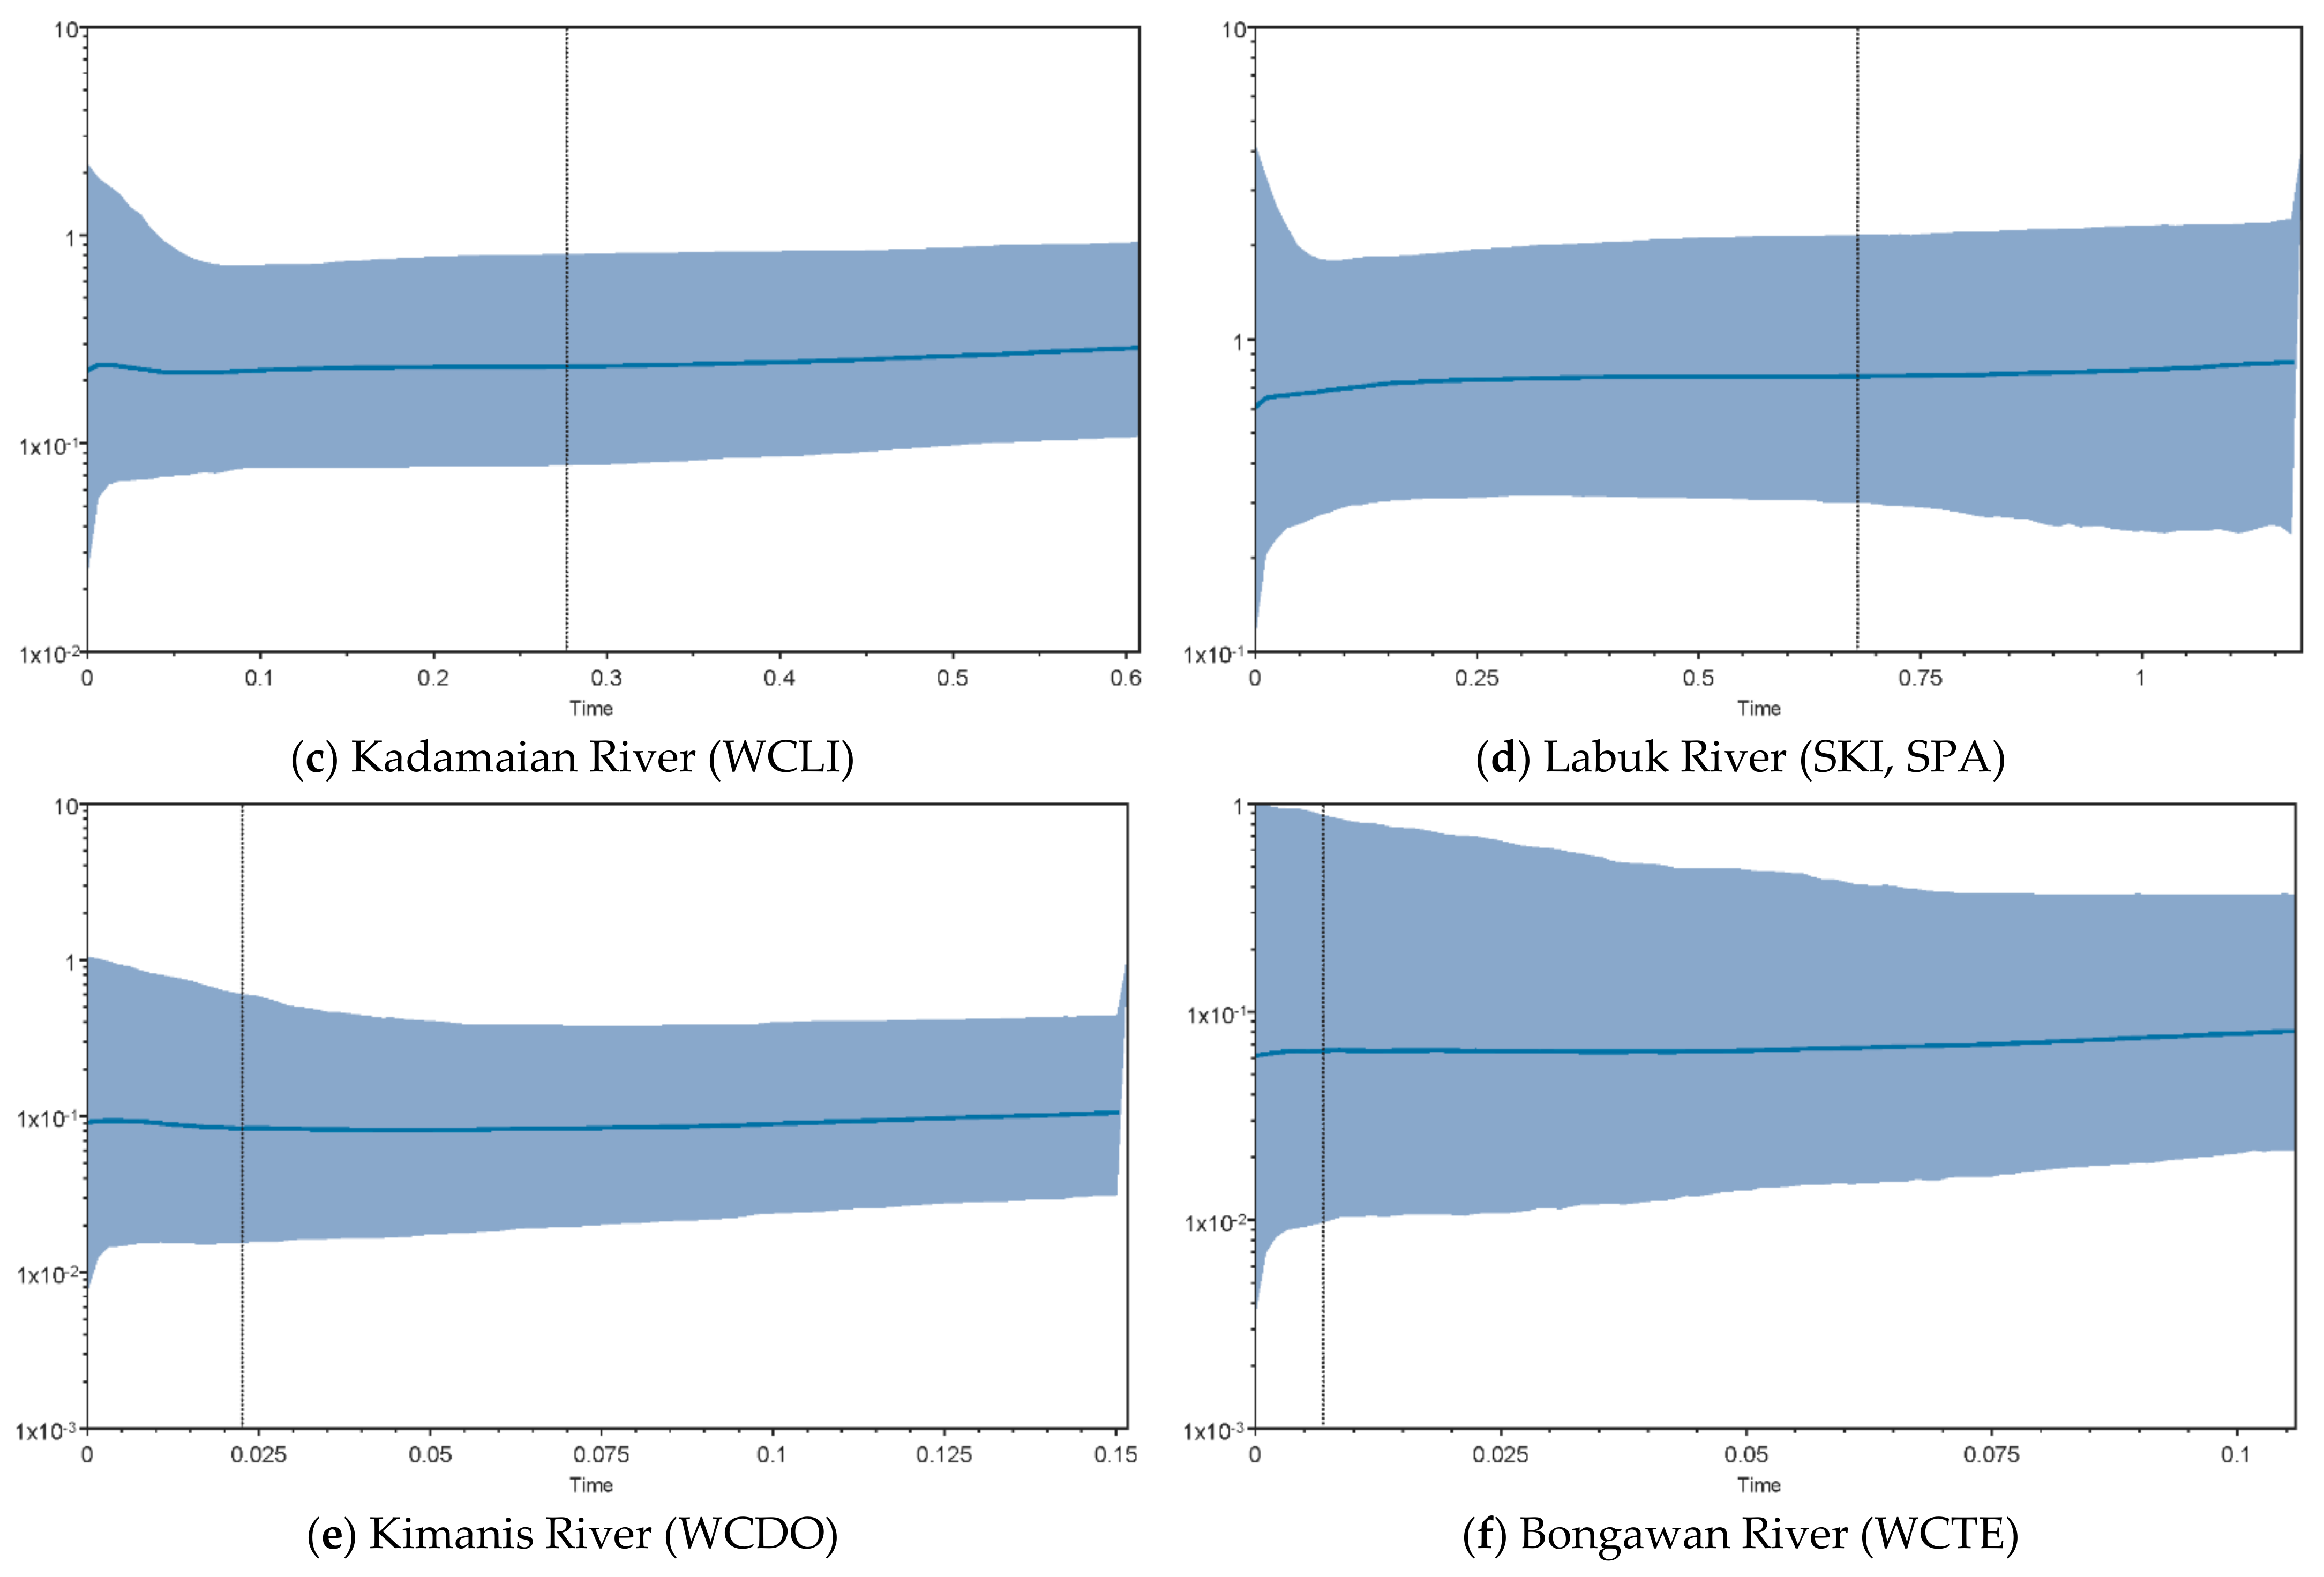
3.4. Demographic History
4. Discussion
4.1. Genetic Diversity and Demography
4.2. Phylogeography and Population Structure
4.3. Management Implications
5. Conclusions
Author Contributions
Funding
Data Availability Statement
Acknowledgments
Conflicts of Interest
References
- Ryder, O.A. Species conservation and systematics: The dilemma of subspecies. Trends Ecol. Evol. 1986, 1, 9–10. [Google Scholar] [CrossRef]
- Crandall, K.A.; Bininda-Emonds, O.R.P.; Mace, G.M.; Wayne, R.K. Considering evolutionary processes in conservation biology. Trends Ecol. Evol. 2000, 15, 290–295. [Google Scholar] [CrossRef]
- Fuller, M.R.; Doyle, M.W.; Strayer, D.L. Causes and consequences of habitat fragmentation in river networks. Ann. N. Y. Acad. Sci. 2015, 1355, 31–51. [Google Scholar] [CrossRef] [PubMed]
- Coates, D.J.; Byrne, M.; Moritz, C. Genetic diversity and conservation units: Dealing with the species-population continuum in the age of genomics. Front. Ecol. Evol. 2018, 6, 165. [Google Scholar] [CrossRef]
- Moritz, C. Defining ‘evolutionarily significant units’ for conservation. Trends Ecol. Evol. 1994, 9, 373–375. [Google Scholar] [CrossRef]
- Funk, D.J.; Omland, K.E. Species-level paraphyly and polyphyly: Frequency, causes, and consequences, with insights from animal mitochondrial DNA. Annu. Rev. Ecol. Evol. Syst. 2003, 34, 397–423. [Google Scholar] [CrossRef]
- Gaveau, D.L.; Sloan, S.; Molidena, E.; Yaen, H.; Sheil, D.; Abram, N.K.; Ancrenaz, M.; Nasi, R.; Quinones, M.; Wielaard, N.; et al. Four decades of forest persistence, clearance and logging on Borneo. PLoS ONE 2014, 9, e101654. [Google Scholar] [CrossRef]
- Ng, C.K. The Application of citizen science approach in an ichthyofaunal survey at tagal sites in upper Moyog River, Sabah, East Malaysia. J. Trop. Biol. Conserv. 2017, 14, 37–53. [Google Scholar]
- Wong, J.Z. Current Information on Inland Capture Fishery in Sabah, Malaysia. In Proceedings of the First Regional Technical Consultation of Information for Inland Capture Fisheries in the Asian Countries, Kuala Lumpur, Malaysia, 4–6 August 2003; pp. 1–11. [Google Scholar]
- Wong, J.Z.; Etoh, S.; Sujang, A.B. Towards Sustainable Community-Based Fishery Resources Management: The Tagal System of Sabah, Malaysia; Southeast Asian Fisheries Development Center: Bangkok, Thailand, 2009; Volume 7, pp. 18–23. [Google Scholar]
- Wilkinson, C.L.; Yeo, D.C.J.; Tan, H.H.; Hadi Fikri, A.; Ewers, R.M. The availability of freshwater fish resources is maintained across a land-use gradient in Sabah, Borneo. Aquat. Conserv. Mar. Freshw. Ecosyst. 2018, 28, 1–11. [Google Scholar] [CrossRef]
- Dudgeon, D.; Arthington, A.H.; Gessner, M.O.; Kawabata, Z.; Knowler, D.J.; Lévêque, C.; Naiman, R.J.; Prieur-Richard, A.H.; Soto, D.; Stiassny, M.L.; et al. Freshwater biodiversity: Importance, threats, status and conservation challenges. Biol. Rev. Camb. Philos. Soc. 2006, 81, 163–182. [Google Scholar] [CrossRef]
- Robert, R.; Amit, N.H.; Sukarno, N.M.; Majapun, R.J.; Kumar, S.V. Population genetic structure of Asian snakehead fish (Channa striata) in North Borneo: Implications for conservation of local freshwater biodiversity. Ecol. Res. 2019, 34, 55–67. [Google Scholar] [CrossRef]
- Hillis, D.M.; Bull, J.J. An empirical test of bootstrapping as a method for assessing confidence in phylogenetic analysis. Syst. Biol. 1993, 42, 182–192. [Google Scholar] [CrossRef]
- Inger, R.F.; Chin, P.K. The Fresh-Water Fishes of North. Borneo; Natural History Publications (Borneo): Sabah, Malaysia, 1962. [Google Scholar]
- Inger, R.F.; Chin, P.K. The Fresh-Water Fishes of North. Borneo—With a Supplementary Chapter by Chin. Phui Kong; Natural History Publications (Borneo): Sabah, Malaysia, 2002; pp. 1–268. [Google Scholar]
- Martin-Smith, K.M.; Tan, H.H. Diversity of freshwater fishes from eastern Sabah: Annotated checklist for Danum Valley and a consideration of inter-and intra-catchment variability. Raffles Bull. Zool. 1998, 46, 573–604. [Google Scholar]
- Kottelat, M. The fishes of the inland waters of Southeast Asia: A catalogue and core bibliography of the fishes known to occur in freshwaters, mangroves and estuaries. Raffles Bull. Zool. 2013, 27, 1–663. [Google Scholar]
- Ng, C.K. Kings of the Rivers: Mahseer in Malaysia and the Region; Inter Sea Fishery: Kuala Lumpur, Malaysia, 2004. [Google Scholar]
- Roberts, T.R. The freshwater fishes of Java, as observed by Kuhl and van Hasselt in 1820–1823. Zool. Verh. 1993, 285, 1–94. [Google Scholar]
- Nguyen, T.T.; Na-Nakorn, U.; Sukmanomon, S.; Ziming, C. A study on phylogeny and biogeography of mahseer species (Pisces: Cyprinidae) using sequences of three mitochondrial DNA gene regions. Mol. Phylogenet. Evol. 2008, 48, 1223–1231. [Google Scholar] [CrossRef]
- Walton, S.E.; Gan, H.M.; Raghavan, R.; Pinder, A.C.; Ahmad, A. Disentangling the taxonomy of the Mahseers (Tor spp.) of Malaysia: An integrated approach using morphology, genetics and historical records. Rev. Fish. Sci. Aquac. 2017, 25, 171–183. [Google Scholar] [CrossRef]
- Pinder, A.C.; Britton, J.R.; Harrison, A.J.; Nautiyal, P.; Bower, S.D.; Cooke, S.J.; Lockett, S.; Everard, M.; Katwate, U.; Ranjeet, K.; et al. Mahseer (Tor spp.) fishes of the world: Status, challenges and opportunities for conservation. Rev. Fish. Biol. Fish. 2019, 29, 417–452. [Google Scholar] [CrossRef]
- Esa, Y.B.; Siraj, S.S.; Daud, S.K.; Rahim, K.A.A.; Japning, J.R.R.; Tan, S.G. Mitochondrial DNA diversity of Tor tambroides Valenciennes (Cyprinidae) from five natural populations in Malaysia. Zool. Stud. 2008, 47, 360–367. [Google Scholar]
- Esa, Y.B.; Siraj, S.S.; Daud, S.K.; Rahim, K.A.A.; Abdullah, M.T.; Japning, J.R.R.; Tan, S.G. Mitochondrial DNA diversity of Tor douronensis Valenciennes (Cyprinidae) in Malaysian Borneo. Pertanika J. Trop. Agric. Sci. 2006, 29, 47–55. [Google Scholar]
- Nguyen, T.T.T.; Ingram, B.A.; Sungan, S.; Gooley, G.; Sim, S.Y.; Tinggi, D.; De Silva, S.S. Mitochondrial DNA diversity of broodstock of two indigenous mahseer species, Tor tambroides and T. douronensis (Cyprinidae) cultured in Sarawak, Malaysia. Aquaculture 2006, 253, 259–269. [Google Scholar] [CrossRef]
- WWF Bhutan; Ministry of Agriculture and Forests; Fisheries Conservation Foundation. In Proceedings of the First International Mahseer Conference, Paro, Bhutan, 2–9 December 2018; Philipp, D., Wangchuk, K., Choden, S., Eds.; WWF Bhutan: Thimphu, Bhutan, 2018; pp. 1–106.
- Sabah State Government. Native Courts Enactment 1992: Natives Courts (Native Customary Laws) Rules 1995; Sabah State Legislative Assembly: Sabah, Malaysia, 1995; pp. 1–33.
- Sabah State Government. Sabah Inland Fisheries and Aquaculture Enactment 2003; Sabah State Legislative Assembly: Sabah, Malaysia, 2003; pp. 1–69.
- Funge-Smith, S.; Bennett, A. A fresh look at inland fisheries and their role in food security and livelihoods. Fish. Fish. 2019, 20, 1176–1195. [Google Scholar] [CrossRef]
- Ingram, B.; Sungan, S.; Tinggi, D.; Sim, S.Y.; De Silva, S.S. Breeding performance of Malaysian mahseer, Tor tambroides and T. douronensis broodfish in captivity. Aquac. Res. 2007, 38, 809–818. [Google Scholar] [CrossRef]
- Michael, M.A. Genetic Characterization of Wild Population of Mahseer (Tor douronensis) from Sabah Using Microsatellite Markers. Bachelor’s Thesis, Universiti Malaysia Sabah, Kota Kinabalu, Malaysia, 21 September 2012. [Google Scholar]
- Nguyen, T.T.T. Population structure in the highly fragmented range of Tor douronensis (Cyprinidae) in Sarawak, Malaysia revealed by microsatellite DNA markers. Freshw. Biol. 2008, 53, 924–934. [Google Scholar] [CrossRef]
- Esa, Y.B.; Siraj, S.S.; Rahim, K.A.A.; Daud, S.K.; Ho, G.C.; Tan, S.G.; Syukri, M.F. Genetic characterization of two mahseer species (Tor douronensis and Tor tambroides) using microsatellite markers from other cyprinids. Sains Malays. 2011, 40, 1087–1095. [Google Scholar]
- Castello, L.; Arantes, C.C.; Mcgrath, D.G.; Stewart, D.J.; De Sousa, F.S. Understanding fishing-induced extinctions in the Amazon. Aquat. Conserv. Mar. Freshw. Ecosyst. 2014, 25, 587–598. [Google Scholar] [CrossRef]
- Laikre, L.; Allendorf, F.W.; Aroner, L.C.; Baker, C.S.; Gregovich, D.P.; Hansen, M.M.; Jackson, J.A.; Kendall, K.C.; McKelvey, K.; Neel, M.C.; et al. Neglect of genetic diversity in implementation of the convention on biological diversity. Conserv. Biol. 2010, 24, 86–88. [Google Scholar] [CrossRef]
- McElhany, P.; Ruckelshaus, M.H.; Ford, M.J.; Wainwright, T.C.; Bjorkstedt, E.P. Viable Salmonid Populations and the Recovery of Evolutionarily Significant Units; U.S. Department of Commerce: Washington, DC, USA, 2000; pp. 1–174. [Google Scholar]
- Palsbøll, P.J.; Martine, B.; Allendorf, F.W. Identification of management units using population genetic data. Trends Ecol. Evol. 2006, 22, 11–16. [Google Scholar] [CrossRef]
- Galtier, N.; Nabholz, B.; Glémin, S.; Hurst, G.D.D. Mitochondrial DNA as a marker of molecular diversity: A reappraisal. Mol. Ecol. 2009, 18, 4541–4550. [Google Scholar] [CrossRef]
- Avise, J.C.; Arnold, J.; Ball, R.M.; Bermingham, E.; Lamb, T.; Neigel, J.E.; Reeb, C.A.; Saunders, N.C. Intraspecific phylogeography: The mitochondrial DNA bridge between population genetics and systematics. Annu. Rev. Ecol. Evol. Syst. 1987, 18, 489–522. [Google Scholar] [CrossRef]
- Mohammad Mohsin, A.K.; Ambak, M.A. Freshwater Fishes of Peninsular Malaysia; Percetakan Asni: Kuala Lumpur, Malaysia, 1992. [Google Scholar]
- Plasterer, T.N. PRIMERSELECT: Primer and probe design. Methods Mol. Biol. 1997, 70, 291–302. [Google Scholar]
- Burland, T.G. DNASTAR’s Lasergene Sequence Analysis Software. In Bioinformatics Methods and Protocols, Methods in Molecular Biology; Misener, S., Krawetz, S.A., Eds.; Humana Press: Totowa, NJ, USA, 2000; Volume 132. [Google Scholar] [CrossRef]
- Kumar, S.; Stecher, G.; Li, M.; Knyaz, C.; Tamura, K. MEGA X: Molecular evolutionary genetics analysis across computing platforms. Mol. Biol. Evol. 2018, 35, 1547–1549. [Google Scholar] [CrossRef] [PubMed]
- Khare, P.; Mohindra, V.; Barman, A.S.; Singh, R.K.; Lal, L.L. Molecular evidence to reconcile taxonomic instability in Mahseer species (Pisces: Cyprinidae) of India. Org. Div. Evol. 2014, 14, 307–326. [Google Scholar] [CrossRef]
- Rozas, J.; Ferrer-Mata, A.; Sanchez-DelBarrio, J.C.; Guirao-Rico, S.; Librado, P.; Ramos-Onsins, S.E.; Sanchez-Gracia, A. DnaSP 6: DNA sequence polymorphism analysis of large data sets. Mol. Biol. Evol. 2017, 34, 3299–3302. [Google Scholar] [CrossRef] [PubMed]
- Tamura, K. Estimation of the number of nucleotide substitutions when there are strong transition-transversion and G+ C-content biases. Mol. Biol. Evol. 1992, 9, 678–687. [Google Scholar] [CrossRef]
- Saitou, N.; Nei, M. The meighbor-joining method: A new method for reconstructing phylogenetic trees. Mol. Biol. Evol. 1987, 4, 406–425. [Google Scholar] [CrossRef]
- Suchard, M.; Lemey, P.; Baele, G.; Ayres, D.; Drummond, A.; Rambaut, A. Bayesian phylogenetic and phylodynamic data integration using BEAST 1.10. Virus Evol. 2018, 4, 1–5. [Google Scholar] [CrossRef]
- Luo, A.; Qiao, H.; Zhang, Y.; Shi, W.; Ho, S.Y.; Xu, W.; Zhang, A.; Zhu, C. Performance of criteria for selecting evolutionary models in phylogenetics: A comprehensive study based on simulated datasets. BMC Evol. Biol. 2010, 10, 242. [Google Scholar] [CrossRef] [PubMed]
- Felsenstein, J. Confidence limits on phylogenies: An approach using the bootstrap. Evolution 1985, 39, 783–791. [Google Scholar] [CrossRef]
- Burridge, C.P.; Craw, D.; Fletcher, D.; Waters, J.M. Geological dates and molecular rates: Fish DNA sheds light on time dependency. Mol. Biol. Evol. 2007, 25, 624–633. [Google Scholar] [CrossRef]
- Rambaut, A.; Drummond, A.J.; Xie, D.; Baele, G.; Suchard, M.A. Posterior summarization in Bayesian phylogenetics using Tracer 1.7. Syst. Biol. 2018, 67, 901–904. [Google Scholar] [CrossRef] [PubMed]
- Rambaut, A. FigTree v1.4.4 Institute of Evolutionary Biology, University of Edinburgh, Edinburgh. Available online: http://tree.bio.ed.ac.uk/software/figtree/ (accessed on 26 August 2021).
- Clement, M.; Posada, D.; Crandall, K.A. TCS: A computer program to estimate gene genealogies. Mol. Ecol. 2000, 9, 1657–1659. [Google Scholar] [CrossRef] [PubMed]
- Leigh, J.W.; Jessica, W.; Bryant, D. PopART: Full-feature software for haplotype network construction. Methods Ecol. Evol. 2015, 6, 1110–1116. [Google Scholar] [CrossRef]
- Excoffier, L.; Lischer, H.E.L. Arlequin suite ver 3.5: A new series of programs to perform population genetics analyses under Linux and Windows. Mol. Ecol. Res. 2010, 10, 564–567. [Google Scholar] [CrossRef]
- Peakall, R.; Smouse, P.E. GenALEx v 6.5: Genetic analysis in excel. population genetic software for teaching and research-an update. Bioinformatics 2012, 28, 2537–2539. [Google Scholar] [CrossRef]
- Excoffier, L.; Smouse, P.E.; Quattro, J.M. Analysis of molecular variance inferred from metric distances among DNA haplotypes: Application to human mitochondrial DNA restriction data. Genetics 1992, 131, 479–491. [Google Scholar] [CrossRef] [PubMed]
- Corander, J.; Marttinen, P.; Sirén, J.; Tang, J. Enhanced Bayesian modelling in BAPS software for learning genetic structures of populations. BMC Bioinform. 2008, 9, 1–14. [Google Scholar] [CrossRef]
- Fu, Y.X.; Li, W.H. Statistical tests of neutrality of mutations. Genetics 1993, 133, 693–709. [Google Scholar] [CrossRef] [PubMed]
- Fu, Y.X. Statistical tests of neutrality of mutations against population growth, hitchhiking and background selection. Genetics 1997, 147, 915–925. [Google Scholar] [CrossRef]
- Ramos-Onsins, S.E.; Rozas, J. Statistical properties of new neutrality tests against population growth. Mol. Biol. Evol. 2002, 19, 2092–2100. [Google Scholar] [CrossRef]
- Ramírez-Soriano, A.; Ramos-Onsins, S.E.; Rozas, J.; Calafell, F.; Navarro, A. Statistical power analysis of neutrality tests under demographic expansions, contractions and bottlenecks with recombination. Genetics 2008, 179, 555–567. [Google Scholar] [CrossRef] [PubMed]
- Drummond, A.J.; Rambaut, A.; Shapiro, B.; Pybus, O.G. Bayesian coalescent inference of past population dynamics from molecular sequences. Mol. Biol. Evol. 2005, 22, 1185–1192. [Google Scholar] [CrossRef] [PubMed]
- Drummond, A.J.; Rambaut, A. BEAST: Bayesian evolutionary analysis by sampling trees. BMC Evol. Biol. 2007, 7, 1–8. [Google Scholar] [CrossRef]
- Heller, R.; Chikhi, L.; Siegismund, H.R. The confounding effect of population structure on Bayesian skyline plot inferences of demographic history. PLoS ONE 2013, 8, e62992. [Google Scholar] [CrossRef] [PubMed]
- Sah, P.; Mandal, S.; Singh, R.K.; Kumar, R.; Pathak, A.; Dutta, N.; Srivastava, J.K.; Saini, V.P.; Lal, K.K.; Mohindra, V. Genetic structure of natural populations of endangered Tor Mahseer, Tor Tor (Hamilton, 1822) inferred from two mitochondrial DNA markers. Meta Gene 2020, 23, 100635. [Google Scholar] [CrossRef]
- Liew, T.-S.; Marzuki, M.E.; Schilthuizen, M.; Chen, Y.; Vermeulen, J.J.; Mohd-Azlan, J. Molecular phylogenetics and evolutionary history of the endemic land snail genus Everettia in northern Borneo. PeerJ 2020, 8, e9416. [Google Scholar] [CrossRef] [PubMed]
- Sheldon, F.H. On the biogeography of Sabah’s rainforest birds. Sabah Soc. J. 2016, 33, 31–33. [Google Scholar]
- Camelier, P.N.; Menezes, N.A.; Costa-Silva, G.J.; Oliveira, C. Molecular and morphological data of the freshwater fish Glandulocauda Melanopleura (Characiformes: Characidae) provide evidences of river captures and local differentiation in the Brazilian atlantic forest. PLoS ONE 2018, 13, e0194247. [Google Scholar] [CrossRef]
- Huang, X.X.; Hsu, K.C.; Kang, B.; Kuo, P.H.; Tsai, W.H.; Liang, C.M.; Lin, H.D.; Wang, W.K. Population structure of Aphyocypris Normalis: Phylogeography and systematics. ZooKeys 2019, 872, 77–90. [Google Scholar] [CrossRef] [PubMed]
- Negi, R.K.; Joshi, B.D.; Johnson, J.A.; De Goyal, S.P.R. Phylogeography of freshwater fish Puntius Sophore in India. Mitochondrial DNA Part A 2018, 29, 256–265. [Google Scholar] [CrossRef]
- Thomaz, A.T.; Malabarba, L.R.; Knowles, L.L. Genomic signatures of Paleodrainages in a freshwater fish along the southeastern coast of Brazil: Genetic structure reflects past riverine properties. Heredity 2017, 119, 287–294. [Google Scholar] [CrossRef] [PubMed]
- Tzeng, C.S.; Lin, Y.S.; Lin, S.M.; Wang, T.Y.; Wang, F.Y. The Phylogeography and population demographics of selected freshwater. Zool. Stud. 2006, 45, 285–297. [Google Scholar]
- Tongkul, F.; Benedick, H.; Chang, F.K. Geology of slopes in the Crocker Range Mountain, Sabah, Malaysia. Nepal Geol. Soc. 2006, 34, 73–80. [Google Scholar] [CrossRef]
- Hall, R. Contraction and extension in Northern Borneo driven by subduction rollback. J. Asian Earth Sci. 2013, 76, 399–411. [Google Scholar] [CrossRef]
- Meffe, G.K.; Vrijenhoek, R.C. Conservation genetics in the management of desert fishes. Conserv. Biol. 1988, 2, 157–169. [Google Scholar] [CrossRef]
- Ward, R.D. The importance of identifying spatial population structure in restocking and stock enhancement programmes. Fish. Res. 2006, 80, 9–18. [Google Scholar] [CrossRef]
- Huey, J.A.; Baker, A.M.; Hughes, J.M. High levels of genetic structure in the Australian freshwater fish, Ambassis macleayi. J. N. Am. Benthol. Soc. 2010, 29, 1148–1160. [Google Scholar] [CrossRef]
- Huey, J.; Baker, A.; Hughes, J. The effect of landscape processes upon gene flow and genetic diversity in an Australian freshwater fish, Neosilurus hyrtlii. Freshw. Biol. 2008, 53, 1393–1408. [Google Scholar] [CrossRef]
- Hughes, J.M.; Schmidt, D.J.; Finn, D.S. Genes in Streams: Using DNA to understand the movement of freshwater fauna and their riverine habitat. BioScience 2009, 59, 573–583. [Google Scholar] [CrossRef]
- Paixão, R.V.; Ribolli, J.; Zaniboni-Filho, E. Genetic variation of the endangered neotropical catfish Steindachneridion scriptum (Siluriformes: Pimelodidae). Front. Genet. 2018, 9, 48. [Google Scholar] [CrossRef] [PubMed]
- Watson, L.C.; Stewart, D.J.; Kretzer, A.M. Genetic diversity and population structure of the threatened giant Arapaima in Southwestern Guyana: Implications for their conservation. Copeia 2016, 104, 864–867. [Google Scholar] [CrossRef]
- Crookes, S.; Shaw, P.W. Isolation by distance and non-identical patterns of gene flow within two river populations of the freshwater fish Rutilus rutilus (L. 1758). Conserv. Genet. 2016, 17, 861–874. [Google Scholar] [CrossRef] [PubMed]
- Torterotot, J.B.; Perrier, C.; Bergeron, N.E.; Bernatchez, L. Influence of forest road culverts and waterfalls on the fine-scale distribution of Brook Trout genetic diversity in a Boreal watershed. Trans. Am. Fish. Soc. 2014, 143, 577–591. [Google Scholar] [CrossRef]
- Hand, B.K.; Muhlfeld, C.C.; Wade, A.A.; Kovach, R.P.; Whited, D.C.; Narum, S.R.; Matala, A.P.; Ackerman, M.W.; Garner, B.A.; Kimball, J.S.; et al. Climate variables explain neutral and adaptive variation within salmonid metapopulations: The importance of replication in landscape genetics. Mol. Ecol. 2016, 25, 689–705. [Google Scholar] [CrossRef]
- Brauer, C.J.; Hammer, M.P.; Beheregaray, L.B. Riverscape genomics of a threatened fish across a hydroclimatically heterogeneous river basin. Mol. Ecol. 2016, 25, 5093–5113. [Google Scholar] [CrossRef] [PubMed]
- Davis, C.D.; Epps, C.W.; Flitcroft, R.L.; Banks, M.A. Refining and defining riverscape genetics: How rivers influence population genetic structure. Wiley Interdiscip. Rev. Water 2018, 5, e1269. [Google Scholar] [CrossRef]
- Larson, P.H.; Meek, N.; Douglass, J.; Dorn, R.I.; Seong, Y.B. How rivers get across mountains: Transverse drainages. Ann. Am. Assoc. Geogr. 2017, 107, 274–283. [Google Scholar] [CrossRef]
- Jaisuk, C.; Senanan, W. Effects of landscape features on population genetic variation of a tropical stream fish, Stone lapping minnow, Garra Cambodgiensis, in the upper Nan River drainage basin, northern Thailand. PeerJ 2018, 6, e4487. [Google Scholar] [CrossRef] [PubMed]
- Menier, D.; Mathew, M.; Pubellier, M.; Sapin, F.; Delcaillau, B.; Siddiqui, N.; Ramkumar, M.; Santosh, M. Landscape response to progressive tectonic and climatic forcing in NW Borneo: Implications for geological and geomorphic controls on flood hazard. Sci. Rep. 2017, 7, 1–18. [Google Scholar] [CrossRef]
- Jarrett, A.; Stiles, W.; Janosik, A.; Blanton, R.; Johnston, C. Evidence of stream capture from the Tallapoosa River drainage by a Chattahoochee River tributary based on fish distributions. Southeast. Nat. 2017, 16, 117–126. [Google Scholar] [CrossRef]
- Waters, J.M.; Burridge, C.P. River capture and freshwater biological evolution: A review of galaxiid fish vicariance. Diversity 2020, 12, 216. [Google Scholar] [CrossRef]
- Sati, J.; Kumar, R.; Sahoo, P.K.; Patiyal, R.S.; Ali, S.; Barat, A. Genetic characterization of Golden Mahseer (Tor Putitora) populations using mitochondrial DNA markers. Mitochondrial DNA 2015, 26, 68–74. [Google Scholar] [CrossRef]
- Ovenden, J.R.; Berry, O.; Welch, D.J.; Buckworth, R.C.; Dichmont, C.M. Ocean’s eleven: A critical evaluation of the role of population, evolutionary and molecular genetics in the management of wild fisheries. Fish. Fish. 2015, 16, 125–159. [Google Scholar] [CrossRef]
- Fraser, D.; Bernatchez, L. Adaptive evolutionary conservation: Towards a unified concept for defining conservation units. Mol. Ecol. 2001, 10, 2741–2752. [Google Scholar] [CrossRef]
- Hsu, T.H.; Huang, C.W.; Lee, H.T.; Kuo, Y.H.; Liu, K.M.; Lin, C.H.; Gong, H.Y. Population genetic analysis for stock enhancement of silver sea bream (Rhabdosargus sarba) in Taiwan. Fishes 2020, 5, 19. [Google Scholar] [CrossRef]
- Wenne, R.; Bernas, R.; Poćwierz-Kotus, A.; Drywa, A.; Was, A. Recent genetic changes in enhanced populations of sea trout (Salmo Trutta m. Trutta) in the Southern Baltic Rivers revealed with SNP analysis. Aquat. Living Resour. 2016, 29, 103. [Google Scholar] [CrossRef][Green Version]
- Kapuscinski, A.R.; Miller, L.M. Genetic Guidelines for Fisheries Management; University of Minnesota: Minneapolis, MN, USA, 2007. [Google Scholar]
- Shechonge, A.; Ngatunga, B.P.; Tamatamah, R.; Bradbeer, S.J.; Harrington, J.; Ford, A.G.P.; Turner, G.F.; Genner, M.J. Losing cichlid fish biodiversity: Genetic and morphological homogenization of tilapia following colonization by introduced species. Conserv. Genet. 2018, 19, 1199–1209. [Google Scholar] [CrossRef]
- Bernatchez, L. On the maintenance of genetic variation and adaptation to environmental change: Considerations from population genomics in fishes. J. Fish. Biol. 2016, 89, 2519–2556. [Google Scholar] [CrossRef]
- Harrisson, K.A.; Pavlova, A.; Telonis-Scott, M.; Sunnucks, P. Using genomics to characterize evolutionary potential for conservation of wild populations. Evol. Appl. 2014, 7, 1008–1025. [Google Scholar] [CrossRef]
- Scoble, J.; Lowe, A.J. A case for incorporating Phylogeography and landscape genetics into species distribution modelling approaches to improve climate adaptation and conservation planning. Divers. Distrib. 2010, 16, 343–353. [Google Scholar] [CrossRef]
- Li, X.Y.; Deng, Y.P.; Yang, K.; Gan, W.X.; Zeng, R.; Deng, L.J.; Song, Z.B. Genetic diversity and structure analysis of Percocypris Pingi (Cypriniformes: Cyprinidae): Implications for conservation and hatchery release in the Yalong River. PLoS ONE 2016, 11, e0166769. [Google Scholar] [CrossRef] [PubMed]
- Sloan, D.; Havird, J.; Sharbrough, J. The on-again, off-again relationship between mitochondrial genomes and species boundaries. Mol. Ecol. 2017, 26, 2212–2236. [Google Scholar] [CrossRef]
- Abdul-Muneer, P.M. Application of microsatellite markers in conservation genetics and fisheries management: Recent advances in population structure analysis and conservation srategies. Genet. Res. Int. 2014, 2014, 691759. [Google Scholar] [CrossRef] [PubMed]
- Maqsood, H.M.; Ahmad, S.M. Advances in molecular markers and their applications in aquaculture and fisheries. Gen. Aqua. Org. 2017, 1, 27–41. [Google Scholar] [CrossRef]


| Locality | n | h | Haplotype Designation (Individual Number) | S | π | Hd |
|---|---|---|---|---|---|---|
| Kanarom River | ||||||
| KMP | 10 | 1 | Hap1 (10) | 0 | 0.000 | 0.000 |
| KSU | 10 | 2 | Hap1 (9), Hap26 (1) | 1 | 0.000 | 0.200 |
| KTA | 8 | 2 | Hap1 (7), Hap27 (1) | 1 | 0.001 | 0.250 |
| KSO | 10 | 1 | Hap1 (10) | 0 | 0.000 | 0.000 |
| Sugut River | ||||||
| SLU | 10 | 1 | Hap19 (10) | 0 | 0.000 | 0.000 |
| SPO | 10 | 1 | Hap19 (10) | 0 | 0.000 | 0.000 |
| Labuk River | ||||||
| SKI | 10 | 6 | Hap12 (1), Hap13 (1), Hap14 (3), Hap15 (3), Hap16 (1), Hap17 (1) | 21 | 0.021 | 0.800 |
| SPA | 10 | 7 | Hap17 (3), Hap20 (1), Hap21 (1), Hap22 (2), Hap23 (1), Hap24 (1), Hap25 (1) | 26 | 0.023 | 0.911 |
| Kinabatangan River | ||||||
| SKIR | 10 | 1 | Hap18 (10) | 0 | 0.000 | 0.000 |
| SPI | 10 | 1 | Hap18 (10) | 0 | 0.000 | 0.000 |
| Pagalan River | ||||||
| IRU | 10 | 4 | Hap6 (6), Hap11 (1), Hap34 (1), Hap35 (2) | 5 | 0.003 | 0.644 |
| IME | 9 | 6 | Hap6 (4), Hap7 (1), Hap8 (1), Hap9 (1), Hap10 (1), Hap11 (1) | 13 | 0.008 | 0.833 |
| Kadamaian River | ||||||
| WCTO | 9 | 1 | Hap3 (9) | 0 | 0.000 | 0.000 |
| WCLI | 7 | 4 | Hap3 (4), Hap31 (1), Hap32 (1), Hap33 (1) | 13 | 0.009 | 0.714 |
| Tuaran River | ||||||
| WCGO | 10 | 1 | Hap2 (10) | 0 | 0.000 | 0.000 |
| Moyog River | ||||||
| WCBA | 10 | 1 | Hap2 (10) | 0 | 0.000 | 0.000 |
| Kimanis River | ||||||
| WCDO | 10 | 3 | Hap28 (4), Hap29 (5), Hap30 (1) | 4 | 0.004 | 0.644 |
| Bongawan River | ||||||
| WCTE | 10 | 2 | Hap4 (9), Hap5 (1) | 3 | 0.001 | 0.200 |
| Source of Variation | % of Variation | Φ Statistics |
|---|---|---|
| Grouped by 8 rivers (Kanarom/Sugut/Labuk/Kinabatangan/Pagalan/Kadamaian/Tuaran + Moyog/Kimanis + Bongawan) | ||
| Among 8 groups | 95.29 | Φct = 0.956 |
| Among 18 populations within 8 groups | 0.41 | Φsc = 0.001 |
| Within 18 populations | 4.30 | Φst = 0.956 |
| Grouped by 10 rivers (Kanarom/Sugut/Labuk/Kinabatangan/Pagalan/Kadamaian/Tuaran/Moyog/Kimanis/Bongawan) | ||
| Among 10 groups | 95.63 | Φct = 0.956 |
| Among 18 populations within 10 groups | 0.01 | Φsc = 0.001 |
| Within 18 populations | 4.37 | Φst = 0.956 |
| Grouped by 2 clades (western/central + eastern) | ||
| Among 2 groups | 58.34 | Φct = 0.583 |
| Among 18 populations within 2 groups | 38.44 | Φsc = 0.923 |
| Within 18 populations | 3.21 | Φst = 0.968 |
| Grouped by 3 clades (western/central/eastern) | ||
| Among 3 groups | 73.77 | Φct = 0.953 |
| Among 18 populations within 3 groups | 22.94 | Φsc = 0.875 |
| Within 18 populations | 3.29 | Φst = 0.957 |
| Grouped by 4 clades (northwestern/southwestern/central/eastern) | ||
| Among 4 groups | 81.19 | Φct = 0.812 |
| Among 18 populations within 4 groups | 15.48 | Φsc = 0.823 |
| Within 18 populations | 3.33 | Φst = 0.967 |
| Population Comparisons | No. of Populations | No. of Groups | Φst | Φct | Φsc |
|---|---|---|---|---|---|
| Within Eastern | 10 | 1 | 0.81451 | ||
| Within Central | 2 | 1 | −0.03271 | ||
| Within Northwestern | 4 | 1 | 0.93037 | ||
| Within Southwestern | 2 | 1 | 0.60349 | ||
| Between Eastern and Central | 12 | 2 | 0.95987 | 0.80554 | |
| Between Eastern and Northwestern | 14 | 2 | 0.96731 | 0.62898 | 0.91188 |
| Between Eastern and Southwestern | 12 | 2 | 0.96648 | 0.64202 | 0.90636 |
| Between Central and Northwestern | 6 | 2 | 0.97096 | 0.81383 | 0.84399 |
| Between Central and Southwestern | 4 | 2 | 0.96448 | 0.94703 | 0.32938 |
| Between Northwestern and Southwestern | 4 | 2 | 0.97169 | 0.73008 | 0.89511 |
| Among Eastern, Central, Northwestern, Southwestern | 18 | 4 | 0.96666 | 0.81187 | 0.82279 |
Publisher’s Note: MDPI stays neutral with regard to jurisdictional claims in published maps and institutional affiliations. |
© 2021 by the authors. Licensee MDPI, Basel, Switzerland. This article is an open access article distributed under the terms and conditions of the Creative Commons Attribution (CC BY) license (https://creativecommons.org/licenses/by/4.0/).
Share and Cite
Biun, H.; Sade, A.; Robert, R.; Rodrigues, K.F. Phylogeographic Structure of Freshwater Tor sp. in River Basins of Sabah, Malaysia. Fishes 2021, 6, 44. https://doi.org/10.3390/fishes6040044
Biun H, Sade A, Robert R, Rodrigues KF. Phylogeographic Structure of Freshwater Tor sp. in River Basins of Sabah, Malaysia. Fishes. 2021; 6(4):44. https://doi.org/10.3390/fishes6040044
Chicago/Turabian StyleBiun, Helena, Ahemad Sade, Rolando Robert, and Kenneth Francis Rodrigues. 2021. "Phylogeographic Structure of Freshwater Tor sp. in River Basins of Sabah, Malaysia" Fishes 6, no. 4: 44. https://doi.org/10.3390/fishes6040044
APA StyleBiun, H., Sade, A., Robert, R., & Rodrigues, K. F. (2021). Phylogeographic Structure of Freshwater Tor sp. in River Basins of Sabah, Malaysia. Fishes, 6(4), 44. https://doi.org/10.3390/fishes6040044