Article

Nonstationary Responses of Demersal Fishes to Environmental Variations in Temperate Waters of the Northwestern North Pacific under a Changing Climate

1
College of Fisheries, Ocean University of China, Qingdao 266100, China
2
Institute of Marine Science and Technology, Shandong University, Qingdao 266237, China
*
Authors to whom correspondence should be addressed.
Fishes 2021, 6(3), 22; https://doi.org/10.3390/fishes6030022
Submission received: 21 May 2021 / Revised: 8 July 2021 / Accepted: 16 July 2021 / Published: 22 July 2021
(This article belongs to the Special Issue Sustainable Aquaculture and Fisheries)

Abstract

:
Although nonstationarity in marine ecosystems has attracted great attention, the nonstationary responses of demersal fishes to environmental variations induced by the changing climate are still not well understood. Here, we collected 21 time series of demersal fishes from 1956 to 2015 to investigate the climate-induced nonstationary responses in temperate waters of the northwestern North Pacific (NWP). We showed that these demersal fishes experienced state shifts in approximately 1986/87, accompanied by abrupt warming over this region. Moreover, the relationships between demersal fishes and sea surface temperature (SST) were found to change between the two identified eras (i.e., a weak relationship before 1986 and a strong negative relationship after 1986), which may be primarily caused by the alternating dominance of the East Asian winter monsoon and mega-ENSO on SST in temperate waters of the NWP. The identified climate-induced nonstationary responses of demersal fishes to SST variability in this study may provide implications for understanding climate-induced biological dynamics, predicting demersal fish fluctuations, coping with potential ecological risks, and the sustainable exploitation of fishery resources in the future climate. Note that the impact of fishing on the demersal fishes in temperate waters of the NWP was not assessed in this study due to the lack of fishing effort data and therefore the conclusions of our research should be approached with caution.

1. Introduction

With accelerating climate change, nonstationarity in marine ecosystems has received growing attention in the past few years [1,2,3,4]. The nonstationary features present in ecological responses to environmental variations that occur due to climate change, which have frequently occurred in the past and will continue to develop in the future and pose great challenges in understanding and predicting ecological dynamics as well as in the forewarning of potential ecological risks [3,5,6]. On the other hand, these nonstationary responses also bring us opportunities to predict ecological responses in communities and ecosystems in a changing climate by elucidating how climate-induced nonstationary environments structure ecological communities [4]. Therefore, it is imperative to enhance our understanding of nonstationarity in both drivers (e.g., climate forcings) and ecological responses, as this understanding would further lay the foundation for ecosystem-based fisheries management [3,4,5,7,8].
Generally, a process with a constant probability density over time is deemed stationary. Conversely, a process is nonstationary if its probability density is time-dependent [9]. The physical variables used for climate indices, such as anomaly fields of sea level pressure (SLP) or sea surface temperature (SST), change over time under climate change, increasing the likelihood of new climate–biological relationships [2,10,11]. Accordingly, ecological systems are usually nonstationary and are characterized by changes in the distribution, growth, phenology, and behavior of single species as well as the species composition, ecological structure, and ecological processes, resulting in the combination of new species and unexpected “ecological surprises” or the extinction of existing species and destruction of existing communities in the future [4,5]. However, traditional investigations on the effects of climate change on marine life were generally based on the assumption of stability with constant probability densities, which seem to be inappropriate for studies over long time scales (e.g., multidecadal time scales) [4].
Recently, scientists have realized the importance of nonstationarity in marine ecosystems and have begun to take it into account, especially in the North Pacific, where nonstationarity has been well documented in fishery ecosystems [1,2,12,13]. A representative case is the nonstationary climate–community relationships in the Gulf of Alaska associated with shifts in the importance of the Pacific Decadal Oscillation (PDO) and North Pacific Gyre Oscillation (NPGO) that resulted from the declining variance in the Aleutian Low [1,2,12]. In addition, Ma et al. [7] also found nonstationary changes in pelagic communities induced by climate change in the northwestern North Pacific (NWP). Previous studies have shown that climate change has great impact on the abundance and distribution of demersal fishes in the Tsushima Warm Current region of the Japan Sea, especially the climate shift in the late 1980s [14,15]. For instance, the abundance of Pacific cod greatly declined in areas where their abundances remained high until the late 1980s [14,16]. However, the previous researches concerning the role of climate change on the demersal fishes were mainly modeled with stationary assumption [14,15]. Therefore, a question emerged: do nonstationary relationships still exist between demersal fishes and marine environments under climate change?
Focusing on the demersal fishes in temperate waters of the NWP, this study aims to detect the nonstationary relationships between marine environmental variations and fluctuations in the abundance of demersal fishes, as well as its association with shifts in the relative importance of climate drivers. To achieve this goal, long time series with a large number of data of climate indices, environmental variables, and demersal fishes were compiled, and a series of analytical methods were used to test (1) the existence of state shifts in demersal fishes and environmental variables, (2) the nonstationary relationships between demersal fishes and environmental variables and (3) the evidence of shifts in the main climate drivers in temperate waters of the NWP. Additionally, the possible dynamic processes and mechanisms associated with these nonstationary relationships were discussed. The findings will help improve our understanding of the biological responses of demersal fishes to environmental changes and may also provide implications for the development of fishery management in a changing climate.

2. Materials and Methods

2.1. Study Area

The temperate waters of the NWP, as shown in Figure 1, represent one of the most productive fishery areas in the world oceans and are experiencing unparalleled warming at a much faster rate than that of the global ocean [17,18,19]. The temperate waters of the NWP have also shown remarkable decadal-scale fluctuations in physical and biological oceanography, namely, “climate and ecosystem regime shifts” [7,14,20,21]. In addition, the area has a complex circulation system, including the Kuroshio and Oyashio Currents (Figure 1). According to previous studies, its oceanographic variations are greatly affected by the Siberian High (SH), Arctic Oscillation, El Niño-Southern Oscillation (ENSO), East Asian winter monsoon (EAWM), North Pacific Oscillation (NPO), and PDO [22,23].

2.2. Biological, Environmental, and Climatic Data

Multiyear catch or biomass data of demersal fishes in our research region were collected and used for further analyses in this study. The data included 21 time series of demersal fishes. Catch data are mainly obtained from Annual Report of Catch Statistics on Fishery and Aquaculture of Japan and we also used reconstructed data from Sea around us to cover as many economically important demersal species as possible in our study area, while biomass data are collected from Stocks Assessment Reports of Japan [24]. Biomass indices of Japanese sandfish, Flathead flounder, and Roundnose flounder are estimated resource abundance that was estimated by tuned virtual population analysis (VPA) [25]. Biomass indices of all other species are catch per unit effort (CPUE). Most of the selected demersal fishes are important commercial fishing species [14]. These species were usually divided into two thermal preferences (warm or cold) in previous studies [14,21]. To better investigate the nonstationary relationships, we select time series longer than 40 years. More details on the biological data can be seen in Table 1, Supplementary Table S2 and Figure S7.
Considering the high correlation between bottom water temperature (~300 m) and SST (Supplementary Figure S2), SST was adopted as the representative of ocean thermal change in our analysis because it has a longer observation period which aids in detecting a relationship and higher accuracy in that it assimilates a lot of satellite observations [26,27]. Furthermore, SST affects the duration and survival of fish larvae that are usually more susceptible to environmental change than adults [28,29,30]. A winter (from November to March) SST field was used in our study based on the high correlations between demersal fishes and SST (Supplementary Figure S1). Monthly SST data for the spatial range from 25° to 50° N and 123° to 150° E between 1956 and 2015 were derived from the Hadley Centre Global Sea Ice and Sea Surface Temperature with a 2° × 2° horizontal resolution [26].
Six large-scale climate indices that are generally considered to be related to environmental changes and ecosystem variations in temperate waters of the NWP were employed in our study, including the Siberian High Index (SHI), East Asian Winter Monsoon Index (MOI), Arctic Oscillation Index (AOI), PDO, NPGO and Southern Oscillation Index (SOI) [7,18,20,31,32]. In addition, it is worth noting that ENSO activities, as the leading driving force for global climate change, have high variation intensities and spatial patterns [10]. Many recent studies have highlighted that more attention should be paid to the diversity and strength of ENSO when considering its ecological influence on the North Pacific Ocean under increasing global warming scenarios [33,34,35]. To reflect the diversity of ENSO and its influence to different degrees, the mega-ENSO index, which was defined as the difference between the averaged West Pacific K-shape SST and East Pacific triangle SST, was also used in our analysis [36]. As an integrated measure of interdecadal variations in the Pacific (or global) SST, the mega-ENSO index can reflect a broader range of variability than conventional ENSO indices [36]. Considering that these climate activities usually prevail in winter (December to February), all climate indices were used with average winter (DJF) values in this study [32,37]. Details of the climatic indices can be seen in Supplementary Table S1.

2.3. Data Analyses

To investigate the best-fitted shared trend of the biological time series and identify state shifts in the trend, a Bayesian version of dynamic factor analysis (DFA) together with a hidden Markov model (HMM) were conducted for the time series of the biological data.
The DFA is a multivariate statistical tool similar to Principal Components Analysis (PCA), but unlike PCA, the DFA does not require the length of each time series to be equal and deal with missing values and therefore might reflect the actual responses of the biological community [13,38]. The latent trends are modeled as:
Y t = Z X t + ε t
where X t represents the value of latent trends at time t, Y t represents the value of all time series at time t, Z is the factor loading matrix and ε t is residual error [38]. Justifications and details of the Bayesian implementations of DFA and HMM are provided in Supplementary Text S1. After obtaining the shared trend determined by the criteria, Pearson correlation analyses together with significance tests between the shared trend and monthly SST field were implemented to identify the crucial SST periods. The number of degrees of freedom was adjusted to calculate the most reliable significance based on potential autocorrelation [39]. Then, we performed empirical orthogonal function (EOF) analysis on the winter (NDJFM) SST field, and its leading principal component (PC1) was calculated for further analyses.
According to the results of the state shifts test of demersal fishes and the SST EOF analysis, the data can be divided into different eras. Coupled with time-dependent Pearson correlation analyses and significance test maps, time-dependent Bayesian regressions between the shared trend and SST PC1 were conducted to test the nonstationary responses of demersal fishes to SST using the R package “rstanarm” [40,41,42].
The shared trend was modeled as a linear function of the SST PC1 with era-specific slopes and intercepts and the posterior densities for them were provided for probabilistic estimates [43]. The era-specific slopes and intercepts help to explore the differences in the relationships between SST and demersal fishes among eras. The same analyses were also implemented between the climate drivers and SST to quantify the intensity of the influence of climate forcings on water temperature in different eras. In addition, a gradient forest analysis with 1000 simulations and 3000 regression trees for each simulation was also employed to detect the changing importance of climate drivers for SST and to explore the era-specific main climate drivers using the R package “gradientForest” [41,44]. Due to the effects of the climate on multiple life-history stages of demersal fishes, all data were normalized to zero means with unit variances and were then smoothed with 3-year moving averages, except under the DFA and HMM analysis, to reflect conditions the year before, the year of and the year after ocean entry, as suggested by Litzow et al. [2].

3. Results

3.1. State Shifts of Demersal Fishes and SST Variability

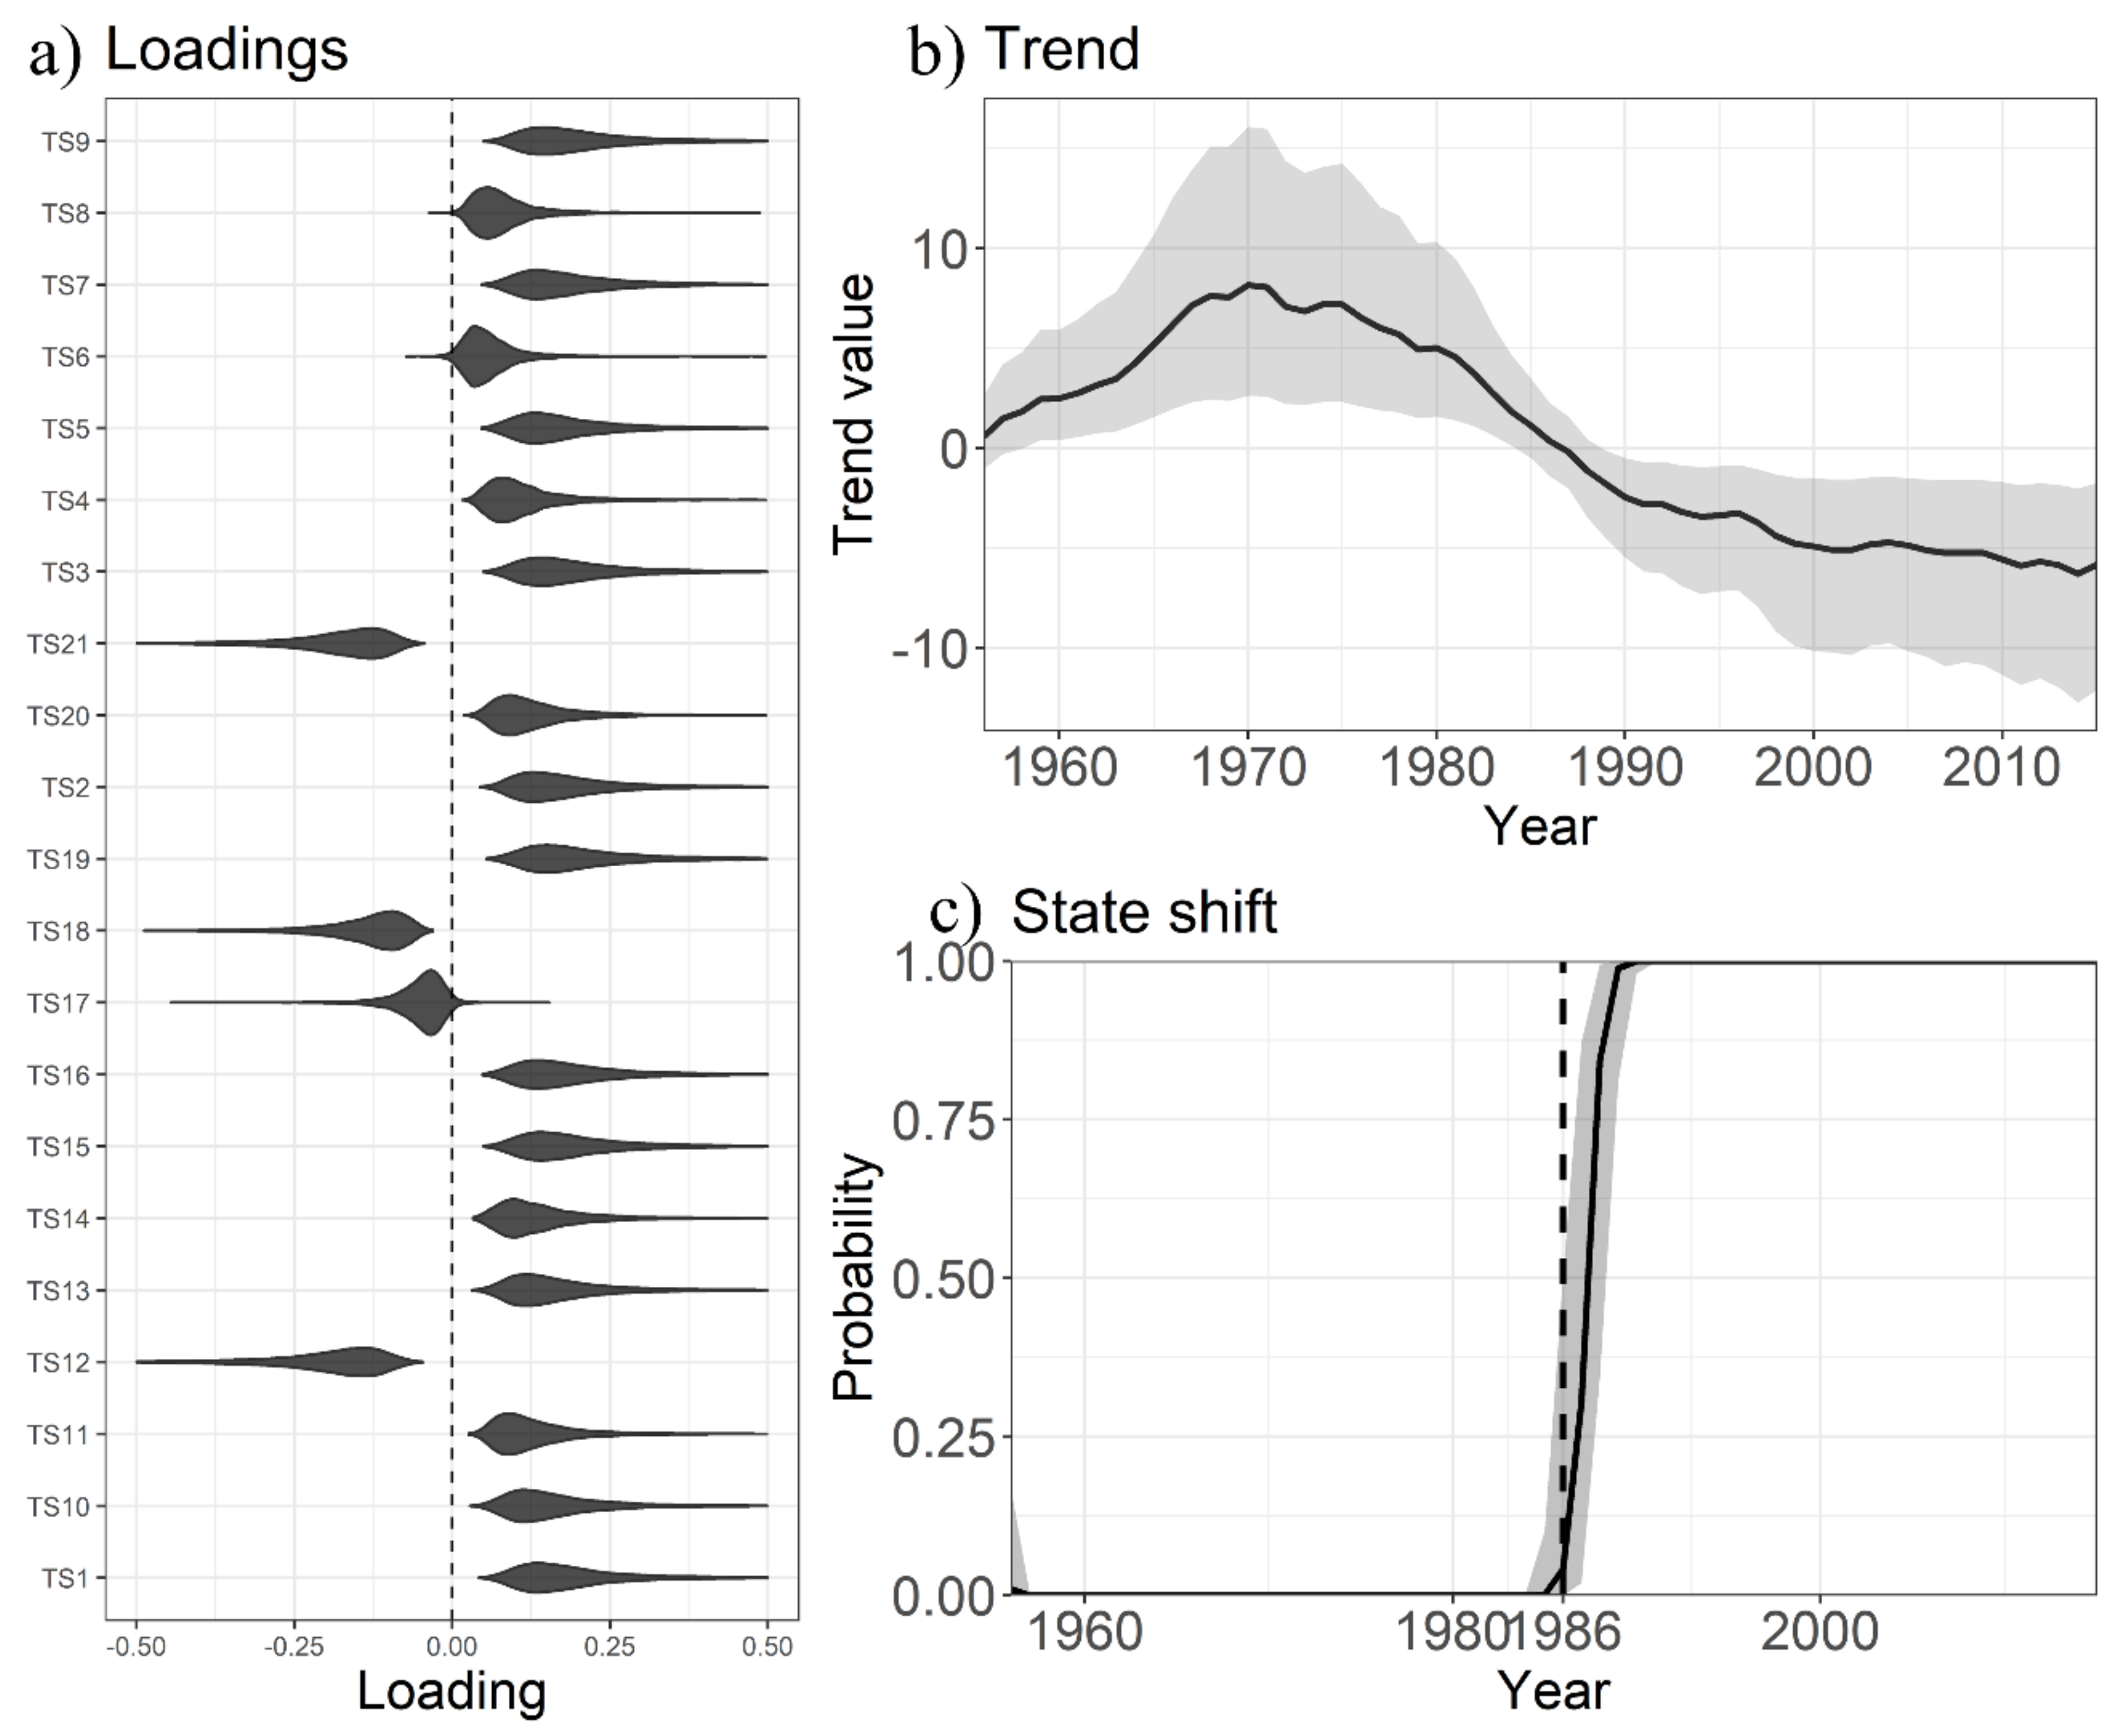
The results of the Bayesian version of the DFA showed that the shared trend loaded positively for almost all time series of demersal fishes except for Silver seabream, Yellow goosefish, Daggertooth pike conger, and Small yellow croaker, suggesting that these species have opposite abundance dynamics (Figure 2a). The shared trend showed a marked decline in the 1980s (Figure 2b), reflecting the rapid change in demersal fishes, and the HMM results also revealed state shifts in approximately 1986/87 (Figure 2c). For SST, EOF1, accounting for 48.48% of the total variance, showed a generally consistent mode over the temperate waters of the NWP and an abrupt increase in the PC1 time series in approximately 1986, indicating abrupt warming in this region after the late 1980s (Supplementary Figure S3). The timing of the state shifts of the demersal fishes corresponded well with the timing of abrupt warming.

3.2. Nonstationary Responses of Demersal Fishes to SST Variability

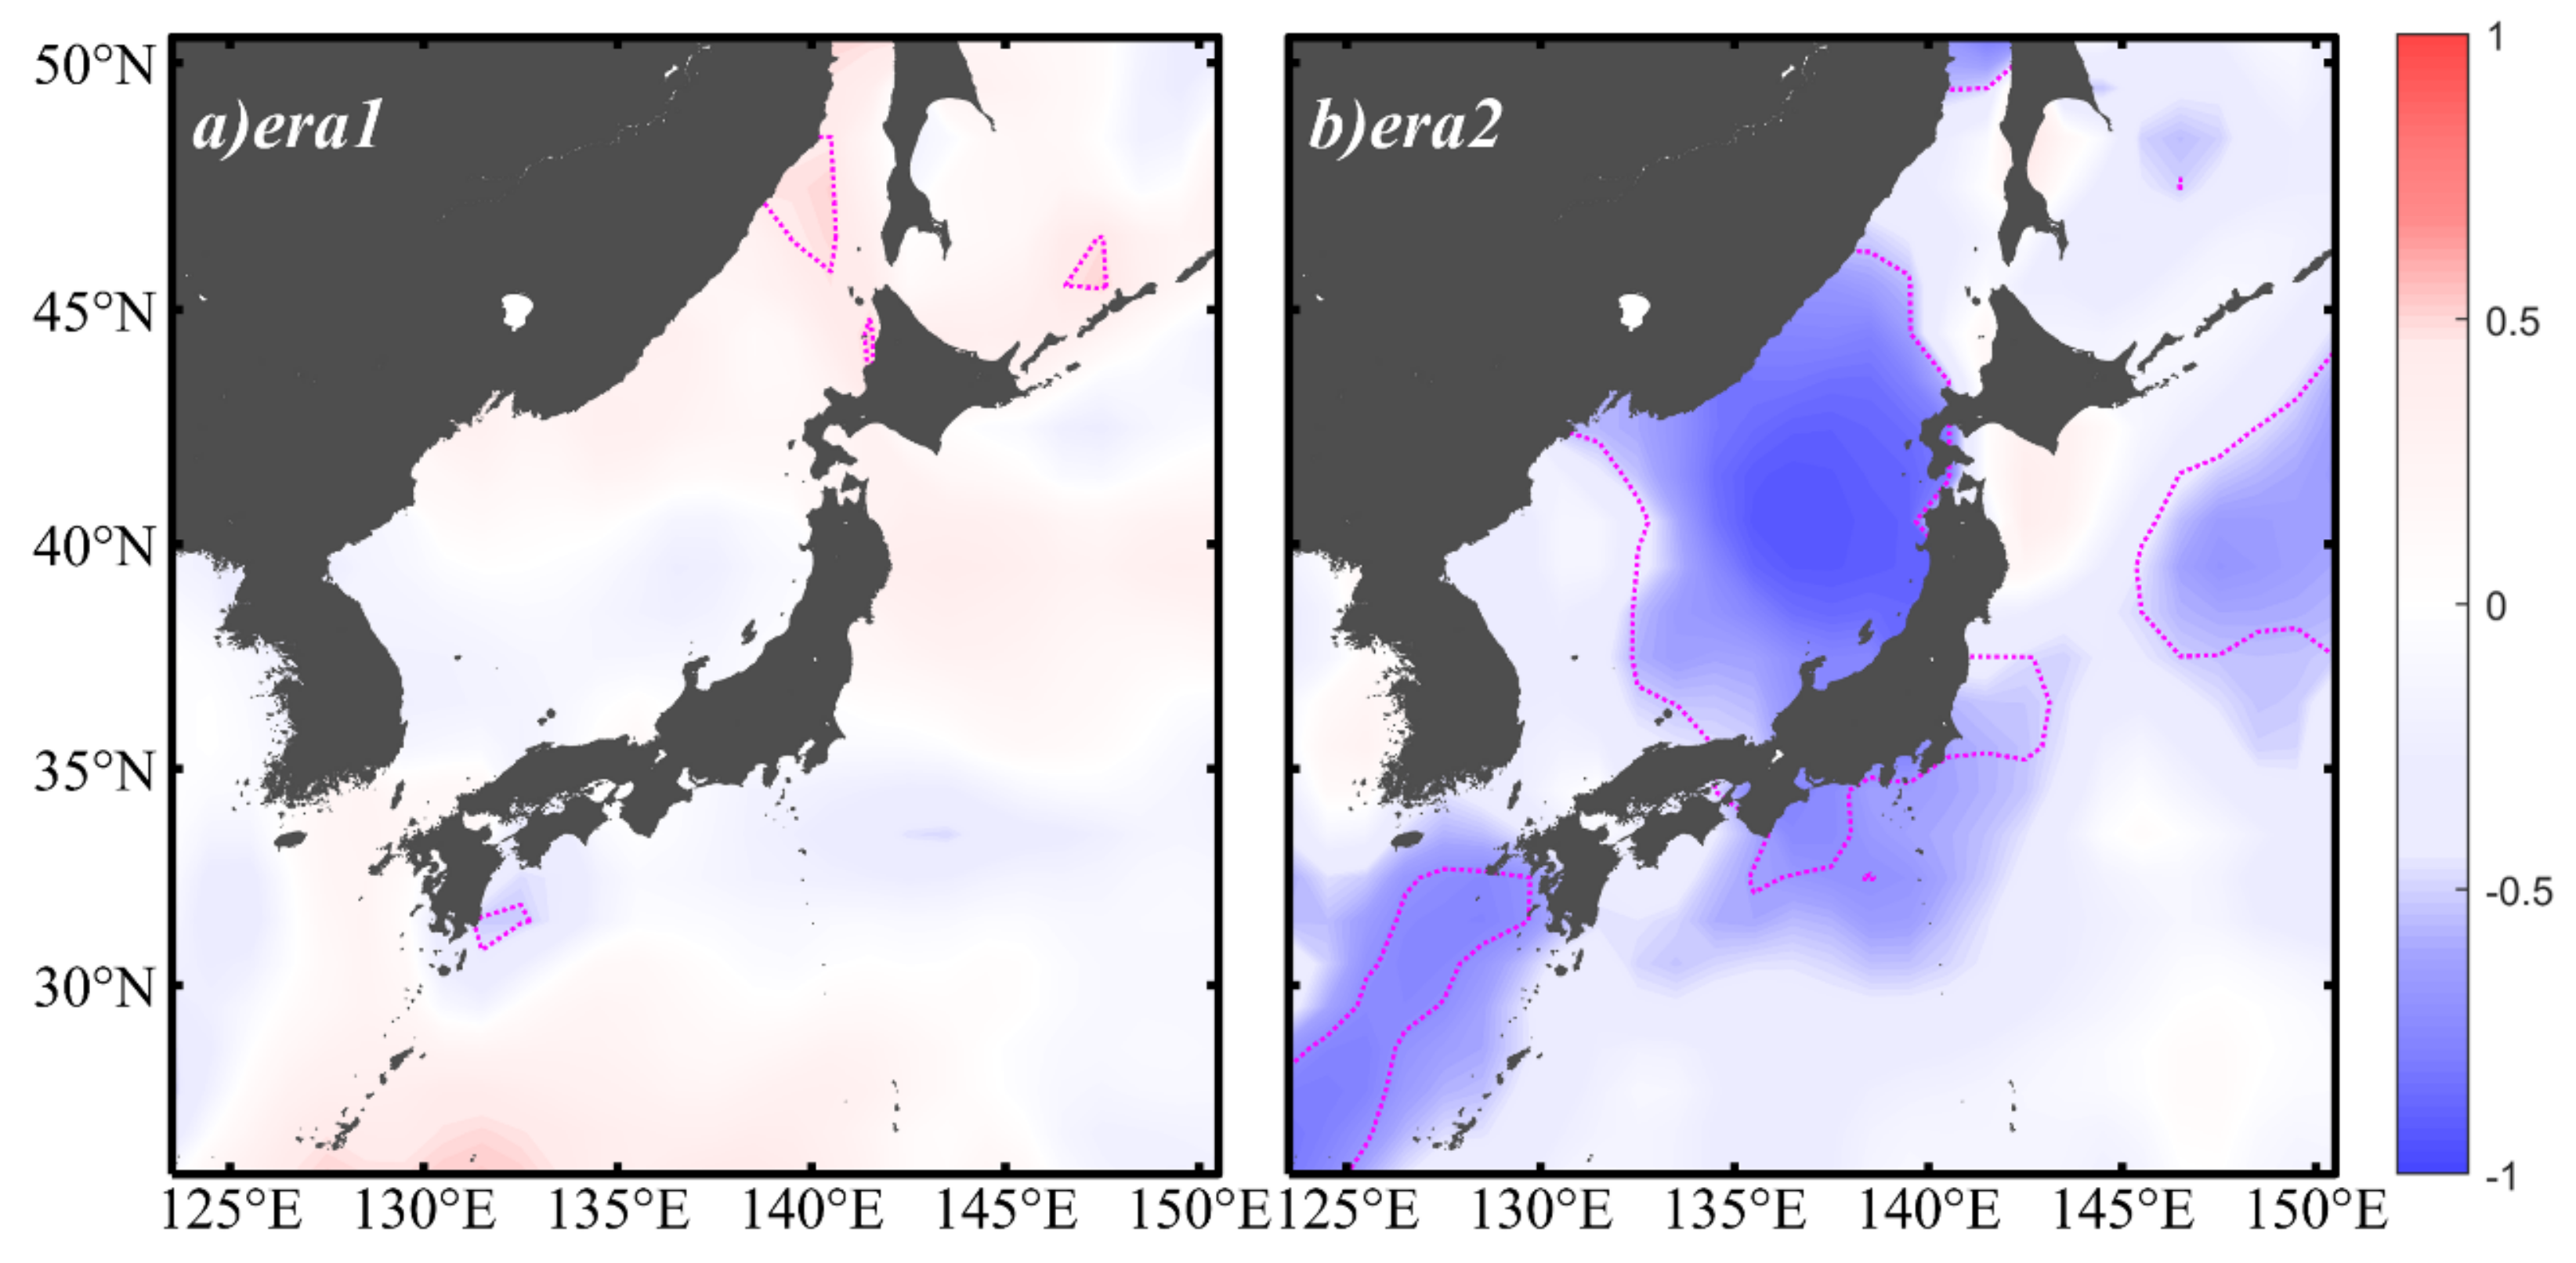
The distinct slopes and intercepts obtained from the Bayesian regression in the two eras indicate era-specific relationships between demersal fishes and SST in this region (Figure 3a). There was a weak correlation in era1 (R2 = 1.55%, p = 0.91), while a strong negative correlation appeared in era2 (R2 = 47.07%, p < 0.01) (Figure 3b), which is consistent with the observed spatial patterns of era-specific correlations (Figure 4). Therefore, both the era-specific Bayesian regressions (temporal) and correlation analyses (spatial) provided strong evidence for nonstationary responses of demersal fishes to SST variabilities in different eras, implying that an increased SST may have a strong negative effect on demersal fishes in temperate waters of the NWP.

3.3. Nonstationary Effects of Climate Drivers on SST

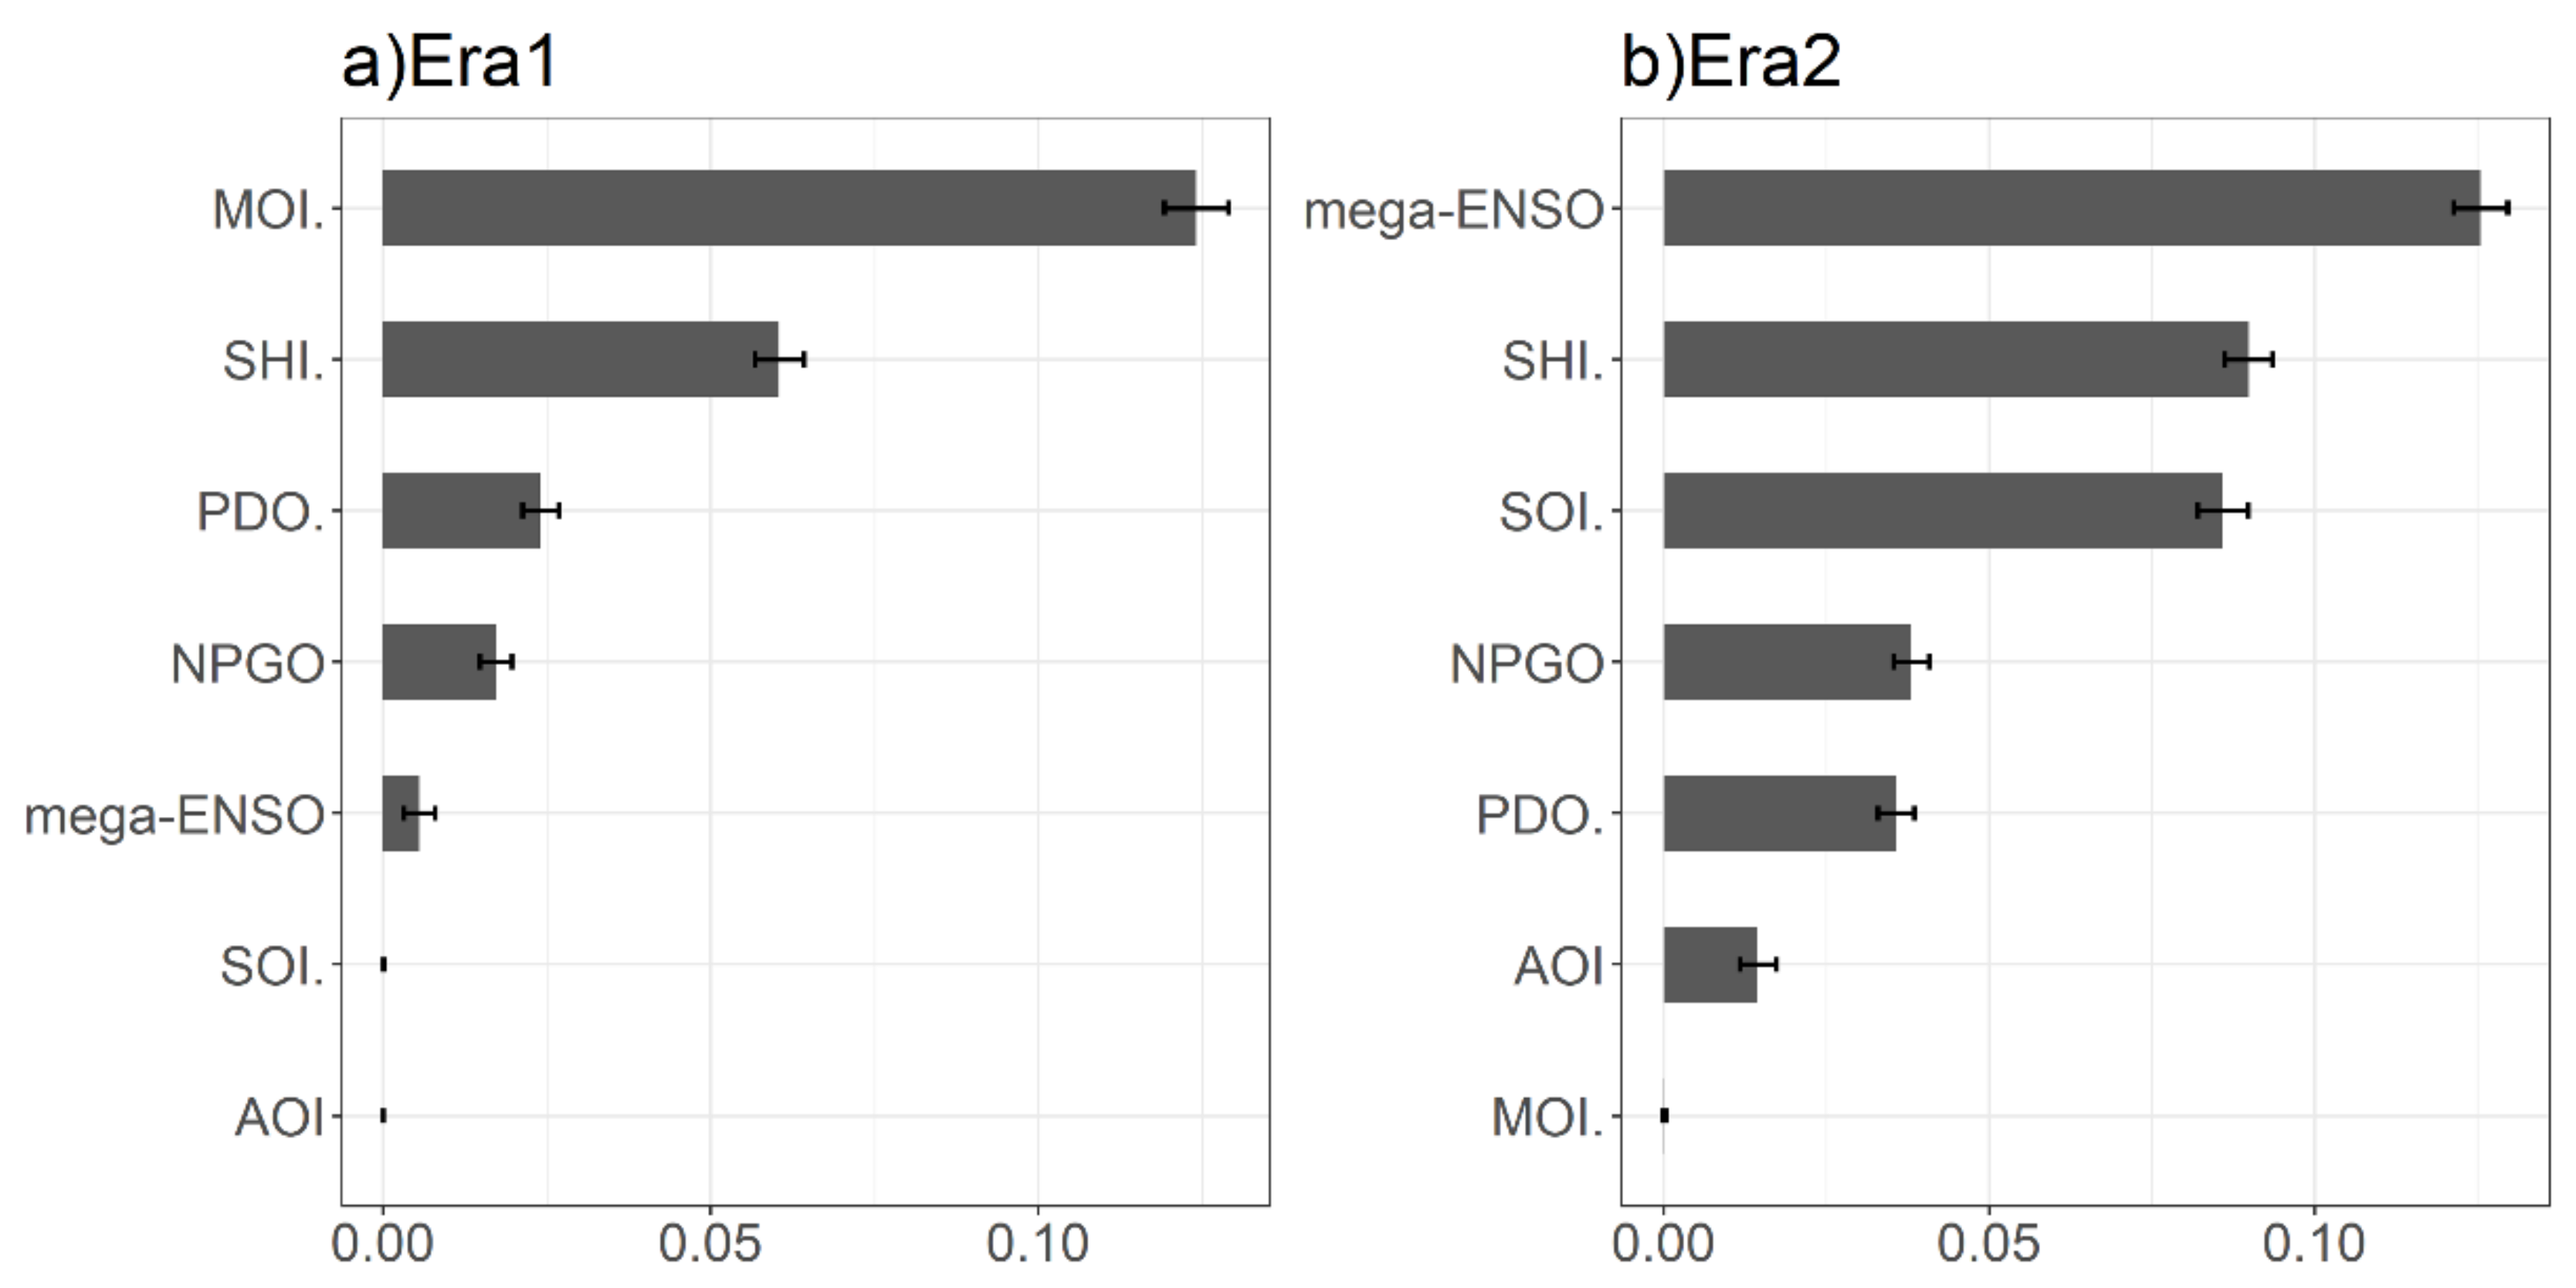
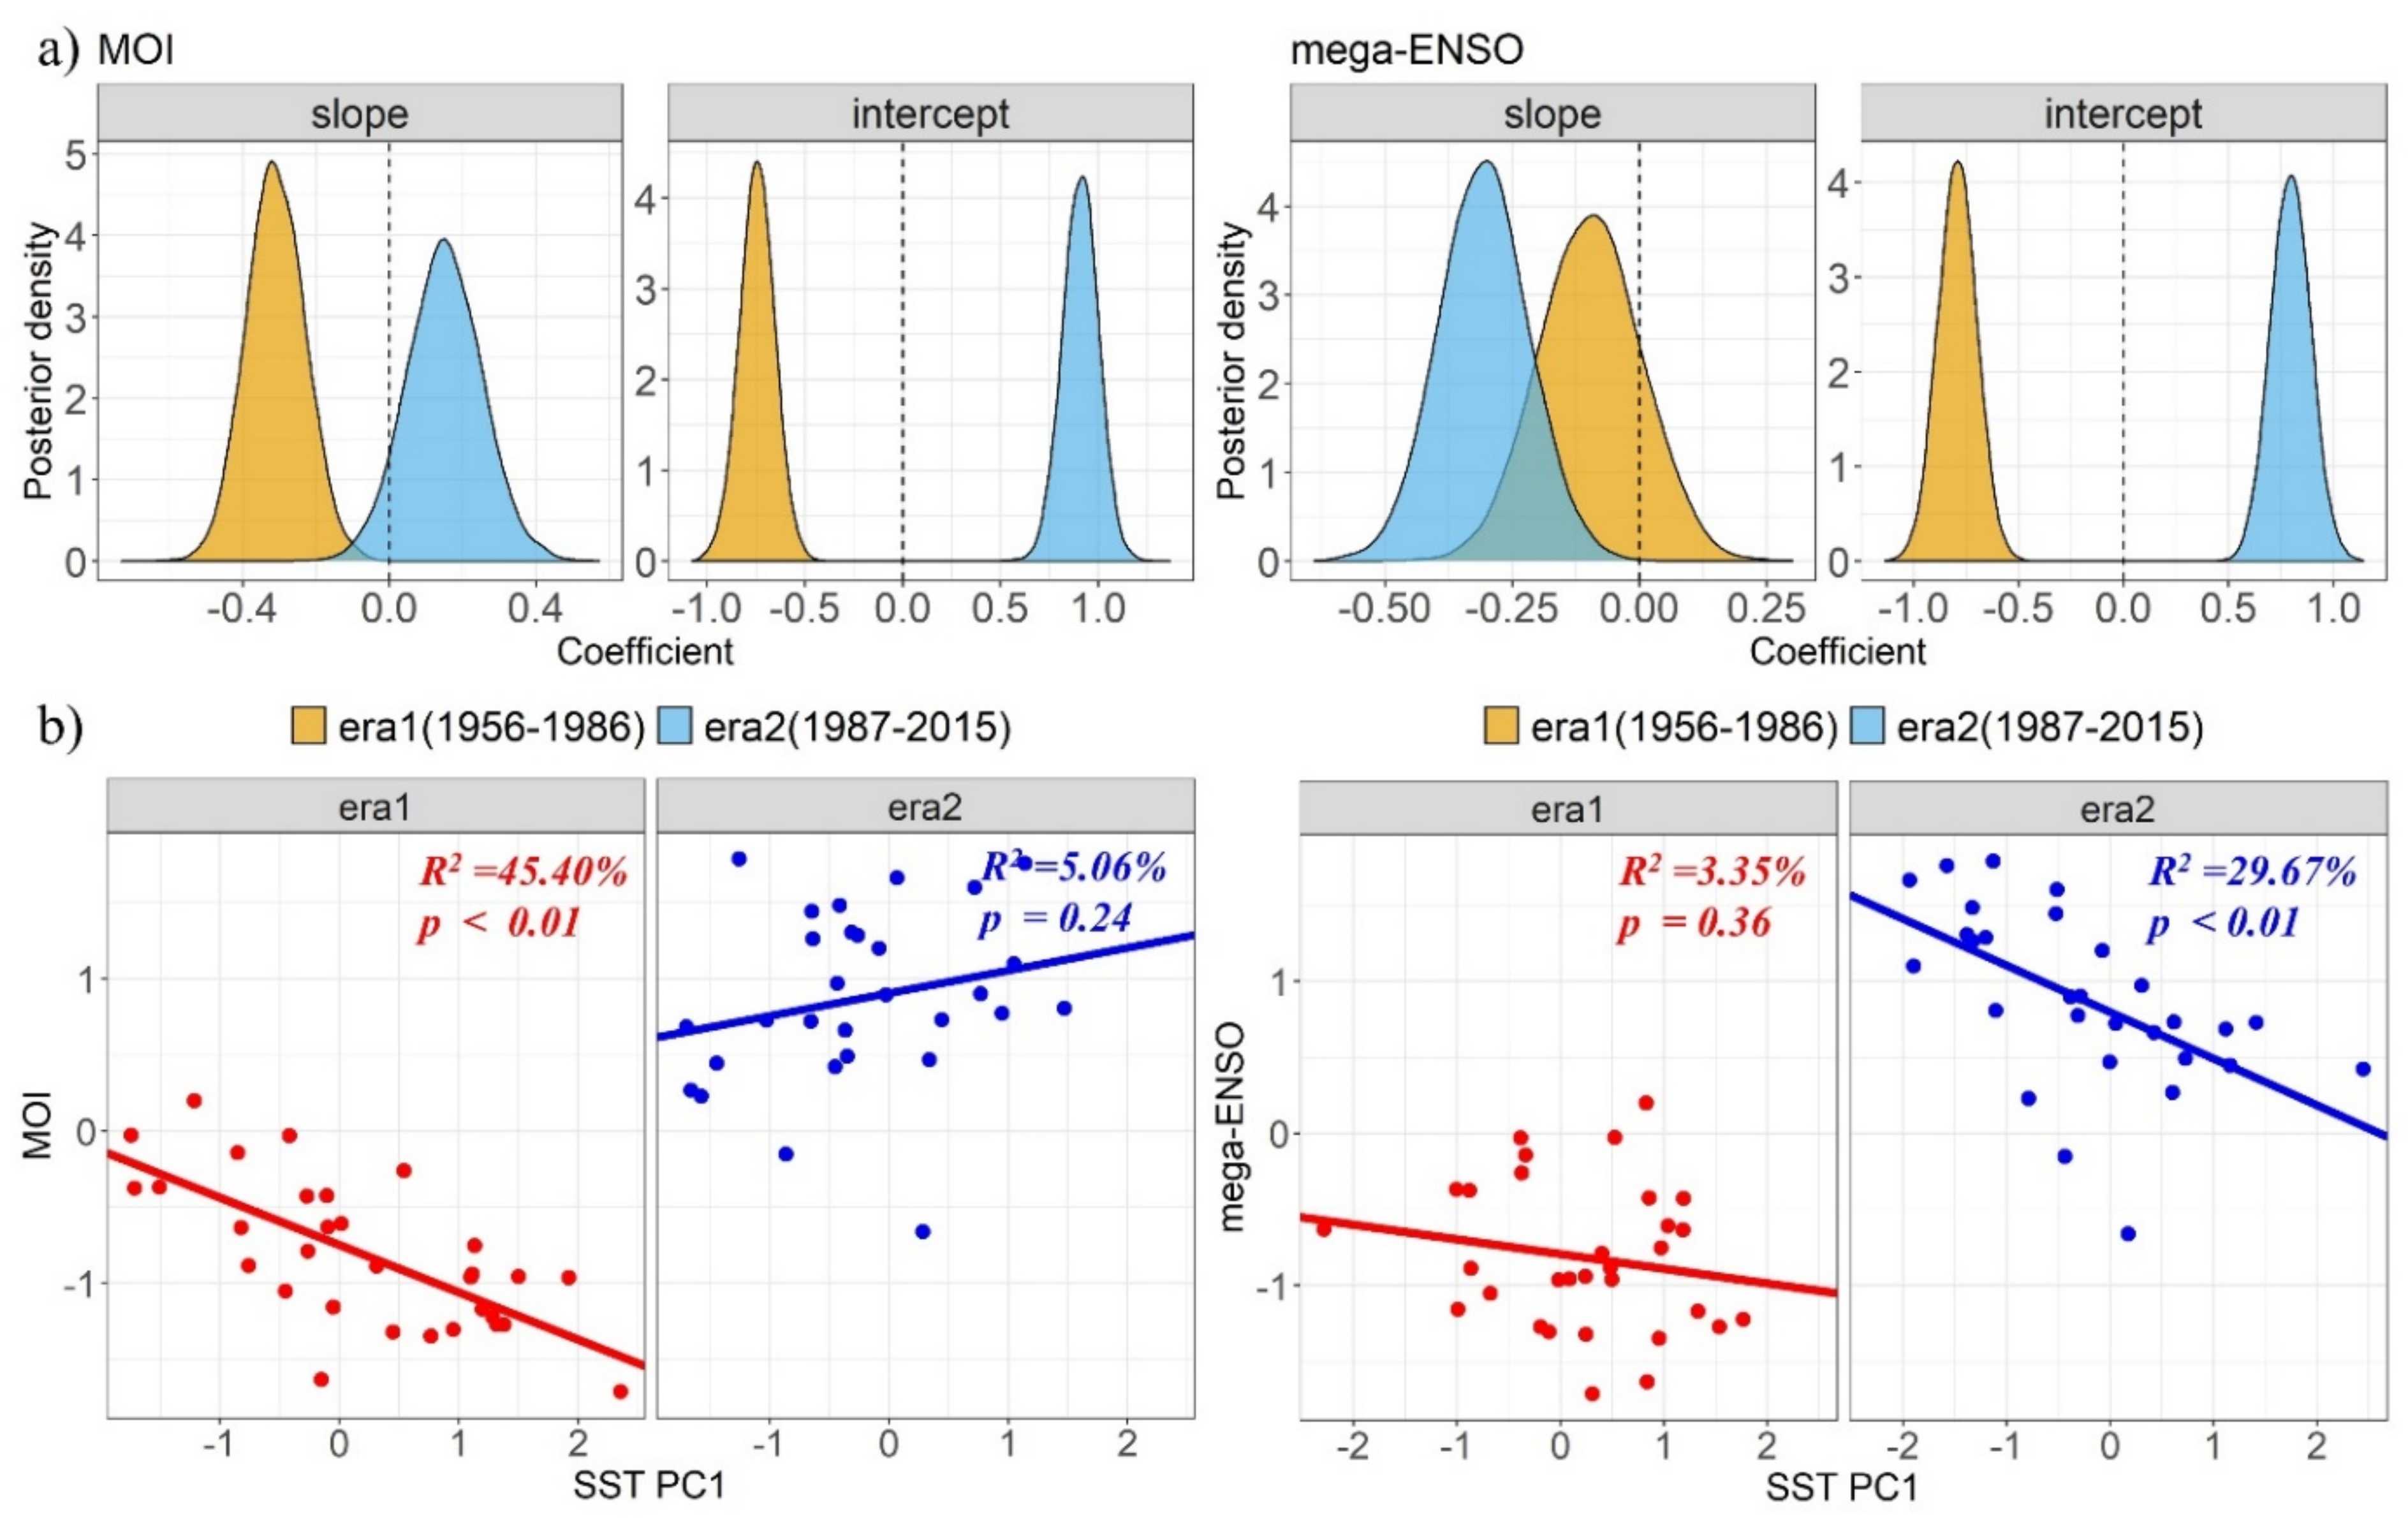
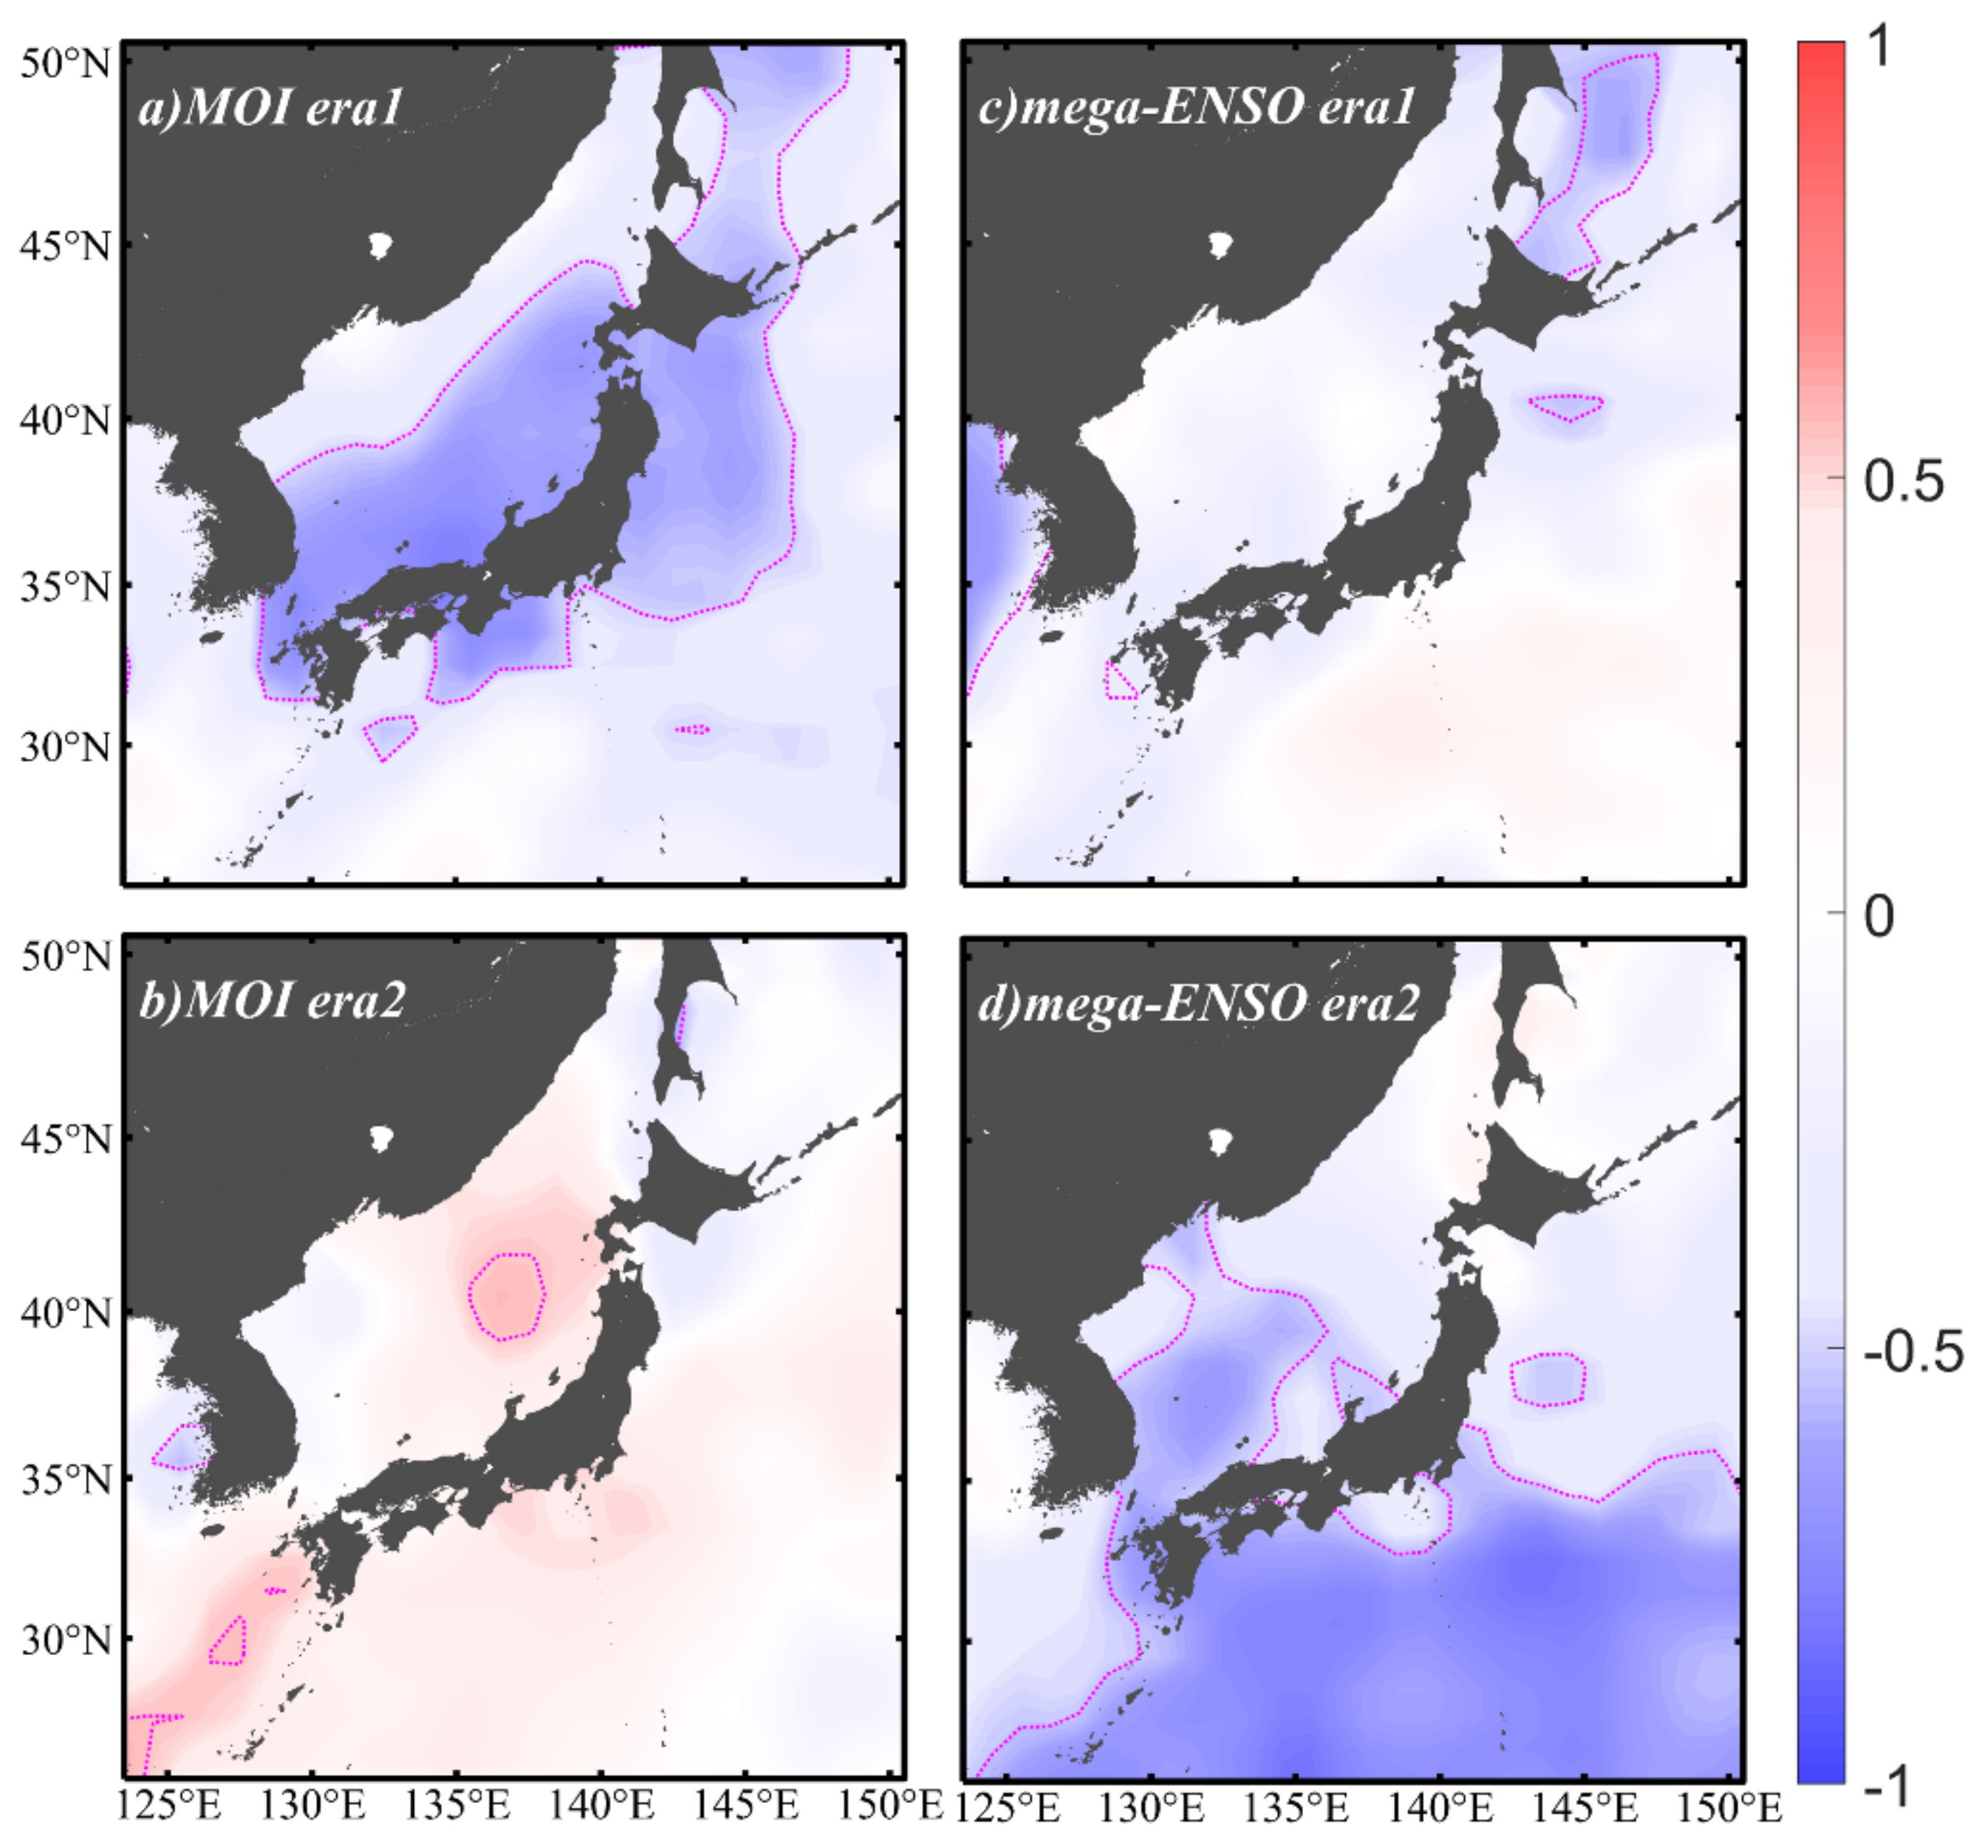
The gradient forest analysis showed that the degrees of influence of different climate drivers on winter SST in temperate waters of the NWP changed in the two identified eras (Figure 5). Before 1986, the winter SST in this area was mainly affected by the MOI. However, the mega-ENSO became paramount after 1986. The era-specific Bayesian regressions (temporal, Figure 6) and correlation analyses (spatial, Figure 7) confirmed the changing effects of the MOI and mega-ENSO on winter SST; these effects are characterized by the declining effects of MOI and strengthening effects of mega-ENSO from era1 to era2.

4. Discussion

4.1. Effects of Warming on Demersal Fishes

The identification of the critical period is the first step in revealing the effects of warming on demersal fishes, as they may be sensitive to the climate only at certain periods of their life cycles [45,46]. As identified in our study (Supplementary Figure S1), winter is widely used to study the effects of climate change on ecosystems [7,14,15,18,20,32,47]. Studies have shown that marine fish are more responsive to changes in winter climate and environment, so changes in winter climate and environment will have a greater impact on marine fish [20,48,49,50]. On the one hand, as winter is the spawning season for many demersal fishes, previous studies proved that the winter climate has an important impact on the early life stages of fishes, including egg and larval survival, growth, and transport [49,51]. Moreover, the winter climate can also influence the phenology and winter migration of fish populations [47]. On the other hand, it has been recognized that the rate of warming in winter is faster than that in summer in marine ecosystems worldwide, resulting in a greater impact on marine ecosystems and their services as well as the acceleration of regime shifts, such as the loss of fish species, especially for demersal and benthic dwellers [48].
The responses to warming were inconsistent among species in our study (Figure 2a), which may be related to their thermal preferences [52]. Although loadings cannot be used to fully distinguish cold- and warm-water species, we can still find evidence of their negative (positive) responses to warming (Figure 2a and Figure 3). The representatives of warm-water species (Silver seabream, Yellow goosefish, Daggertooth pike conger, and Small yellow croaker) have shown a positive trend in abundance since 1987, representing a positive response to climate warming, while most cold-water fish have shown a trend of decline since 1987 as the shared trend (Supplementary Figure S7). Demersal fishes move northward and deeper with warming, causing habitat reductions (extensions) for cold-water (warm-water) species [53]. For example, the climate-induced distribution and catch shifts of the small yellow croaker would likely be northward based on previous prediction [54]. It was found that a decline in the abundance of Pacific cod was synchronous with a decline in the habitat of the species in the southwestern Sea of Japan after the late 1980s [15]. In addition, the abundances of species with nearshore habitats (e.g., Yellow goosefish and Willowy flounder) increased during the warm mid-1990s, while the abundances of species with offshore habitats (e.g., Roughscale sole and Rockfishes) decreased during this period [55]. The different responses of cold- and warm-water species to warming may be one of the primary reasons for the observed changes in demersal fish assemblage structure [14]. However, the ecological processes associated with the impact of warming on demersal fishes seem to be complex. In addition to affecting the physiology, spatial distribution, and food availability of fish species, warming also influences the oxygen levels in the ocean (e.g., oxygen solubility and biological respiratory oxygen demand) [56,57,58,59]. It has been observed that a decrease in dissolved oxygen in the bottom water of the Sea of Japan may be related to global warming [60]. Overall, as global warming progresses with increasing intensity and frequency (e.g., extreme marine heatwaves), it can be speculated that demersal fishes may be more severely affected, especially those including cold-water species [17,61].

4.2. Changing Major Climate Drivers for the SST in Temperate Waters of the NWP

Thus far, extensive research based on the assumption of stationarity has emphasized the influences of MOI and SHI on variations in winter SST in temperate waters of the NWP [7,18,20,31,32]. However, the nonstationarity of climate drivers should not be ignored due to the alternating dominance of MOI and mega-ENSO found in this study. The declining influence of MOI on SST in temperate waters of the NWP may have been induced by the unprecedented decrease in the Siberian high that occurred in the late 1980s; the Siberian high is the main driving force of the winter monsoon [62,63,64]. At the same time, the influence of ENSO (especially mega-ENSO) on SST in temperate waters of the NWP increased significantly after the late 1980s because the frequency and intensity of ENSO activities increase with increasing anthropogenic greenhouse gas emissions.
To better understand the effect of mega-ENSO on SST in temperate waters of the NWP in era2 (1987–2015), mega-El Niño and mega-La Niña events were selected using a simple criterion. We selected mega-El Niño (mega-La Niña) years by determining values greater (less) than 1 (–1) based on the normalized mega-ENSO (DJF) index from 1987 to 2015 (Supplementary Figure S4). Four mega-El Niño years (1991, 1992, 1997, and 2015) and seven mega-La Niña years (1988, 1998, 1999, 2007, 2008, 2010, and 2011) were identified during the period from 1987 to 2015. Mega-La Niña events have occurred more frequently than mega-El Niño events since the late 1980s. Further analysis of the SST (DJF) anomalies that occur during mega-El Niño or mega-La Niña periods showed that mega-El Niño is much more similar to the eastern Pacific type, while mega-La Niña looks more like the central Pacific type [65]. These findings were consistent with previous studies in which El Niño events were found to have larger amplitudes than La Niña events in the eastern Pacific, while La Niño events tended to be stronger than El Niño events in the central Pacific [10]. In addition, it is interesting to note that the SST anomalies in temperate waters of the NWP during mega-La Niña events were obviously stronger than those during mega-El Niño events (Supplementary Figure S5), implying the greater impact of mega-La Niña on SST in temperate waters of the NWP in era2. This phenomenon can be explained by basin-scale air-sea interactions. It can be imagined that a significant positive sea level pressure anomaly would emerge over the North Pacific during a mega-La Niña event, while the western Pacific cyclone is confined to the ocean area, and there is no significant pressure increase over continental East Asia (i.e., no significant increase in the Siberian high), implying the weakening of the zonal air pressure gradient between the East Asian continent and the North Pacific [66]. Therefore, the combination of these factors is not conducive to the southward movement of cold air, resulting in an increased SST in temperate waters of the NWP. In addition, our study also revealed that the influence of NPGO on SST in temperate waters of the NWP increased after the late 1980s (Supplementary Figure S6). It is known that the NPGO pattern is primarily driven by central tropical Pacific SST variability, adding evidence of the increasing influence of central Pacific ENSO characterized by mega-La Niña events on SST in temperate waters of the NWP [67,68].

4.3. Impacts of Fishing and Implications for Fishery Management

There is no doubt that the impact of fishing on the whole demersal fishes in temperate waters of the NWP cannot be ignored. For example, the increasing trend of demersal fishes during the 1960s may have been related to the increasing fish pressure [21]. In addition, the fluctuation of demersal fishes may be driven by interaction of climate change and anthropogenic fishing activities [32]. However, we did not tackle the impact of fishing in our study due to the lack of fishing effort data and the difficulty of distinguishing the interaction between climate change and fishing [7,32]. Fishing pressure can also be intensified by unfavorable climate states even under declining fishing effort, which indicates the importance of identifying the responses of demersal fishes to climate change before evaluating fishing impacts [7,14]. It should also be noted that since our study adopted the fishery-dependent data, it may be subjected to constraints imposed by management (e.g., total allowable catches) and the deliberate misreporting of study (e.g., discards) over time, which is worth paying attention to in future research [31].
Our research points to the nonstationary environment–biology relationships induced by changing climate drivers. This may provide insights on understanding climate-induced biological dynamics in other marine ecosystems, which are valuable for fisheries management, particularly for predicting demersal fish fluctuations and coping with potential ecological risks [12]. Firstly, the results show that the demersal fishes in temperate waters of the NWP entered a new state after 1987 with abrupt warming of this region, which indicates that the possibility of the emergence of new climate and environmental states with continued warming should be taken into account and the investigation and evaluation of their impact on demersal fish resources should be strengthened [69]. Secondly, a paradigm shift in our understanding of climate-induced biological responses should be advocated to better understand climate-induced biological dynamics, which has long been frustrated by changing climate–biology correlations, such as nonstationary climate–salmon relationships in the Gulf of Alaska [2,7]. Thirdly, timely monitoring of ecological metrics that might indicate a new ecological stage, including changes in the abundance and biomass of key functional groups, community composition, and species diversity, is often emphasized and advocated [70]. However, our analysis of historical biological, environmental and climatic data would help to explore historical ecological shifts, such as the identified threshold years (1986/87) in our research, decipher drivers of ecosystem change, forewarn upcoming ecological shifts and thus trigger appropriate management actions [70].

5. Conclusions

In this study, the long-term relationships between demersal fishes and environmental variations in temperate waters of the NWP were investigated. State shifts of demersal fishes in temperate waters of the NWP were found in approximately 1986/1987 corresponding to an abrupt increase in the water temperature in this region. The changing relationships between demersal fishes and SST identified by era-specific analytical methods reflected the nonstationary responses of demersal fishes to SST variability in temperate waters of the NWP under the changing climate; these changes were found to be related to the alternative importance of the East Asian winter monsoon and mega-ENSO resulting from the abrupt decrease in the Siberian high as well as the increase in the frequency and intensity of ENSO after the late 1980s. These findings further confirmed the importance of a paradigm shift in investigations of climate-induced biological responses in a world characterized by nonstationarity, and it is necessary to take ecological reference points (e.g., ecological thresholds) into consideration when formulating fishery management strategies. Furthermore, our findings also enrich our understanding of the climate-induced biological dynamics in the North Pacific and the global oceans. It is worth noting that the nonstationary responses of demersal fishes to environmental variations would be possibly affected by both climate variability and fishing. Our findings, therefore, need to be further supported as the impact of fishing on the demersal fishes was not tackled in our study.

Supplementary Materials

The following are available online at https://www.mdpi.com/article/10.3390/fishes6030022/s1, Text S1: Bayesian version of Dynamic Factor Analysis and Hidden Markov Model. Figure S1. Maps of correlation coefficients between the shared trend out from the Bayesian DFA and monthly sea surface temperature (SST) fields. Purple dotted lines enclose area with significant correlations (p < 0.05). Figure S2. Maps of correlation coefficients between the time series of mean bottom water temperature (depth = 317m, 1956–2010) and winter(NDJFM) sea surface temperature (SST) field. Purple dotted lines enclose area with significant correlations (p < 0.05). Black dotted lines enclose area with high correlations (r > 0.7). Figure S3. EOF analysis for winter (NDJFM) SST field in temperate waters of the NWP: The leading spatial pattern (eigen vector) (left) and the time series of SST PC1 (right). Figure S4. The time series of normalized mega-ENSO index (1956–2015). Figure S5. Maps of DJF sea surface temperature (SST) normalized anomalies in mega- El Niño (left) and mega- La Niña (right) during era2 (1987–2015). Figure S6. Non-stationary temporal relationships between NPGO and winter SST: (a) era-specific posteriors distribution for the slope and intercept of NPGO on winter SST PC1. (b) era-specific Scatter plots and best linear fits with corresponding R2 and p values to NPGO and winter SST PC1 estimated by Bayesian regression models. Figure S7. Time series data of demersal fishes (scaled).

Author Contributions

All authors listed have made a direct and substantial contribution to this work. Q.H., H.Y. and Z.Y. conceived the study. Q.H. and S.M. performed the data compilation and analysis wrote the manuscript. Q.X. and W.Z. edited and proofread the earlier versions of the manuscript. All authors have read and agreed to the published version of the manuscript.

Funding

This work was supported by the National Key R&D Program of China (No. 2018YFD0900903) and the National Key R&D Program of China (No. 2018YFD0900902).

Data Availability Statement

The raw data supporting the conclusions of this article will be made available by the authors, without undue reservation.

Conflicts of Interest

The authors declare no conflict of interest.

References

  1. Litzow, M.A.; Ciannelli, L.; Cunningham, C.J.; Johnson, B.; Puerta, P. Nonstationary effects of ocean temperature on pacific salmon productivity. Can. J. Fish. Aquat. Sci. 2019, 76, 1923–1928. [Google Scholar] [CrossRef]
  2. Litzow, M.A.; Ciannelli, L.; Puerta, P.; Wettstein, J.J.; Rykaczewski, R.R.; Opiekun, M. Non-stationary climate-salmon relationships in the Gulf of Alaska. Proc. R. Soc. B Biol. Sci. 2018, 285, 2018185. [Google Scholar] [CrossRef] [Green Version]
  3. Poff, N.L.R. Beyond the natural flow regime? Broadening the hydro-ecological foundation to meet environmental flows challenges in a non-stationary world. Freshw. Biol. 2018, 63, 1011–1021. [Google Scholar] [CrossRef]
  4. Wolkovich, E.M.; Cook, B.I.; McLauchlan, K.K.; Davies, T.J. Temporal ecology in the Anthropocene. Ecol. Lett. 2014, 17, 1365–1379. [Google Scholar] [CrossRef] [Green Version]
  5. Williams, J.W.; Jackson, S.T. Novel climates, no-analog communities, and ecological surprises. Front. Ecol. Environ. 2007, 5, 475–482. [Google Scholar] [CrossRef]
  6. Williams, J.W.; Jackson, S.T.; Kutzbach, J.E. Projected distributions of novel and disappearing climates by 2100 AD. Proc. Natl. Acad. Sci. USA 2007, 104, 5738–5742. [Google Scholar] [CrossRef] [PubMed] [Green Version]
  7. Ma, S.; Tian, Y.; Fu, C.; Yu, H.; Li, J.; Liu, Y.; Cheng, J.; Wan, R.; Watanabe, Y. Climate-induced nonlinearity in pelagic communities and non-stationary relationships with physical drivers in the Kuroshio ecosystem. Fish. Fish. 2020, 22, 1–17. [Google Scholar] [CrossRef]
  8. Radeloff, V.C.; Williams, J.W.; Bateman, B.L.; Burke, K.D.; Carter, S.K.; Childress, E.S.; Cromwell, K.J.; Gratton, C.; Hasley, A.O.; Kraemer, B.M.; et al. The rise of novelty in ecosystems. Ecol. Appl. 2015, 25, 2051–2068. [Google Scholar] [CrossRef] [PubMed] [Green Version]
  9. Kolmogorov, A.N. A Simplified Proof of the Birkoff- Khinchin Ergodic Theorem; Springer: Dordrecht, The Netherlands, 1991; pp. 271–276. [Google Scholar]
  10. Capotondi, A.; Wittenberg, A.T.; Newman, M.; Di Lorenzo, E.; Yu, J.Y.; Braconnot, P.; Cole, J.; Dewitte, B.; Giese, B.; Guilyardi, E.; et al. Understanding enso diversity. Bull. Am. Meteorol. Soc. 2015, 96, 921–938. [Google Scholar] [CrossRef]
  11. Wang, S.Y.; L’heureux, M.; Yoon, J.H. Are greenhouse gases changing ENSO precursors in the Western North Pacific? J. Clim. 2013, 26, 6309–6322. [Google Scholar] [CrossRef]
  12. Litzow, M.A.; Ciannelli, L.; Puerta, P.; Wettstein, J.J.; Rykaczewski, R.R.; Opiekun, M. Nonstationary environmental and community relationships in the North Pacific Ocean. Ecology 2019, 100, 1–8. [Google Scholar] [CrossRef] [PubMed] [Green Version]
  13. Puerta, P.; Ciannelli, L.; Rykaczewski, R.R.; Opiekun, M.; Litzow, M.A. Do Gulf of Alaska fish and crustacean populations show synchronous non-stationary responses to climate? Prog. Oceanogr. 2019, 175, 161–170. [Google Scholar] [CrossRef]
  14. Tian, Y.; Kidokoro, H.; Fujino, T. Interannual-decadal variability of demersal fish assemblages in the Tsushima Warm Current region of the Japan Sea: Impacts of climate regime shifts and trawl fisheries with implications for ecosystem-based management. Fish. Res. 2011, 112, 140–153. [Google Scholar] [CrossRef]
  15. Tian, Y.; Kidokoro, H.; Watanabe, T.; Iguchi, N. The late 1980s regime shift in the ecosystem of Tsushima warm current in the Japan/East Sea: Evidence from historical data and possible mechanisms. Prog. Oceanogr. 2008, 77, 127–145. [Google Scholar] [CrossRef]
  16. Kun Jung, H.; Rahman, S.M.M.; Kang, C.-K.; Park, S.-Y.; Heon Lee, S.; Je Park, H.; Kim, H.-W.; Lee, C.I. The influence of climate regime shifts on the marine environment and ecosystems in the East Asian Marginal Seas and their mechanisms. Deep. Sea Res. Part. II Top. Stud. Oceanogr. 2017, 143, 110–120. [Google Scholar] [CrossRef]
  17. Oliver, E.C.J.; Donat, M.G.; Burrows, M.T.; Moore, P.J.; Smale, D.A.; Alexander, L.V.; Benthuysen, J.A.; Feng, M.; Sen Gupta, A.; Hobday, A.J.; et al. Longer and more frequent marine heatwaves over the past century. Nat. Commun. 2018, 9, 1–12. [Google Scholar] [CrossRef] [PubMed]
  18. Tian, Y. Comparison of fluctuations in fish communities and trophic structures of ecosystems from three currents around Japan: Synchronies and differences. ICES J. Mar. Sci. ICES 2014, 71, 19–34. [Google Scholar] [CrossRef] [Green Version]
  19. Wu, L.; Cai, W.; Zhang, L.; Nakamura, H.; Timmermann, A.; Joyce, T.; McPhaden, M.J.; Alexander, M.; Qiu, B.; Visbeck, M.; et al. Enhanced warming over the global subtropical western boundary currents. Nat. Clim. Chang. 2012, 2, 161–166. [Google Scholar] [CrossRef]
  20. Ma, S.; Tian, Y.; Li, J.; Yu, H.; Cheng, J.; Sun, P.; Fu, C.; Liu, Y.; Watanabe, Y. Climate Variability Patterns and Their Ecological Effects on Ecosystems in the Northwestern North Pacific. Front. Mar. Sci. 2020, 7, 546882. [Google Scholar] [CrossRef]
  21. Tian, Y.; Kidokoro, H.; Watanabe, T. Long-term changes in the fish community structure from the Tsushima warm current region of the Japan/East Sea with an emphasis on the impacts of fishing and climate regime shift over the last four decades. Prog. Oceanogr. 2006, 68, 217–237. [Google Scholar] [CrossRef]
  22. Pak, G.; Yeh, S.W.; Nam, S.H.; Park, Y.H.; Kim, Y.H. Major Driver Leading to Winter SST Variability in the Kuroshio Recirculation Gyre Region and Its Decadal Changes: Refreshening Versus Spring-Initiated Reemergence Processes. Geophys. Res. Lett. 2019, 46, 272–280. [Google Scholar] [CrossRef] [Green Version]
  23. Yatsu, A.; Chiba, S.; Yamanaka, Y.; Ito, S.I.; Shimizu, Y.; Kaeriyama, M.; Watanabe, Y. Climate forcing and the Kuroshio/Oyashio ecosystem. ICES J. Mar. Sci. 2013, 70, 922–933. [Google Scholar] [CrossRef] [Green Version]
  24. Fisheries Agency and Fisheries Research Agency. Marine Fisheries Stock Assessment and Evaluation for Japanese Waters; Fisheries Agency and Fisheries Research and Education Agency of Japan: Tokyo, Japan, 2017. (In Japanese) [Google Scholar]
  25. Pope, J.G. An investigation of the accuracy of virtual population analysis using cohort analysis. Int. Comm. Northwest. Atl. Fish. Res. Bull. 1972, 9, 65–74. [Google Scholar]
  26. Rayner, N.A.; Parker, D.E.; Horton, E.B.; Folland, C.K.; Alexander, L.V.; Rowell, D.P.; Kent, E.C.; Kaplan, A. Global analyses of sea surface temperature, sea ice, and night marine air temperature since the late nineteenth century. J. Geophys. Res. Atmos. 2003, 108. [Google Scholar] [CrossRef]
  27. Fredston-Hermann, A.; Selden, R.; Pinsky, M.; Gaines, S.D.; Halpern, B.S. Cold range edges of marine fishes track climate change better than warm edges. Glob. Chang. Biol. 2020, 26, 2908–2922. [Google Scholar] [CrossRef]
  28. Xing, Q.; Yu, H.; Ito, S.-i.; Ma, S.; Yu, H.; Wang, H.; Tian, Y.; Sun, P.; Liu, Y.; Li, J.; et al. Using a larval growth index to detect the environment-recruitment relationships and its linkage with basin-scale climate variability: A case study for Japanese anchovy (Engraulis japonicus) in the Yellow Sea. Ecol. Indic. 2021, 122, 107301. [Google Scholar] [CrossRef]
  29. O’Connor, M.I.; Bruno, J.F.; Gaines, S.D.; Halpern, B.S.; Lester, S.E.; Kinlan, B.P.; Weiss, J.M. Temperature control of larval dis- persal and the implications for marine ecology, evolution, and conservation. Proc. Natl. Acad. Sci. USA 2007, 104, 1266–1271. [Google Scholar] [CrossRef] [Green Version]
  30. Pankhurst, N.; Munday, P. Effects of climate change on fish reproduction and early life history stages. Mar. Freshw. Res. 2011, 62, 1015. [Google Scholar] [CrossRef] [Green Version]
  31. Ma, S.; Cheng, J.; Li, J.; Liu, Y.; Wan, R.; Tian, Y. Interannual to decadal variability in the catches of small pelagic fishes from China Seas and its responses to climatic regime shifts. Deep. Sea Res. Part II Top. Stud. Oceanogr. 2019, 159, 112–129. [Google Scholar] [CrossRef]
  32. Ma, S.; Liu, Y.; Li, J.; Fu, C.; Ye, Z.; Sun, P.; Yu, H.; Cheng, J.; Tian, Y. Climate-induced long-term variations in ecosystem structure and atmosphere-ocean-ecosystem processes in the Yellow Sea and East China Sea. Prog. Oceanogr. 2019, 175, 183–197. [Google Scholar] [CrossRef]
  33. Lehodey, P.; Bertrand, A.; Hobday, A.J.; Kiyofuji, H.; McClatchie, S.; Menkès, C.E.; Pilling, G.; Polovina, J.; Tommasi, D. ENSO Impact on Marine Fisheries and Ecosystems. In El Niño Southern Oscillation in a Changing Climate; McPhaden, M.J., Santoso, A., Cai, W., Eds.; American Geophysical Union: Washington, DC, USA, 2020; pp. 429–451. [Google Scholar] [CrossRef]
  34. Timmermann, A.; An, S.I.; Kug, J.S.; Jin, F.F.; Cai, W.; Capotondi, A.; Cobb, K.; Lengaigne, M.; McPhaden, M.J.; Stuecker, M.F.; et al. El Niño–Southern Oscillation complexity. Nature 2018, 559, 535–545. [Google Scholar] [CrossRef] [PubMed]
  35. Wang, B.; Luo, X.; Yang, Y.M.; Sun, W.; Cane, M.A.; Cai, W.; Yeh, S.W.; Liu, J. Historical change of El Niño properties sheds light on future changes of extreme El Niño. Proc. Natl. Acad. Sci. USA 2019, 116, 22512–22517. [Google Scholar] [CrossRef] [Green Version]
  36. Wang, B.; Liu, J.; Kim, H.J.; Webster, P.J.; Yim, S.Y.; Xiang, B. Northern Hemisphere summer monsoon intensified by mega-El Niño/southern oscillation and Atlantic multidecadal oscillation. Proc. Natl. Acad. Sci. USA 2013, 110, 5347–5352. [Google Scholar] [CrossRef] [Green Version]
  37. Wang, B.; Wu, R.; Fu, X. Pacific-East Asian teleconnection: How does ENSO affect East Asian climate? J. Clim. 2000, 3, 1517–1536. [Google Scholar] [CrossRef]
  38. Zuur, A.F.; Fryer, R.J.; Jolliffe, I.T.; Dekker, R.; Beukema, J.J. Estimating common trends in multivariate time series using dynamic factor analysis. Environmetrics 2003, 14, 665–685. [Google Scholar] [CrossRef] [Green Version]
  39. Bretherton, C.S.; Widmann, M.; Dymnikov, V.P.; Wallace, J.M.; Bladé, I. The effective number of spatial degrees of freedom of a time-varying field. J. Clim. 1999, 12, 1990–2009. [Google Scholar] [CrossRef]
  40. Carpenter, B.; Gelman, A.; Hoffman, M.D.; Lee, D.; Goodrich, B.; Betancourt, M.; Brubaker, M.A.; Guo, J.; Li, P.; Riddell, A. Stan: A Probabilistic Programming Language. J. Stat. Softw. 2017, 76, 1–29. [Google Scholar] [CrossRef] [Green Version]
  41. Core Team R. R: A Language and Environment for Statistical Computing (Vol. 3.4.3); R Foundation for Statistical Computing: Vienna, Austria, 2018; Available online: http://www.r-project.org/ (accessed on 10 January 2021).
  42. Goodrich, B.; Gabry, J.; Ali, I.; Brilleman, S. Rstanarm: Bayesian Applied Regression Modeling via Stan. 2018. Available online: http://mc-stan.org/ (accessed on 10 January 2021).
  43. Litzow, M.A.; Hunsicker, M.E.; Ward, E.J.; Anderson, S.C.; Gao, J.; Zador, S.G.; Batten, S.; Dressel, S.C.; Duffy-Anderson, J.; Fergusson, E.; et al. Evaluating ecosystem change as Gulf of Alaska temperature exceeds the limits of preindustrial variability. Prog. Oceanogr. 2020, 186, 102393. [Google Scholar] [CrossRef]
  44. Ellis, N.; Smith, S.J.; Pitcher, C.R. Gradient forests: Calculating importance gradients on physical predictors. Ecology 2012, 93, 156–168. [Google Scholar] [CrossRef]
  45. Poloczanska, E.S.; Brown, C.J.; Sydeman, W.J.; Kiessling, W.; Schoeman, D.S.; Moore, P.J.; Brander, K.; Bruno, J.F.; Buckley, L.B.; Burrows, M.T.; et al. Global imprint of climate change on marine life. Nat. Clim. Chang. 2013, 3, 919–925. [Google Scholar] [CrossRef]
  46. Sunday, J.M.; Pecl, G.T.; Frusher, S.; Hobday, A.J.; Hill, N.; Holbrook, N.J.; Edgar, G.J.; Stuart-Smith, R.; Barrett, N.; Wernberg, T.; et al. Species traits and climate velocity explain geographic range shifts in an ocean-warming hotspot. Ecol. Lett. 2015, 18, 944–953. [Google Scholar] [CrossRef]
  47. Morley, J.W.; Buckel, J.A.; Lankford, T.E., Jr. Relative con- tribution of spring-and summer-spawned bluefish cohorts to the adult population: Effects of size-selective winter mortality, over-winter growth, and sampling bias. Can. J. Fish. Aquat. Sci. 2013, 70, 233–244. [Google Scholar] [CrossRef]
  48. Clark, N.J.; Kerry, J.T.; Fraser, C.I. Rapid winter warming could disrupt coastal marine fish community structure. Nat. Clim. Chang. 2020, 10, 862–867. [Google Scholar] [CrossRef]
  49. Hufnagl, M.; Peck, M.A.; Nash, R.D.M.; Dickey-Collas, M. Unravelling the Gordian knot! Key processes impacting overwintering larval survival and growth: A North Sea herring case study. Prog. Oceanogr. 2015, 138, 486–503. [Google Scholar] [CrossRef]
  50. Hurst, T.P. Causes and consequences of winter mortality in fishes. J. Fish. Biol. 2007, 71, 315–345. [Google Scholar] [CrossRef]
  51. Robbins, P. Marine Science. Encycl. Environ. Soc. 2014, 71, 2416–2428. [Google Scholar] [CrossRef]
  52. Morley, J.W.; Batt, R.D.; Pinsky, M.L. Marine assemblages respond rapidly to winter climate variability. Glob. Chang. Biol. 2017, 23, 2590–2601. [Google Scholar] [CrossRef]
  53. Perry, A.L.; Low, P.J.; Ellis, J.R.; Reynolds, J.D. Ecology: Climate change and distribution shifts in marine fishes. Science 2005, 308, 1912–1915. [Google Scholar] [CrossRef] [PubMed]
  54. Cheung, W.W.L.; Lam, V.W.Y.; Sarmiento, J.L.; Kearney, K.; Watson, R.; Pauly, D. Projecting global marine biodiversity impacts under climate change scenarios. Fish. Fish. 2009, 10, 235–251. [Google Scholar] [CrossRef]
  55. Nihira, A. Regime shift and demersal fish resources. In Regime Shift: Climate Changes and Manage- ments of Biological Resources; Kawasaki, T., Hanawa, K., Taniuchi, A., Nihira, A., Eds.; Seisandou: Tokyo, Janpan, 2007; pp. 157–173. (In Japanese) [Google Scholar]
  56. Carpenter, J.H. Measurements in Pure and of Oxygen Solubility. Limnol. Oceanogr. 1966, 11, 264–277. [Google Scholar] [CrossRef]
  57. Free, C.M.; Thorson, J.T.; Pinsky, M.L.; Oken, K.L.; Wiedenmann, J.; Jensen, O.P. Impacts of historical warming on marine fisheries production. Science 2019, 363, 979–983. [Google Scholar] [CrossRef]
  58. Harris, L.A.; Duarte, C.M.; Nixon, S.W. Allometric laws and prediction in estuarine and coastal ecology. Estuaries Coasts 2006, 29, 340–344. [Google Scholar] [CrossRef] [Green Version]
  59. Rabalais, N.N.; Turner, R.E.; Wiseman, W.J. Gulf of Mexico hypoxia, a.k.a. “The dead zone”. Annu. Rev. Ecol. Syst. 2002, 33, 235–263. [Google Scholar] [CrossRef]
  60. Gamo, T. Global warming may have slowed down the deep conveyor belt of a marginal sea of the northwestern Pacific: Japan Sea. Geophys. Res. Lett. 1999, 26, 3137–3140. [Google Scholar] [CrossRef]
  61. Smale, D.A.; Wernberg, T.; Oliver, E.C.J.; Thomsen, M.; Harvey, B.P.; Straub, S.C.; Burrows, M.T.; Alexander, L.V.; Benthuysen, J.A.; Donat, M.G.; et al. Marine heatwaves threaten global biodiversity and the provision of ecosystem services. Nat. Clim. Chang. 2019, 9, 306–312. [Google Scholar] [CrossRef] [Green Version]
  62. Nakamura, H.; Izumi, T.; Sampe, T. Interannual and decadal modulations recently observed in the Pacific storm track activity and èast Asian winter monsoon. J. Clim. 2002, 15, 1855–1874. [Google Scholar] [CrossRef]
  63. Panagiotopoulos, F.; Shahgedanova, M.; Hannachi, A.; Stephenson, D.B. Observed trends and teleconnections of the Siberian high: A recently declining center of action. J. Clim. 2005, 18, 1411–1422. [Google Scholar] [CrossRef] [Green Version]
  64. Park, Y.H.; Yoon, J.H.; Youn, Y.H.; Vivier, F. Recent warming in the western north pacific in relation to rapid changes in the atmospheric circulation of the Siberian high and aleutian low systems. J. Clim. 2012, 25, 3476–3493. [Google Scholar] [CrossRef]
  65. Yeh, S.W.; Kug, J.S.; Dewitte, B.; Kwon, M.H.; Kirtman, B.P.; Jin, F.F. El Nĩo in a changing climate. Nature 2009, 461, 511–514. [Google Scholar] [CrossRef] [PubMed]
  66. Zhang, P.; Wu, Z.; Li, J. Reexamining the relationship of La Niña and the East Asian Winter Monsoon. Clim. Dyn. 2019, 53, 779–791. [Google Scholar] [CrossRef]
  67. Di Lorenzo, E.; Cobb, K.M.; Furtado, J.C.; Schneider, N.; Anderson, B.T.; Bracco, A.; Alexander, M.A.; Vimont, D.J. Central Pacific El Niño and decadal climate change in the North Pacific Ocean. Nat. Geosci. 2010, 3, 762–765. [Google Scholar] [CrossRef]
  68. Doak, D.F.; Estes, J.A.; Halpern, B.S.; Jacob, U.; Lindberg, D.R.; Lovvorn, J.; Monson, D.H.; Tinker, M.T.; Williams, T.M.; Wootton, J.T.; et al. Understanding and predicting ecological dynamics: Are major surprises inevitable. Ecology 2008, 89, 952–961. [Google Scholar] [CrossRef] [PubMed] [Green Version]
  69. Litzow, M.A.; Malick, M.J.; Bond, N.A.; Cunningham, C.J.; Gosselin, J.L.; Ward, E.J. Quantifying a novel climate through changes in PDO-climate and PDO-salmon relationships. Geophys. Res. Lett. 2020, 47, e2020GL087972. [Google Scholar] [CrossRef]
  70. Foley, M.M.; Martone, R.G.; Fox, M.D.; Kappel, C.V.; Mease, L.A.; Erickson, A.L.; Halpern, B.S.; Selkoe, K.A.; Taylor, P.; Scarborough, C. Using Ecological Thresholds to Inform Resource Management: Current Options and Future Possibilities. Front. Mar. Sci. 2015, 2, 95. [Google Scholar] [CrossRef] [Green Version]
Figure 1. Map of the research area. Red and blue lines indicate primary warm and cold currents in temperate waters of the northwestern North Pacific, including the Kuroshio Current (KC), Yellow Sea Warm Current (YSWC), Tsushima Warm Current (TSWC), Oyashio Current (OC), and Liman Current (LC). The panel at the bottom right shows the location of the research areas in the North Pacific.
Fishes 06 00022 g001
Figure 2. Bayesian DFA and HMM analysis for demersal fishes (1956–2015) in temperate waters of the NWP. (a) Posterior distributions for loadings on each time series. (b) The shared trend time series with a 95% credible interval. (c) State probability of the shared trend (median probability with a 95% credible interval). The dotted line represents the shift year.
Fishes 06 00022 g002
Figure 3. Nonstationary temporal responses of demersal fishes to SST. (a) Era-specific posterior distributions of the slope and intercept of the shared trend of the SST PC1. (b) Era-specific scatter plots and best linear fittings with the corresponding R2 and p values estimated by Bayesian regression models.
Fishes 06 00022 g003
Figure 4. (a,b) Nonstationary spatial responses of demersal fishes to SST: maps of era-specific correlation coefficients between the shared trends and winter SST fields. Purple dotted lines enclose areas with significant correlations (p < 0.05).
Fishes 06 00022 g004
Figure 5. (a,b) The era-specific R2 weighted importance of climate drivers to winter SST with error bars, as obtained by the gradient forest analysis.
Fishes 06 00022 g005
Figure 6. Nonstationary temporal relationships between MOI, mega-ENSO and SST. (a) Era-specific posterior distributions of the slope and intercept of the MOI and mega-ENSO on the SST PC1. (b) Era-specific scatter plots and best linear fittings with the corresponding R2 and p values estimated by Bayesian regression models.
Fishes 06 00022 g006
Figure 7. Nonstationary spatial relationships between MOI or mega-ENSO and the winter SST fields: maps of era-specific correlation coefficients between MOI or mega-ENSO and the winter SST fields (ad). Purple dotted lines enclose areas with significant correlations (p < 0.05).
Fishes 06 00022 g007
Table 1. Description of the time series of demersal fishes used in our research.
OrderCommon NameScientific NameThermal PreferenceSpawning SeasonPopulation ProcessSourceYears
TS1Pacific codGadus macrocephalusColdJanuary–MarchCatchARCSFA1956–2015
TS2Walleye pollockTheragra chalcogrammaColdDecember–MarchCatchARCSFA1956–2015
TS3Largehead hairtailTrichiurus japonicusWarmApril–OctoberCatchARCSFA1956–2015
TS4Blackhead seabreamAcanthopagrus schlegeliiWarmWinter–SpringCatchARCSFA1956–2015
TS5Japanese sandfishArctoscopus japonicusColdDecember–JanuaryCatchARCSFA1956–2015
TS6BiomassSARJ1972–2015
TS7Broadbanded thornyheadSebastolobus macrochirColdMarch–AprilCatchARCSFA1956–2015
TS8BiomassSARJ1972–2015
TS9Deepsea smeltGlossanodon semifasciatusWarmSpring–AutumnCatchARCSFA1956–2015
TS10BiomassSARJ1975–2015
TS11Silver seabreamPagrus majorWarmApril–JulyCatchARCSFA1956–2015
TS12BiomassSARJ1970–2015
TS13Flathead flounderHippoglossoides dubiusColdFebruary–AprilBiomassSARJ1972–2015
TS14Pointhead flounderCleisthenes pinetorumWarmJanuary–AprilBiomassSARJ1966–2014
TS15Roundnose flounderEopsetta grigorjewiColdJanuary–AprilBiomassSARJ1966–2015
TS16Roughscale soleClidoderma asperrimumColdFebruary–AprilBiomassSARJ1972–2015
TS17Yellow goosefishLophius litulonWarmFebruary–MayBiomassSARJ1973–2015
TS18Daggertooth pike congerMuraenesox cinereusWarmJune–OctoberCatch Sea Around Us1956–2015
TS19Bastard halibutParalichthys olivaceusWarmMarch–JuneCatchSea Around Us1956–2015
TS20Large yellow croakerLarimichthys croceaWarmMarch–JuneCatchSea Around Us1957–2015
TS21Small yellow croakerLarimichthys polyactisWarmMarch–JuneCatchSea Around Us1956–2015
Note: ARCSFA represents the Annual Report of Catch Statistics on Fishery and Aquaculture; SARJ represents the Stocks Assessment Report of Japan (http://abchan.fra.go.jp/index.html) (accessed on 6 December 2020). The data from Sea Around Us (http://www.seaaroundus.org/) (accessed on 8 January 2021) were bottom trawl data.
Publisher’s Note: MDPI stays neutral with regard to jurisdictional claims in published maps and institutional affiliations.