Article

Population Genetic Assessment of Anadromous and Resident Striped Bass (Morone saxatilis) in the Roanoke River System, Eastern United States

1
Department of Fish and Wildlife Conservation, Virginia Polytechnic Institute ad State University, Blacksburg, VA 20461, USA
2
South Carolina Department of Natural Resources, 331 Fort Johnson Road, Charleston, SC 29414, USA
3
Department of Natural Resource Ecology and Management, Iowa State University, Ames, IO 50011, USA
4
Department of Environmental Medicine, New York University School of Medicine, New York, NY 10010, USA
*
Author to whom correspondence should be addressed.
Fishes 2020, 5(3), 24; https://doi.org/10.3390/fishes5030024
Submission received: 4 June 2020 / Revised: 27 July 2020 / Accepted: 30 July 2020 / Published: 7 August 2020

Abstract

:
Striped bass is the subject of important commercial and sport fisheries in North America. The Roanoke River drainage—especially Smith Mountain Lake, Leesville Lake, and Kerr Reservoir—has popular recreational striped bass fisheries. After construction of five hydroelectric dams, populations became landlocked, declined, and have been supplemented by stocking. A key basis for responsibly augmenting populations is to characterize genetic variation and incorporate the findings into responsible hatchery and stocking practices. Genetic variation at 12 microsatellite DNA loci was evaluated among 837 striped bass representing 16 collections across the native range; populations from rivers in South Carolina, North Carolina, Chesapeake Bay, and Hudson River were screened to provide context for assessing genetic structure within the Roanoke system. Analysis of population genetic differentiation showed landlocked Roanoke River striped bass to be distinctive. Subject to genetic isolation, high M ratios, and relatively low Ne estimates suggest loss of genetic variation, and relatedness analysis showed heightened frequencies of related individuals. These insights into population genetics, demographics, and existing guidelines for broodstock acquisition and mating designs can inform genetically cognizant hatchery management and stocking for striped bass in the Roanoke River drainage. In particular, we recommend the use of larger numbers of breeders and factorial mating designs to increase the genetic diversity of propagated striped bass stocked within the Roanoke River drainage.

1. Introduction

Striped bass (Morone saxatilis) is the object of important recreational and commercial fisheries throughout North America [1]. The native range of the species includes the Atlantic and Gulf of Mexico coasts of North America [2], and after it was introduced to the Pacific coast in California in the late 1870s, the species subsequently spread north to establish reproducing populations in Oregon [3,4]. Striped bass exhibits both anadromous and freshwater resident life-history strategies, and populations may exhibit multiple life-history strategies [5,6,7,8,9], which may be related to population size [10,11] and ontogenetic development [8,12]. Partial migration, where some individuals in a population are resident while others migrate [13], and contingent behaviors also are known. Because of habitat loss and fishing pressures, striped bass populations suffered significant declines, in different locations starting at different times from the 1950s to the 1980s [14]. To reverse these declines, several fisheries management agencies began striped bass stocking programs [15]. The success of these programs has been inconsistent, in part because of the species’ sensitivity to stress and environmental conditions and inability to complete their migratory life history in landlocked systems [16].
Striped bass is a widely sought gamefish in the Commonwealth of Virginia, where the Roanoke River drainage has highly popular striped bass fisheries [17]. While striped bass in the Roanoke River system historically occurred from the Blue Ridge Mountains to the Atlantic Ocean, construction of a series of five dams in the 1950s (Kerr, Roanoke Rapids) and 1960s (Smith Mountain, Leesville, Gaston, VA, USA) (Figure 1) blocked striped bass migration to and from the Atlantic Ocean and prevented striped bass from migrating among reaches within the Roanoke River. The respective aggregations of striped bass became isolated, and some declined. Faced with declining fisheries, managers initiated supplemental stocking. For example, after Kerr Reservoir was filled in 1952, the population initially had high abundance and supported a high level of harvest, but declines in natural recruitment led to the need for supplemental stocking [18]. The original Brookneal Hatchery was built in 1963 to propagate striped bass migrating upstream from Kerr Reservoir to spawn in the Roanoke River. Striped bass have been stocked into Kerr Reservoir sporadically since 1953, with regular annual stocking beginning in 2003 (Supplemental Table S1). Although a naturally reproducing population of striped bass was recognized by the late 1960s–early 1970s, recruitment and catch-per-unit-effort (CPUE) have proved highly variable. Captures of citation-sized striped bass (94 cm total length, 9.1 kg) in the Roanoke River basin have declined from 841 in the 1980s, to 69 in the 1990s, 32 in the 2000s, and only 12 in the 2010s (Dan Michaelson, Virginia Department of Game and Inland Fisheries, personal communication). The decline of the striped bass fishery could be due to the introduction of the competitor blue catfish Ictalurus furcatus to Kerr Reservoir in 1985, poor growth rate, inbreeding, poor water quality, intra-specific competition, and the introduction of parasites (Dan Michaelson, Virginia Department of Game and Inland Fisheries, unpublished data).
Historically, the hatcheries that supplied striped bass for stocking into the Roanoke River system used only a small number of broodstock, a practice that in general has been linked to a reduced genetic diversity and decreased effective breeding population sizes ( N e ) [19,20]. In recent years, all individuals collected for broodstock, generally 4–6 females and 8–12 males, came from Kerr Reservoir (Virginia Department of Game and Inland Fisheries, unpublished documentation). Propagation of wild broodstock at the new Vic Thomas Hatchery in Brookneal, Virginia formerly was performed using strip-spawning and artificial fertilization, but more recently individual females have been held in tanks with multiple males and allowed to spawn volitionally. Most young are stocked into Smith Mountain Lake, Leesville Lake, and Kerr Reservoir, and any excess fry or fingerlings are stocked into the mainstem of the river. Striped bass from the lower Roanoke River, Albemarle Sound, or the Cape Fear River (all in North Carolina) have been stocked occasionally into Smith Mountain Lake, where they do not reproduce and from which there is no outmigration (Dan Michaelson and Scott Smith, Virginia Department of Game and Inland Fisheries, personal communication). Noting trends towards decreasing individual size and population demographic fluctuations, fishery managers are concerned that hatchery augmentation using few spawning individuals over a long period of time has led to inbreeding depression, especially for striped bass within Kerr Reservoir. This explanation has heretofore not been tested.
To inform management of Roanoke River striped bass fisheries, genetic data need to be compared to those of other populations across the species’ native range. While striped bass has been the subject of numerous molecular genetic studies to identify its population structure, most have focused on the coastal migratory stock [21], i.e., the anadromous populations that migrate between spawning sites in rivers and the Atlantic Ocean. The coastal migratory stock includes a contribution from the Roanoke River [22]. However, striped bass along the Atlantic Coast south of the Roanoke River to the St. Johns River, Florida are believed to be non-migratory [23]. Using mitochondrial DNA (mtDNA) markers, low levels of intraspecific sequence diversity proved unsuitable for assessing fine-scale genetic differentiation among many populations [24,25,26]. However, the use of nuclear DNA markers, especially microsatellite DNA, has proven useful for recognizing differentiated populations [21,27,28]. Gauthier et al. [27] showed that the Hudson River, Delaware River, pooled Chesapeake Bay collections, Roanoke River, and Santee-Cooper system supported genetically distinct populations. Screening striped bass populations in the southeastern United States, Anderson et al. [28] found strong genetic differentiation between the aggregated Santee-Cooper collection and the Roanoke River. Wirgin et al. [21] showed genetically distinct populations across the species’ distribution, including the Miramichi, Shubenacadie, Hudson, Delaware-Chesapeake, Roanoke, and Santee-Cooper rivers, which mostly corroborated the results of earlier studies using mitochondrial mtDNA markers [25,26]. The Santee-Cooper population was found to be highly distinct from that in the Roanoke River and all other populations coastwide, while populations nearer the center of the species’ distribution in the Roanoke River, tributaries of the Chesapeake Bay, Delaware River, and Hudson River showed much lower levels of genetic divergence. Screening 1256 single nucleotide polymorphism (SNP) loci, LeBlanc et al. [29] investigated the genetic structure of striped bass from 15 locations spanning the North American Atlantic coast from the Gulf of St. Lawrence (Canada) to the Cape Fear River, North Carolina (United States). While they found striking divergence among Canadian sites, which were isolated from each other and U.S. populations, the U.S. populations were much less differentiated. However, genetic differentiation between coastal and landlocked populations of striped bass has not been thoroughly assessed, notably that of populations in the Roanoke River.
Recognition of demographically and genetically distinct populations is critical for defining management units and for designing and implementing appropriate fisheries management practices. In some rivers, striped bass may exhibit multiple life histories [7]; hence, knowing the life history and genetic composition of striped bass in each particular river is useful for designing science-based fisheries management practices. Stocked landlocked populations of striped bass often are derived from various source populations, which can determine the overall genetic differentiation of spawning groups even within a river or reservoir [30]. Even low levels of genetic differentiation can distinguish migratory and non-migratory populations [27].
Fisheries management programs involving stocking should augment populations in a genetically cognizant manner; a key prerequisite is to characterize genetic variation and to incorporate the findings into responsible hatchery and stocking practices [31,32]. As noted above, microsatellite DNA markers provide a useful measure of population genetic diversity, structuring, and individual relatedness [33]. Against this background, the goals of this study were to: (1) Assess the position of the Roanoke River striped bass population within the genetic structure of the species along the U.S. Atlantic coast; (2) assess whether random genetic drift and inbreeding were apparent within striped bass populations in the Roanoke River system; and (3) frame recommendations for management of striped bass in the Roanoke River basin.

2. Results

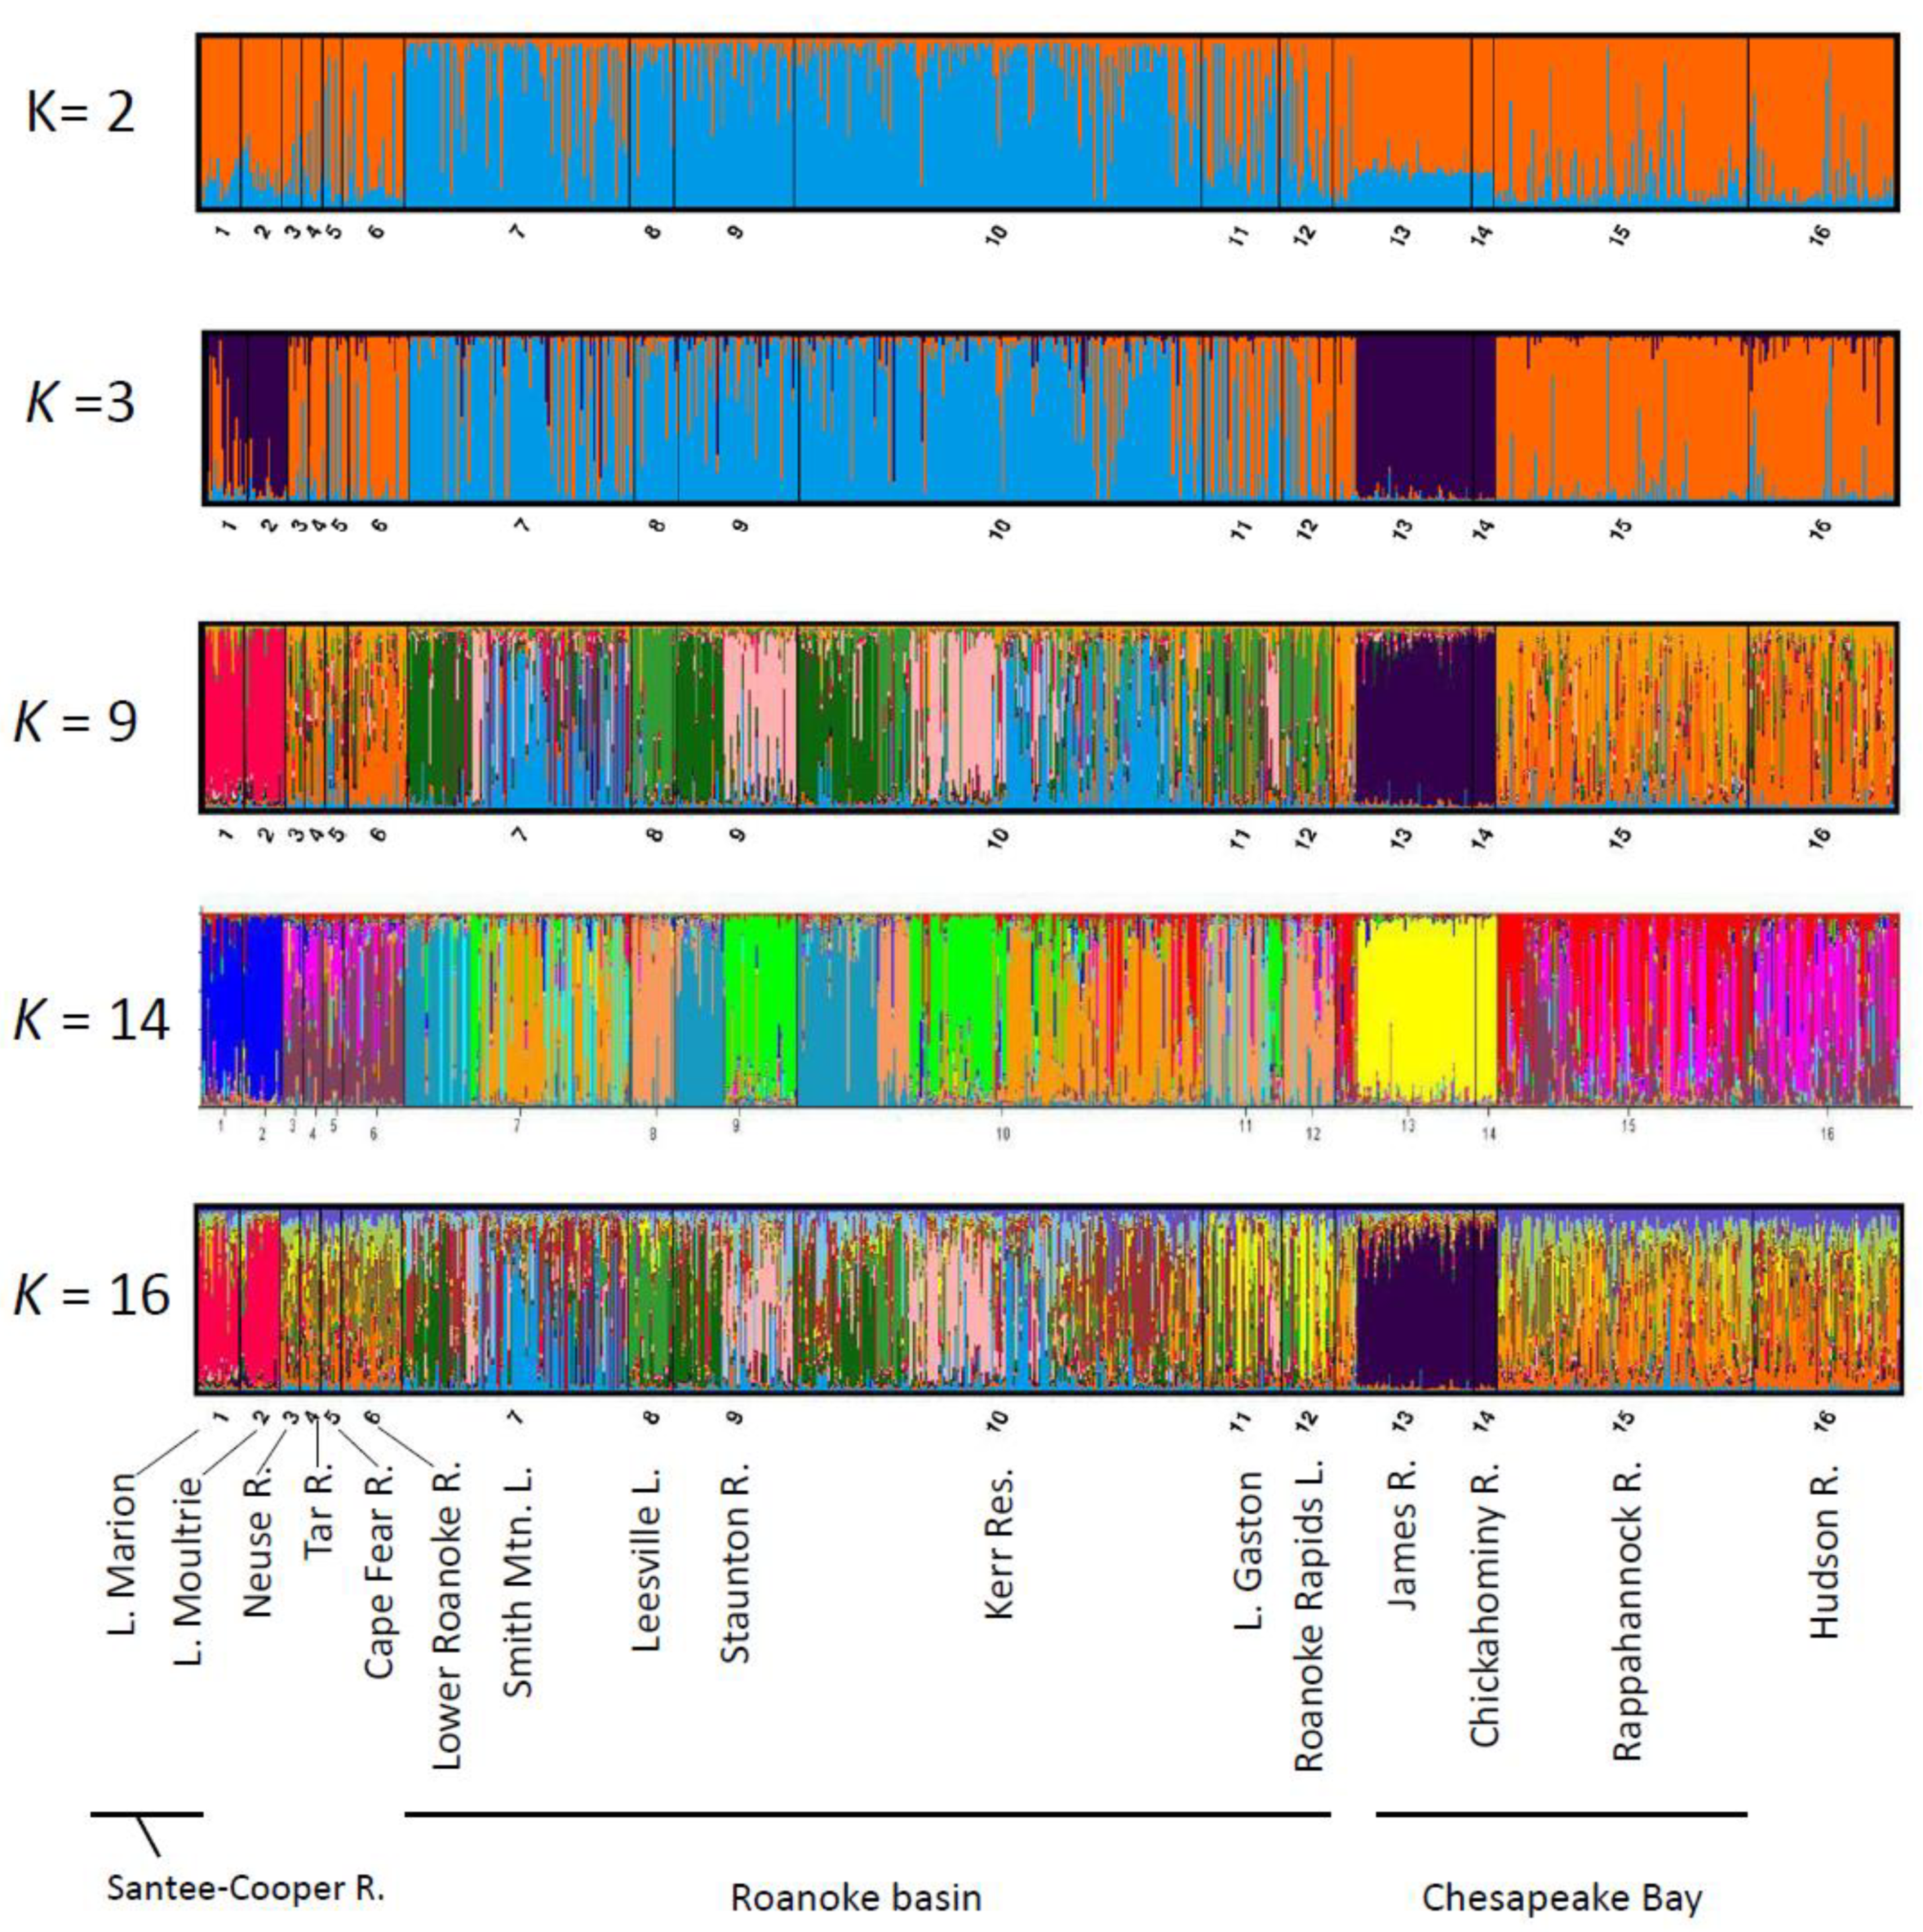
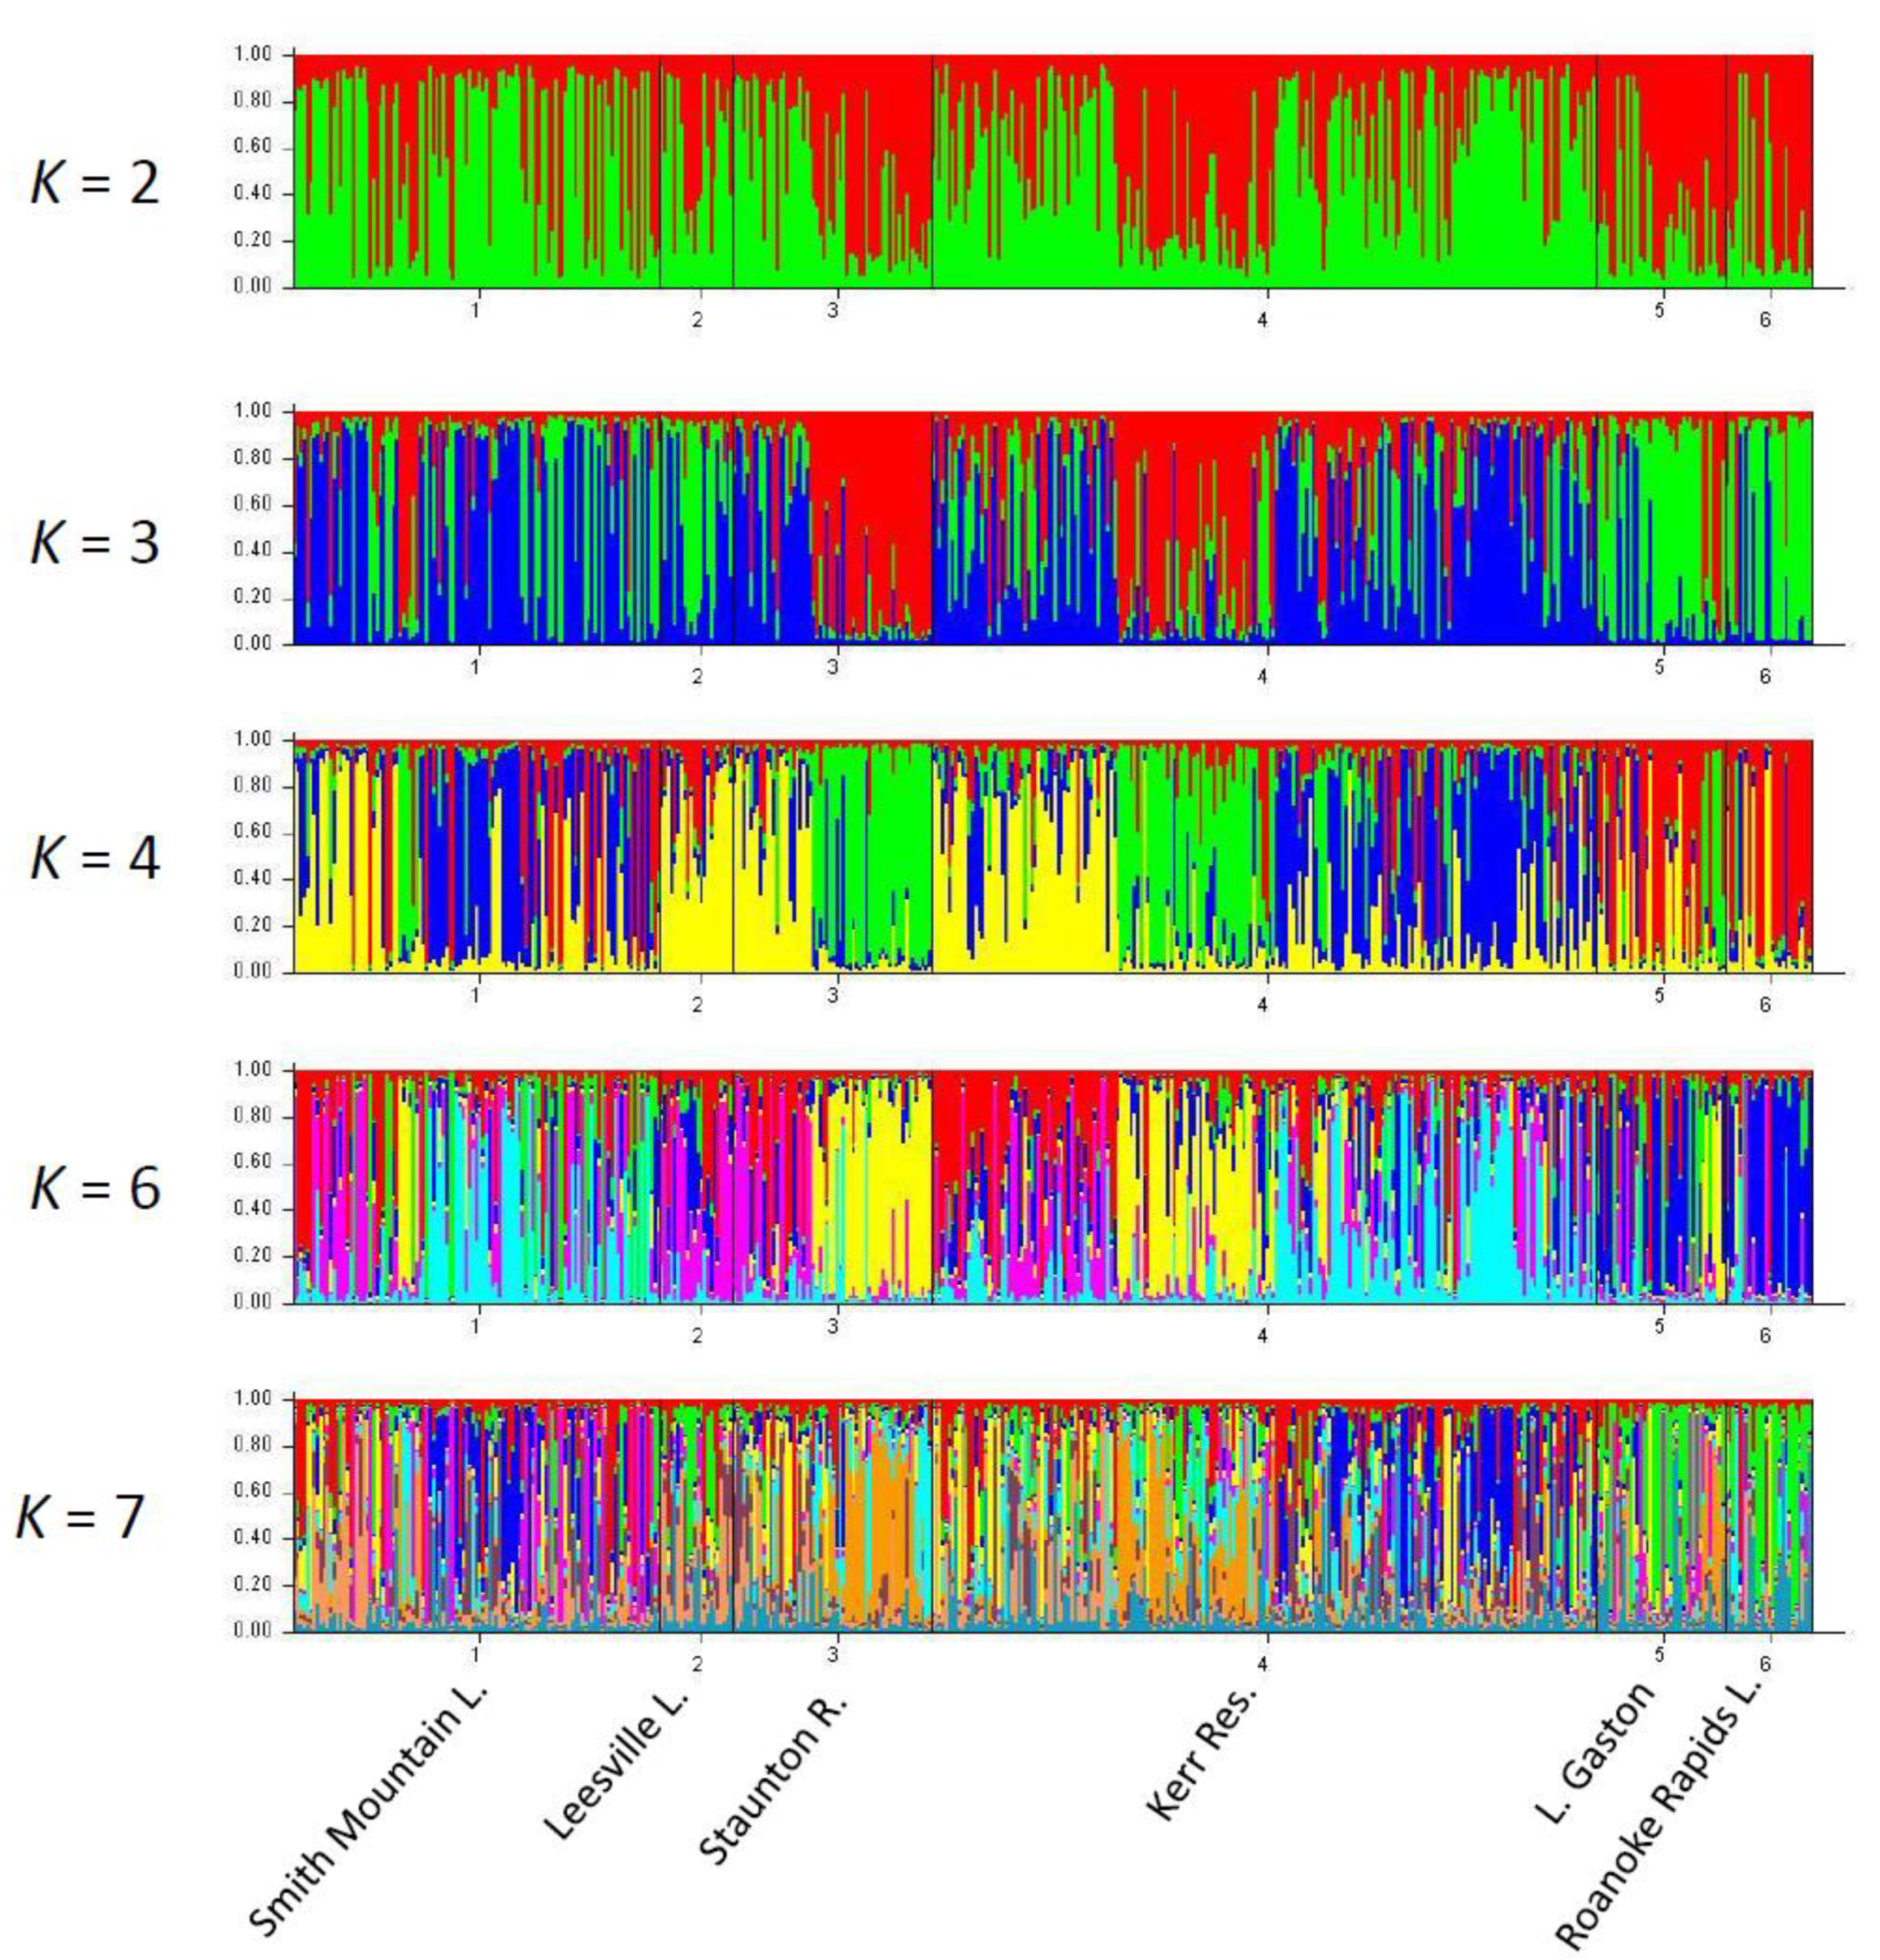
2.1. Assessment of U.S. Atlantic Coast Populations

A first set of analyses considered population genetic structure of striped bass from the Hudson River (New York), tributaries of the Chesapeake Bay (Maryland and Virginia), the Roanoke River basin of Virginia, and a suite of southeastern U.S. rivers in North Carolina and South Carolina (Table 1, Figure 2). All 12 microsatellite loci screened (Table 2) were polymorphic (Table 3, Supplemental Table S2) and provided no evidence of linkage disequilibrium or pervasive departures from Hardy-Weinberg equilibrium. However, microsatellite loci MSM 1144, 1243, 1094, and 1139 showed evidence of segregation of null alleles, and data from two loci with null alleles above a frequency of 0.1 were removed from further analysis. Mean numbers of alleles per locus were lowest in southeastern populations although sample sizes were small, higher in the Roanoke River drainage, and highest in the Chesapeake Bay and Hudson River systems. Expected and observed heterozygosities were comparable among all systems. M-ratios (i.e., the number of alleles observed as a fraction of those possible within the range of allele sizes within the population [34]) ranged from 0.06 for the Hudson River population to 0.29 for the Roanoke Rapids population, all below the criterion value of 0.68 [34] indicative of genetically bottlenecked populations.
To detect any signature of hierarchical genetic structuring among our collections, we examined the geographic distributions of multilocus genotypic clusters using Discriminant Analysis of Principal Components (DAPC) [35] for different levels of K (Figure 3), including the value that minimized the Bayesian information content (BIC). At K = 8, differentiation was evident among the five southeastern (shown in red and pale blue), Roanoke basin (pale green, orange, pale blue), Chesapeake Bay (green, pink, red, pale blue), and Hudson River (pink, red, pale blue) collections. Some clusters were shared among collections, especially among the anadromous populations. The lowest BIC value was observed for K = 11 (Supplemental Figure S1). The southeastern collections (purple, pale blue clusters) appeared distinct. The Roanoke basin showed several clusters (green and yellow). Differentiation was apparent among the respective Chesapeake Bay collections (pink, brown, and blue), with some clusters shared with the Hudson River collection.
Hierarchical structuring among populations range-wide was investigated further using the Bayesian clustering algorithm STRUCTURE [38] by viewing results for multiple values of K [39]. We used two commonly applied approaches to identify well-supported numbers of multilocus genotypic clusters in the data. Using the mean LnP(D|K) method [36]—i.e., the highest likelihood of the data given the number of clusters—as the critical metric showed the best-supported value to be K = 14 clusters across the range [38]. The Evanno et al. [39] K metric (Supplemental Figure S2) best supported K = 3 [40]. STRUCTURE bar-plot outputs for different values of K (Figure 4) supported different insights into differentiation among clusters. At K = 2, differentiation was apparent between landlocked collections (1–6) in the southeast and (13–16) in the upper Roanoke basin (colored orange) versus anadromous populations (colored blue). Interestingly, the lower Roanoke River population (collection 6) showed a signature of mixing of landlocked and anadromous ancestry. At K = 3, the James and Chickahominy rivers within the Chesapeake Bay region were distinguished as a genetically distinct assemblage, most similar to the Lake Marion and Lake Moultrie populations in South Carolina. Major similarities between the respective landlocked and respective anadromous populations across the range were apparent. At K = 9, the Roanoke River drainage showed genetic structuring, and two of the Chesapeake Bay (James and Chickahominy rivers) and the Cooper River populations (Lakes Marion and Moultrie) were distinctive from other groupings. At K = 14, the Cape Fear/Neuse/Tar, Roanoke basin, and Hudson assemblages were further divided. At K = 16, STRUCTURE output largely showed differentiation among sampling locations across the range, including structuring within the Roanoke River basin. The James/Chickahominy (Virginia) and Lake Marion/Lake Moultrie (South Carolina) clusters were well differentiated from other clusters across the range. There also was an indication of different genetic structuring within the northern Chesapeake Bay region and the Hudson River anadromous populations and the southeastern anadromous populations, although they still showed some degree of genetic similarity.
Against the background of the DAPC and STRUCTURE results, for analysis of molecular variance (AMOVA) we divided the striped bass populations into geographically defined groups to quantify hierarchical population structure. First dividing populations into four groups (Hudson River, Chesapeake Bay, inland Roanoke River, and southeastern rivers}, AMOVA results (Table 4A) showed that 85.6% of genetic variation across the entire range of populations was within individuals, 9.5% among individuals within populations, 2.8% among populations within the four major groups, and 2.1% among the major groups of populations. Repeating the analysis with five groups (Hudson River, Chesapeake Bay, inland Roanoke River, Tar/Neuse/Cape Fear rivers, and Santee-Cooper basin, Table 4B) had the effect of slightly increasing variation among groups while slightly decreasing other components of variance. All components of variance were significantly different from zero.
The overall departure of observed genotype frequencies from Hardy-Weinberg equilibrium (HWE) expectations F IT was 0.14, the localized departure F IS was 0.10, between sites within major groups F SC was 0.03, and between major groups FCT was 0.02 (Table 5), indicating that most of the departure from HWE was within populations. Heterozygote deficiency tests showed that there was a high level of homozygosity across loci within populations of striped bass across the range. The overall average F IS for the entire range of striped bass was 0.08, for the southeastern grouping of populations 0.06, for the Chesapeake Bay system 0.06, for the Roanoke basin 0.122, indicating larger local departures from Hardy-Weinberg equilibrium in the Roanoke system than elsewhere. The individual populations with the highest FIS metrics were Lake Moultrie, South Carolina (0.21), Staunton River, Virginia (0.18), Kerr Reservoir, Virginia (0.14), and Hudson River, New York (0.14). Maximum likelihood estimations of inter-individual relatedness within populations [Harris 2019 = 37] showed that approximately 15% of each regional population was made up of half-siblings, higher than might be expected within such large populations.
Metrics of pairwise interpopulation differentiation (Table 6) reflected significant geographic discontinuities. FST values among Roanoke River collections averaged 0.026, a low value as would be expected within a watershed. Mean FST among populations in southeastern rivers was 0.058 and among Chesapeake Bay populations 0.054. The Hudson River collection was more similar to the lower Roanoke River (FST = 0.022) and to southeastern (mean FST = 0.042) than to landlocked Roanoke (mean FST = 0.055) or Chesapeake Bay (mean FST = 0.051) collections. Although low, most FST values were significantly greater than zero.

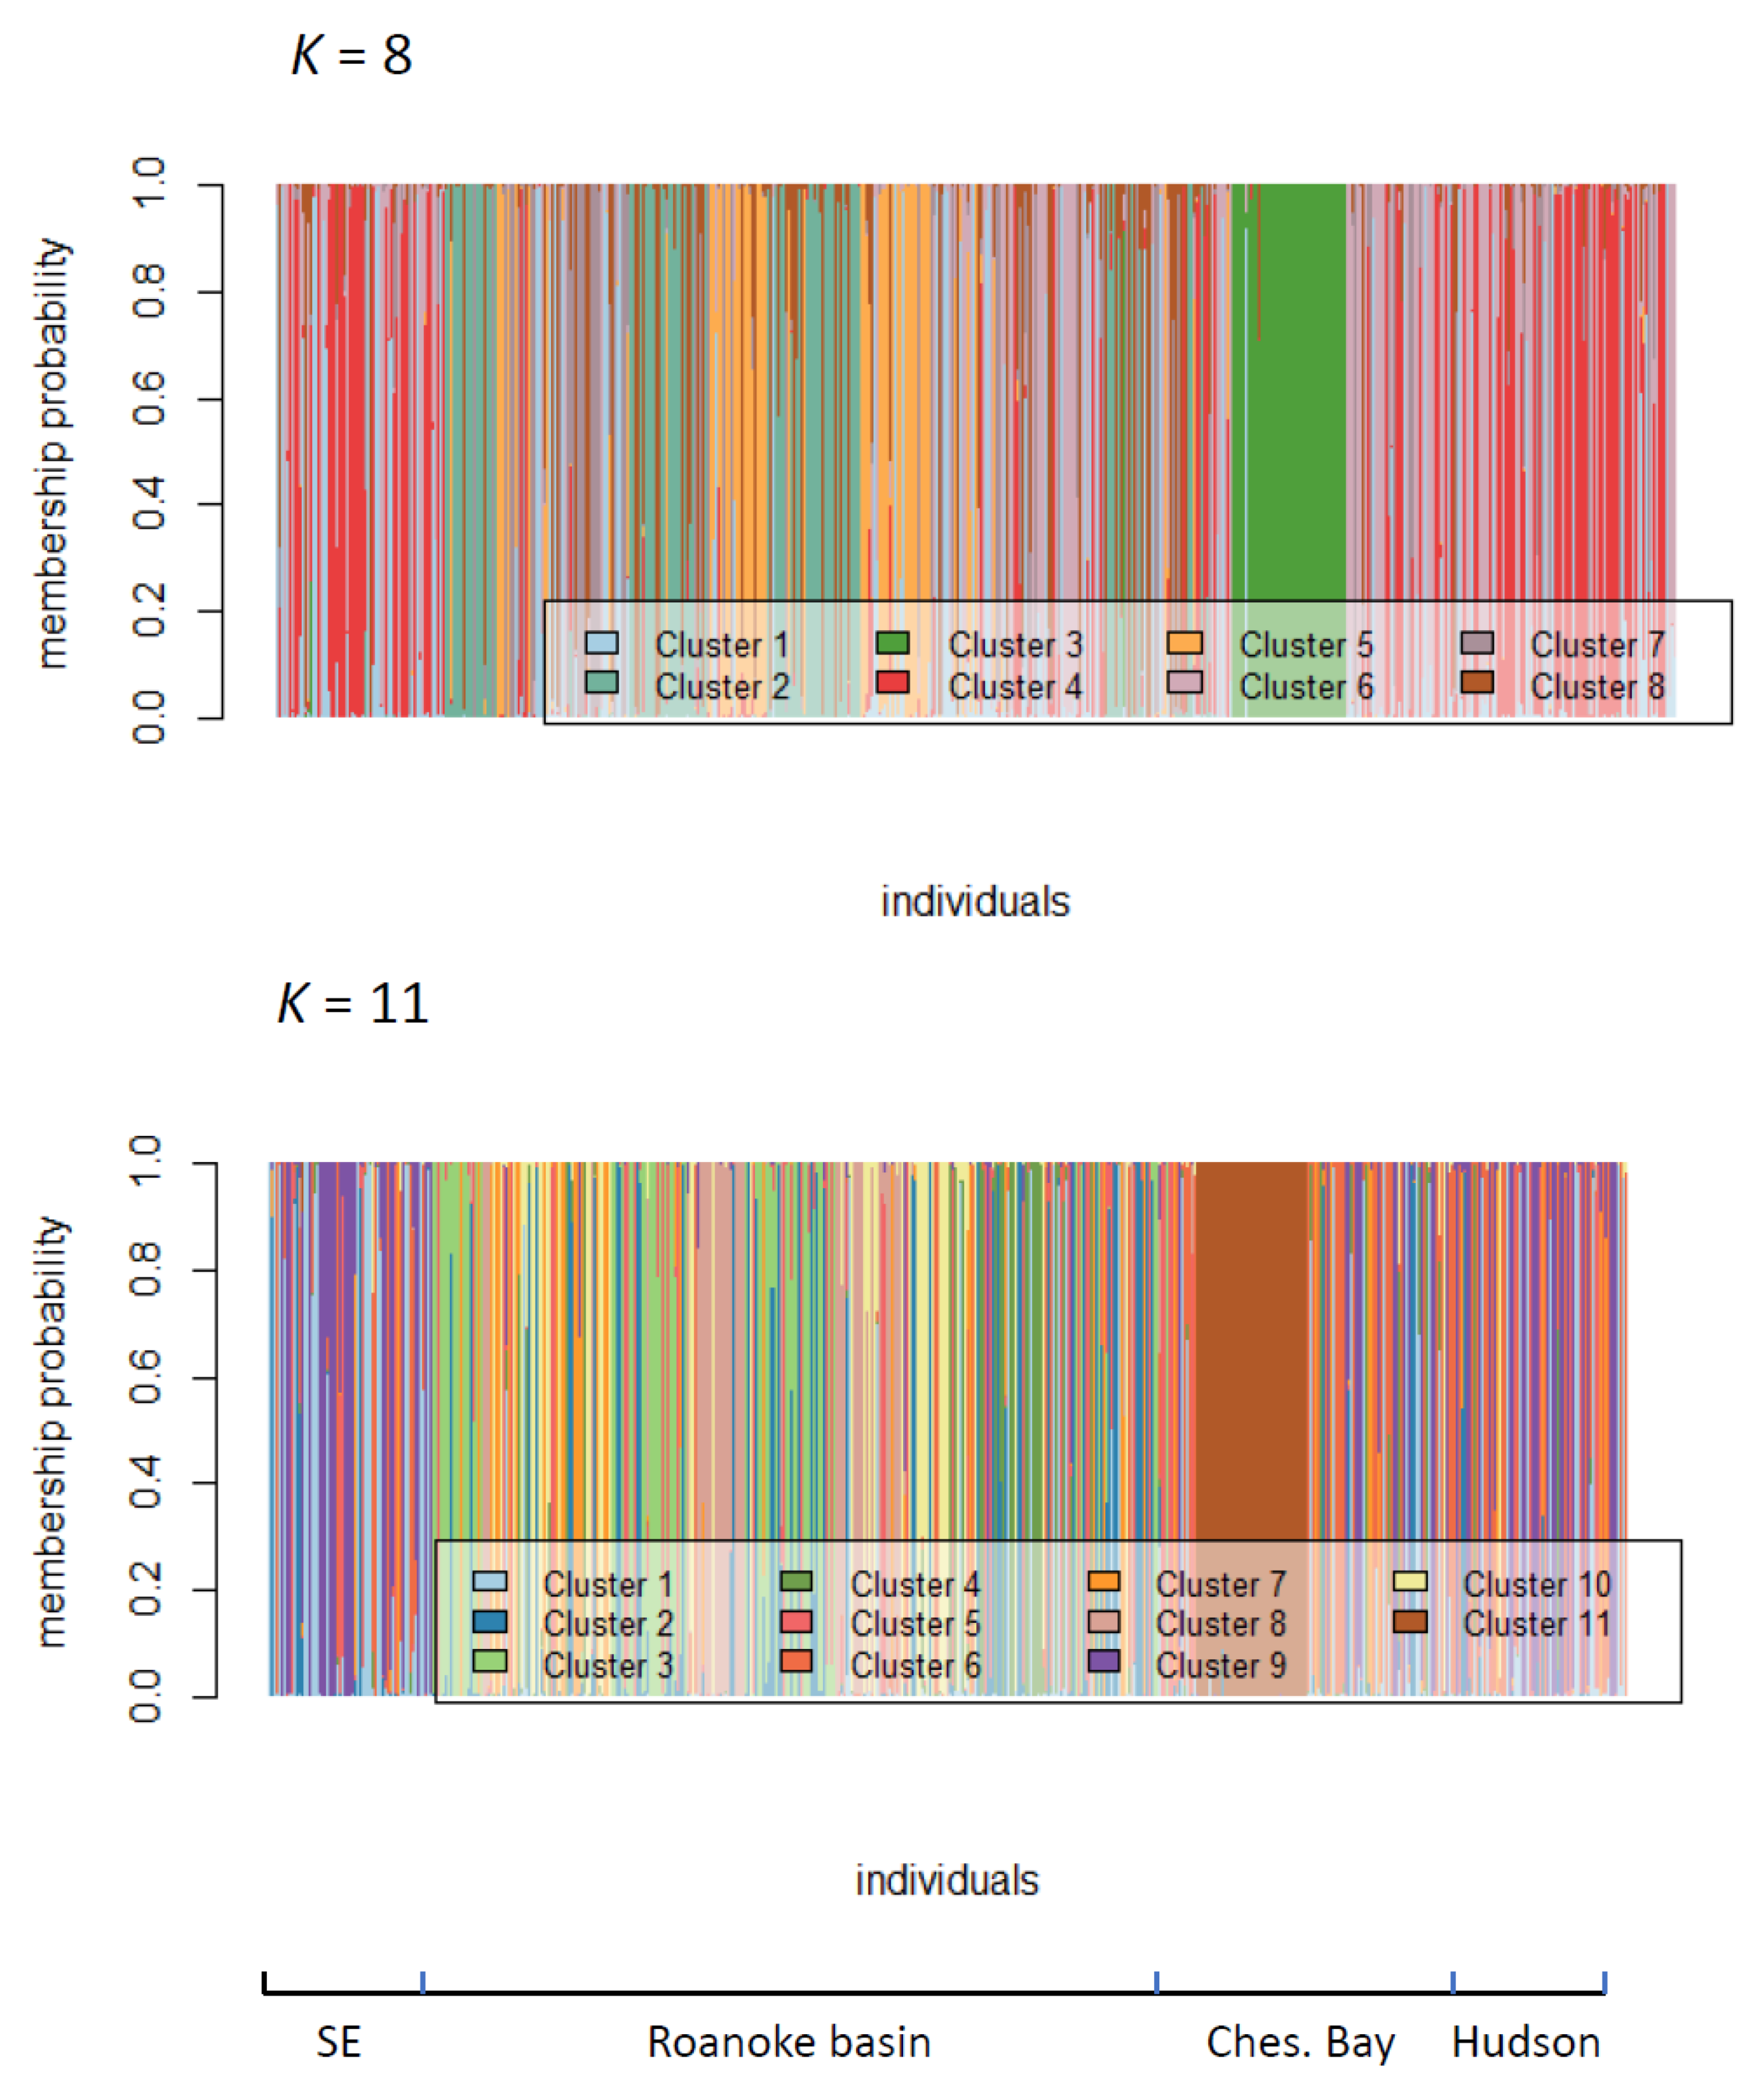
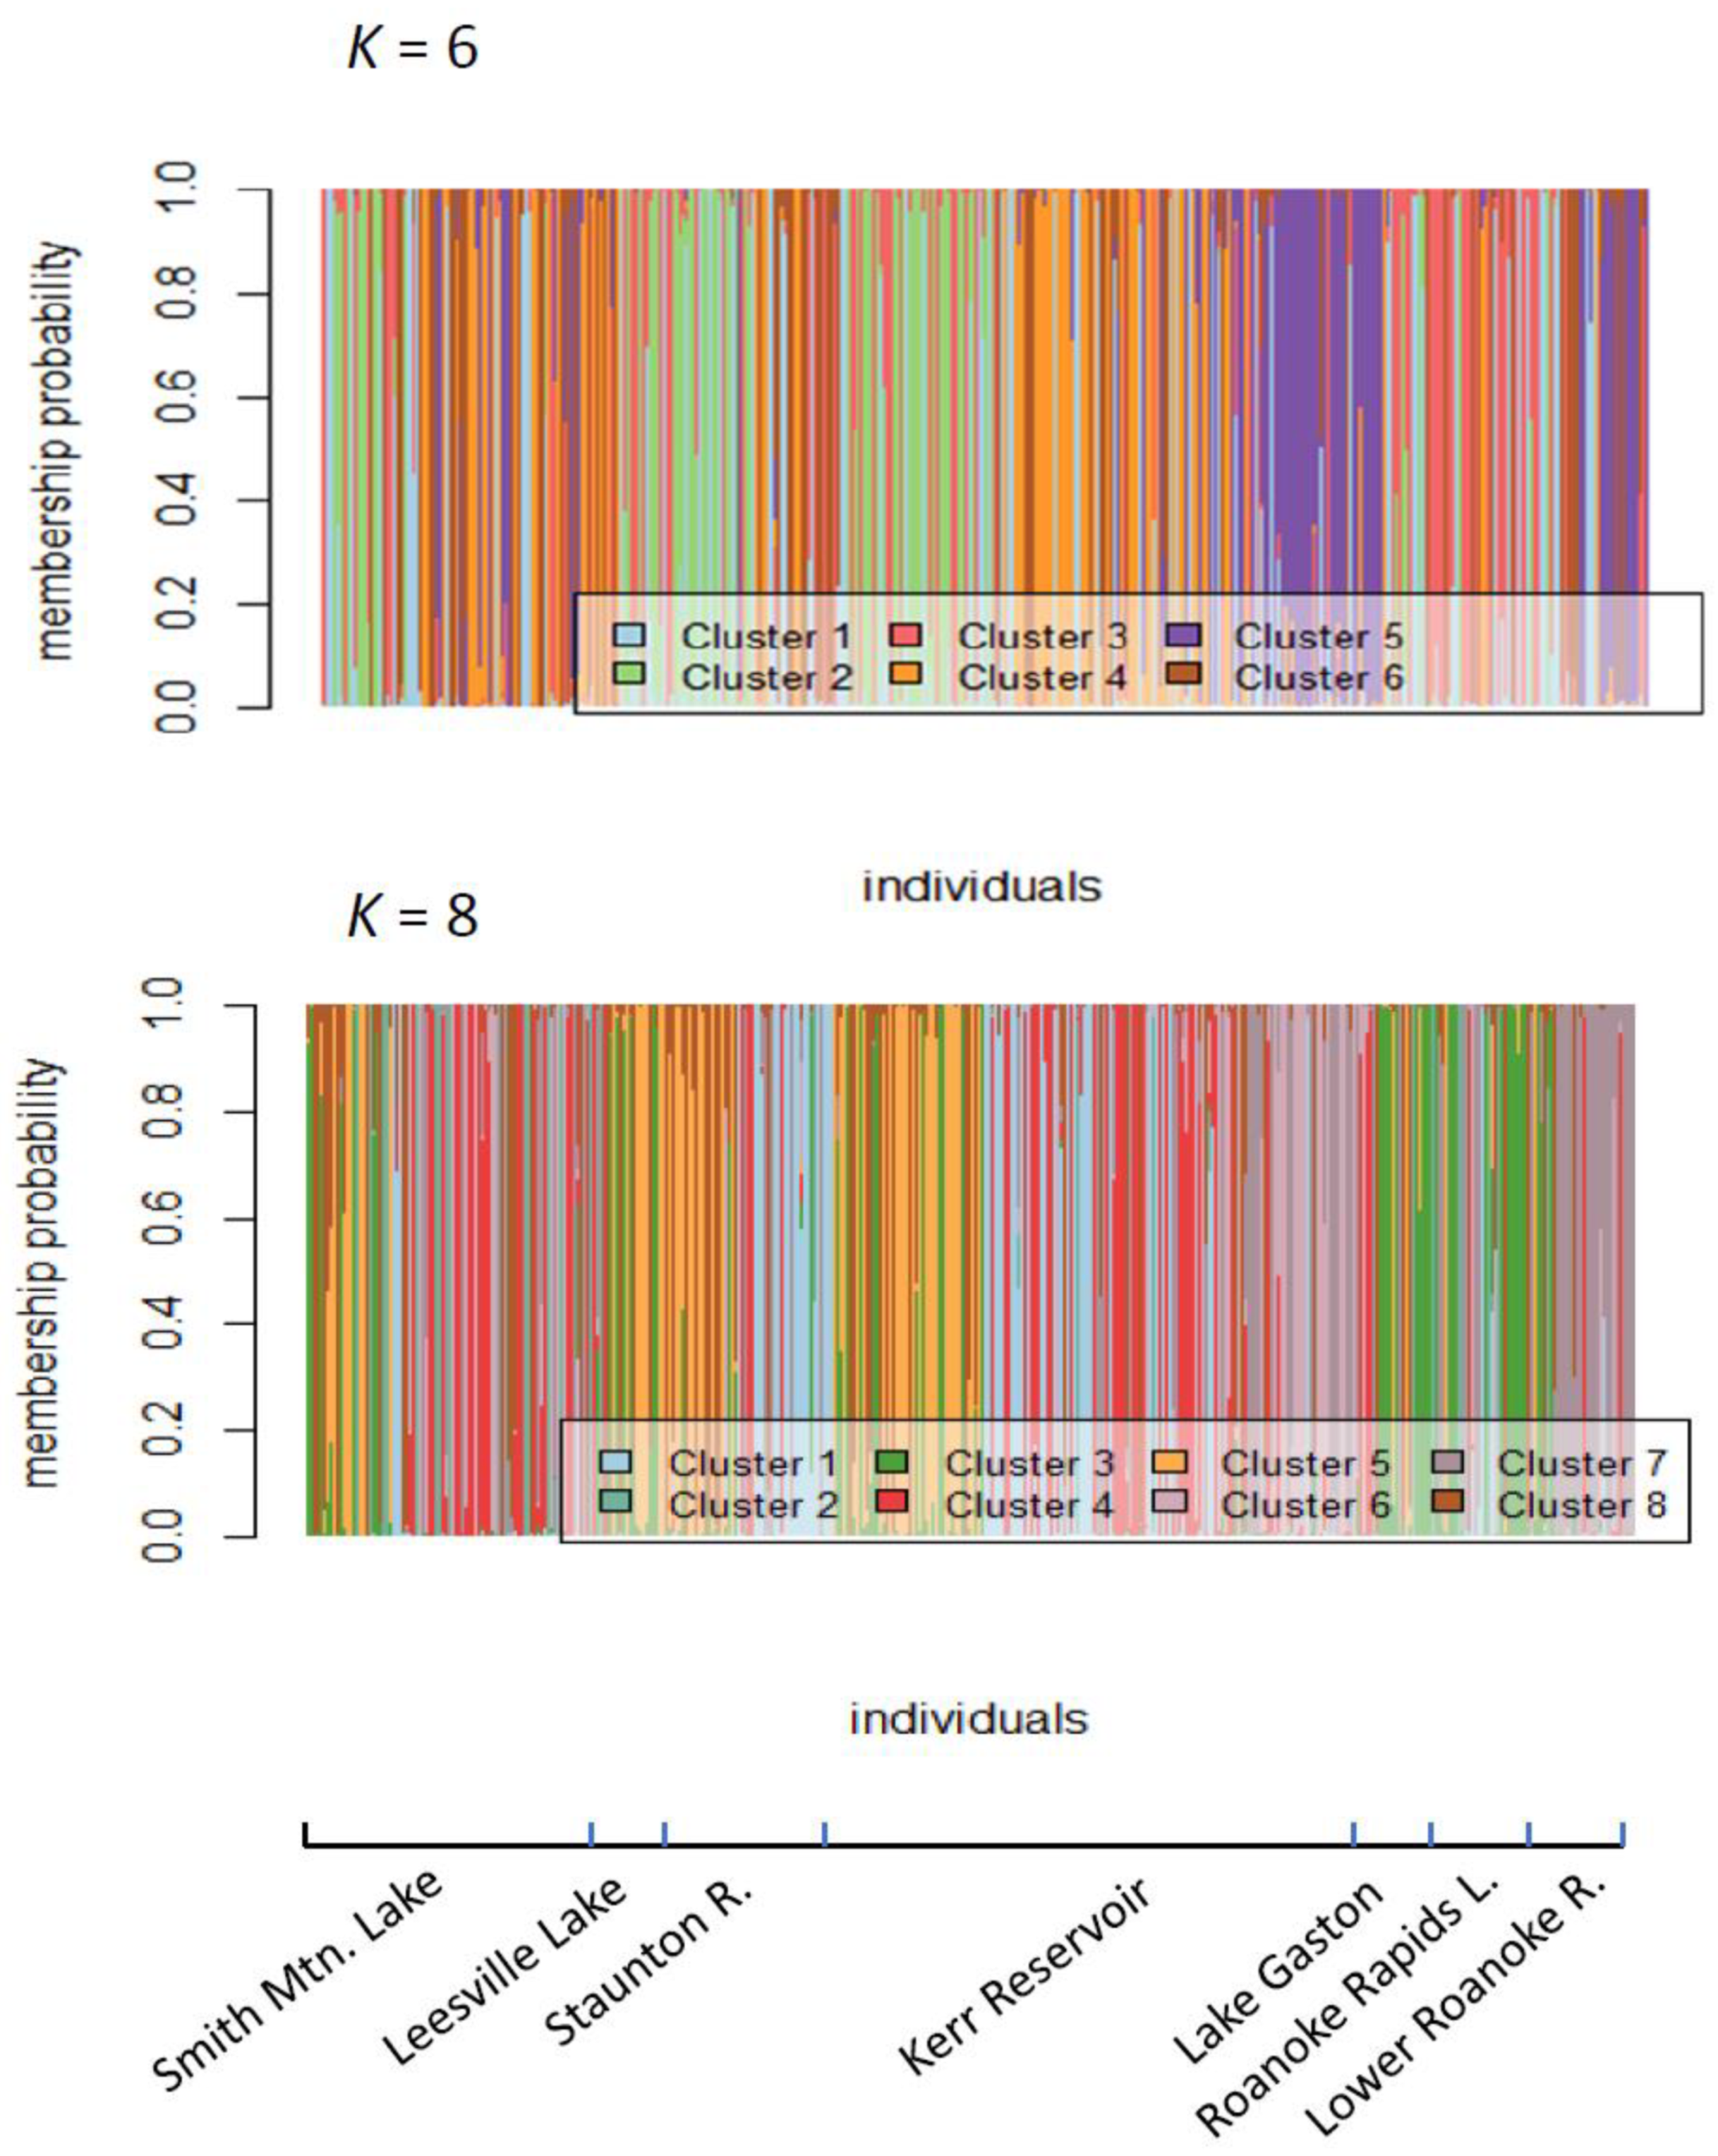
2.2. Assessment of Roanoke River Genetic Population Structure

The focus of this study was collections within the Roanoke River basin, particularly the genetic structuring among reservoir collections. Null alleles were detected to be segregating at microsatellite loci MSM 1243, 1094, 1208, and 1067; loci with null alleles more frequent than 0.1 were MSM 1243, 1094, and 1067, and their data were removed from the analyses.
Genetic structuring among Roanoke River basin collections was apparent in the DAPC results (Figure 5). While the respective clusters were dispersed throughout the basin at K = 6, cluster 2 (shown in pale green) tended to be distributed toward the upper basin and cluster 5 (purple) toward the lower basin. The lowest BIC value was observed at K = 8 (Supplementary Figure S3). Much the same spatial pattern was observed, with some clusters (e.g., 5, shown in orange) occurring more frequently upstream, others (3 and 7, green and grey) downstream, and yet others (1 and 4, pale blue and red) well dispersed throughout the basin. That there would be six to eight differentiated populations within the Roanoke basin is not tenable; rather, these clusters may represent subpopulations, cohorts, or groups of stocked hatchery-propagated fish. Downstream clusters may represent anadromous striped bass or their descendants.
Using STRUCTURE, the best-supported number of multilocus genotypic clusters in the data was K = 2 using the Evanno et al. [41] (Supplemental Figure S3) and K = 10 using the mean LnP(D|K) metric [38]. STRUCTURE results (Figure 6) for K = 2 separated clusters from various locations within the drainage without a well-defined geographic break. Results for K = 3 showed some differentiation between the far ends of the basin and structuring within reservoirs. K = 4 showed small amounts of population genetic differentiation above and below Kerr Reservoir. K = 6 further separated populations above Kerr Reservoir and showed the presence of some level of structuring. At K = 10, all collections were comprised of multiple clusters.
For AMOVA analyses, we divided Roanoke River collections into two groups, based on their position above or below the Roanoke Rapids dam that blocks upstream migration of anadromous striped bass. Results (Table 7) showed 82.3% of genetic variation of striped bass in the Roanoke River was within individuals, 12.6% among individuals within populations, 1.7% among populations within groups, and 3.38% between the upstream and downstream groups. All components of variance except for FCT, pertaining to variation between the landlocked and non-landlocked populations, were significantly different from zero. The overall departure from HWE F IT was 0.18, the localized departure F IS was 0.13, that between sites within groups F SC was 0.02, and that between groups FCT was 0.03 (Table 5).
The respective Ne estimates for Roanoke River striped bass collections (Table 8) ranged from the low tens to over 100; in most cases, estimates made using either the linkage disequilibrium and maximum likelihood methods fell within the 95% confidence interval for the other method. However, for the lower Roanoke River, the larger estimate was made using the linkage disequilibrium method, and for Smith Mountain Lake and Kerr Reservoir the larger estimates were made using maximum likelihood.
The respective methods for assessing relatedness presented somewhat different findings (Table 9), with lower frequencies of relatives estimated using the sibship assignment method. Using sibship assignment, frequencies of full-sibs were on the order of 1%, and of half-sibs 1–6%, with highest frequencies in the Staunton River. Using maximum likelihood, frequencies of full-sibs was less than 1% in the lower Roanoke River to nearly 4% in Smith Mountain Lake. Frequencies of half-sibs ranged from 8–13%. Low frequencies of parent-offspring relations were inferred, on the order of 1%.
FIS values (Table 10) suggested high levels of inbreeding. FIS being a measure of total departure of local populations from Hardy Weinberg equilibrium expectations, any departures because of inbreeding would be conflated with the effects of segregation of null alleles, and hence FIS metrics likely present inflated estimates of inbreeding. Using Chybicki and Burczyk’s [46] algorithm accounting for segregation of null alleles and any genotyping failures, estimated inbreeding coefficients for most populations were low. Estimated inbreeding was lowest in the lower Roanoke River, which is open to in-migration of unrelated individuals, and Smith Mountain Lake, which has received stocking from outside the basin. The mean inbreeding coefficient F for Kerr Reservoir, 0.03, was rather low. The highest estimated level of inbreeding was for the Roanoke Rapids Reservoir, with a mean F of 0.13.

3. Discussion

The major goal of this study was to conduct a baseline genetic assessment of striped bass collections in the Roanoke River drainage to inform genetically cognizant management of its fisheries. We sought to gain an understanding of how Virginia populations fit within the regional population genetic structure; assess ancestry, genetically effective breeding size and the extent of inbreeding of striped bass populations in the Roanoke basin; and formulate genetically cognizant recommendations for management of Roanoke River basin striped bass populations.

3.1. Range-Wide Genetic Differentiation of Striped Bass

Contemporary patterns of genetic differentiation among striped bass populations result from the natural history of the species. Pleistocene glaciation [49] affected the genetic structure of fish populations along the Atlantic Coast, creating population genetic differentiation between refuge populations in the south and populations further north founded by later recolonization events [50,51,52]. Southeastern U.S. striped bass populations have a relatively high level of genetic differentiation because of their long history, small effective population sizes, and some degree of isolation. However, with the mouths of the rivers in relative proximity, southeastern populations have been subject not only to random genetic drift, but also to straying of migrants among rivers, with a dynamic equilibrium between these counteracting processes. With the retreat of the glaciers and recolonization of newly available ecosystems, populations in the northeastern U.S. tend to show less genetic differentiation from one another. Among the populations in our data set, the Hudson River population is geographically separated from the other populations analyzed, although it maintains a genetic signature of shared post-Pleistocene natural history with other anadromous populations of striped bass, including the population in the Rappahannock River. Analysis of microsatellite [21] and SNP [29] data showed considerable genetic differentiation among striped bass populations in eastern Canada from one another and from more southerly coastal populations, perhaps because of smaller population sizes and random genetic drift. Landlocked populations in the Roanoke River system have been subjected to isolation and random genetic drift, and apparently also to the impacts of stocking.
The genetic differentiation that we observed among striped bass populations corroborates and builds upon the findings of past studies [21,27,28,29] regarding large-scale population genetic structuring of striped bass. As shown by our DAPC and STRUCTURE results, striped bass show population genetic differentiation within and among anadromous and landlocked collections. Geographic patterns of genotypic clustering at different levels of K reflected hierarchical levels of population genetic structuring. Viewing and reporting plots for multiple values of K is important for achieving insights into different levels of structure [39]; indeed, it is unrealistic to expect that there is one “true” K value that best models a particular data set [53]. A different, more meaningful question would be how many clusters are useful to describe the data [54]. Past stock-assessment studies have not always differentiated lower Roanoke River and Chesapeake Bay individuals [55,56], a result convergent with ours for the lower Roanoke River collection. We, however, inferred genetic differentiation between the anadromous (southeastern, Chesapeake Bay, and Hudson River systems) and landlocked, Roanoke River populations. In past studies, Gauthier et al. [27] and Wirgin et al. [21] found very small, but significant differences among a subset of collections from different rivers within the Chesapeake Bay. We observed distinct clusters of striped bass between the James and Chickahominy rivers of the Chesapeake Bay. In addition to the differentiation within the Chesapeake Bay, there was clustering of the coastal populations (southeastern, Rappahannock, and Hudson rivers). Lakes Marion and Moultrie, South Carolina showed divergence from more northerly coastal populations from the Neuse River, North Carolina to the Hudson River, New York populations. At high levels of K, we saw further genetic structuring within the coastal rivers, including the Neuse, Roanoke and Hudson rivers.

3.2. Genetic Structure of Striped Bass Within the Roanoke River Basin

We observed larger ranges of microsatellite allele sizes than did previous studies [28,36,57]. This is likely because we focused on striped bass populations in the Roanoke River basin, which are in the middle of the Atlantic Coast range and therefore well placed to exchange alleles with more southerly and northerly populations and examined variation at different collections of microsatellite loci. Further, more southerly populations being small and to varying degrees isolated, rare alleles would tend to become lost to drift, while more northerly populations were subject to founder effects when refuge populations recolonized the deglaciated region.
There are no archived scales or other tissues from Roanoke River striped bass, which limited our ability to distinguish natural population genetic structure from the impacts of stocking. It is unknown how many striped bass populations inhabited the Roanoke basin in pre-Columbian times. However, recent isolation of striped bass above the fall line, i.e., above the break between the flat coastal plain and the hilly Piedmont regions, by dams and heightened random genetic drift imposed by demographic decline, followed by stocking large numbers of hatchery-propagated fish derived from few pairings of breeders [20] have affected differentiation among aggregations.
Both DAPC and STRUCTURE results show multiple clusters that mix broadly through the entire Roanoke River basin. At higher levels of K, there is more differentiation both within and among sampling locations. This pattern suggests mixtures of naturally spawned and multiple cohorts of hatchery-derived fish, distinct cohorts because hatchery broodstock were collected anew each year and not reused. Hatchery-derived fish have been most heavily stocked into Smith Mountain Lake, Staunton River, and Kerr Reservoir. Kerr Reservoir has multiple genetic clusters (Figure 3 and Figure 5). Neal [58] assessed the extent of natural reproduction and the ability of the Roanoke River to transport eggs and developing larvae following spawning. Whitehurst [59] determined that both the Roanoke and Dan rivers had conditions conducive to striped bass reproduction and recruitment, although the Roanoke River was more conducive. Hence, striped bass spawning in those tributaries may be components of the Kerr Reservoir population. Conditions are supportive of survival of eggs and drifting larvae in some, but not all years, supporting episodic recruitment (Dan Michaelson and Scott Smith, Virginia Department of Game and Inland Fisheries, personal communications). Natural reproduction of striped bass in the Roanoke River, notably in Kerr Reservoir, contribute an estimated 10–25% of the Kerr Reservoir population (Dan Michaelson and Scott Smith, VDGIF, personal communication).
We obtained rather low estimates of Ne, with each collection in the Roanoke basin having low tens to over 100 effective breeding individuals. Kerr Reservoir, the main source of broodstock collection for the entire system, is estimated to have an Ne of ~75–125. (Table 8). Low ratios of Ne/N are not unusual for fishes [60], especially for long-lived, iteroparous anadromous species such as striped bass. Low estimated number of breeding individuals within a population is associated with an increased potential for genetic drift and ultimately to an elevated risk for inbreeding. Inbreeding was non-zero in landlocked Roanoke River collections (Table 10), and highest in the Roanoke Rapids Lake sample. Roanoke Rapids is the smallest and shallowest reservoir in the system; annual mortality rates are thought to be relatively high, and thus there are not many cohorts present in any given year. The fin clips for the Roanoke Rapids Lake sample likely were age−2 and −3 fish. The hatchery reportedly produces fingerlings stocked into Roanoke Rapids Lake from only one tank of broodfish normally containing one female and three males (Kirk Rundle, North Carolina Wildlife Resources Commission, personal communication).

3.3. Recommendations for Genetically Cognizant Management of Roanoke River Striped Bass

The application of population genetics to fisheries management can inform definition of biologically based management units (MUs). Management units are populations that are demographically independent of one another [61]; that is, their population dynamics depend mostly on local birth and death rates, and not on genetically effective migration from other spawning assemblages. Identification of MUs is useful for deciding upon short-term management actions, such as managing habitat, setting harvest rates, and monitoring population status. MUs generally do not show long-term independent evolution or strong adaptive variation from one another. Offering an operational molecular genetics-based definition, Moritz [62] suggested that MUs are populations that have substantially divergent allele frequencies at many loci.
Our findings support recommendations for enhancing management of striped bass. Chesapeake Bay and Roanoke River assemblages of striped bass populations should be managed separately. Results of cluster/assignment tests and significance of FST values indicate that these populations are genetically distinct. Because Chesapeake Bay populations are anadromous and Roanoke Basin populations above Roanoke Rapids Dam are landlocked, they may be adaptively differentiated, a possibility that should be examined using genomic approaches suitable for assessing adaptive genetic variation. Clearly, they are demographically independent. Within the fisheries management context, the implication is that there should be no transfers of fish between the respective watersheds.
Roanoke River striped bass comprises two demographically independent MUs, an anadromous one below the Roanoke Rapids Dam and a landlocked one in the watershed above it. Whether, and to what degree the respective populations exchanged migrants before the dam was built is unknown. Above the dam, while each reservoir’s fishery may be managed within its own unique demographic context, fish can justifiably be transferred among them.
While propagation of fishes in hatcheries and stocking into the wild might demographically boost a targeted stock, that benefit must be weighed against associated genetic hazards [63], including loss of within-population genetic variation due to genetic drift caused by propagation of too few spawners, which can then lead to increased variance of reproductive success for hatchery broodstock relative to wild spawners. Noting the high homozygosities and low Nes estimated for Roanoke River striped bass collections, we infer that loss of within-population genetic variation due to use of too few spawners and subsequent Ryman and Laikre [20] effect may have been realized in these Roanoke basin collections.
Just as ill-conceived propagation and stocking practices may promote realization of genetic hazards, genetically cognizant practices may address them. Guidelines promoting genetically cognizant supplementation of targeted populations [32] can be applied to supplementation of Roanoke River striped bass. The donor source should be of Roanoke River origin, collected and spawned in larger numbers than practiced historically. Given that striped bass is reasonably long-lived, each generation should be made up of several year-classes. Collections of at least 25 males and 25 females should provide a reasonable approximation of allele frequencies in the target population, without loss of rare alleles that may have adaptive value [64,65]. Broodstock should be marked, released, and not reused in subsequent years. In recent years, striped bass in both Virginia and North Carolina hatcheries have been allowed to spawn volitionally in large tanks. However, molecular marker-based studies of volitionally mass-spawning of fishes in hatcheries has shown highly skewed parental contributions to the resulting progenies, for example in white sea bass Atractoscion nobilis [66], Japanese flounder Paralichthyes olivaceous [67,68], gilthead sea bream Sparus aurata [69], Asian sea bass Lates calcarifer [70,71], and Atlantic cod Gadus morhua [72]. Darden et al. [73] used microsatellite markers to estimate contribution of different fish sizes, propagation designs, and release strategies for striped bass in lakes Marion and Moultrie in South Carolina. They found that volitional spawning of a single female with three males often led to a disproportionately high contribution from one male. In response, mating protocols were changed so that eggs stripped from each female were divided into three aliquots, each fertilized by the milt of one male, potentially increasing the effective population size of the progeny group. Hence, managers of hatcheries producing striped bass for stocking into the Roanoke system should utilize a mating scheme that maximizes Ne, by splitting egg lots for each female and fertilizing each aliquot with the milt of a different male in a hierarchical or diallel design. Because the Roanoke River was free-flowing as recently as 1953 and the spawning assemblages had been connected by gene flow, realization of outbreeding depression is not a likely hazard [74]. Hence, fish from all Roanoke River broodstock may be out-planted anywhere within the landlocked portion of the watershed. Fisheries biologists and culturists should design the broodstock collection, propagation, and stocking plans following further details provided by Miller and Kapuscinski [32].
Management recommendations similar to these are currently being implemented for stocking of striped bass populations in North Carolina. With baseline genetic analysis having been accomplished for populations in the lower Roanoke River system, parentage analysis has been applied for assessing the impacts of hatchery-based population augmentation [75,76]. Such an approach could be applied to the landlocked portions of the Roanoke River in Virginia to quantify the contribution from stocking of hatchery propagated individuals. Steele et al. [77] described SNP-based monitoring of the contributions of hatchery stocks of coho and Chinook salmon, Oncorhynchus kisutch and O. tshawytscha, respectively, using family printing [78], i.e., they traced the parentage of fish caught in the fishery to particular parental pairs spawned in hatcheries across the Columbia River basin. Such genetic marker-based management designs could be applied to strengthen management of striped bass in the Roanoke River system.
Among explanations offered for the decline of the striped bass fishery in Kerr Reservoir was inbreeding depression. Although critical levels of inbreeding have not been established for striped bass, the levels of inbreeding depression that we estimated, with the exception of Roanoke Rapids Reservoir, do not seem high enough to explain the poor fishery performance. Hence, ecological explanations for the decline of the fishery—such as the establishment of invasive, competing catfishes and aging, less productive reservoirs—seem more tenable.

4. Materials and Methods

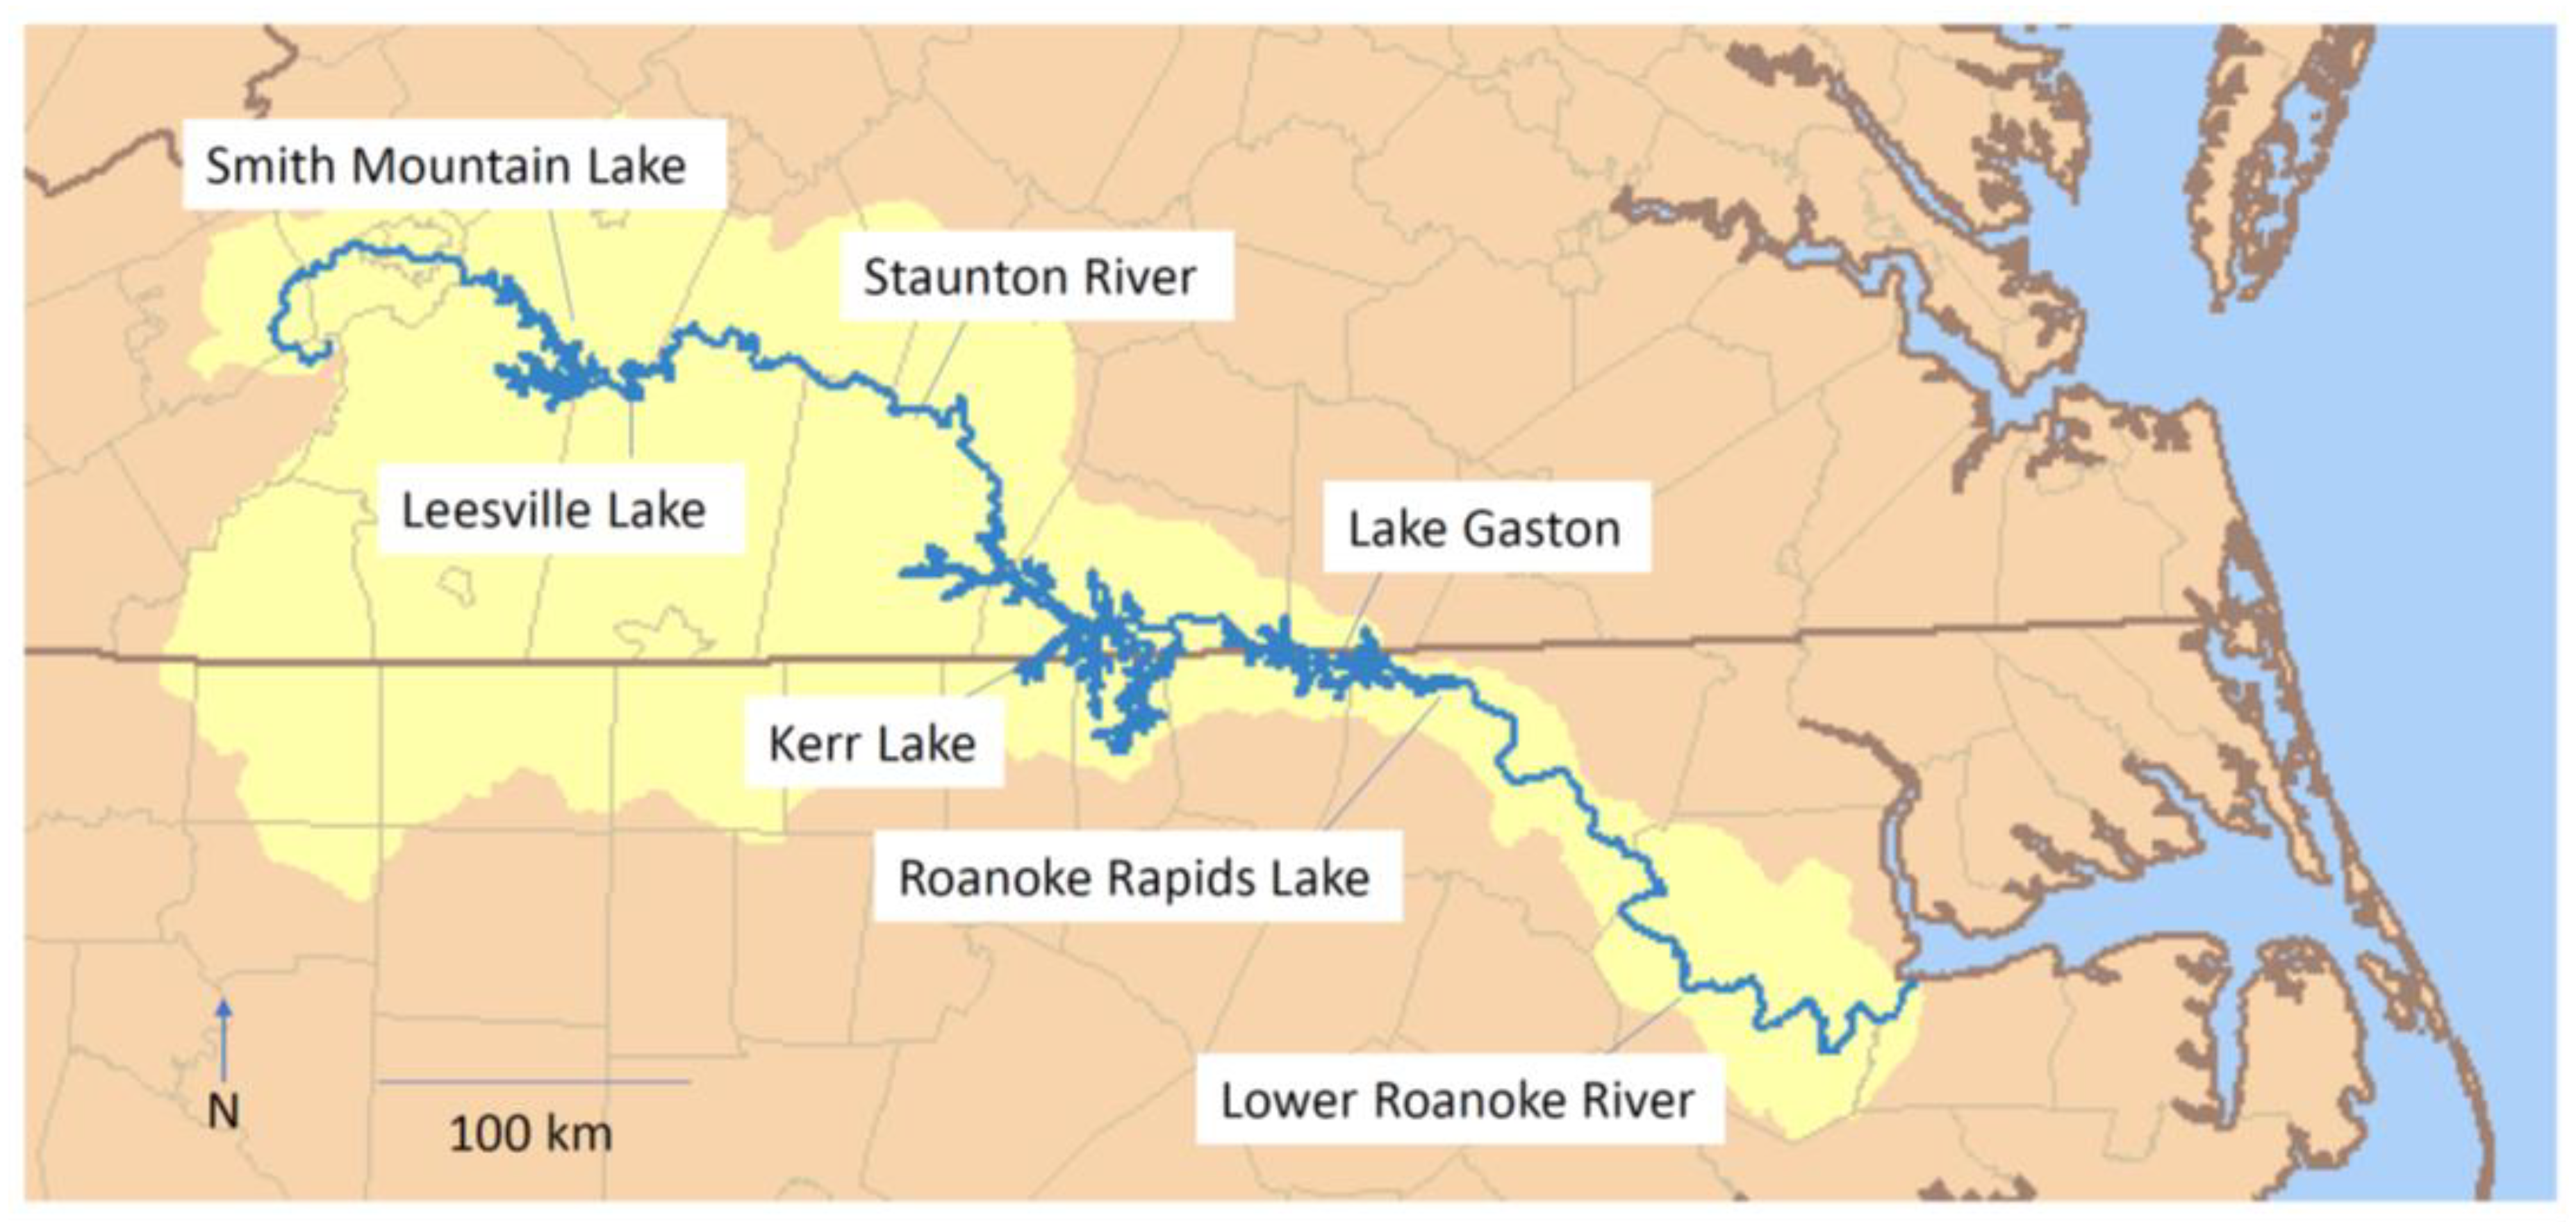
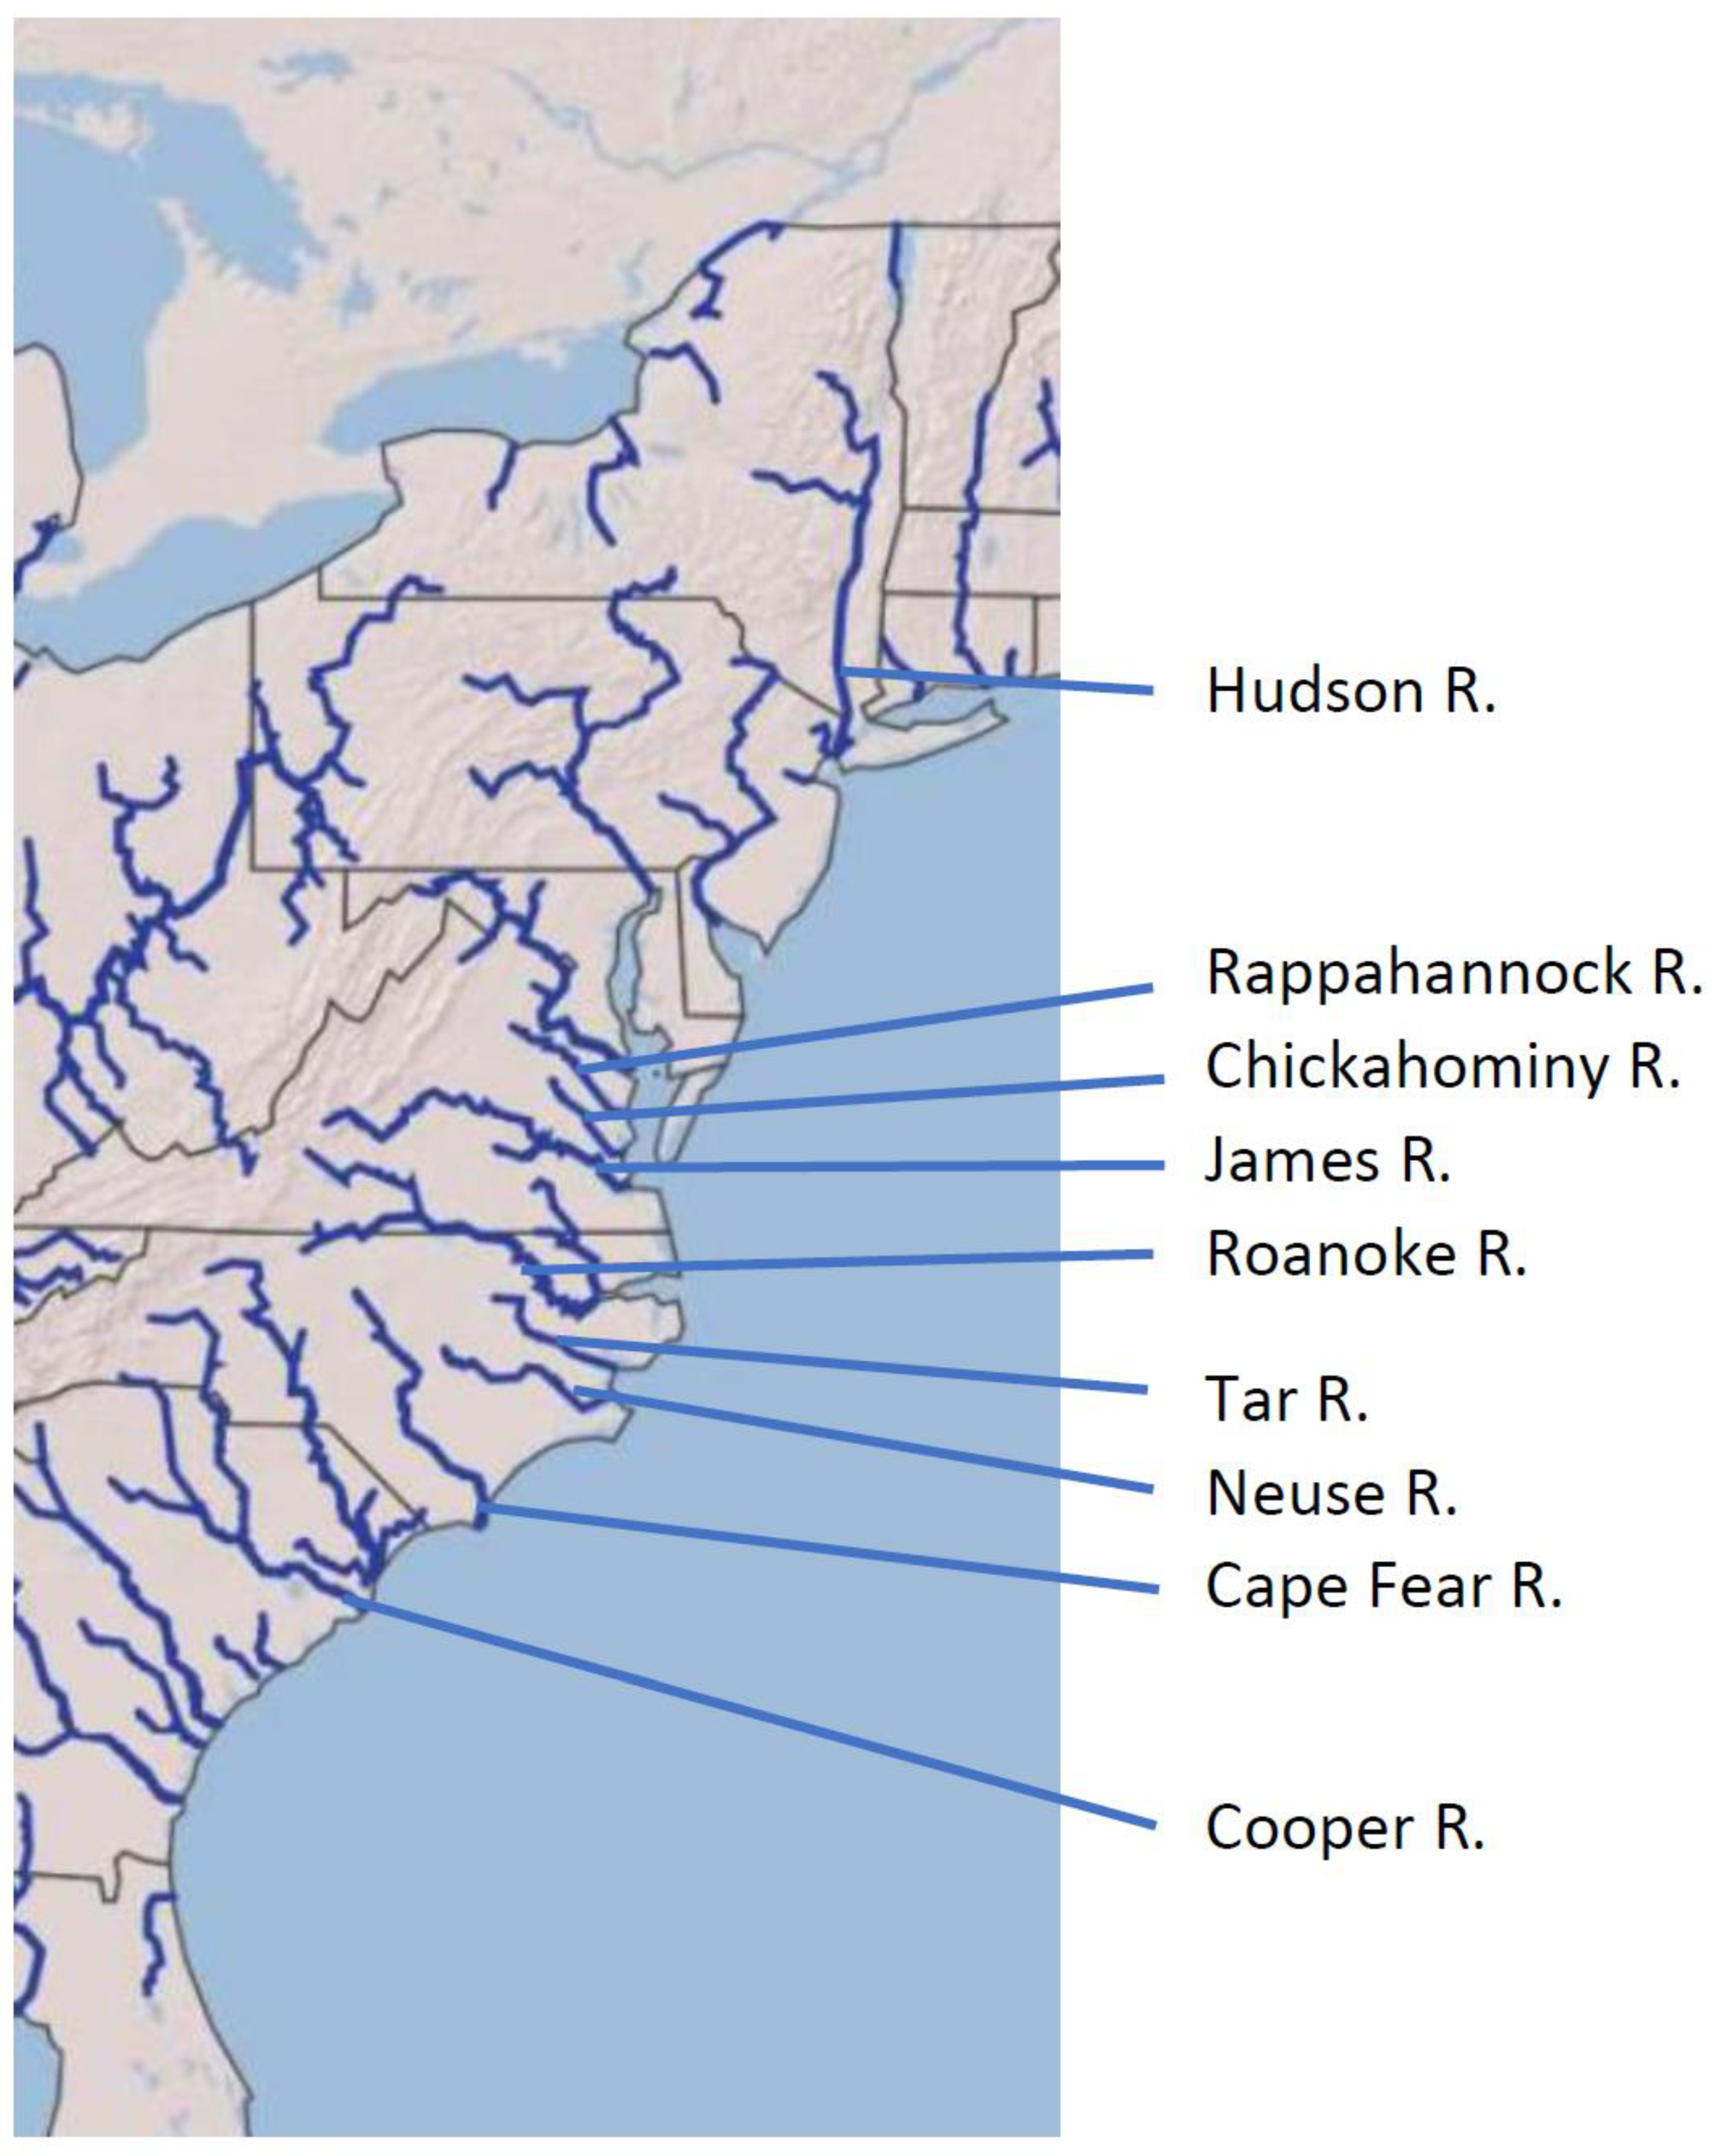
4.1. Sampling and Study Area

The focal study area was the Roanoke River basin in south-central Virginia (Figure 1). Roanoke-drainage striped bass were sampled by Virginia Department of Game and Inland Fisheries (VDGIF) personnel, including aggregations isolated by dams, i.e., from Smith Mountain Lake, Staunton (=Roanoke) River, Kerr Reservoir, Leesville Lake, and Lake Gaston and from the Roanoke River below Kerr Reservoir. Samples collected from the James River and Rappahannock River by VDGIF were used as a regional outgroup. Other outgroup samples from various locations in North and South Carolina were provided by Tanya Darden and Daniel Farrae (South Carolina Department of Natural Resources) and from the Hudson River, New York by author Isaac Wirgin (New York University) (Table 2, Figure 1).

4.2. Molecular Methods

DNA was isolated from fin clips using the DNEasy Blood and Tissue Kit (Qiagen, Germantown, MD). Twelve microsatellite DNA loci were amplified using published primer-pair sets [36,37], (Table 2). Methods followed those of Couch et al. [36], Fountain et al. [57], and Anderson et al. [28]. DNA samples provided by the South Carolina Division of Natural Resources (Neuse River, Cape Fear River, Santee-Cooper system, Ashepoo-Combahee-Edisto system, and Roanoke River below Roanoke Rapids Lake) were used to standardize allele calls to those of Anderson et al. [28].
The PCR reactions were grouped into three multiplex suites—suite 1 (MSM 1144, 1095, 1096, and 1243), suite 2 (MSM 1094, 1526, 1208, and 1067), and suite 3 (MSM 1168, 1139, 1592, and 1357)—with primer ratios following those of Fountain et al. [57]. Reactions were performed in a T-100 thermal cycler (Bio-Rad Laboratories, Hercules, CA, USA) as a multiplex standard PCR reaction as in Couch et al. [36]. Reaction master mixes included 0.2 mM dNTPs, 5X Promega reaction buffer, 0.03 U/µL Taq polymerase (Promega Corporation, Madison, WI), and 1.0 mM MgCl 2 for suites 1 and 3 and 1.5 mM MgCl 2   for suite 2. Template DNA concentrations ranged from 50 ng/µL–300 ng/µL. Cycling parameters were an initial denaturation at 95 °C for 15 min; 35 cycles of 94 °C for 30 s, 60 °C for 30 s, and 72 °C for 30 s; and a final extension for 10 min at 72 °C [Couch et al., 2006 = 49]. The amplified DNA fragments were subjected to electrophoresis through a 2% ethidium bromide TBE agarose gel to ascertain amplification. Amplification fragment sizes were estimated using an ABI 3730xl DNA sequencing instrument at the Cornell University Institute of Biotechnology (Ithaca, NY, USA).
Microsatellite fragment sizes were scored using GeneMarker (SoftGenetics, College Park, PA, USA) and reevaluated by an independent worker. Entire multiplex sets including samples that did not amplify or genotypes that were unclear were reanalyzed up to three separate times to produce as large and reliable a dataset as possible. Genotypes then were scored blind with regard to results of earlier runs. All inconsistent results were removed from the dataset. Genotyping error rates were thereby near zero.

4.3. Data Analysis

MicroChecker [79] was applied to assess the possibilities of artifacts of PCR amplification, including segregation of null alleles and estimation of their frequencies. Arlequin v 3.5.2.2 [80] was used to assess Hardy-Weinberg and linkage disequilibria.
Two contrasting methods were used to recognize clustering of individual multilocus genotypes and to assign individuals to their most likely source cluster. To visualizing genetic clustering using a method not depending upon Hardy-Weinberg equilibrium (HWE), we applied discriminant analysis of principal components [35] using adaegenet 2.1.3 [81]. STRUCTURE v 2.3.4 [38], an algorithm maximizing conformance to HWE within clusters and contrast among clusters, also was applied. STRUCTURE analyses were run both with and without data for loci with null alleles with frequencies over the threshold of 0.1 to assess the impact of inclusion or exclusion of those data. Preliminary data analyses were run iteratively, first with data including all loci with null alleles, next removing all data from loci with null alleles, and last with removal of data only for loci with null alleles above a threshold frequency of 0.1. These analyses included all 837 individuals from all 16 collections and 459 individuals from the six Roanoke River system sites. Since there were no major differences among results among approaches removing data from all loci with null alleles or from those with frequencies above a threshold of 0.1, we retained data for loci with null alleles below the frequency threshold of 0.1, allowing analysis with data for the largest number of loci. STRUCTURE runs had a burn-in period of 100,000 and an MCMC replication number of 100,000 iterations. The ancestry model assumed admixture with correlated allele frequencies in order to compute the probability of the data given a particular value of K. Results were uploaded into Structure Harvester [82] to visualize the best-supported number of clusters across the collection of samples at issue using the Evanno et al. [41] criterion. STRUCTURE plots from these analyses were visualized using CLUMPAK [83].
Arlequin was used to perform analysis of molecular variance (AMOVA) and quantify population differentiation as F ST . AMOVA was applied to partition population differentiation into its underlying components, i.e., within-individuals, among individuals within populations or groups of populations, and among populations or groups or populations.
The effective population size, Ne, of Roanoke basin collections was estimated using two contrasting approaches, the linkage disequilibrium approach implemented in NeEstimator v 2 [43] and the sibship assignment method [44] using Colony 2.0.6.5 [47].
Relatedness and the possibility of inbreeding within Roanoke basin populations were assessed using multiple approaches. A sibship assignment method [44] implemented in Colony 2.0.6.5 [47] was applied using default settings, except for allowing male and female polygamy and the presence of inbreeding. Relatedness among individuals estimated using a maximum likelihood algorithm was performed using MLRelate [48]. Inbreeding was assessed, first by calculating the degree of deviation from Hardy-Weinberg equilibrium (HWE) within particular populations measured as Wright’s F IS , which was performed using Arlequin [80]. Second, a Bayesian approach simultaneously testing for segregation of null alleles and inbreeding within a dataset [46] was performed using INEST version 2.2 [84]. The program was run using the “nfb” model accounting for null alleles, inbreeding, and genotyping failures. Each analysis was executed with 200,000 MCMC iterations, with a burn-in of 20,000 iterations and a thinning factor of 2000.
To assess the significance of statistical test results, the nominal ¦Á value of 0.05 was subjected to Bonferroni adjustment following Holm [42] to calculate critical significance values.

4.4. Permits and Ethical Aspects

Because all collections and handling of live vertebrates was carried out only by state fisheries management agency personnel, no scientific collection permits or animal care and use protocols were at issue.

Supplementary Materials

The following are available online at https://www.mdpi.com/2410-3888/5/3/24/s1: Table S1. History of stocking striped bass into Kerr Reservoir. Regular annual stocking began in 2003–2004; Year = year of stocking, YC = year-class (unpublished data, Dan Michaelson, Virginia Department of Game and Inland Fisheries). Table S2. Full locus-by-locus genetic diversity indices for each population of striped bass across the range. Figure S1. Bayesian information criterion (BIC) for given numbers of discriminant analysis of principal components clusters of striped bass for all collections. Figure S2. STRUCTURE Harvester plot showing ∆K for each number of clusters, as per Evanno et al. [2005 = 38] method for all striped bass collections. Figure S3. Bayesian information criterion (BIC) for given numbers of discriminant analysis of principal components clusters of striped bass for Roanoke basin collections. Figure S4. STRUCTURE Harvester plot showing ∆K for each number of clusters, as per Evanno et al. [2005 = 38] method for Roanoke basin striped bass collections.

Author Contributions

E.M.H. conceived and designed the study, secured funding, oversaw data collection and analysis, and participated in manuscript development. S.C.H. executed data collection and analysis and participated in manuscript development. I.W. provided Hudson River samples and participated in manuscript development. W.R.C. participated in data analysis and manuscript development. All authors have read and agreed to the published version of the manuscript.

Funding

Funding for this project was provided by a grant from the Virginia Department of Game and Inland Fisheries through the Federal Aid in Sport Fish Restoration program.

Acknowledgments

Fin-clip samples from Virginia striped bass populations were provided by Scott Smith, Dan Michaelson, and Alan Weaver of the Virginia Department of Game and Inland Fisheries. Caitlin Miller provided technical support in the molecular genetics laboratory. Tanya Darden and Daniel Farae provided access to samples from the South Carolina Department of Natural Resources Genetic Tissue Collection and assisted in coordination of genotype calls. The participation of E.M.H. was supported in part by the Virginia Agricultural Experiment Station through the Hatch program of the U.S. Department of Agriculture National Institute for Food and Agriculture. The manuscript was strengthened by attention to the comments of four anonymous peer reviewers.

Conflicts of Interest

The authors declare no conflict of interest. The funding sponsors had no role in the design of the study, in the analysis or interpretation of data, in the writing of the manuscript, or in the decision to publish the results.

References

  1. Whitehead, J.C. Economics of recreational fisheries for inland striped bass and hybrid striped bass. Am. Fish. Soc. Symp. 2013, 80, 551–558. [Google Scholar]
  2. Jenkins, R.E.; Burkhead, N.M. Freshwater Fishes of Virginia; American Fisheries Society: Bethesda, MD, USA, 1994. [Google Scholar]
  3. Raney, E.C.; Tresselt, E.F.; Hollins, E.H.; Vladykov, V.D.; Wallace, D.H. The striped bass (Roccus saxatilis). Bull. Bingham Oceanogr. Collect. Yale Univ. 1952, 14. [Google Scholar]
  4. Van Horn, S.L. A brief history of inland striped bass management. Am. Fish. Soc. Symp. 2013, 80, 1–13. [Google Scholar]
  5. Clark, J. Seasonal movements of Striped Bass contingents of Long Island Sound and the New York Bight. Trans. Am. Fish. Soc. 1968, 97, 320–343. [Google Scholar] [CrossRef]
  6. Secor, D. Specifying divergent migrations in the concept of stock: The contingent hypothesis. Fish. Res. 1999, 43, 13–34. [Google Scholar] [CrossRef]
  7. Secor, D.H.; Rooker, J.R.; Zlokovitz, E.; Zdanowicz, V.S. Identification of riverine, estuarine, and coastal contingents of Hudson River striped bass based upon otolith elemental fingerprints. Mar. Ecol. Prog. Ser. 2001, 211, 245–253. [Google Scholar] [CrossRef]
  8. Gahagan, B.; Fox, D.; Secor, D. Partial migration of striped bass: Revisiting the contingent hypothesis. Mar. Ecol. Prog. Ser. 2015, 525, 185–197. [Google Scholar] [CrossRef] [Green Version]
  9. Andrews, S.N.; Linnansaari, T.; Curry, R.A.; Dadswell, M.J. The misunderstood striped bass of the Saint John River, New Brunswick: Past, present, and future. N. Am. J. Fish. Manag. 2017, 37, 235–254. [Google Scholar] [CrossRef]
  10. Waldman, J.R.; Dunning, D.J.; Ross, Q.E.; Mattson, M.T. Range dynamics of Hudson River striped bass along the Atlantic Coast. Trans. Am. Fish. Soc. 1990, 119, 910–919. [Google Scholar] [CrossRef]
  11. Callihan, J.L.; Godwin, C.H.; Buckel, J.A. Effect of demography on spatial distribution: Movement patterns of the Albemarle Sound-Roanoke River stock of Striped Bass (Morone saxatilis) in relation to their recovery. Fish. Bull. 2014, 112, 131–143. [Google Scholar] [CrossRef]
  12. Conroy, C.; Piccoli, P.; Secor, D. Carryover effects of early growth and river flow on partial migration in striped bass Morone saxatilis. Mar. Ecol. Prog. Ser. 2015, 541, 179–194. [Google Scholar] [CrossRef]
  13. Secor, D.H.; Piccoli, P.M. Oceanic migration rates of upper Chesapeake Bay striped bass (Morone saxatilis), determined by otolith microchemical analysis. Fish. Bull. 2007, 105, 62–73. [Google Scholar]
  14. Richards, R.A.; Rago, P.J. A case history of effective fishery management: Chesapeake Bay Striped Bass. N. Am. J. Fish. Manag. 1999, 19, 356–375. [Google Scholar] [CrossRef]
  15. Waldman, J.R.; Grossfield, J.; Wirgin, I.I. Review of stock discrimination techniques for striped bass. N. Am. J. Fish. Manag. 1988, 8, 410–425. [Google Scholar] [CrossRef]
  16. Coutant, C.C. Striped bass, temperature, and dissolved oxygen: A speculative hypothesis for environmental risk. Trans. Am. Fish. Soc. 1985, 114, 31–61. [Google Scholar] [CrossRef]
  17. VDGIF (Virginia Department of Game and Inland Fisheries). Fishing. 2017. Available online: https://www.dgif.virginia.gov/fishing/ (accessed on 17 June 2017).
  18. Lamprecht, S.D.; Mauck, M.D.; DiCenzo, V.J. Natural reproduction: How it has affected striped bass management of John H. Kerr and Santee-Cooper reservoirs and Lake Texoma. Am. Fish. Soc. Symp. 2013, 80, 413–430. [Google Scholar]
  19. Doyle, R.W. An approach to the quantitative analysis of domestication selection in aquaculture. Aquaculture 1983, 33, 167–185. [Google Scholar] [CrossRef]
  20. Ryman, N.; Laikre, L. Effects of supportive breeding on the genetically effective population size. Cons. Biol. 1991, 5, 325–329. [Google Scholar] [CrossRef]
  21. Wirgin, I.; Maceda, L.; Tozer, M.; Stabile, J.; Waldman, J. Atlantic coastwide population structure of striped bass Morone saxatilis using microsatellite DNA analysis. Fish. Res. 2020, 226, 105506. [Google Scholar] [CrossRef]
  22. Callihan, J.L.; Harris, J.E.; Hightower, J.E. Coastal migration and homing of Roanoke River striped bass. Mar. Coast. Fish. 2015, 7, 301–315. [Google Scholar] [CrossRef]
  23. Bjorgo, K.A.; Isely, J.J.; Thomason, C.S. Seasonal movement and habitat use by striped bass in the Combahee River, South Carolina. Trans. Am. Fish. Soc. 2000, 129, 1281–1287. [Google Scholar] [CrossRef]
  24. Wirgin, I.; Grunwald, C.; Garte, S.J.; Mesing, C. The use of DNA fingerprinting in the identification and management of striped bass populations in the southeastern United States. Trans. Am. Fish. Soc. 1991, 120, 273–282. [Google Scholar] [CrossRef]
  25. Wirgin, I.I.; Maceda, L.; Waldman, J.R.; Crittenden, R.N. Use of mitochondrial DNA polymorphisms to estimate the relative contributions of the Hudson River and Chesapeake Bay striped bass stocks to the mixed fishery on the Atlantic coast. Trans. Am. Fish. Soc. 1993, 122, 669–684. [Google Scholar] [CrossRef]
  26. Wirgin, I.; Ong, T.-L.; Maceda, L.; Waldman, J.R.; Moore, D.; Courtenay, S. Mitochondrial DNA variation in striped bass (Morone saxatilis) from Canadian rivers. Can. J. Fish. Aquat. Sci. 1993, 50, 80–87. [Google Scholar] [CrossRef]
  27. Gauthier, D.T.; Audemard, C.A.; Carlsson, J.E.L.; Darden, T.L.; Denson, M.R.; Reece, K.S.; Carlsson, J. Genetic population structure of U.S. Atlantic coastal striped bass (Morone saxatilis). J. Hered. 2013, 104, 510–520. [Google Scholar] [CrossRef] [Green Version]
  28. Anderson, A.P.; Denson, M.R.; Darden, T.L. Genetic structure of striped bass in the southeastern United States and effects from stock enhancement. N. Am. J. Fish. Manag. 2014, 34, 653–667. [Google Scholar] [CrossRef]
  29. LeBlanc, N.M.; Gahagan, B.I.; Andrews, S.N.; Avery, T.S.; Puncher, G.N.; Reading, B.J.; Buhariwalla, C.F.; Curry, R.A.; Whiteley, A.R.; Pavey, S.A. Genomic population structure of striped bass (Morone saxatilis) from the Gulf of St. Lawrence to Cape Fear River. Evol. Appl. 2020, in press. [Google Scholar] [CrossRef]
  30. Rogier, C.G.; Ney, J.J.; Turner, B.J. Electrophoretic analysis of genetic variability in a landlocked striped bass population. Trans. Am. Fish. Soc. 1985, 114, 244–249. [Google Scholar] [CrossRef]
  31. Blankenship, H.; Leber, K. A responsible approach to marine stock enhancement. Uses and effects of cultured fishes in aquatic ecosystems. Am. Fish. Soc. Symp. 1995, 15, 167–175. [Google Scholar]
  32. Miller, L.M.; Kapuscinski, A.R. Genetic guidelines for hatchery supplementation programs. In Population Genetics: Principles and Applications for Fisheries Scientists; Hallerman, E.M., Ed.; American Fisheries Society: Bethesda, MD, USA, 2003; pp. 329–355. [Google Scholar]
  33. Liu, Z.J.; Cordes, J.F. DNA marker technologies and their applications in aquaculture genetics. Aquaculture 2004, 238, 1–37. [Google Scholar] [CrossRef]
  34. Garza, J.C.; Williamson, E.G. Detection of reduction in population size using data from microsatellite loci. Mol. Ecol. 2001, 10, 305–318. [Google Scholar] [CrossRef] [PubMed]
  35. Jombart, T.; Devillard, S.; Balloux, F. Discriminant analysis of principal components: A new method for the analysis of genetically structured populations. BMC Genet. 2010, 11, 94. [Google Scholar] [CrossRef] [PubMed] [Green Version]
  36. Couch, C.R.; Garber, A.F.; Rexroad, C.E., III; Abrams, J.M.; Stannard, J.A.; Westerman, M.E.; Sullivan, C.V. Isolation and characterization of 149 novel microsatellite DNA markers for striped bass, Morone saxatilis, and cross-species amplification in white bass, Morone chrysops, and their hybrid. Mol. Ecol. Notes 2006, 6, 667–669. [Google Scholar] [CrossRef]
  37. Rexroad, C., III; Vallejo, R.; Coulibaly, I.; Couch, C.; Garber, A.; Westerman, M.; Sullivan, C. Identification and characterization of microsatellites for striped bass from repeat-enriched libraries. Cons. Genet. 2006, 7, 971–982. [Google Scholar] [CrossRef]
  38. Pritchard, J.K.; Stephens, M.; Donnelly, P. Inference of population structure using multilocus genotype data. Genetics 2000, 155, 945–959. [Google Scholar]
  39. Gilbert, K.J.; Andrew, R.L.; Bock, D.G.; Franklin, M.T.; Kane, N.C.; Moore, J.S.; Moyers, B.T.; Renaut, S.; Rennison, D.J.; Veen, T.; et al. Recommendations for utilizing and reporting population genetic analyses: The reproducibility of genetic clustering using the program structure. Mol. Ecol. 2012, 21, 4925–4930. [Google Scholar] [CrossRef]
  40. Harris, S.C. Genetic Marker-Assisted Management of Virginia Sport Fishes. Master’s Thesis, Virginia Polytechnic Institute and State University, Blacksburg, VA, USA, 2019. [Google Scholar]
  41. Evanno, G.; Regnaut, S.; Goudet, J. Detecting the number of clusters of individuals using the software structure: A simulation study. Mol. Ecol. 2005, 14, 2611–2620. [Google Scholar] [CrossRef] [Green Version]
  42. Holm, S. A simple sequential rejective multiple test procedure. Scand. J. Stat. 1979, 6, 65–70. [Google Scholar]
  43. Do, C.; Waples, R.S.; Peel, D.; Macbeth, G.M.; Tillett, B.J.; Ovenden, J.R. NeEstimator v2: Re-implementation of software for the estimation of contemporary effective population size (Ne) from genetic data. Mol. Ecol. Resour. 2014, 14, 209–214. [Google Scholar] [CrossRef]
  44. Wang, J. A new method for estimating effective population size for multilocus genotypes. Mol. Ecol. 2009, 18, 2148–2164. [Google Scholar] [CrossRef]
  45. Waples, R.S.; Do, C. Linkage disequilibrium estimates of contemporary Ne using highly variable genetic markers: A largely untapped resource for applied conservation and evolution. Evol. Appl. 2010, 3, 244–262. [Google Scholar] [CrossRef] [PubMed]
  46. Chybicki, I.J.; Burczyk, J. Simultaneous estimation of null alleles and inbreeding coefficients. J. Hered. 2009, 100, 106–113. [Google Scholar] [CrossRef] [PubMed] [Green Version]
  47. Jones, O.R.; Wang, J. Colony: A program for parentage and sibship inference from multilocus genotype data. Mol. Ecol. Resour. 2010, 10, 551–555. [Google Scholar] [CrossRef] [PubMed]
  48. Kalinowski, S.T.; Taper, M.L. ML-Relate: A computer program for maximum likelihood estimation of relatedness and relationship. Mol. Ecol. Notes 2006, 6, 576–579. Available online: http://www.montana.edu/kalinowski/Software/MLRelate.htm (accessed on 15 March 2019). [CrossRef]
  49. Pielou, E.C. After the Ice Age: The Return of Life to Glaciated North America; University of Chicago Press: Chicago, IL, USA, 1991. [Google Scholar]
  50. Hewitt, G. The genetic legacy of the Quaternary ice ages. Nature 2000, 405, 907–913. [Google Scholar] [CrossRef]
  51. Soltis, D.D.; Morris, A.B.; McLachlan, J.S.; Manos, P.S.; Soltis, P.S. Comparative phylogeography of unglaciated North America. Mol. Ecol. 2006, 15, 4261–4293. [Google Scholar] [CrossRef]
  52. Curry, R.A. Late glacial impacts on dispersal and colonization of Atlantic Canada and Maine by freshwater fishes. Quat. Res. 2007, 67, 225–233. [Google Scholar] [CrossRef]
  53. Benestan, L.M.; Ferchaud, A.; Hohenlohe, P.A.; Garner, B.A.; Naylor, G.J.P.; Baums, I.B.; Schwartz, M.K.; Kelley, J.L.; Luikart, G. Conservation genomics of natural and managed populations: Building a conceptual and practical framework. Mol. Ecol. 2016, 25, 2967–2977. [Google Scholar] [CrossRef]
  54. Jombart, T.; Collins, C. A Tutorial for Discriminant Analysis or Principal Components (DAPC) Using Adegenet 2.0.0. 2015. Available online: https://adegenet.r-forge.r-project.org/files/tutorial-dapc.pdf (accessed on 26 June 2019).
  55. Waldman, J.R.; Fabrizio, M.C. Problems of stock definition in estimating relative contributions of Atlantic striped bass to the coastal fishery. Trans. Am. Fish. Soc. 1994, 123, 766–778. [Google Scholar] [CrossRef]
  56. Waldman, J.R.; Maceda, L.; Wirgin, I. Mixed-stock analysis of wintertime aggregations of Striped Bass along the Mid-Atlantic coast. J. Appl. Ichthyol. 2012, 28, 1–6. [Google Scholar] [CrossRef]
  57. Fountain, J.; Darden, T.; Jenkins, W.; Denson, M. Three multiplexed microsatellite panels for striped bass. Southeast. Nat. 2009, 8, 671–676. [Google Scholar] [CrossRef]
  58. Neal, W.E. Landlocked striped bass survey. In Dingell-Johnson Project Report F-19-R; Virginia Commission of Game and Inland Fisheries: Richmond, VA, USA, 1976; p. 30. [Google Scholar]
  59. Whitehurst, D.K. Kerr reservoir striped bass population study. In Final Report, Virginia Dingell-Johnson Project F-34; Virginia Department of Fish and Game: Richmond, VA, USA, 1981; p. 243. [Google Scholar]
  60. Frankham, R. Effective population size/adult population size ratios in wildlife: A review. Genet. Res. 1995, 66, 95–107. [Google Scholar] [CrossRef]
  61. Allendorf, F.W.; Luikart, G. Conservation and the Genetics of Populations; Blackwell Publishing: Malden, MA, USA, 2007. [Google Scholar]
  62. Moritz, C. Defining ‘evolutionary significant units’ for conservation. Trends Ecol. Evol. 1994, 9, 373–375. [Google Scholar] [CrossRef]
  63. Busack, C.A.; Currens, K.P. Genetic risks and hazards in hatchery operations: Fundamental concepts and issues. In Uses and Effects of Cultured Fishes in Aquatic Ecosystems; Schramm, H.L., Piper, R.G., Eds.; American Fisheries Society: Bethesda, MD, USA, 1993; pp. 337–380. [Google Scholar]
  64. Franklin, I.R. Evolutionary change in small populations. In Conservation Biology: The Science of Scarcity and Diversity; Soule, M.E., Wilcox, B.A., Eds.; Sinauer Associates: Sunderland, MA, USA, 1980; pp. 135–140. [Google Scholar]
  65. Harmon, L.; Braude, S. Conservation of small populations: Effective population sizes, inbreeding, and the 50/500 rule. In An Introduction to Methods and Models in Ecology, Evolution, and Conservation Biology; Princeton University Press: Princeton, NJ, USA, 2010; pp. 125–138. [Google Scholar]
  66. Bartley, D.; Bagley, M.; Gall, G.; Bentley, B. Use of linkage disequilibrium data to estimate effective size of hatchery and natural fish populations. Cons. Biol. 1992, 6, 365–375. [Google Scholar] [CrossRef]
  67. Hara, M.; Sekino, M. Efficient detection of parentage in a cultured Japanese flounder Paralichthys olivaceus using microsatellite DNA marker. Aquaculture 2003, 217, 107–114. [Google Scholar] [CrossRef]
  68. Sekino, M.; Saitoh, K.; Yamada, T.; Kumagai, A.; Hara, M.; Yamashita, Y. Microsatellite-based pedigree tracing in a Japanese flounder Paralichthys olivaceus hatchery strain: Implications for hatchery management related to stock enhancement program. Aquaculture 2003, 221, 255–263. [Google Scholar] [CrossRef]
  69. Brown, R.C.; Woolliams, J.A.; McAndrew, B.J. Factors influencing effective population size in commercial populations of gilthead seabream Sparus aurata. Aquaculture 2005, 247, 219–225. [Google Scholar] [CrossRef]
  70. Frost, L.A.; Evans, B.S.; Jerry, D.R. Loss of genetic diversity due to hatchery culture practices in barramundi (Lates calcarifer). Aquaculture 2006, 261, 1056–1064. [Google Scholar] [CrossRef]
  71. Loughnan, S.R.; Domingos, J.A.; Smith-Keune, C.; Forrester, J.P.; Jerry, D.R.; Beheregaray, L.B.; Robinson, N.A. Broodstock contribution after mass spawning and size grading in barramundi (Lates calcarifer, Bloch). Aquaculture 2013, 404, 139–149. [Google Scholar] [CrossRef]
  72. Herlin, M.; Delghandi, M.; Wesmajervi, M.; Taggart, J.B.; McAndrew, B.J.; Penman, D.J. Analysis of the parental contribution to a group of fry from a single day of spawning from a commercial Atlantic cod (Gadus morhua) breeding tank. Aquaculture 2008, 274, 218–224. [Google Scholar] [CrossRef]
  73. Darden, T.L.; Sessions, F.; Denson, M.R. Use of genetic microsatellite markers to identify factors affecting stocking success in striped bass. Am. Fish. Symp. 2013, 80, 395–411. [Google Scholar]
  74. Frankham, R.; Ballou, J.D.; Eldridge, M.D.; Lacy, R.C.; Ralls, K.; Dudash, M.R.; Fenster, C.B. Predicting the probability of outbreeding depression. Cons. Biol. 2011, 25, 465–475. [Google Scholar] [CrossRef]
  75. Ricks, B.R.; Buckley, C.A. Neuse River striped bass monitoring, 2016–2017. In Federal Aid in Sport Fish Restoration Project F-108 Report; North Carolina Wildlife Resources Commission: Raleigh, NC, USA, 2018. [Google Scholar]
  76. Cushman, B.; O’Donnell, T.; Farrae, D. 2017 Striped Bass Genotyping and Parentage Analysis; Final Report to the North Carolina Wildlife Resources Commission; North Carolina Wildlife Resources Commission: Raleigh, NC, USA, 2018. [Google Scholar]
  77. Steele, C.A.; Hess, M.; Narum, S.; Campbell, M. Parentage-based tagging: Reviewing the implementation of a new tool for an old problem. Fisheries 2019, 44, 412–422. [Google Scholar] [CrossRef]
  78. Letcher, B.H.; King, T.L. Targeted stock identification using multilocus genotype ‘familyprinting’. Fish. Res. 1999, 43, 99–111. [Google Scholar] [CrossRef]
  79. Van Oosterhout, C.; Hutchinson, W.F.; Wills, D.P.M.; Shipley, P. Microchecker: Software for identifying and correcting genotyping errors in microsatellite data. Mol. Ecol. Notes 2004, 4, 535–538. [Google Scholar] [CrossRef]
  80. Excoffier, L.; Laval, G.; Schneider, S. Arlequin (version 3.0): An integrated software package for population genetics data analysis. Evol. Bioinformat. Online 2005, 1, 47–50. [Google Scholar] [CrossRef] [Green Version]
  81. Jombart, T.; Kamvar, Z.N.; Collins, C.; Lustrik, R.; Beugin, M.-P.; Knaus, B.J.; Solymos, P.; Mikryukov, V.; Schliep, K.; Maié, T.; et al. Package ‘Adegenet’. 2020. Available online: https://github.com/thibautjombart/adegenet (accessed on 26 June 2019).
  82. Dent, E.A.; von Holdt, B.M. Structure harvester: A website and program for visualizing structure output and implementing the Evanno method. Cons. Genet. Resour. 2012, 4, 359–361. [Google Scholar]
  83. Kopelman, N.M.; Mayzel, J.; Jakobsson, M.; Rosenberg, N.A.; Mayrose, I. Clumpak: A program for identifying clustering modes and packaging population structure inferences across K. Mol. Ecol. Resour. 2015, 5, 1179–1191. [Google Scholar] [CrossRef] [Green Version]
  84. Chybicki, I.J.; Oleksa, A.; Burczyk, J. Increased inbreeding and strong kinship structure in Taxus baccata estimated for both AFLP and SSR data. Heredity 2011, 107, 589–600. [Google Scholar] [CrossRef] [Green Version]
Figure 1. Roanoke River drainage, showing striped bass sampling sites in the states of Virginia and North Carolina. Base map by Pfly—Own work, CC BY-SA 2.5, https://commons.wikimedia.org/w/index.php?curid=1527390.
Fishes 05 00024 g001
Figure 2. Atlantic coast of the United States, showing locations of rivers where striped bass were sampled. Base map: Pinterest.
Fishes 05 00024 g002
Figure 3. DAPC plot for 837 striped bass from 16 collections along the Atlantic coast, respectively grouped into K = 8 and K = 11 clusters. Populations in the Southeast include: lakes Marion and Moultrie on the Cooper River, South Carolina, the Neuse, Tar, and Cape Fear rivers in North Carolina; the Roanoke River basin includes the lower Roanoke River, Smith Mountain Lake, Leesville Lake, Staunton River, Kerr Reservoir, Lake Gaston, Roanoke Rapids Lake; Chesapeake Bay includes: James, Chickahominy, and Rappahannock rivers; and Hudson River.
Fishes 05 00024 g003
Figure 4. STRUCTURE plots representative of population genetic structuring of striped bass ranging from South Carolina to the Hudson River.
Fishes 05 00024 g004
Figure 5. DAPC plot for 489 striped bass from seven collections in the Roanoke basin, respectively grouped into K = 6 and K = 8 clusters.
Fishes 05 00024 g005
Figure 6. STRUCTURE plots representative of structuring of striped bass collections within the upper Roanoke River basin.
Fishes 05 00024 g006
Table 1. Striped bass collections characterized for microsatellite DNA variation. Total samples, n = 837.
Major DrainageRiverLocationNumber (Year)Provided by
Roanoke 1Upper Roanoke R.Smith Mountain Lake
Leesville Lake
Staunton River
Kerr Res.-Island Creek Park
Kerr Res.-Ivy Hill Park
Lake Gaston
Roanoke Rapids Lake
22 (2015)
60 (2016)
47 (2015)
45 (2017)
57 (2015)
52 (2017)
39 (2016)
26 (2016)
Virginia Department of Game and Inland Fisheries
Chesapeake Bay 2James River
Rappahannock R.
Chickahominy R.
Upper tidal-Richmond
Tidal James River at I-95
Fredericksburg
Fredericksburg
Chickahominy River
7 (2017)
110 (2018)
17 (2018)
37 (2017)
25 (2018)
11 (2018)
Virginia Department of Game and Inland Fisheries
Hudson River 3Hudson RiverVarious72 (various)Isaac Wirgin
Southeast 4Neuse River
Tar River
Cape Fear R.
Lower Roanoke R.
Santee-Cooper R. Santee-Cooper R.
Neuse River
Tar River
Cape Fear River
North Carolina
Lake Marion 5
Lake Moultrie 5
10
10
10
30
20
20
South Carolina Department of Natural Resources
1 Listed from upstream to downstream. All upper Roanoke River populations are landlocked. 2 All Chesapeake Bay populations are anadromous. 3 The Hudson River population is anadromous. 4 Listed from north to south. The lower Roanoke River population is anadromous; all others are landlocked. 5 Lake Marion is upstream of Lake Moultrie. Both populations are landlocked.
Table 2. Summary information for 12 microsatellite loci used to assess the population genetic structure of striped bass in this study.
LocusRepeatSize Range (bp)Number of AllelesSource
MSM 1144(CA)25169–23525[36]
MSM 1095(TG)28156–19820[36]
MSM 1096(CA)25156–20420[36]
MSM 1243(CA)18227–27313[36]
MSM 1094(CA)25110–15425[36]
MSM 1526(GT)26124–23831[37]
MSM 1208(TA)31153–22125[36]
MSM 1067(CA)14(GT)11177–21316[36]
MSM 1168(CA)27131–15915[36]
MSM 1139(AC)34137–21927[36]
MSM 1592(TAGA)33144–24235[37]
MSM 1357(GATA)21203–28335[37]
Table 3. Microsatellite DNA diversity in striped bass collections. N = number sampled, A = mean number of alleles per locus, Ar = allelic richness, Ho = mean observed heterozygosity, He = mean expected heterozygosity, allelic range = mean difference between sizes of largest and smallest alleles at a particular locus, M = ratio of number of alleles observed at a locus to number of alleles possible between the largest and smallest alleles [34].
PopulationNAArHoHeAllelic RangeM
Southeast
Lake Marion408.31.780.750.7996.30.23
Lake Moultrie408.51.750.610.76146.40.14
Neuse River207.11.790.820.879.40.2
Tar River206.61.780.790.874.60.22
Cape Fear River205.91.760.650.6974.60.2
Roanoke River, NC6091.770.760.7895.10.24
Upper Roanoke R.
Smith Mountain L.22212.21.750.670.77203.60.06
Leesville Lake446.21.710.670.71270.28
Staunton River1209.51.740.620.75102.10.2
Kerr Reservoir40212.31.760.670.78190.30.11
Lake Gaston7810.11.750.670.761240.19
Roanoke Rapids5281.740.660.7444.10.29
Chesapeake Bay
James River13817.41.840.750.85159.10.18
Chickahominy R.227.91.80.740.855.10.23
Rappahannock R.25213.51.80.820.891.40.26
Hudson River14412.41.810.70.82207.20.06
Table 4. AMOVA results for collections across the range of striped bass. (A) For four groups: Southeast, Roanoke basin, Chesapeake Bay, and Hudson River; (B) for five groups: Santee-Cooper system, Cape Fear/Neuse/Tar rivers, Roanoke basin, Chesapeake Bay, and Hudson River.
Source of Variationd.f.Sum of SquaresVariance Components 1Percentage of Variation
(A) 1
Among groups3149.770.08 Va2.1
Among populations within groups12169.960.11 Vb2.8
Among individuals within popns.8213536.830.39 Vc9.5
Within individuals83729513.53 Vd85.7
Total16736807.564.09100
(B) 2
Among groups4111.590.07 Va2.3
Among populations within groups11106.140.07 Vb2.3
Among individuals within popns.8192573.20.20 Vc6.6
Within individuals83522862.74 Vd88.9
Total16698076.93.08100.6.60
1 Results of significance tests (1023 permutations): Va and FCT: p < 0.00001, Vb and FSC: p < 0.00001, Vc and FIS: p < 0.00001, and Vd and FIT: p < 0.00001. 2 Results of significance tests (1023 permutations): Va and FCT: p = 0.00098, Vb and FSC: p < 0.00001, Vc and FIS: p < 0.00001, and Vd and FIT: p < 0.00001.
Table 5. F-statistics partitioning departure from Hardy-Weinberg equilibrium for stated groups of populations.
PopulationFISFSCFCTFIT
Full range0.10.030.020.14
Virginia populations0.110.030.020.16
Roanoke River drainage0.130.020.030.18
Chesapeake Bay and Hudson River0.080.030.010.11
Table 6. Matrix of F ST metrics of differentiation among all striped bass collections: (1) Lake Marion, (2) Lake Moultrie, (3) Neuse River, (4) Tar River, (5) Cape Fear River, (6) Roanoke River, NC, (7) Smith Mountain Lake, (8) Leesville Lake, (9) Staunton River, (10) Kerr Reservoir, (11) Lake Gaston, (12) Roanoke Rapids, (13) James River, (14) Chickahominy River, (15) Rappahannock River, and (16) Hudson River. F ST values shown in bold are significantly different from zero after Bonferroni correction [42].
12345678910111213141516
10.000
20.0390.000
30.0620.0920.000
40.0490.083−0.0080.000
50.0700.0980.0550.0410.000
60.0570.0810.0050.0000.0350.000
70.0950.1170.0210.0330.0860.0450.000
80.0930.1210.0440.0310.0920.0560.0430.000
90.1000.1280.0290.0450.1030.0550.0130.0500.000
100.0750.1000.0170.0220.0730.0390.0110.0290.0100.000
110.0670.1130.0250.0180.0790.0380.0350.0220.0330.0190.000
120.0890.1160.0310.0260.0820.0460.0380.0260.0350.0200.0090.000
130.0650.0850.0390.0370.0810.0500.0560.0750.0660.0490.0510.0550.000
140.1120.1210.0960.0850.1360.0940.0950.1220.1120.0960.1030.1080.0290.000
150.0640.0990.0260.0120.0580.0250.0390.0530.0470.0300.0300.0270.0400.0840.000
160.0530.0750.0260.0180.0390.0220.0550.0690.0610.0470.0480.0510.0450.0810.0270.000
Table 7. AMOVA results for striped bass collections in the Roanoke River basin.
Source of Variationd.f.Sum of SquaresVariance Components 1Percentage of Variation
Among groups121.480.12 Va3.4
Among populations within groups559.120.06 Vb1.7
Among individuals within popns.4821812.360.44 Vc12.6
Within individuals48914072.88 Vd82.3
Total9773299.953.5
1 Results of significance tests (1023 permutations): Va and FCT: p = 0.142, Vb and FSC: p < 0.00001, Vc and FIS: p < 0.00001, and Vd and FIT: p < 0.00001.
Table 8. Estimated effective breeding number for upper Roanoke River populations of striped bass, with 95% confidence intervals (C.I.).
CollectionNNe195% CI 1Ne295% CI 2
Smith Mountain L.11124.020.9–27.65639–82
Leesville Lake2231.918.8–73.62313–45
Staunton River6034.727.7–44.64320–70
Kerr Reservoir20175.264.2–88.712598–162
Lake Gaston3931.924.4–43.53623–60
Roanoke Rapids Lake2640.425.5–80.54023–74
Lower Roanoke River30282.279.1–undefined 35131–89
1 Linkage disequilibrium method [43]. 2 Maximum likelihood method, assuming non-random mating [44]. 3 Undefined bounds for Ne estimates for populations may result from small sample size [45].
Table 9. Analysis of relatedness for Roanoke basin collections using sibship assignment [47] and maximum likelihood [48] methods. The criterion of likelihood for assignment was set at L > 0.50.
Sibship AssignmentMaximum Likelihood
CollectionNNumber of
Families
Numbers of
Members
Percent
Full-Sibs
Percent
Half-Sibs
Percent
Full-Sibs
Percent
Half-Sibs
Percent
Parent-Offspring
Smith Mountain L.111901–40.262.093.8813.121.27
Leesville Lake22171–21.082.962.1612.120.13
Staunton River60571–20.086.281.9212.590.96
Kerr Reservoir2011771–40.071.002.3412.910.90
Lake Gaston39311–51.012.562.439.590.14
Roanoke Rapids L.26241–20.303.502.158.310.00
Lower Roanoke R.303010.003.790.238.510.23
Table 10. Levels of inbreeding for Roanoke basin striped bass collections estimated using two methods.
CollectionFISp-Value 1Mean F 2Avg. Fi 2
Smith Mountain L.0.1200.00250.0018
Leesville Lake0.060.130.0090.0084
Staunton River0.1800.01910.0284
Kerr Reservoir0.1400.03360.0223
Lake Gaston0.1200.01980.0173
Roanoke Rapids0.1100.13170.1092
Lower Roanoke River0.030.180.00430
1 Probability of a random FIS > observed FIS. Values in bold are significantly different from zero. 2 Estimated using a Bayesian assessment algorithm accounting for frequencies of null alleles [46].

