Article

Does Addition of Perch Larvae as Prey Affect the Growth, Development and Cannibalism Rate of Pikeperch Larvae?

1
University of Lorraine, INRA, UR AFPA, Boulevard des Aiguillettes, F-54500 Vandoeuvre les Nancy, France
2
University of Rennes 1, EA 7462 G-TUBE, F-35042 Rennes, France
3
CNRS (National Centre for Scientific Research)—DR6, F-54500 Vandoeuvre les Nancy, France
*
Author to whom correspondence should be addressed.
Fishes 2019, 4(1), 21; https://doi.org/10.3390/fishes4010021
Submission received: 11 February 2019 / Revised: 11 March 2019 / Accepted: 12 March 2019 / Published: 18 March 2019
(This article belongs to the Special Issue Diversification of Aquaculture with New Fish Species)

Abstract

:
Cannibalism occurs in many cultured fish species, especially at the larval and juvenile stages of piscivorous taxa. In farmed percid species, such as pikeperch (Sander lucioperca), intra-cohort cannibalism is a major issue inducing significant losses of the initial stocking density during the first weeks of rearing. Therefore, the present study was designed to investigate the effects of perch larvae (Perca fluviatilis) as live prey on growth, survival and cannibalism in pikeperch larvae under experimental conditions. Additionally, zootechnical and behavioural variables linked to aggressiveness (S postures, attacks, bites and ingestion), and group structures were considered. The survival rate was not different between the two groups (72% with prey vs. 69% without prey), but the cannibalism rate was higher in the group with the prey (28% vs. 10%). The means of final weight and length of pikeperch larvae were higher in the group fed with perch larvae, but size heterogeneity measured by the coefficients of variation for these two parameters did not differ. The specific growth rate was higher in the group fed with perch larvae, but there was no difference between the two groups concerning Fulton’s condition factor. Among all the behavioural variables (aggressiveness, group structure), none differed between the two groups.

1. Introduction

Cannibalism is defined as the act of killing and consuming the whole or the major part of an individual belonging to the same species, irrespective of its stage of development [1,2,3,4]. This behaviour considered as the dark side of evolution has been described in a large number of animals under natural conditions and can be considered as a product of evolution [5]. For example, it is an adaptive response to environmental constraints when food resources become scarce [6]. Cannibalism has been described in many species from microorganisms to mammalians, and especially in fish [2,7,8]. It was observed in 390 teleost species coming from 104 families with 150 species studied only in captivity [9]. Thus, it is a major bottleneck for the domestication and breeding of numerous fish species such as percids [10,11]. The effects of many factors have been tested in order to reduce the cannibalism rate. Many studies have explored the impact of biotic, abiotic or feeding factors on cannibalism during the early life stages of marine and freshwater species (see [9,12] for review). From all these studies, there is no clear evidence that a factor or a combination of factors (environmental, feeding or population factors) could significantly affect the rate of cannibalism in farm species even though some of them could occasionally have an influence. As the cannibalism is mainly observed in predator species [3,13,14], the links between the ontogenesis of cannibalism and predatory behaviour must be better understood.
Cannibalism can be considered as intra-specific predation [1], where prey and predator belong to the same species, involving a behavioural sequence for the capture of a conspecific similar to the behavioural sequence observed during prey capture. Changes in foraging behaviour throughout development are known for a large group of predators. This is the case in piscivorous fish, which change diet during their lifetime. These behavioural changes are related to morphological modifications [15,16,17], physiological needs [18], and can be modified through learning processes [19]. Most piscivorous fish undergo ontogenetic shifts in their diet, among which Eurasian perch Perca fluviatilis [20], largemouth bass Micropterus salmoides [21], pumpkinseed sunfish Lepomis gibbosus [22] or pikeperch Sander lucioperca [23]. These fish firstly feed on small food items such as zooplankton and benthic invertebrates before shifting to a piscivorous diet [24]. One of the consequences of the onset of piscivorous behaviour is that the individuals shifting earlier to piscivory obtain a growth advantage over their conspecifics [25,26]. Many hypotheses have been put forward to explain an earlier shift to piscivory in fish: morphological traits such as mouth size [27,28], physiological traits (development of the enzymatic abilities) [29] or environmental conditions (i.e., density of larvae) [24]. Although behavioural traits have been less investigated (see [4] for review), it is apparent that there are major behavioural modifications when fish shift to a piscivorous diet, and frequently intracohort individuals do not change their behaviour at the same time [30]. In very few studies, yolk sac larvae of other species were added to the diet of larvae such as in the Pacific bluefin tuna (Thunnus orientalis) [31,32,33,34,35], leading to an increase in size difference and subsequently to the prevalence of cannibalistic attacks. In conclusion, there have been very few attempts to test the use of other fish species as forage prey in cannibal fish species. This original approach could divert cannibals from their conspecifics as prey.
Among freshwater species, pikeperch has gained attention as a promising new species in intensive fish farming [36,37] with a great economic potential. Until now, several bottlenecks have prevented larval rearing from being successful, among which high mortality mainly due to the cannibalism during early the life stages of fish. In this species, cannibalism rates vary from 7.4% to 53% [37,38]. Such variability is mainly due to a lack of homogeneity in the rearing protocols in terms of fish densities per tank [39,40] or feeding rates or food quality [41,42] of environmental conditions (rearing structures, light or photoperiod) [38,41]. For pikeperch, the shift to piscivory can occur when juveniles reach a size of between 35 and 100 mm [24] or even at a larger size [43,44]. As a comparison, the onset of cannibalism, which is an intra-specific predatory behaviour, occurs between 13 and 22 days post-hatching (dph) (mean total length ± Standard Error = 11.0 ± 1.3 mm: [45]). During the first two post-hatching months, the rate of cannibalism increases to reach a peak between 35 and 42 dph [45]. The behavioural sequence is similar to that of the predatory behaviour [45]. Consequently, it seems that the onset of piscivory could occur earlier. Moreover, perch has been reported to be prey for pikeperch [46], whatever the stage of development of the pikeperch. It occurs if the ratio of the total length of the prey to the total length of the predator is close to ½ when pikeperch is small; this ratio decreases with the age and size of the pikeperch [43] in a cannibal–prey relationship. Thus, adding small amount of prey should reduce cannibalism by shifting the cannibalistic behaviour of pikeperch towards their natural predatory behaviour.
The aim of this study was to test if adding fish as forage prey to a population of pikeperch larvae could reduce cannibalism. We expected that the introduction of natural prey would reduce the cannibalism rate by shifting the cannibalistic behaviour towards the natural predatory behaviour of this species. Furthermore, concerning growth, a greater size and weight were expected by introducing an additional food resource, but with greater size heterogeneity due to the success of some individuals in their predatory behaviour.

2. Results

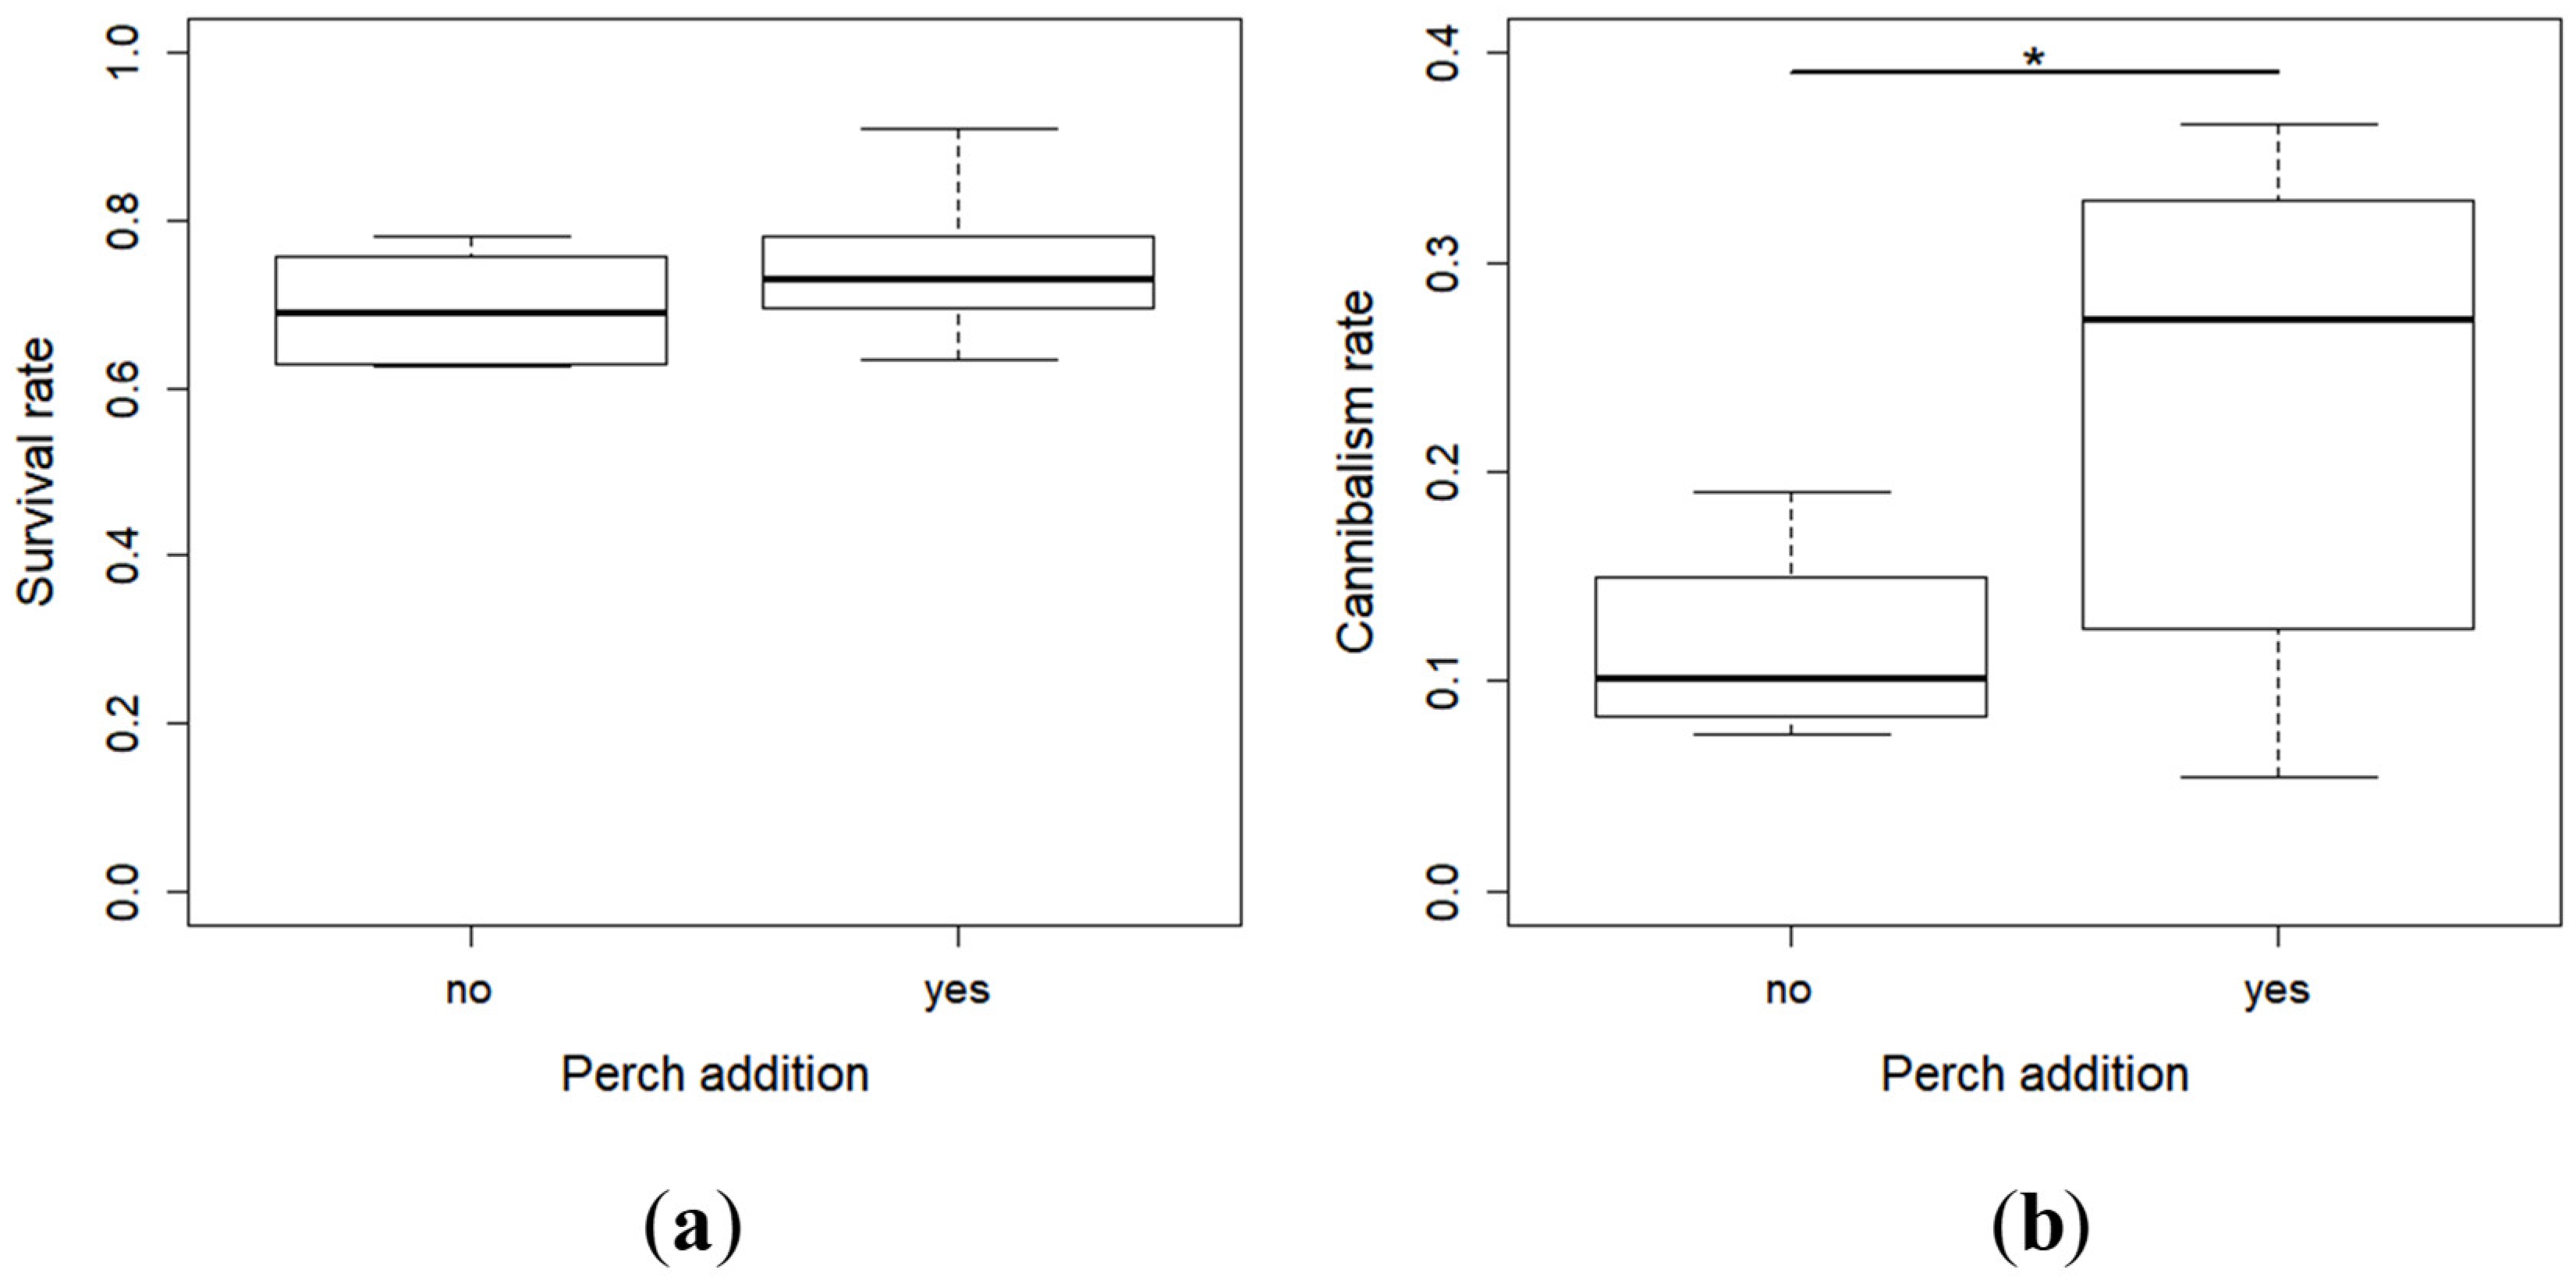
2.1. Survival and Cannibalism Rates

There was no clear difference in the survival rate of pikeperch larvae between the two conditions (with or without perch) at the end of the experiment (X2 = 3.55, df = 1, p = 0.06) (Figure 1a), but it tended to be slightly higher in the presence of perch. However, the perch larvae had a marked effect on the cannibalism rate, which was higher in the racks where perch were added (X2 = 11.38, df = 1, p < 0.0001) (Figure 1b).

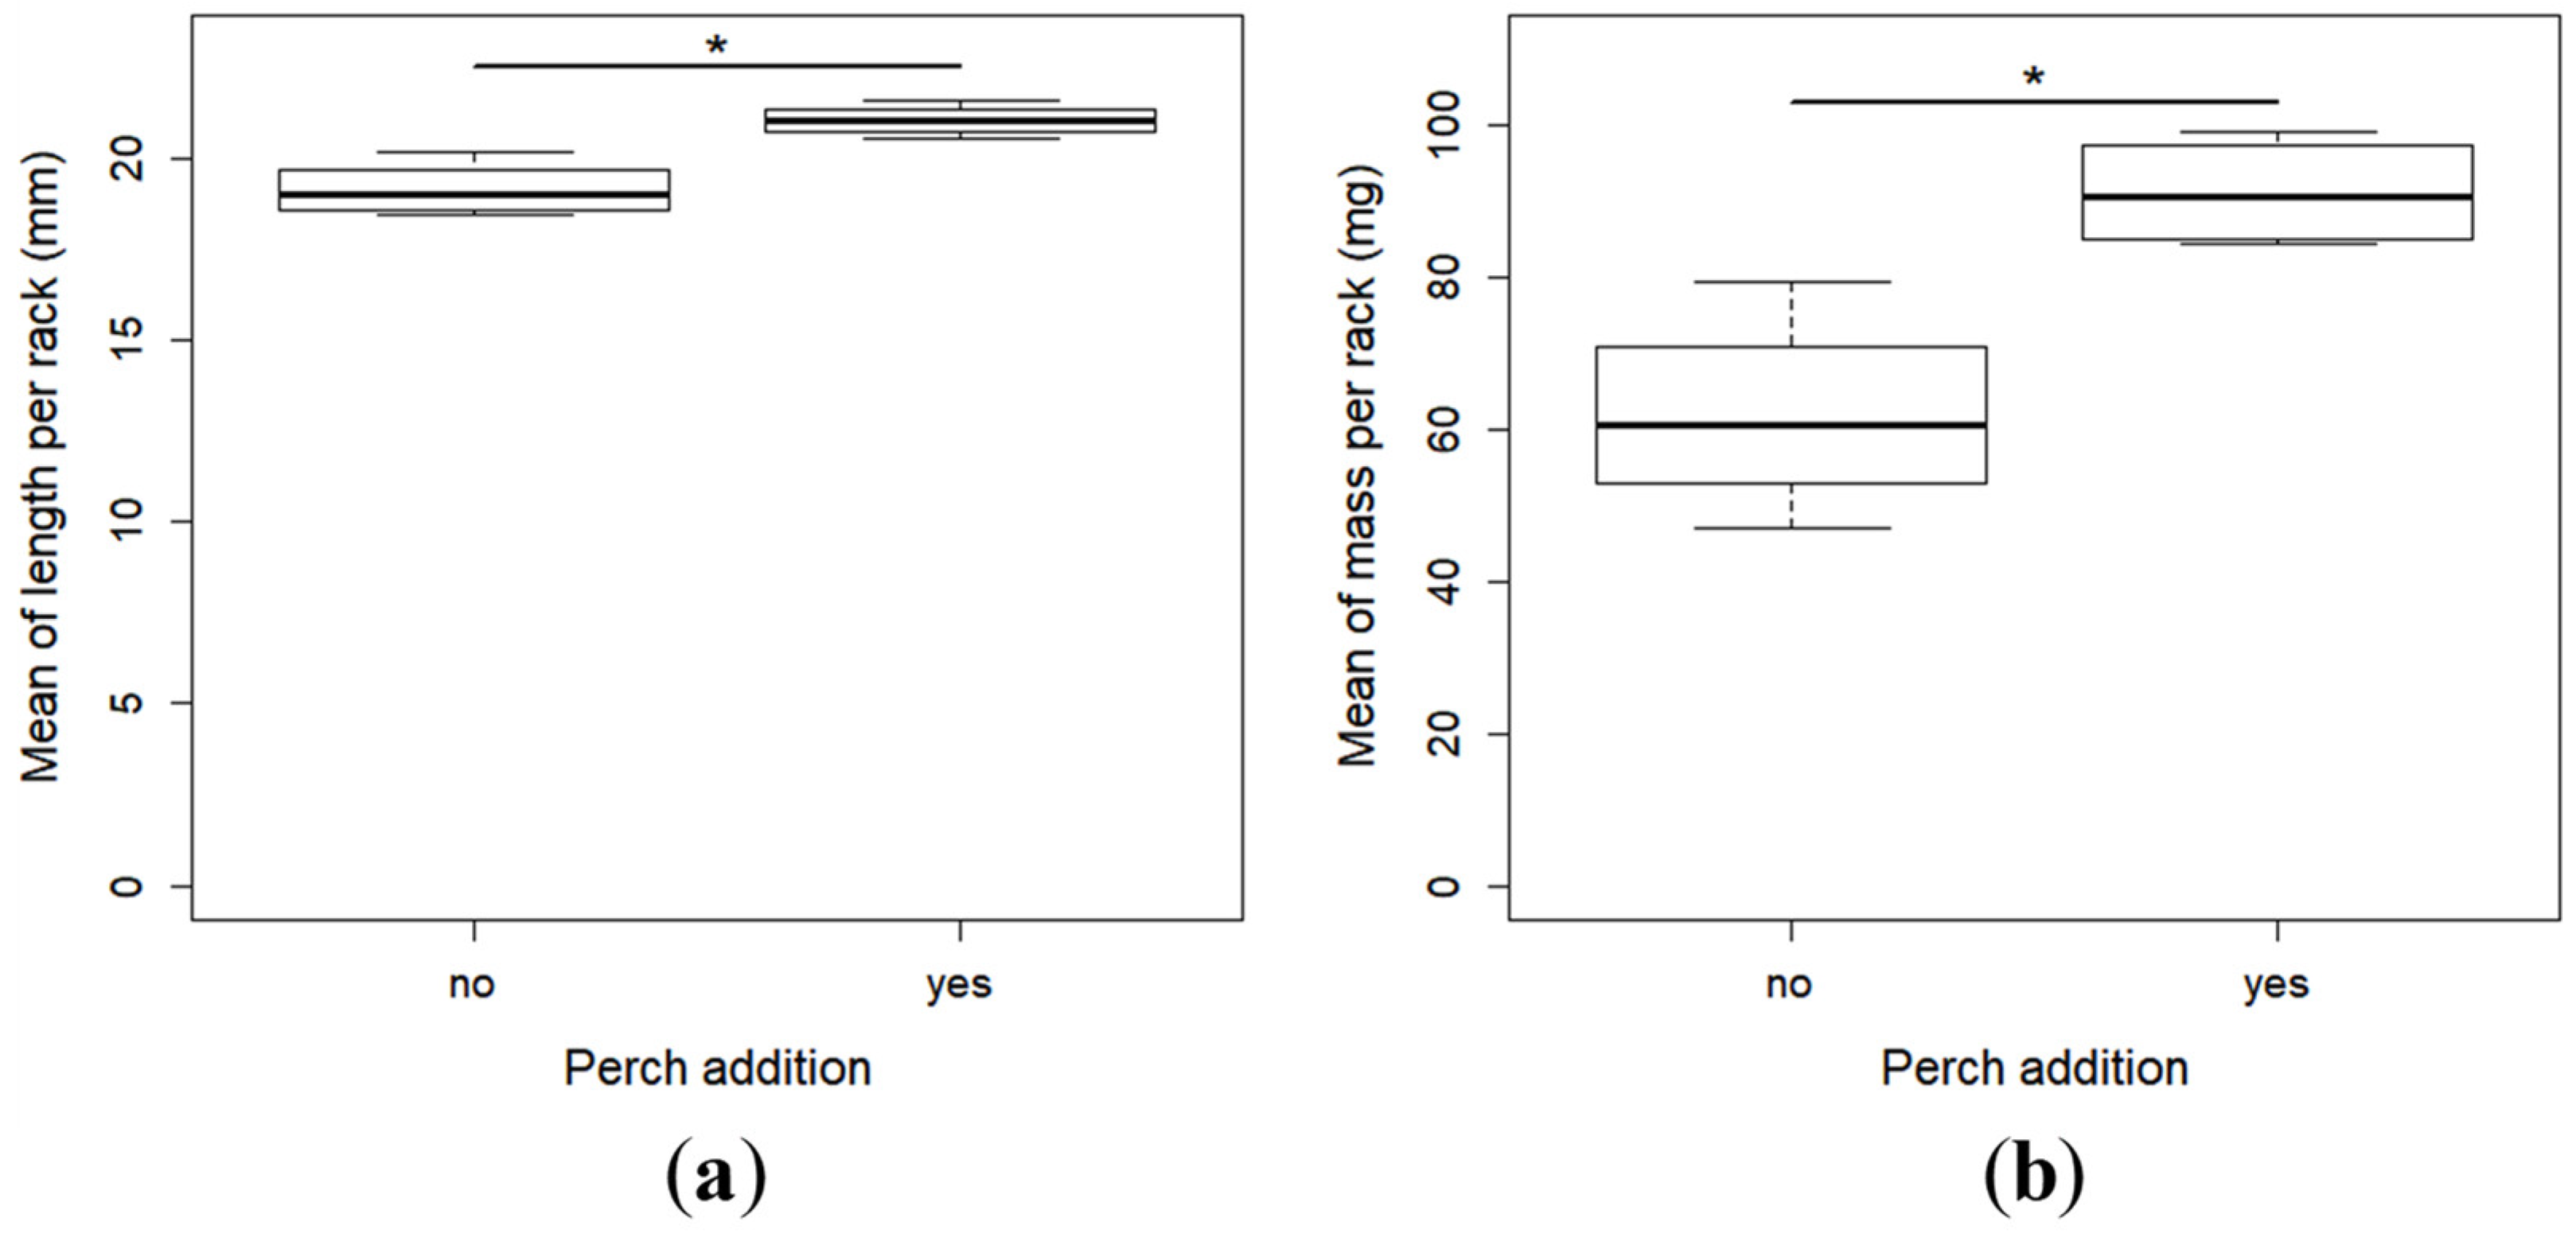
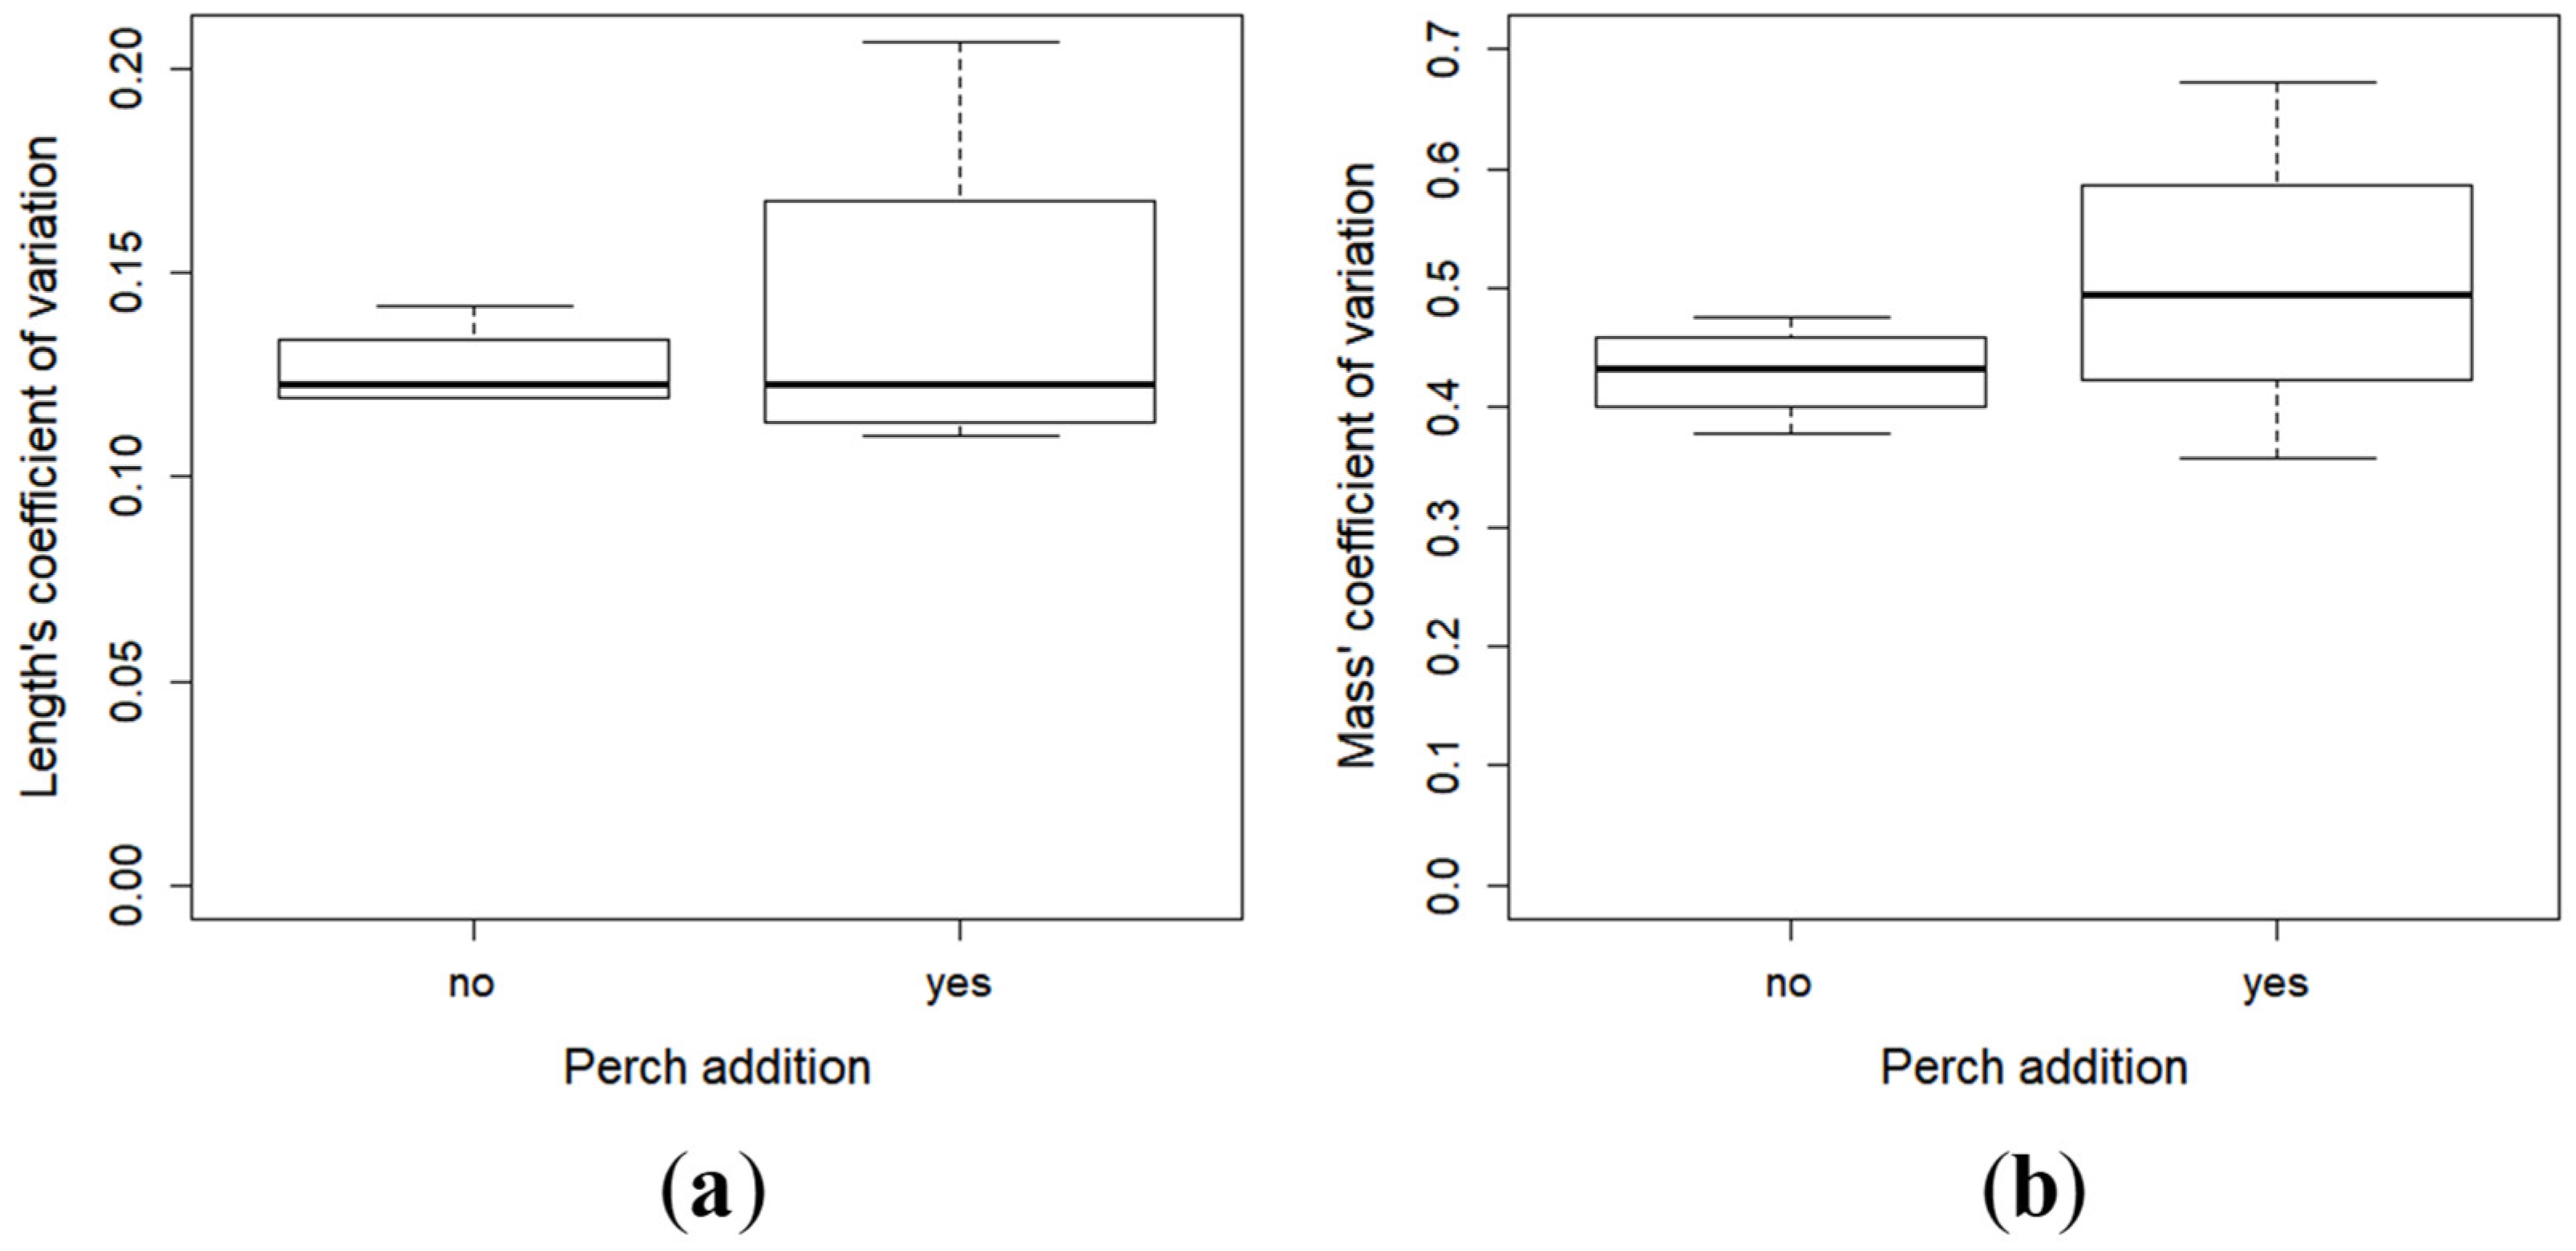
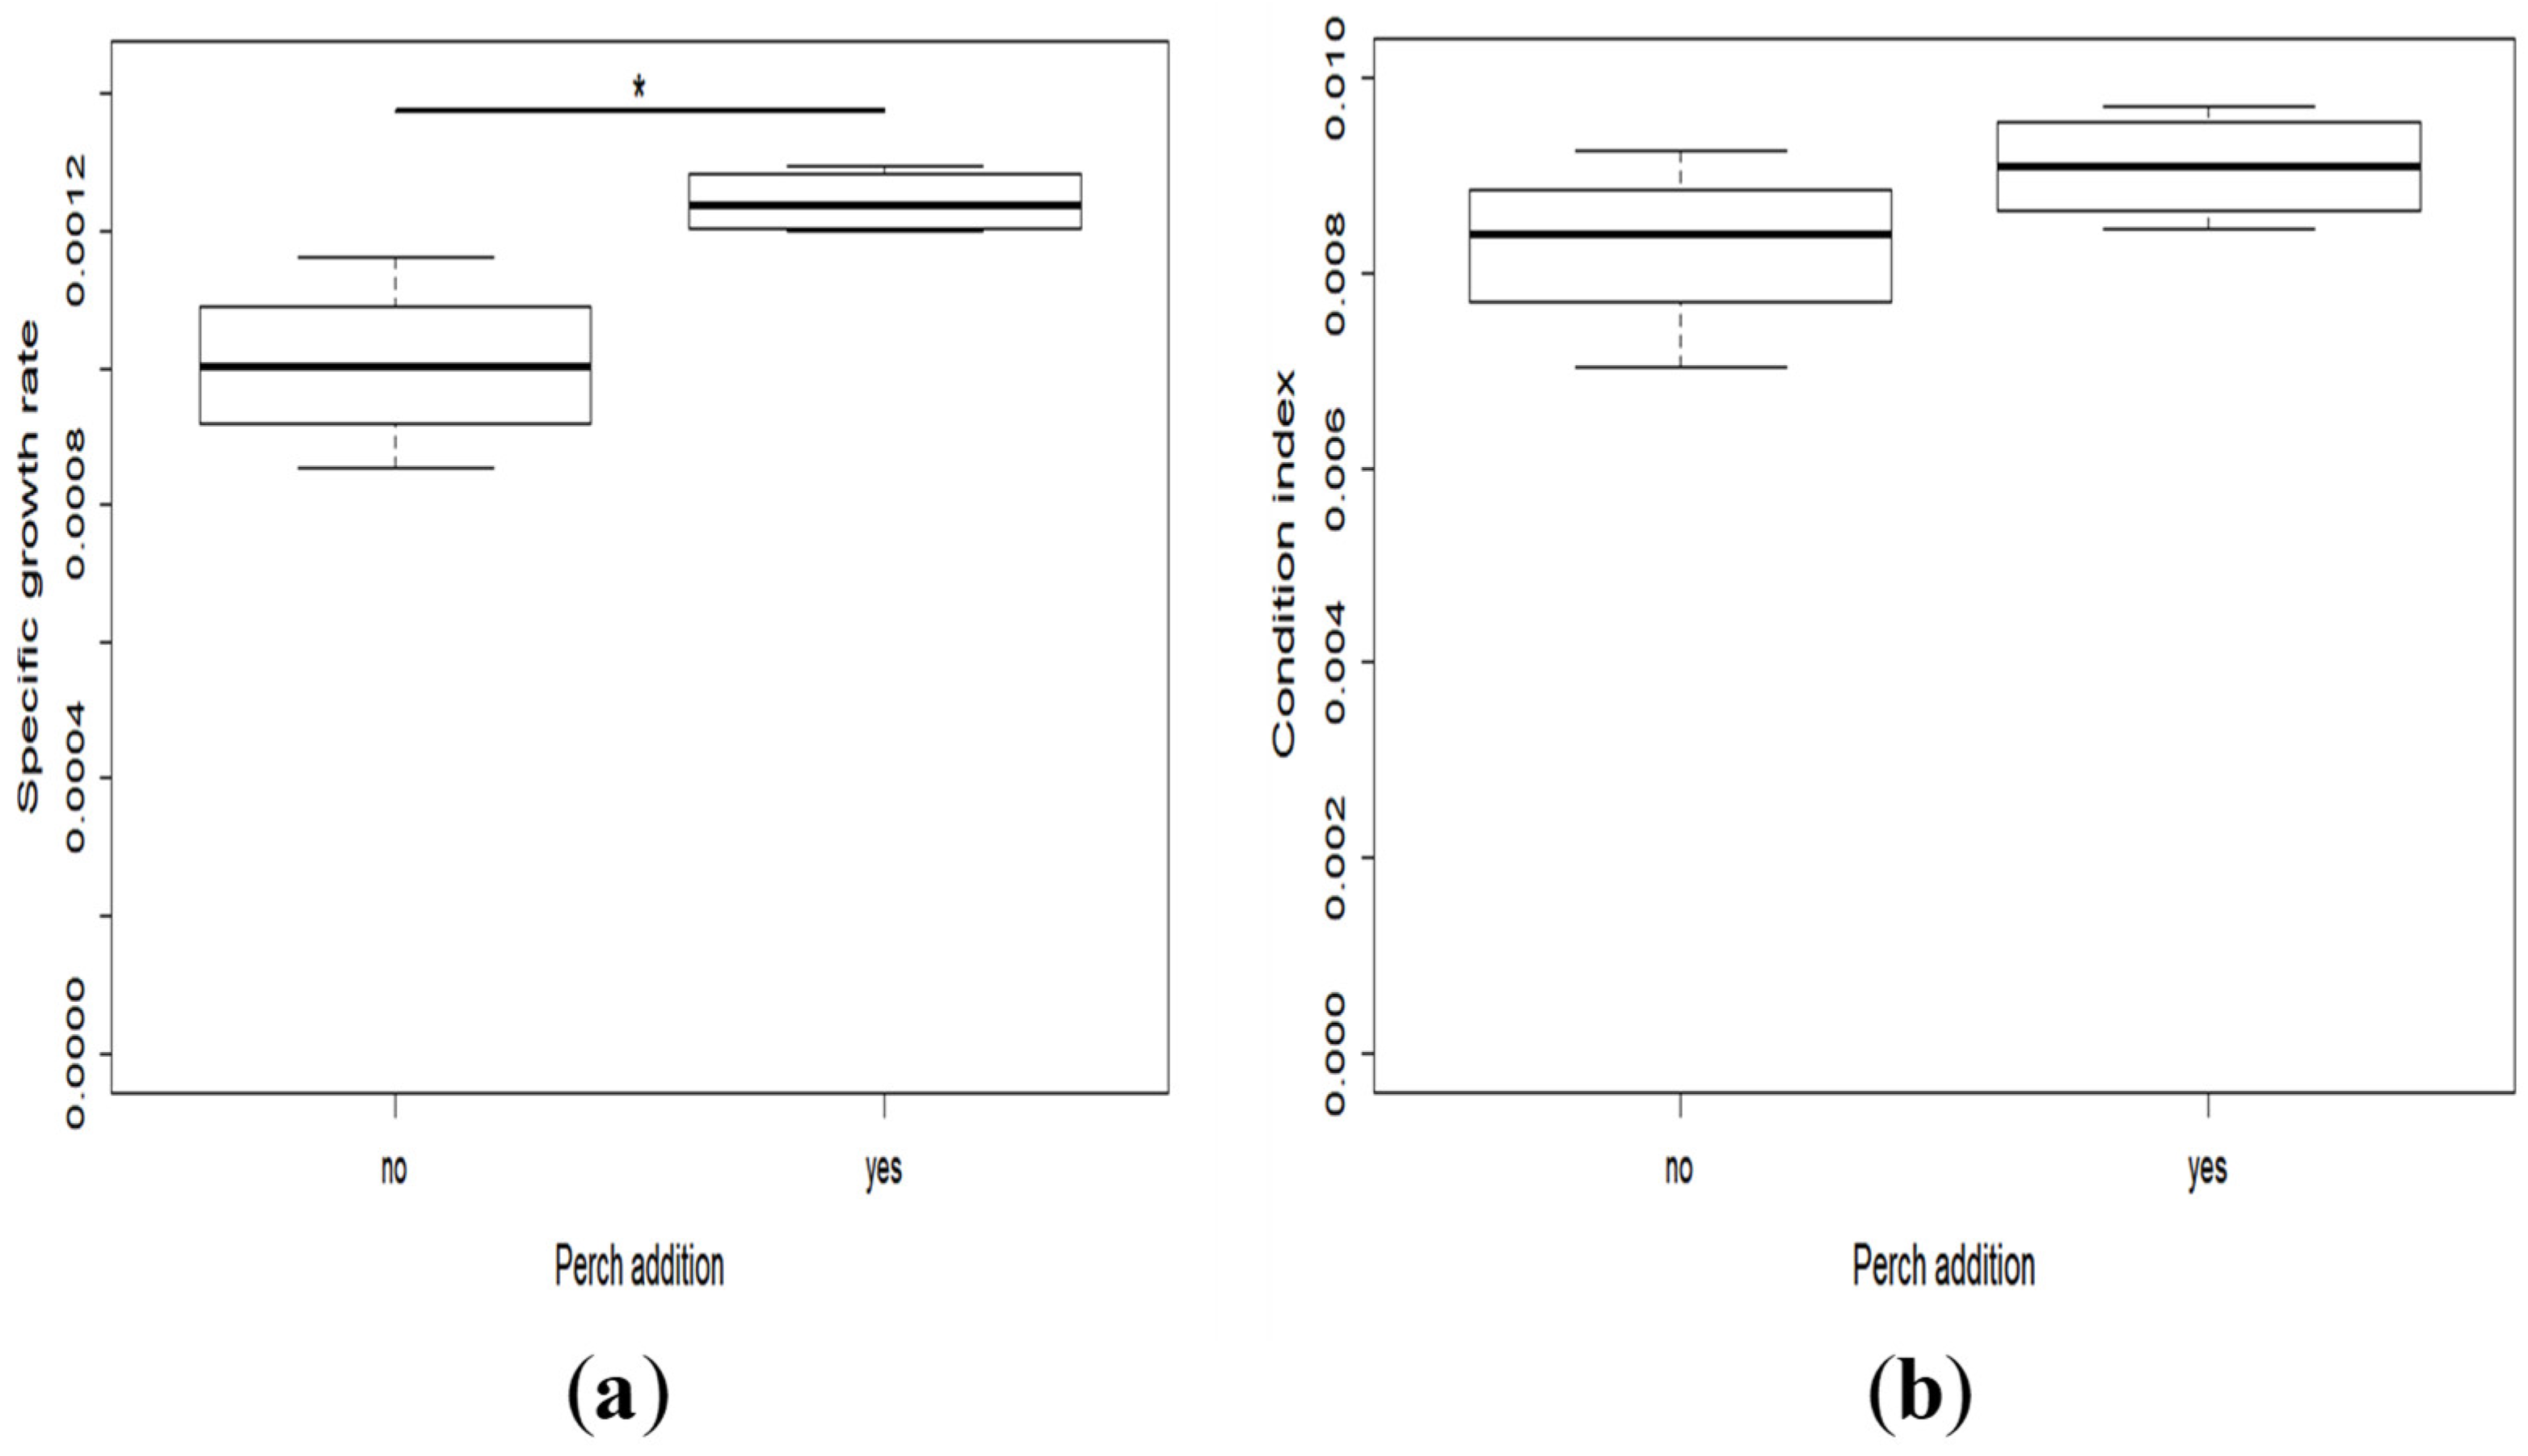
2.2. Growth and Development

All of the perch larvae were caught by the pikeperch one minute after their introduction in the racks. The pikeperch larvae in the presence of perch were larger (t-test, t = 4.28, df = 6, p = 0.005) (Min–Max; with perch: 14.4–30.4 mm, without: 13.3–24.4 mm) (Figure 2a) and heavier (t-test, t = 3.86, df = 6, p = 0.008) (Min–Max; with perch: 133.8–13.3 mg, without: 275.8–28.5 mg) (Figure 2b) than in the absence of perch. There was no difference of the coefficient of variation (CV) of the two parameters, i.e., the length (t-test, t = 0.60, df = 6, p = 0.56) (Figure 3a) and the mass (t-test, t = 1.10, df = 6, p = 0.31) (Figure 3b).
The specific growth rate was higher when perch were added to the racks (t-test, t = 3.52, df = 6, p = 0.01) (Figure 4a), but there was no difference in Fulton’s condition factor (t-test, t = 3.56, df = 6, p = 0.18) (Figure 4b).

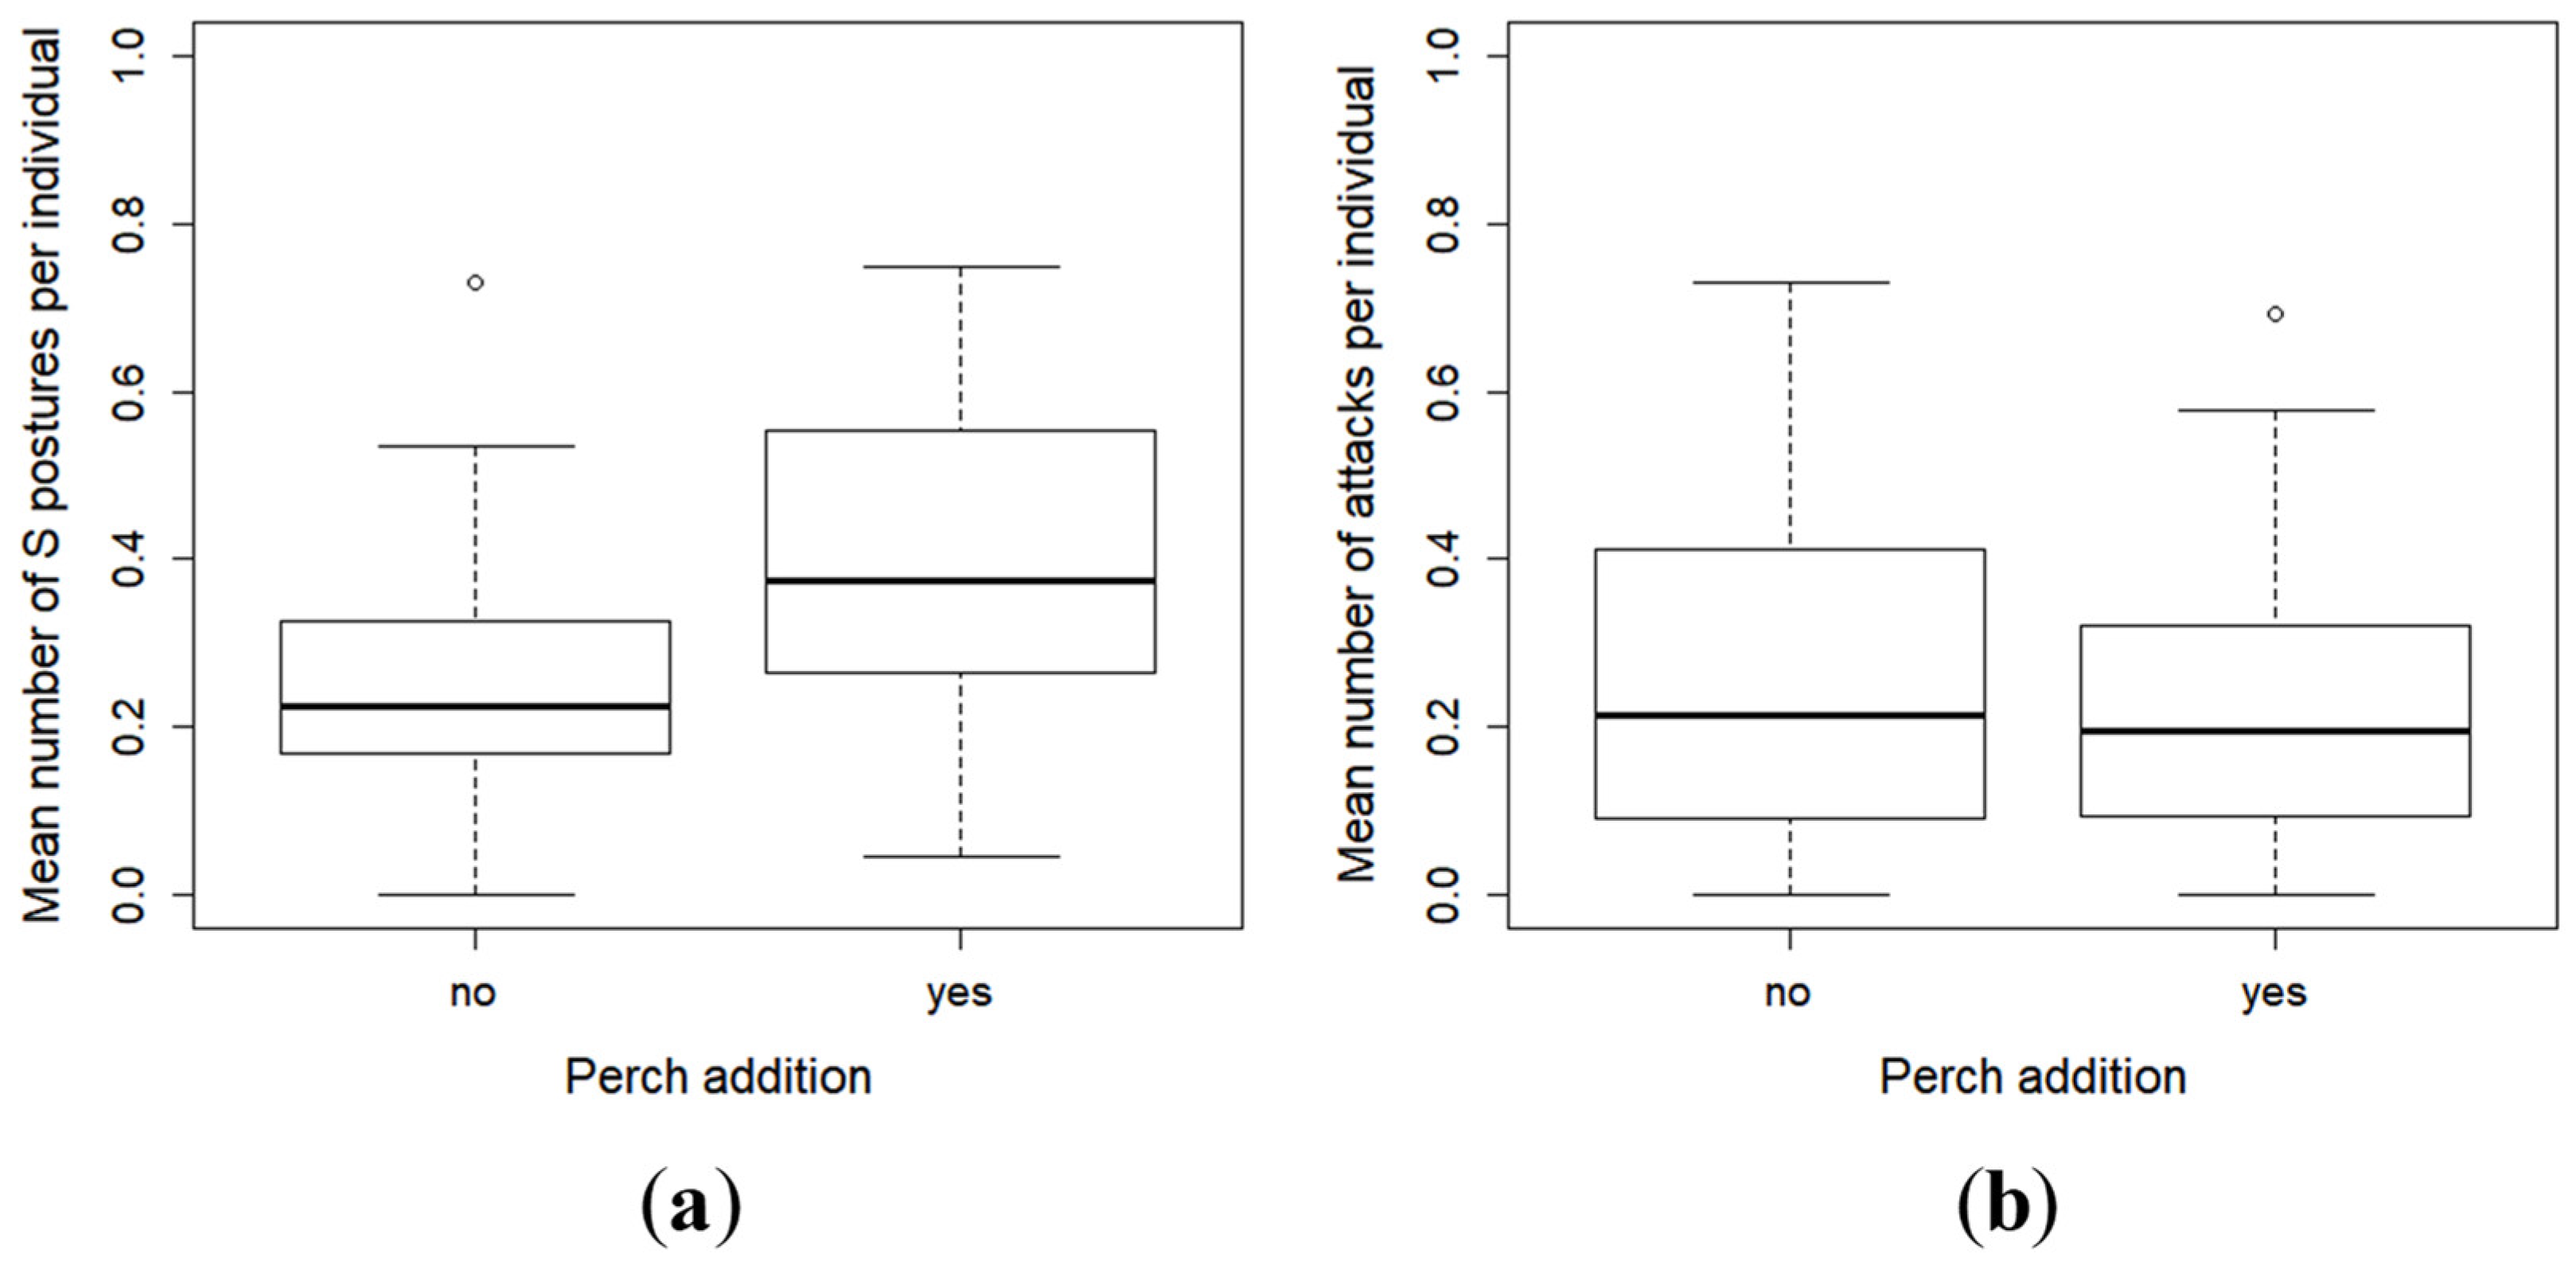
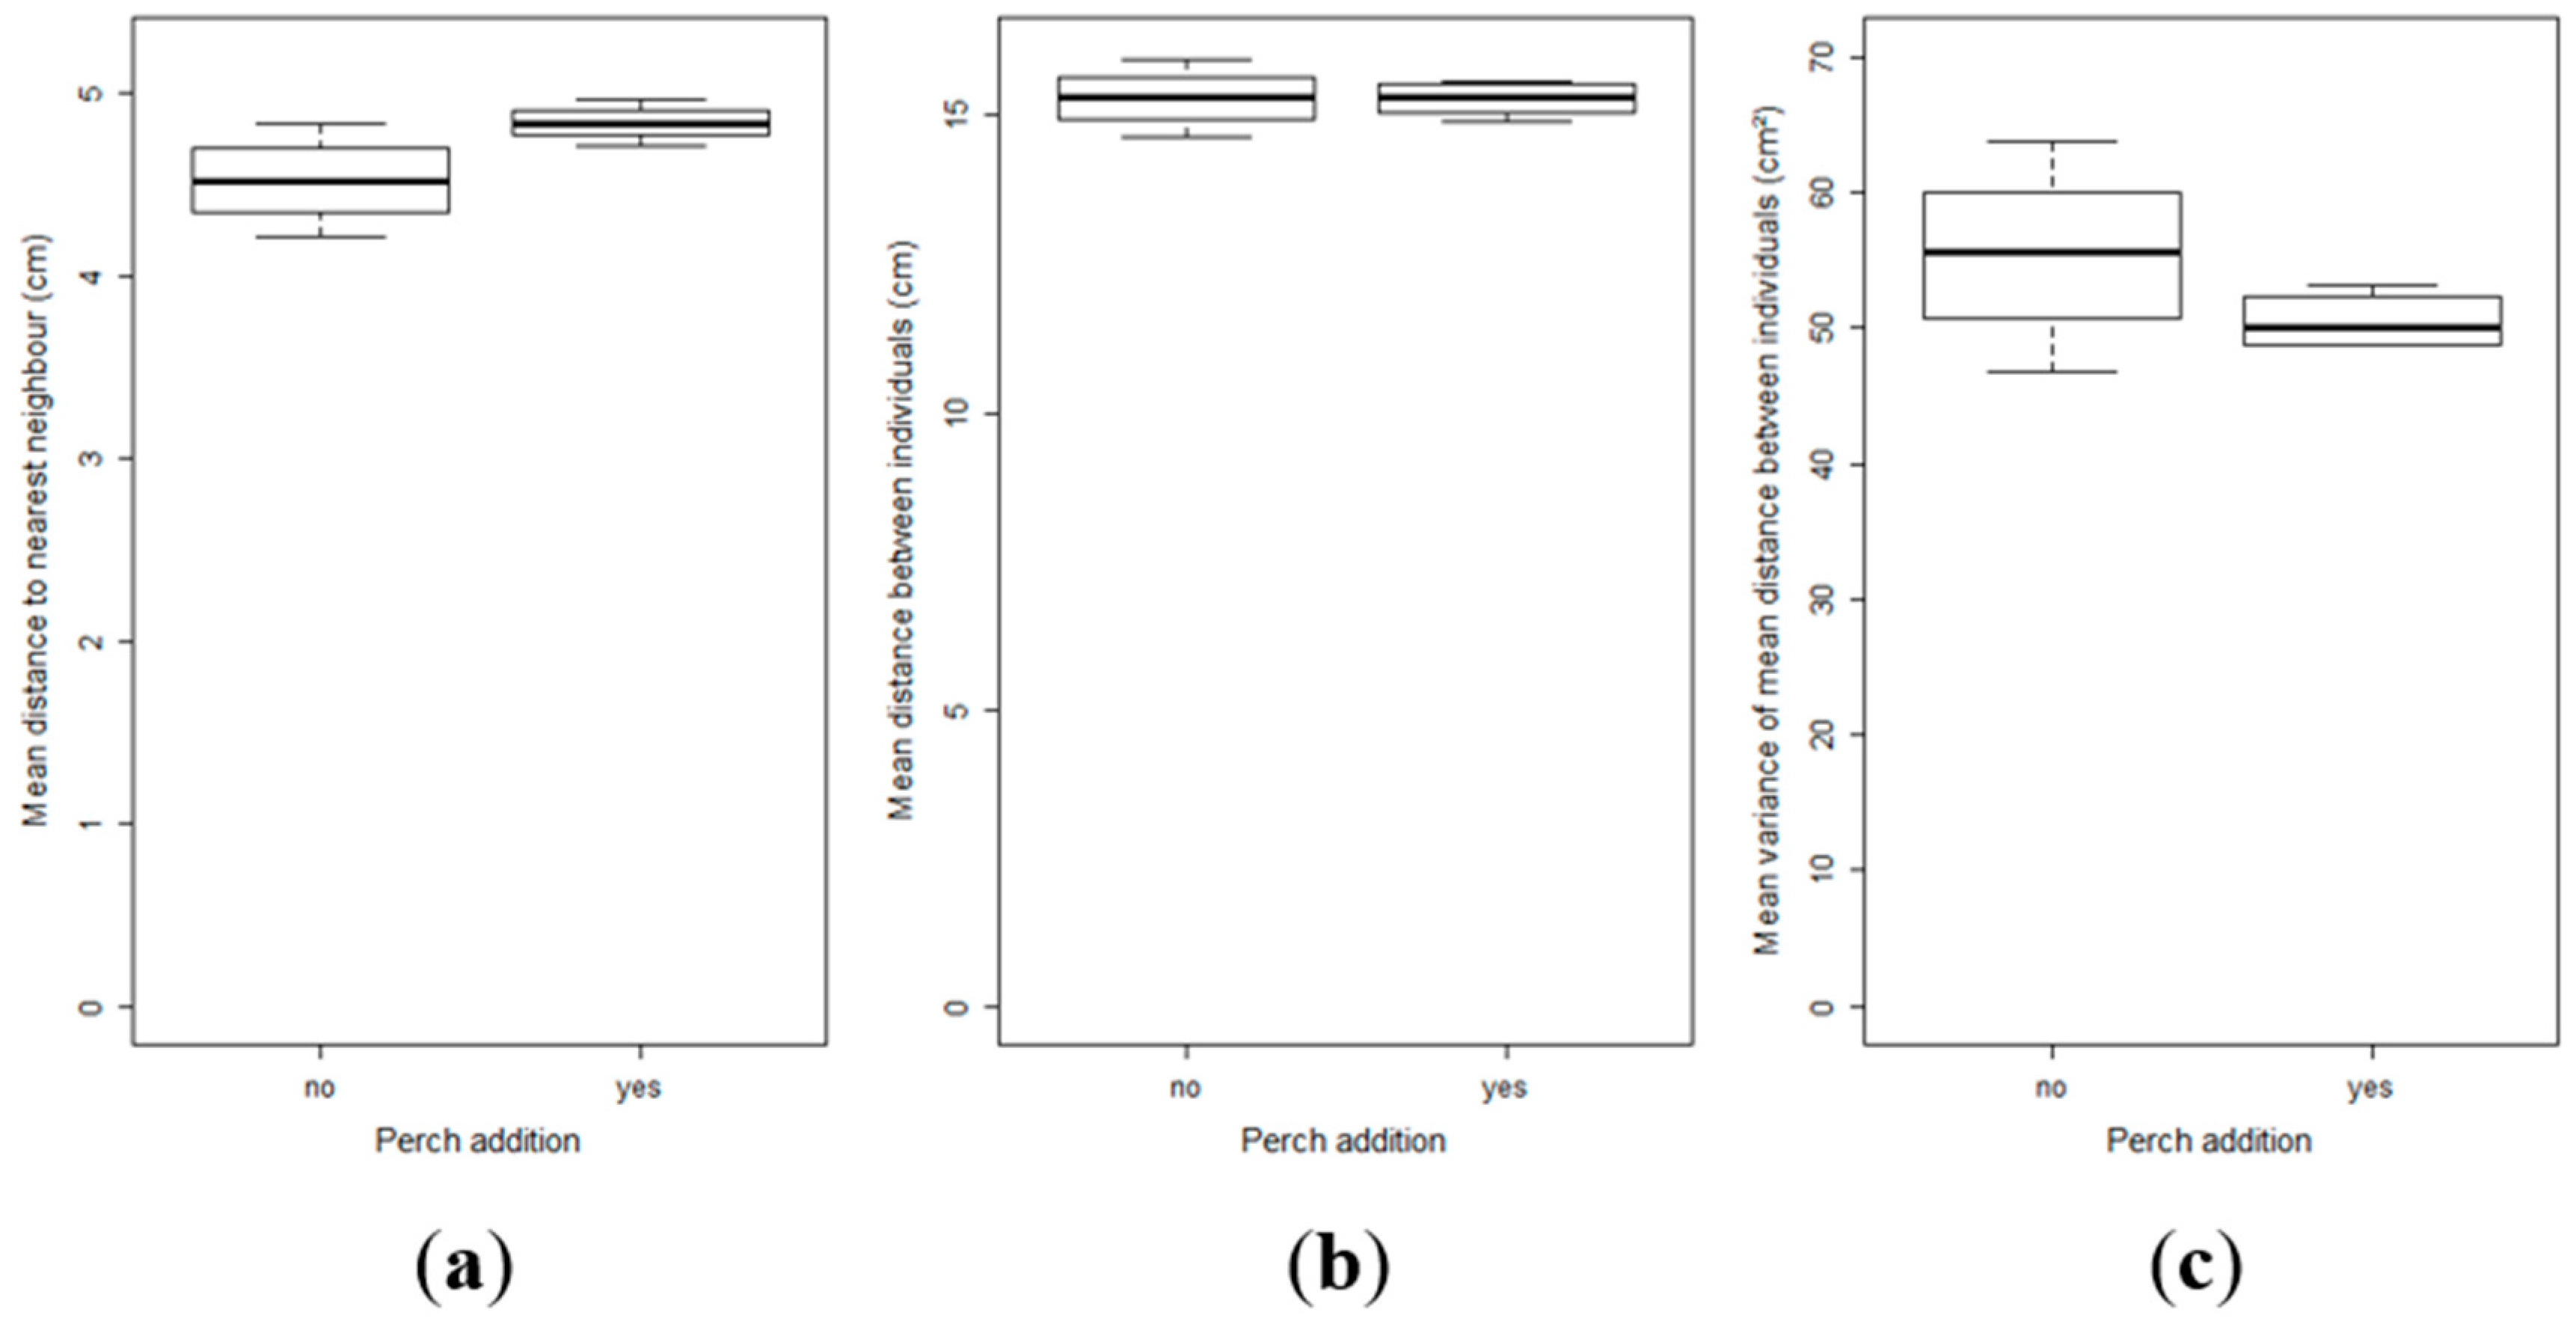
2.3. Effect of Perch as Prey on the Inter-Individual Relationships and Group Structure of Pikeperch Larvae

During the observations, only one ingestion of conspecific was seen, and the number of captures was low (n = 16). Thus, these behaviours were not included in the statistical analysis. No difference in S postures and attacks was observed between the two conditions (with or without perch) (S postures: X2 = 3.52, df = 1, p = 0.06 (Figure 5a), attacks: X2 = 0.57, df = 1, p = 0.45 (Figure 5b)). Pikeperch larvae showed a tendency to exhibit more S postures towards conspecifics in the presence of prey.
For the group structure, all the selected parameters did not show any significant differences; distance to the nearest neighbour (t-test, t = 2.28, df = 6, p = 0.06) (Figure 6a)), mean distance of an individual to its conspecifics (t-test, t = 0.08, df = 6, p = 0.93) (Figure 6b)) or variance of this mean distance (t-test, t = 1.35, df = 6, p = 0.22) (Figure 6c)). However, the results showed that the distance to the nearest neighbour between pikeperch larvae tended to be greater in the presence of perch.

3. Discussion

The introduction of potential forage prey in a population of pikeperch larvae affects their growth and development, and possibly their relationships. However, it seems to have no effect on the survival, aggressiveness between individuals, and group structure. Concerning the rate of cannibalism, it was found to be higher with perch than without perch. As we did not replace the larvae that had been cannibalized but only the individuals found dead in the racks, these results mean that, without perch, most deaths were “natural” (i.e., the dead larvae had no evidence of bites). In the presence of perch, the rate of survival showed a tendency to be higher, but many individuals disappeared and we assume that they had been cannibalized by their conspecifics. It can therefore be said that, when there are prey, the death caused by cannibalism is higher. This result seems to be in conflict with previous findings. Brownwell [47] showed that there was a reduction in cannibalism when adding heterospecific prey to anchovy (Engraulis encrasicolus), but the ratio of heterospecific/conspecific prey was biased in favour of the the heterospecifics (100 vs. 1). In the same way, Bell and Stamps [48] found that the tassergal (Pomatomus saltatrix) larvae ingested heterospecific prey whatever their relative density to the predator population and reduced the cannibalism. However, in their study, the density of prey was higher than the density of predators (6 vs. 1). Moreover, the latter authors observed that the heterospecific prey was more easily caught than conspecifics. The apparent preference of tassergal for heterospecific prey could be the result of a passive choice, unlike pikeperch, which tended to show an active choice [49]. Comparison with our study is therefore difficult. As we added a smaller number of prey, compared to the other studies, we probably favoured the most efficient predators, which had the best training for conspecific captures when all the prey had been ingested.
Our results are similar to those of other studies even though comparison is difficult due to major protocol differences. For example, Macpherson and Goroa [50] found that the rate of cannibalism increased when they put prey in the rearing tanks of cape hake (Merluccius capensis). This result could be explained by the fact that the prey took refuge in an area of the tank that was not accessible to the predators. In our study, the structure of the racks without any refuges and the height of the water (5 cm) gave no opportunity to the perch to escape from the pikeperch larvae. Thus, the increase in the cannibalism rate we observed in the racks with prey must have been be due to other factors. Perhaps, referring to the work of Baras [51] on sea bream (Brycon moorei), we can join his conclusions. In his experiment, Baras [51] gave prey to sea bream juveniles ad libitum and, even under these conditions, he recorded an increase in cannibalism after a short decrease at the beginning of the study. This increase can be seen as the results of few sea bream juveniles, being the first to capture prey. These ingestions influenced size differences between predators that consumed, or not, the prey. This size difference could be at the origin of a greater number of cannibalism cases. Such an interpretation can be used in our study. Indeed, as we only added 10 prey per day (except on the first day), only a few pikeperch larvae could feed on them (we noted that the prey were captured within one minute after their introduction in the rack). These individuals took an energetic advantage and probably also a size advantage within very few days. Such a size advantage may have been at the origin of the increase in cannibalism.
Moreover, there could be also a training effect. It is known that, like any behaviour, the predatory behaviour needs training to improve its efficiency [52]. In fact, the cannibalistic behaviour is a predatory behaviour, and the behavioural sequence is the same whatever the victim (a conspecific or a heterospecific individual). For example, the probability to capture a prey increases with the experience and the previous number of successes in marine mammals [53]. It is known in other animal groups and there is no doubt that it also exists in fish. If we assume that cannibals are larvae that show their predatory behaviour before the others [54], these individuals are expected be the first to attack and capture the perch larvae. By doing so, they improve the efficiency of their attack behaviour, which could be an advantage to show cannibalism when there is no more prey available. This could have led to an increase in the cannibalism rate in the presence of perch, partly because there was a limited number of a prey.
The increase in the rate of cannibalism in the presence of perch as prey was not correlated with an increase in the rate of aggressiveness between pikeperch larvae. First, this could have been due to the observation process, which was limited to one hour per day and for one rack only per condition (with or without perch). It may not have been sufficient to observe rare events such as attacks, bites or ingestion. However, under other conditions (in larger 700 L tank, with a density of 50 larvae L−1), we could observe aggressive interactions between pikeperch larvae during five-minute direct observations [45]. Such an aggressive behaviour does not seem therefore to have an uncommon occurrence. Another interpretation is that the introduction of prey in the racks with the pikeperch induced a lower level of attacks on conspecifics. This could explain the absence of difference in the level of aggressiveness between the conditions. It does not mean that the environment with perch larvae was more peaceful. A possible explanation is that the predators became more efficient and did not need several unsuccessful attempts to capture their conspecifics. With the introduction of perch larvae, the better predators grew faster, and qualified as most efficient cannibals.
These results are in accordance with those we found in the arenas. There was no clear difference between the larvae with and without perch concerning the three parameters of the group structure, even though the nearest neighbour distance tended to increase in the presence of perch. It means that the presence of cannibals in the group did not markedly modify the structure of the group. First, it could be a consequence of the design of the experiment. The arenas did not allow the prey to escape, so the only thing they could do was to avoid the predator (or cannibal) by moving away from it. It could explain why the distance to the nearest neighbour was higher with than without perch larvae. The second explanation is that, before the onset of cannibalism, pikeperch larvae were gregarious and nothing allowed them to distinguish a cannibal from a non-cannibal except its behaviour during the attack. It could explain why the groups might have been less gregarious, with higher distances to their neighbours when there was a higher cannibalism rate. The presence of cannibals in the group could have influenced the relationships and so the structure. This phenomenon has not been studied before, but we know that the presence of a predator could be responsible for the breakdown of the social structure of a prey group and the isolation of more vulnerable individuals [55]. The absence of significant results in the arena tests could be due to the fact that we do not know whether the rate of cannibalism in a rack was the result of one or several cannibals. As only 10 individuals were taken to carry out the arena tests, no cannibal may have been added to the arena, which could explain the highly variable results.

4. Material and Methods

4.1. Rearing of the Fish

Pikeperch larvae were produced by the farm Asialor (54160 Pierrevilliers, France) after stripping two females (3.9 and 4.5 kg, respectively); each batch of eggs was fertilized by three males. The eggs were mixed after fertilizing and entered the lab facilities one day after hatching on 19 February 2018. Perch larvae were produced by the farm Lucas Perches (57170 Hampont, France). This species was chosen as prey because, under natural conditions, pikeperch juveniles could use perch larvae and juveniles as prey. On arrival at the lab, the pikeperch larvae were transferred to 700 L tanks in an Recirculating Aquaculture System (RAS) at the Experimental Platform for Aquaculture (EPA) (UR AFPA, University of Lorraine, 54 Nancy-France). During the acclimatization period, water temperature started at 16 °C and was gradually increased by 1 °C per day until reaching 20 °C. Artificial lighting (50 lx) followed a 12 h light/12 h darkness cycle with lights on from 8:00 a.m. to 8:00 p.m. Tank cleaning was done once a day in the morning. The physico-chemical properties (ammonia, nitrites, pH and dissolved oxygen) of the water were monitored three times a week (Table 1). Fish were fed seven times per day between 8:30 a.m. to 5:30 p.m. during light periods. They were fed commercial feed (first with nauplii of Artemia (550–600 µm, Sep-Art Artemia cyst) from four days after hatching (dph) to 16 dph, then with Larviva PROWEAN 100, 300, 500, 700 µm (BIOMAR®, France) and INICIOplus 0.8 mm (BIOMAR®, France), following the weaning protocol used by Schram and Philipsen [56].
The larvae were observed daily in the tanks (5 min per tank) looking for the cannibalistic behaviours. After the first cannibalism case, pikeperch larvae were transferred to the experimental design in the hatchery of the laboratory where the behavioural tests were done.
Perch larvae were also reared at the EPA in the hatching room. They were put into racks (38 × 11 × 07 cm) on a hatching table at 15 °C. They were transferred to the laboratory at 8 dph in nets (2 L) settled in an aquarium (50 × 35 × 30 cm), in a room located next to the pikeperch experimental room. The temperature was increased by 2 °C per day until reaching 20–21 °C. The same feeding schedule as that of pikeperch was used for perch larvae.

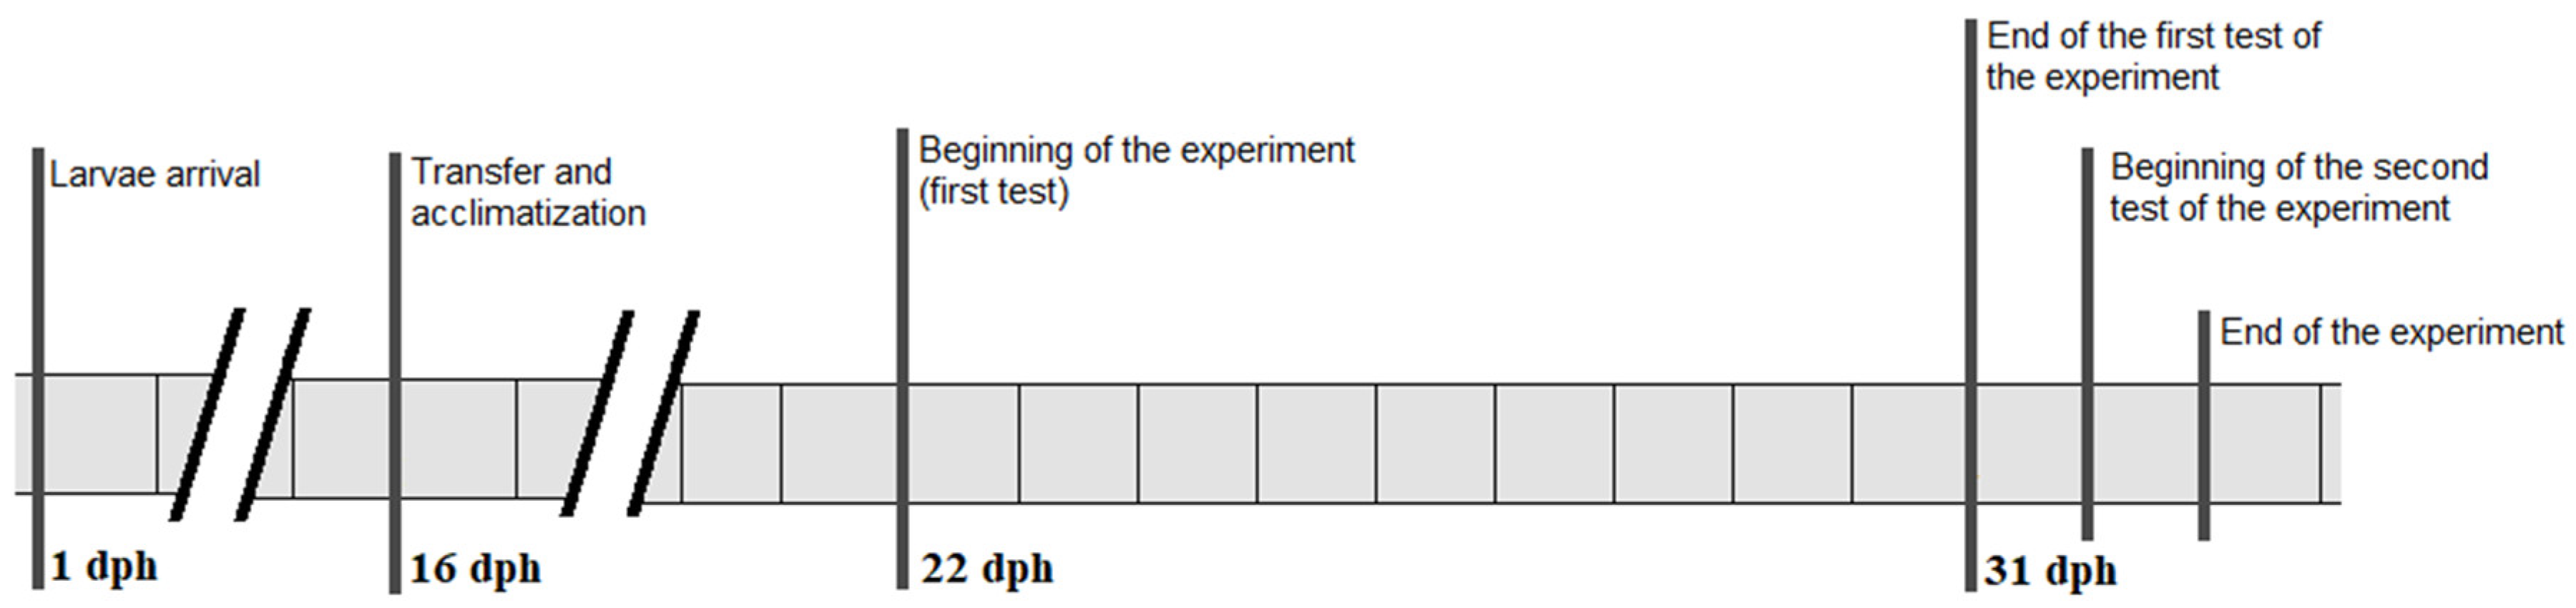
4.2. Experimental Design

After their transfer to the hatchery room in the laboratory, pikeperch larvae were distributed on two hatching tables (140 × 60 × 15 cm) (120L). Each hatching table contained height racks (38 × 11 × 07 cm). Each rack was completed with 50 pikeperch larvae. Acclimatization of the larvae to their new environment was done over the course of a week (Figure 7). The environmental conditions were the same as in the RAS system: the temperature was 20–21 °C, the light cycle was the same and the same feeding protocol was followed. The physico-chemical properties (ammonia, nitrites, pH and dissolved oxygen) of the water were monitored three times a week (Table 1). During that week, each morning, we counted and picked up the dead larvae in each rack. In order to maintain some density per rack, we replaced dead larvae by the same number of larvae coming from a stock, kept in the same room under the same conditions. By replacing only the dead larvae, we did not take into account the number of individuals that had disappeared by cannibalism. After one week, we introduced perch prey into half of the racks (four on each hatching table) chosen over the eight racks. The first day (at 22 dph for pikeperch larvae, Figure 7), 20 perch larvae (7 dph, weight: 6.5 ± 1.3 mg) were added to these racks. Then, 10 perch larvae were added on a daily basis over an eight-day period (Figure 7). Perch larvae were added in the morning before the first feeding. As before, during this experimental phase, dead pikeperch were removed, counted, and replaced every day. There was no dead perch larva found. At the end of this period, the counts of dead and live pikeperch larvae allowed us to calculate the survival and cannibalism rates per rack:
-
Survival rate = (Number of living larvae at the end of the period)/(Total number of larvae introduced into the rack (initial larvae [50] + larvae replaced daily)) × 100,
-
Cannibalism rate = (Total number of larvae introduced into the rack—Cumulated number of dead larvae during the period—Number of living larvae at the end of the period)/(Total number of larvae introduced into the rack) × 100.
Survival and cannibalism rates were calculated with the data of the two hatching tables (n = 8 racks for each condition with or without perch prey). For the statistical comparison, we used a linear mixed model with the survival and cannibalism rates as fixed variables and the hatching tables and racks as random variables (lm, package ‘lme4′) [57]. All statistical analyses were performed using the free software R version 3.2.4 [58]. The level of significance used in all tests was p < 0.05.

4.3. Influence of Perch as Prey on Zootechnical Parameters

For the zootechnical parameters, only the larvae of one hatching table were used. All the larvae of this hatching table were euthanatized (with an overdose of tricaine methanesulfonate (MS222): 240 mg L−1), measured and weighted. The larvae used for this experiment had not been measured and weighed before being put into the racks, but they had been sampled from a population of larvae among which 45 larvae had been measured and weighed (at 14 dph, length: 12.1 ± 1.1 mm, weight: 11.0 ± 2.9 mg) on the same day. This sample was used as initial sample to estimate the growth of the pikeperch larvae with and without perch. Comparisons were made between pikeperch larvae concerning length, weight and CV of the two measures.
Two additional parameters were used to describe the growth development:
-
The specific growth rate, which is the rate of daily mass gain: SGR = (lnWf-lnWi)/Td × 100, where Wf (mg) and Wi (mg) were respectively the mean final and initial body weight, and Td (days) the time of the experiment in days. As it was not possible to weigh individually all the larvae before the experiment, we used the mean mass of 45 larvae collected from the same tank for calculating the initial mean individual mass. It was thus the same for all the racks.
-
Fulton’s condition factor: FCF = W/L3, where W (mg) and L (mm) were the weight and total length of each individual at the end of the experiment, respectively. FCF was calculated for each fish of all the racks.
The comparisons of the individuals between the two conditions (with and without perch) for the zootechnical parameters (length, weight, CV, SGR and FCF) were made with Student’s t-test after checking that the data were normally distributed (Shapiro’s test) and that the variances were homogeneous (Levene’s test). The level of significance used in all tests was p < 0.05.

4.4. Influence of Perch as Prey on the Relationships between Pikeperch Larvae

Following the introduction of the first group of prey, videos of the fish were recorded daily from 3:00 p.m. to 5:00 p.m. Two groups of two contiguous racks (one with perch larvae, and one without perch larvae) were chosen at random and filmed simultaneously every day. All the racks with and without perch (n = 8 for each condition) were filmed over the time course of the experiment. During recording, the devices were illuminated (50lx). From every video recording, a ten-minute sample (chosen at random) was analysed. The behavioural analysis was done with the Boris® software, and four aggressive behaviours were considered corresponding to previous descriptions [45,59]:
-
The S posture: the fish adopts a posture with the shape of S in front of a conspecific and stays motionless.
-
The attack: it is characterized by a sudden movement forward in the direction of a conspecific. It can be subsequent to the S posture or not.
-
The capture: it occurs when an individual grabs a conspecific with its mouth and attempts to ingest it. The victim can escape or not. In general, it is grabbed by flanks or tail.
-
The ingestion: after the capture, the cannibal attempts to ingest its prey. For that, it needs to reorient the prey into a tail-first or head-first position to swallow it.
All the observations were done on the videos. As it was not possible to film the whole surface of the two racks, we calculated the mean number of individuals seen in the 10-min samples that were analysed. To that end, we counted the number of pikeperch larvae in each rack three different times (0, 5 and 10 min) during each observation, and averaged these numbers. Then, we corrected the number of aggressive interactions in each category (see above) for each rack by this mean number of observed pikeperch larvae. Comparisons between the two conditions (with or without perch) were made with a linear mixed model using the rate of aggressive behaviour as fixed variable and the racks and the hatching table as the random variables (lm, package ‘lme4’ [57]). The level of significance used in all tests was p < 0.05.

4.5. Influence of Perch as Prey on the Pikeperch Group Structure

At the end of the experiment, just before euthanizing of the pikeperch larvae, we tested the influence of the presence of potential prey on the group structure, based on inter-individual distances. This new experiment was done with the pikeperch larvae of only one hatching table (eight racks). For this experiment, 10 larvae were taken at random from each rack and put in circular arena (diameter = 30 cm, height = 5 cm, water height = 1.5 cm) (see [60] for more details on the experimental setup). The temperature of the experimental room was the same as in the hatching room. The water in the arenas was taken from the hatching table. The arenas were placed on a translucent stand and illuminated (50lx) from below in order to increase the contrast.
After an acclimatization period of 30 min, a camera (Sony, Handycam, DCR-SR72E) placed 80 cm above the arenas filmed the larvae for one hour. From the films, 13 pictures were taken (one every five minutes), and the following parameters according to Buske and Gerlai [61] were collected with ImageJ® software:
-
The distance (cm) to the nearest neighbour for each larva of the group, which is an index of the group aggregation: the shorter the distance is, the greater the aggregation.
-
The mean distance (cm) for each larva to all the other members of the group, which is correlated with the group cohesion: the shorter the mean distance is, the greater the group cohesion.
-
The variance of the mean distance for each larva, which is a parameter of the group homogeneity: the lower the variance is, the higher the homogeneity of the group.
For the data analysis, we used a parametric Student’s t-test after checking that the data were normally distributed (Shapiro’s test) and that the variances were homogeneous (Levene’s test). The level of significance used in all tests was p < 0.05.
The experiment was carried out at the Experimental Platform for Aquaculture (registration number for animal experimentation C54-547-18) belonging to the UR AFPA lab and located at the Faculty of Sciences and Technologies of the University of Lorraine (France). All fish treatments and procedures used in this study were in accordance with the guidelines of the Council of European Communities (2010/63/UE) and the French Animal Care Guidelines (Animal approval No. APAFISH#13193-20183016302695vl).

5. Conclusions

In this study, we showed that the addition of a small number of forage fish prey in a population of pikeperch larvae as predators with potential cannibals increased the rate of cannibalism after nine days. The individuals with perch larvae as prey had a better rate of growth and did not exhibit more aggressive behaviours. Our results suggest no significant effect on the mitigation of cannibalism in pikeperch larvae after using perch larvae as live prey.

Author Contributions

Methodology: A.P., T.C., and C.A.; Data acquisition: C.A.; Formal Analysis: T.C. and C.A.; Writing—original draft preparation: A.P.; Writing—Review editing: C.A., T.C., and P.F.; Funding acquisition: P.F.

Funding

This research was funded by the European Union’s Seventh Framework Programme for research, technological development and demonstration (KBBE-2013-07 single stage, GA 603121, Diversify).

Acknowledgments

We would like to thank Joelle Couturier and Yannick Ledoré for their technical help.

Conflicts of Interest

The authors declare that there is no conflict of interest.

References

  1. Polis, G.A. The evolution and dynamics of intraspecific predation. Ann. Rev. Ecol. Syst. 1981, 12, 225–251. [Google Scholar] [CrossRef]
  2. Smith, C.; Reay, P. Cannibalism in teleost fish. Rev. Fish Biol. Fish. 1991, 1, 41–64. [Google Scholar] [CrossRef]
  3. Hecht, T.; Pienaar, A.G. A review of cannibalism and its implications in fish larviculture. J. World Aquac. Soc. 1993, 24, 246–261. [Google Scholar] [CrossRef]
  4. Baras, E. Cannibalism in fish larvae: What have we learned? In Larval Fish Aquaculture; Qin, J.G., Ed.; ISEM 2012-053; Nova Science Publishers: New York, NY, USA, 2012; pp. 1–37. [Google Scholar]
  5. Soulsby, D. Animal Cannibalism: The Dark Side of Evolution; 5mEntreprises: Sheffield, UK, 2013. [Google Scholar]
  6. Van den Bosch, F.; de Roos, A.M.; Gabriel, W. Cannibalism as a lifeboat mechanism. J. Math. Biol. 1988, 26, 619–633. [Google Scholar] [CrossRef]
  7. Fox, L.R. Cannibalism in natural populations. Ann. Rev. Ecol. Syst. 1975, 6, 87–106. [Google Scholar] [CrossRef]
  8. Elgar, M.; Crespi, A. Cannibalism: Ecology and Evolution among Diverse Taxa, 1st ed.; Oxford Science Publications: Oxford, UK, 1992. [Google Scholar]
  9. Pereira, L.S.; Agostinho, A.A.; Winemiller, K.O. Revisiting cannibalism in fishes. Rev. Fish Biol. Fish. 2017, 27, 499–513. [Google Scholar] [CrossRef]
  10. Babiak, I.; Mandiki, S.N.M.; Ratsinjomanana, M.; Kestemont, P. Initial weight and its variation in post-larval Eurasian perch affect quantitative characteristics of juvenile cohorts under controlled conditions. Aquaculture 2004, 234, 263–276. [Google Scholar] [CrossRef]
  11. Mandiki, S.N.M.; Babiak, I.; Krol, J.; Rasolo, J.F.R.; Kestemont, P. How initial predator-prey ratio affects intra-cohort cannibalism and growth in Eurasian perch Perca fluviatilis L larvae and juveniles under controlled conditions. Aquaculture 2007, 268, 149–155. [Google Scholar] [CrossRef]
  12. Naumowicz, K.; Pajdak, J.; Terech-Majewska, E.; Szarek, J. Intracohort cannibalism and methods for its mitigation in cultured freshwater fish. Rev. Fish Biol. Fish. 2017, 27, 193–208. [Google Scholar] [CrossRef]
  13. Pienaar, A.G. A Study of Coeval Sibling Cannibalism in Larval and Juvenile Fishes and Its Control under Culture Conditions. Ph.D. Thesis, Rhodes University, Grahamstown, South Africa, 1990. [Google Scholar]
  14. Baras, E.; Jobling, M. Dynamics of intracohort cannibalism in cultured fish. Aquac. Res. 2002, 33, 461–479. [Google Scholar] [CrossRef]
  15. Buijse, A.D. Dynamics and Exploitation of Unstable Percid Populations; Wageningen Agricultural University: Wageningen, The Netherlands, 1992. [Google Scholar]
  16. Galarowicz, T.L.; Wahl, D.H. Foraging by a young-of-the-year piscivore: The role of predator size, prey type, and density. Can. J. Fish. Aquat. Sci. 2005, 62, 2330–2342. [Google Scholar] [CrossRef]
  17. Har, P.J.B.; Ison, S. The influence of prey size and abundance, and individual phenotype on prey choice by the three-spined stickleback, Gasterosteus aculeatm L. J. Fish Biol. 1991, 38, 359–372. [Google Scholar] [CrossRef]
  18. Pedersen, T.; Falk-Petersen, I.B. Morphological changes during metamorphosis in cod (Gadus morhua L.), with particular reference to the development of the stomach and pyloric caeca. J. Fish Biol. 1992, 41, 449–461. [Google Scholar] [CrossRef]
  19. Benhaïm, D.; Bégout, M.L.; Lucas, G.; Chatain, B. First Insight into Exploration and Cognition in Wild Caught and Domesticated Sea Bass (Dicentrarchus labrax) in a Maze. PLoS ONE 2013, 8, e65872. [Google Scholar] [CrossRef]
  20. Heermann, L.; Borcherding, J. Competition, predation, cannibalism: The development of young-of-the-year perch populations in ponds with bream or roach. J. Appl. Ichthy 2013, 29, 549–554. [Google Scholar] [CrossRef]
  21. García-Berthou, E. Ontogenetic diet shifts and interrupted piscivory in introduced largemouth bass (Micropterus salmoides). Int. Rev. Hydrobiol. 2002, 87, 353–363. [Google Scholar] [CrossRef]
  22. García-Berthou, E.; Moreno-Amich, R. Food of introduced pumpkinseed sunfish: Ontogenetic diet shift and seasonal variation. J. Fish Biol. 2000, 57, 29–40. [Google Scholar] [CrossRef]
  23. Persson, A.; Brönmark, C. Foraging capacity and resource synchronization in an ontogenetic diet switcher, pikeperch (Stizostedion lucioperca). Ecology 2002, 83, 3014–3022. [Google Scholar] [CrossRef]
  24. Mittelbach, G.G.; Persson, L. The ontogeny of piscivory and its ecological consequences. Can. J. Fish. Aquat. Sci. 1998, 55, 1454–1465. [Google Scholar] [CrossRef]
  25. Diana, M.J.; Diffin, R.J.; Einfalt, L.M.; Walh, D.H. Effect of rearing experience on the survival, growth and behaviour of hatchery-reared large mouth bass. N. Am. J. Fish. Manag. 2018, 38, 794–802. [Google Scholar] [CrossRef]
  26. Shoup, D.E.; Broderius, C.R. Effects of vegetation density on the ontogeny to piscivory of juvenile largemouth bass. N. Am. J. Fish. Manag. 2018, 38, 630–638. [Google Scholar] [CrossRef]
  27. Hecht, T.; Appelbaum, S. Observations on intraspecific aggression and coeval sibling cannibalism by larval and juvenile Clarias gariepinus (Clariidae: Pisces) under controlled conditions. J. Zool. 1988, 214, 21–44. [Google Scholar] [CrossRef]
  28. Otterå, H.; Folkvord, A. Allometric growth in juvenile cod (Gadus morhua) and possible effects on cannibalism. J. Fish Biol. 1993, 43, 643–645. [Google Scholar] [CrossRef]
  29. Kaji, T.; Kodama, M.; Arai, H.; Tagawa, M.; Tanaka, M. Precocious development of the digestive system in relation to early appearance of piscivory in striped bonito Sarda orientalis larvae. Fish. Sci. 2002, 68, 1212–1218. [Google Scholar] [CrossRef]
  30. Thorpe, J. Morphology, physiology, behavior, and ecology of Perca fluviatilis L. and P. flavescens Mitchill. J. Fish. Board Can. 1977, 34, 1504–1514. [Google Scholar] [CrossRef]
  31. Sawada, Y.; Okada, T.; Miyashita, M.; Murata, O.; Kumai, H. Completion of the Pacific Bluefin tuna Thunnus orientalis (Temminck et Schlegel) life cycle. Aquac. Res. 2005, 36, 413–421. [Google Scholar] [CrossRef]
  32. Tanaka, Y.; Minami, H.; Ishihi, Y.; Kumon, K.; Eba, T.; Nishi, A.; Shiozawa, S. Prey utilization by hatchery reared Pacific Bluefin tuna larvae in mass culture tank estimated using stable isotope analysis, with special reference to their growth variation. Aquac. Sci. 2010, 58, 501–508. [Google Scholar] [CrossRef]
  33. Tanaka, Y.; Minami, H.; Ishihi, Y.; Kumon, K.; Higuchi, K.; Eba, T.; Nishi, A.; Nikaido, H.; Shiozawa, S. Relationship between prey utilization and growth variation in hatchery reared Pacific Bluefin tuna Thunnus orientalis (Temminck et Schlegel), larvae estimated using nitrogen stable isotope analysis. Aquac. Res. 2014, 45, 537–545. [Google Scholar] [CrossRef]
  34. Tanaka, Y.; Minami, H.; Ishihi, Y.; Kumon, K.; Higuchi, K.; Eba, T.; Nishi, A.; Nikaido, H.; Shiozawa, S. (Differential growth rates related to initiation to piscivory by hatchery reared larval Pacific Bluefin tuna Thunnus orientalis. Fish. Sci. 2014, 80, 1205–1214. [Google Scholar] [CrossRef]
  35. Tanaka, Y.; Kumon, K.; Higuchi, K.; Eba, T.; Nishi, A.; Nikaido, H.; Shiozawa, S. Influence of the prey items switched from rotifers to yolk sac larvae on growth of laboratory reared Pacific Bluefin tuna. Aquac. Sci. 2015, 63, 445–457. [Google Scholar] [CrossRef]
  36. Nyina-wamwiza, L.; Xu, X.L.; Blanchard, G.; Kestemont, P. Effect of dietary protein, lipid and carbohydrate ratio on growth, feed efficiency and body composition of pikeperch Sander lucioperca fingerlings. Aquac. Res. 2005, 36, 486–492. [Google Scholar] [CrossRef]
  37. Kestemont, P.; Dabrowski, K.; Summerfelt, R.C. Biology and Culture of Percid Fishes, 1st ed.; Springer: Dordrecht, The Netherlands, 2015. [Google Scholar]
  38. Szczepkowski, M.; Zakęś, Z.; Szczepkowska, B.; Piotrowska, I. Effect of size sorting on the survival, growth and cannibalism in pikeperch (Sander lucioperca L.) larvae during intensive culture in RAS. Czech J. Anim. Sci. 2011, 56, 483–489. [Google Scholar] [CrossRef]
  39. Mamcarz, A.; Kucharczyk, D.; Kujawa, R.; Skrzypczak, A. Influence of fish density on survival, growth and cannibalism development of pikeperch (Stizostedion lucioperca L.) larvae. In 2nd International Workshop Aquacult Percid Fish; European Aquaculture Society: Oostende, Belgium, 1997; pp. 343–346. [Google Scholar]
  40. Molnár, T.; Hancz, C.; Bódis, M.; Müller, T.; Bercsényi, M.; Horn, P. The effect of initial stocking density on growth and survival of pike-perch fingerlings reared under intensive conditions. Aquac. Int. 2004, 12, 181–189. [Google Scholar] [CrossRef]
  41. Lappalainen, J.; Olin, M.; Vinni, M. Pikeperch Cannibalism: Effects of Abundance, Size and Condition. Ann. Zoolo. Fen. 2006, 43, 35–44. [Google Scholar]
  42. Kestemont, P.; Xu, X.; Hamza, N.; Maboudou, J.; Toko, I.I. Effect of weaning age and diet on pikeperch larviculture. Aquaculture 2007, 264, 197–204. [Google Scholar] [CrossRef]
  43. Kangur, P.; Kangur, A.; Kangur, K. Dietary importance of various prey fishes for pikeperch Sander lucioperca (L.) in large shallow lake Võrtsjärv (Estonia). Proc. Estonian Acad. Sci. Biol. Ecol. 2007, 56, 154–167. [Google Scholar]
  44. Ginter, K.; Kangur, K.; Kangur, A.; Kangur, P.; Haldna, M. Diet patterns and ontogenetic diet shift of pikeperch, Sander lucioperca (L.) fry in lakes Peipsi and Vrtsjarv (Estonia). Hydrobiologia 2011, 660, 79–91. [Google Scholar] [CrossRef]
  45. Colchen, T.; Fontaine, P.; Ledore, Y.; Teletchea, F.; Pasquet, A. Intra cohort cannibalism in early life stages of pikeperch. Aquac. Res. 2019. [Google Scholar] [CrossRef]
  46. Keskinen, T.; Marjomäki, T.J. Diet and prey size spectrum of pikeperch in lakes in central Finland. J. Fish Biol. 2004, 65, 1147–1153. [Google Scholar] [CrossRef]
  47. Brownwell, C.L. Laboratory analysis of cannibalism by larvae of the cape anchory Engraulis capensis. Trans. Am. Fishs Soc. 1985, 114, 512–518. [Google Scholar] [CrossRef]
  48. Bell, A.M.; Stamps, J.A. Development of behavioural differences between individuals and populations of sticklebacks, Gasterosteus aculeatus. Anim. Behav. 2004, 68, 1339–1348. [Google Scholar] [CrossRef]
  49. Turesson, H.; Persson, A.; Bronmark, C. Prey size selection in piscivorous pikeperch (Stizostedion lucioperca) includes active prey choice. Ecol. Fresh Water Fish 2002, 11, 223–233. [Google Scholar] [CrossRef]
  50. Macpherson, E.; Gordoa, A. Effect of prey density on cannibalism in cape hake (Merluccius capensis) off Namibia. Mar. Biol. 1994, 119, 145–149. [Google Scholar] [CrossRef]
  51. Baras, E. Sibling cannibalism in dorada under experimental conditions. I. Ontogeny, dynamics, bioenergetics of cannibalism and prey size selectivity. J. Fish Biol. 2000, 57, 1001–1020. [Google Scholar] [CrossRef]
  52. Dill, L.M. Adaptative flexibility. Can. J. Fish. Aquat. Sci. 1983, 40, 398–408. [Google Scholar] [CrossRef]
  53. Iwata, T.; Sakamoto, K.Q.; Edwards, E.W.J.; Staniland, I.J.; Trahtan, P.N.; Goto, Y.; Sato, K.; Naito, Y.; Takahashi, A. The influence of preceding dive cycles on the foraging decisions for antartic fur seals. Biol. Lett. 2015, 11. [Google Scholar] [CrossRef]
  54. Colchen, T. Etude Multi-Traits du Cannibalisme Intra-Cohorte chez les Premiers Stades de vie du Sandre (Sander lucioperca). Ph.D. Thesis, University of Lorraine, Nancy, France, 2017. [Google Scholar]
  55. Bumann, D.; Rubenstein, D.; Krause, J. Mortality risk of spatial positions in animal groups: The danger of being in front. Behaviour 1997, 134, 13–14. [Google Scholar] [CrossRef]
  56. Schram, E.; Phillipsen, E. Production of Market Size Pikeperch (Sander lucioperca) in a Pilot RAS; RIVO (Netherlands Institute for Fisheries Research) Report: Ymuiden, Netherlands, 2003; p. 21. [Google Scholar]
  57. Bates, D.; Mächler, M.; Bolker, B.; Walker, S. Fitting linear mixed-effects models using lme4. arXiv, 2014; arXiv:1406.5823. [Google Scholar]
  58. R Core Team. A Language and Environment for Statistical Computing; R Foundation for Statistical Computing: Vienna, Austria, 2016; Available online: https://www.R-project.org/ (accessed on 11 March 2019).
  59. Houde, E.D. Fish larvae. In Encyclopedia of Ocean Sciences; Steele, J.H., Turekian, K.K., Thorpe, S.A., Eds.; Academic Press: London, UK, 2001; pp. 928–938. [Google Scholar]
  60. Colchen, T.; Faux, E.; Teletchea, F.; Pasquet, A. Is personality of young fish consistent through different behavioural tests? Appl. Anim. Behav. Sci. 2017, 194, 127–134. [Google Scholar] [CrossRef]
  61. Buske, C.; Gerlai, R. Early embryonic ethanol exposure impairs shoaling and the dopaminergic and serotoninergic system in adult zebrafish. Neurotoxicol. Teratol. 2011, 33, 698–707. [Google Scholar] [CrossRef]
Figure 1. Mean (Standard Error; SE) of the survival rates (a) and cannibalism rates (b) of the larvae with and without perch at the end of the experiment. * indicates a significant difference between the individuals with and without perch.
Fishes 04 00021 g001
Figure 2. Mean (SE) of the total length (a) and weight (b) of the larvae with and without perch. * indicates a significant difference between the individuals with and without perch.
Fishes 04 00021 g002
Figure 3. Mean (SE) of the coefficients of variation (CV) (SE/mean × 100)) of the total length (a) and weight (b) of the larvae with and without perch.
Fishes 04 00021 g003
Figure 4. Mean (SE) of the Specific Growth Rate (SGR) (a) and Fulton’s Condition Factor (FCF) (b) of the larvae with and without perch.
Fishes 04 00021 g004
Figure 5. Mean (SE) of the number of S postures (a), and attacks (b) observed among the pikeperch larvae in the racks during the 10-min of video recordings.
Fishes 04 00021 g005
Figure 6. Mean (SE) of the different parameters used to characterize the group structure: mean distance to the nearest neighbour for each individual of the group (a); mean distance between all individuals (b); and variance of the latter mean distance (c).
Fishes 04 00021 g006
Figure 7. Chronological design of the experiment. Description of the timing of the different experimental phases from hatching (19 February) to the end of the experiment 23 March). It includes the acclimatization period, the supplementation with perch and the test in arena.
Fishes 04 00021 g007
Table 1. Mean ± SE values for four water quality parameters in the experiment. (a): during the acclimatization period in the 700 L tanks (number of measures = 7), and (b) in the hatchery tables (number of measures = 4).
PeriodsDissolved Oxygen
(mg·L−1)
pHAmmonium Ion Content
(mg·L−1)
Nitrous Nitrogen Content
(mg·L1)
(a)7.8 ± 0.38.0 ± 0.20.05 ± 0.040.01 ± 0.03
(b)7.5 ± 0.26.9 ± 0.70.07 ± 0,060.02 ± 0.02

