Article

Assessment of the Scales of Gilthead Seabream (Sparus aurata L.) by Image Analysis and Atomic Force Microscopy

by
Francisco Casado
1,
Santiago Casado
2,
Diana Ceballos-Francisco
1 and
María Ángeles Esteban
1,*
1
Department of Cell Biology and Histology, Faculty of Biology, Campus Regional de Excelencia Internacional “Campus Mare Nostrum”, University of Murcia, 30100 Murcia, Spain
2
IMDEA Nanoscience, Ciudad Universitaria de Cantoblanco, 28049 Madrid, Spain
*
Author to whom correspondence should be addressed.
Submission received: 9 January 2018 / Revised: 20 January 2018 / Accepted: 23 January 2018 / Published: 30 January 2018

Abstract

:
Understanding the protective role of fish skin is critical to improving the development of aquaculture, since skin is the main surface that separates the animal from its always hazardous environment. Many techniques have been used for its study, but certain structural characteristics of fish skin still remain not clearly understood. That is the case with scales, which have always been attributed a mere protective role, but which are proving to have more functions than it was traditionally thought. To acquire a deeper knowledge, scales from six different regions of gilthead seabream (Sparus aurata L.) were studied and measured by image analysis. Results prove that scales from the base of the dorsal fin are larger than those in other parts of the fish body while scales from the peduncle are the smallest of the skin. Furthermore, a technique relatively new in this field, known as atomic force microscopy (AFM), was used to obtain representations of the ultrastructure of the scales and measure certain features such as the circuli and the lines in the basal layer. The data obtained allowed us to compare the height of circuli among the different scales, showing that they were higher in scales from the dorsum and the operculum. The present results introduce a nanostructural model of the scales of gilthead seabream that might serve as a useful guideline for future studies.

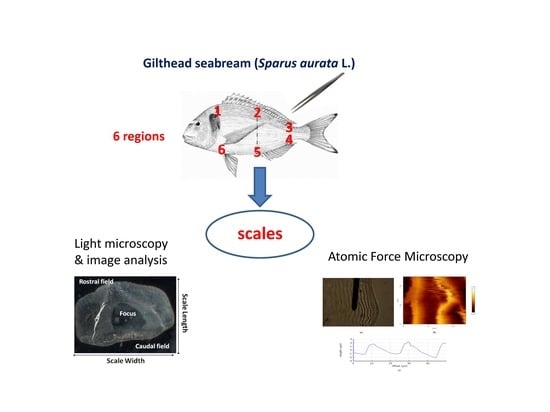
Graphical Abstract

1. Introduction

With the development of modern aquaculture, further understanding of fish skin is proving critical to managing fish health in intensive farming facilities [1], since the high density of fish inside the cages or tanks implies frequent aggression, which usually leads to problems in the skin [2]. To keep skin damage to a minimum, and therefore maintain the health of the animals, it is vital to improve our knowledge of the structure of the organ and the mechanisms involved in its protection. One of the most relevant mechanical defensive structures of the skin is the scale, which is embedded in a pocket of dermis that invades the epidermis [3,4]. Scales are a type of hard plates which developed over evolution in many bony fishes to provide protection against external hazards, without compromising the necessary range of movements of the animals [5,6]. They also play a crucial role in maintaining the structure of the upper layers of skin [7].
Fish scales can have different shapes, depending on the species, but they usually have a standard composition based on collagen and hydroxylapatite [8]. The most common type of scales in teleost fish is elasmoid scales, which derive phylogenetically from the ganoid scales of species like sturgeons [9,10] and overlap obliquely from head to tail [11]. Elasmoid scales can be classified in cycloid and ctenoid [12], with both types having the same mineral composition consisting of three layers: the basal plate formed by elasmodin, the external layer composed by a network of interwoven collagen fibrils, and the limiting layer, which is a hyper-mineralized tissue similar to enamel [13]. In the limiting layer, there are several wrinkles, known as radii, which spread from the focus or center of the scale towards the rostral field. Other structures present in the scale surface are the circuli, which are ridges disposed parallel to the outer rim which cross the radii perpendicularly [14,15]. The former are lines of poorer ossification where the basal layer is exposed, which presumably confers more flexibility to the scale [16], while the latter are periodical deposits that form as the scale grows bigger [17], possibly starting at a daily ratio, and slowing down as the fish gets older [18].
In this work, we aimed to compare the appearance and morphology of scales from six different regions of the skin, resembling other studies which also tried to find differentiating features among skin from different body regions [19,20,21,22]. Given that different parts of the body are allegedly exposed to different motion requirements, we expected scales to vary in size across different parts of the skin [9].
Additionally, this study aimed to analyze, for the first time, fish scales using atomic force microscopy (AFM) to characterize their structure at a micrometric level. AFM is a microscopy technique consisting of a tip of nanometric diameter that scans the surface of a sample, detects the height of every bit of its surface and elaborates a precise 3D topographical map with the resulting data [23,24,25]. Microscopic study of scales is proving useful for species identification and even sex differentiation [26], but the techniques employed to date might present some flaws. One of the main advantages that AFM presents, compared to other techniques like electron microscopy, is the possibility of analyzing biological structures with no need for previous transformation [27,28], which is why it has proved ideal for the study of fresh scales. We expected to visualize the circuli of the scales and measure their height. Furthermore, we studied the parts of the scale devoid of macroscopic features, such as the focus and the internal side, in order to define their structure.
For this work, we decided to analyze scales of gilthead seabream (Sparus aurata L.), which is a highly produced species worldwide [29] and has an important background in science, being frequently used as a model for the study of teleost skin [22,30].

2. Results

2.1. Study of Scales from Different Regions with Light Microscope

Scales from six regions of the skin of gilthead seabream were analyzed by light microscopy and AFM. The different regions were chosen to be far enough from each other to avoid overlapping, and also to provide a representative view of all the scales (Figure 1). Region 1 was situated caudo-dorsally to the operculum and cranial to the base of the dorsal fin. Region 2 was at the base of the dorsal fin. Regions 3 and 4 were at the end of the dorsal and anal fins respectively, in the caudal peduncle. Region 5 mirrored region 2 and it was located at the insertion of the anal fin. Region 6 was delimited by a triangle formed by the lower part of the operculum and the bases of the pectoral and pelvic fins [31].
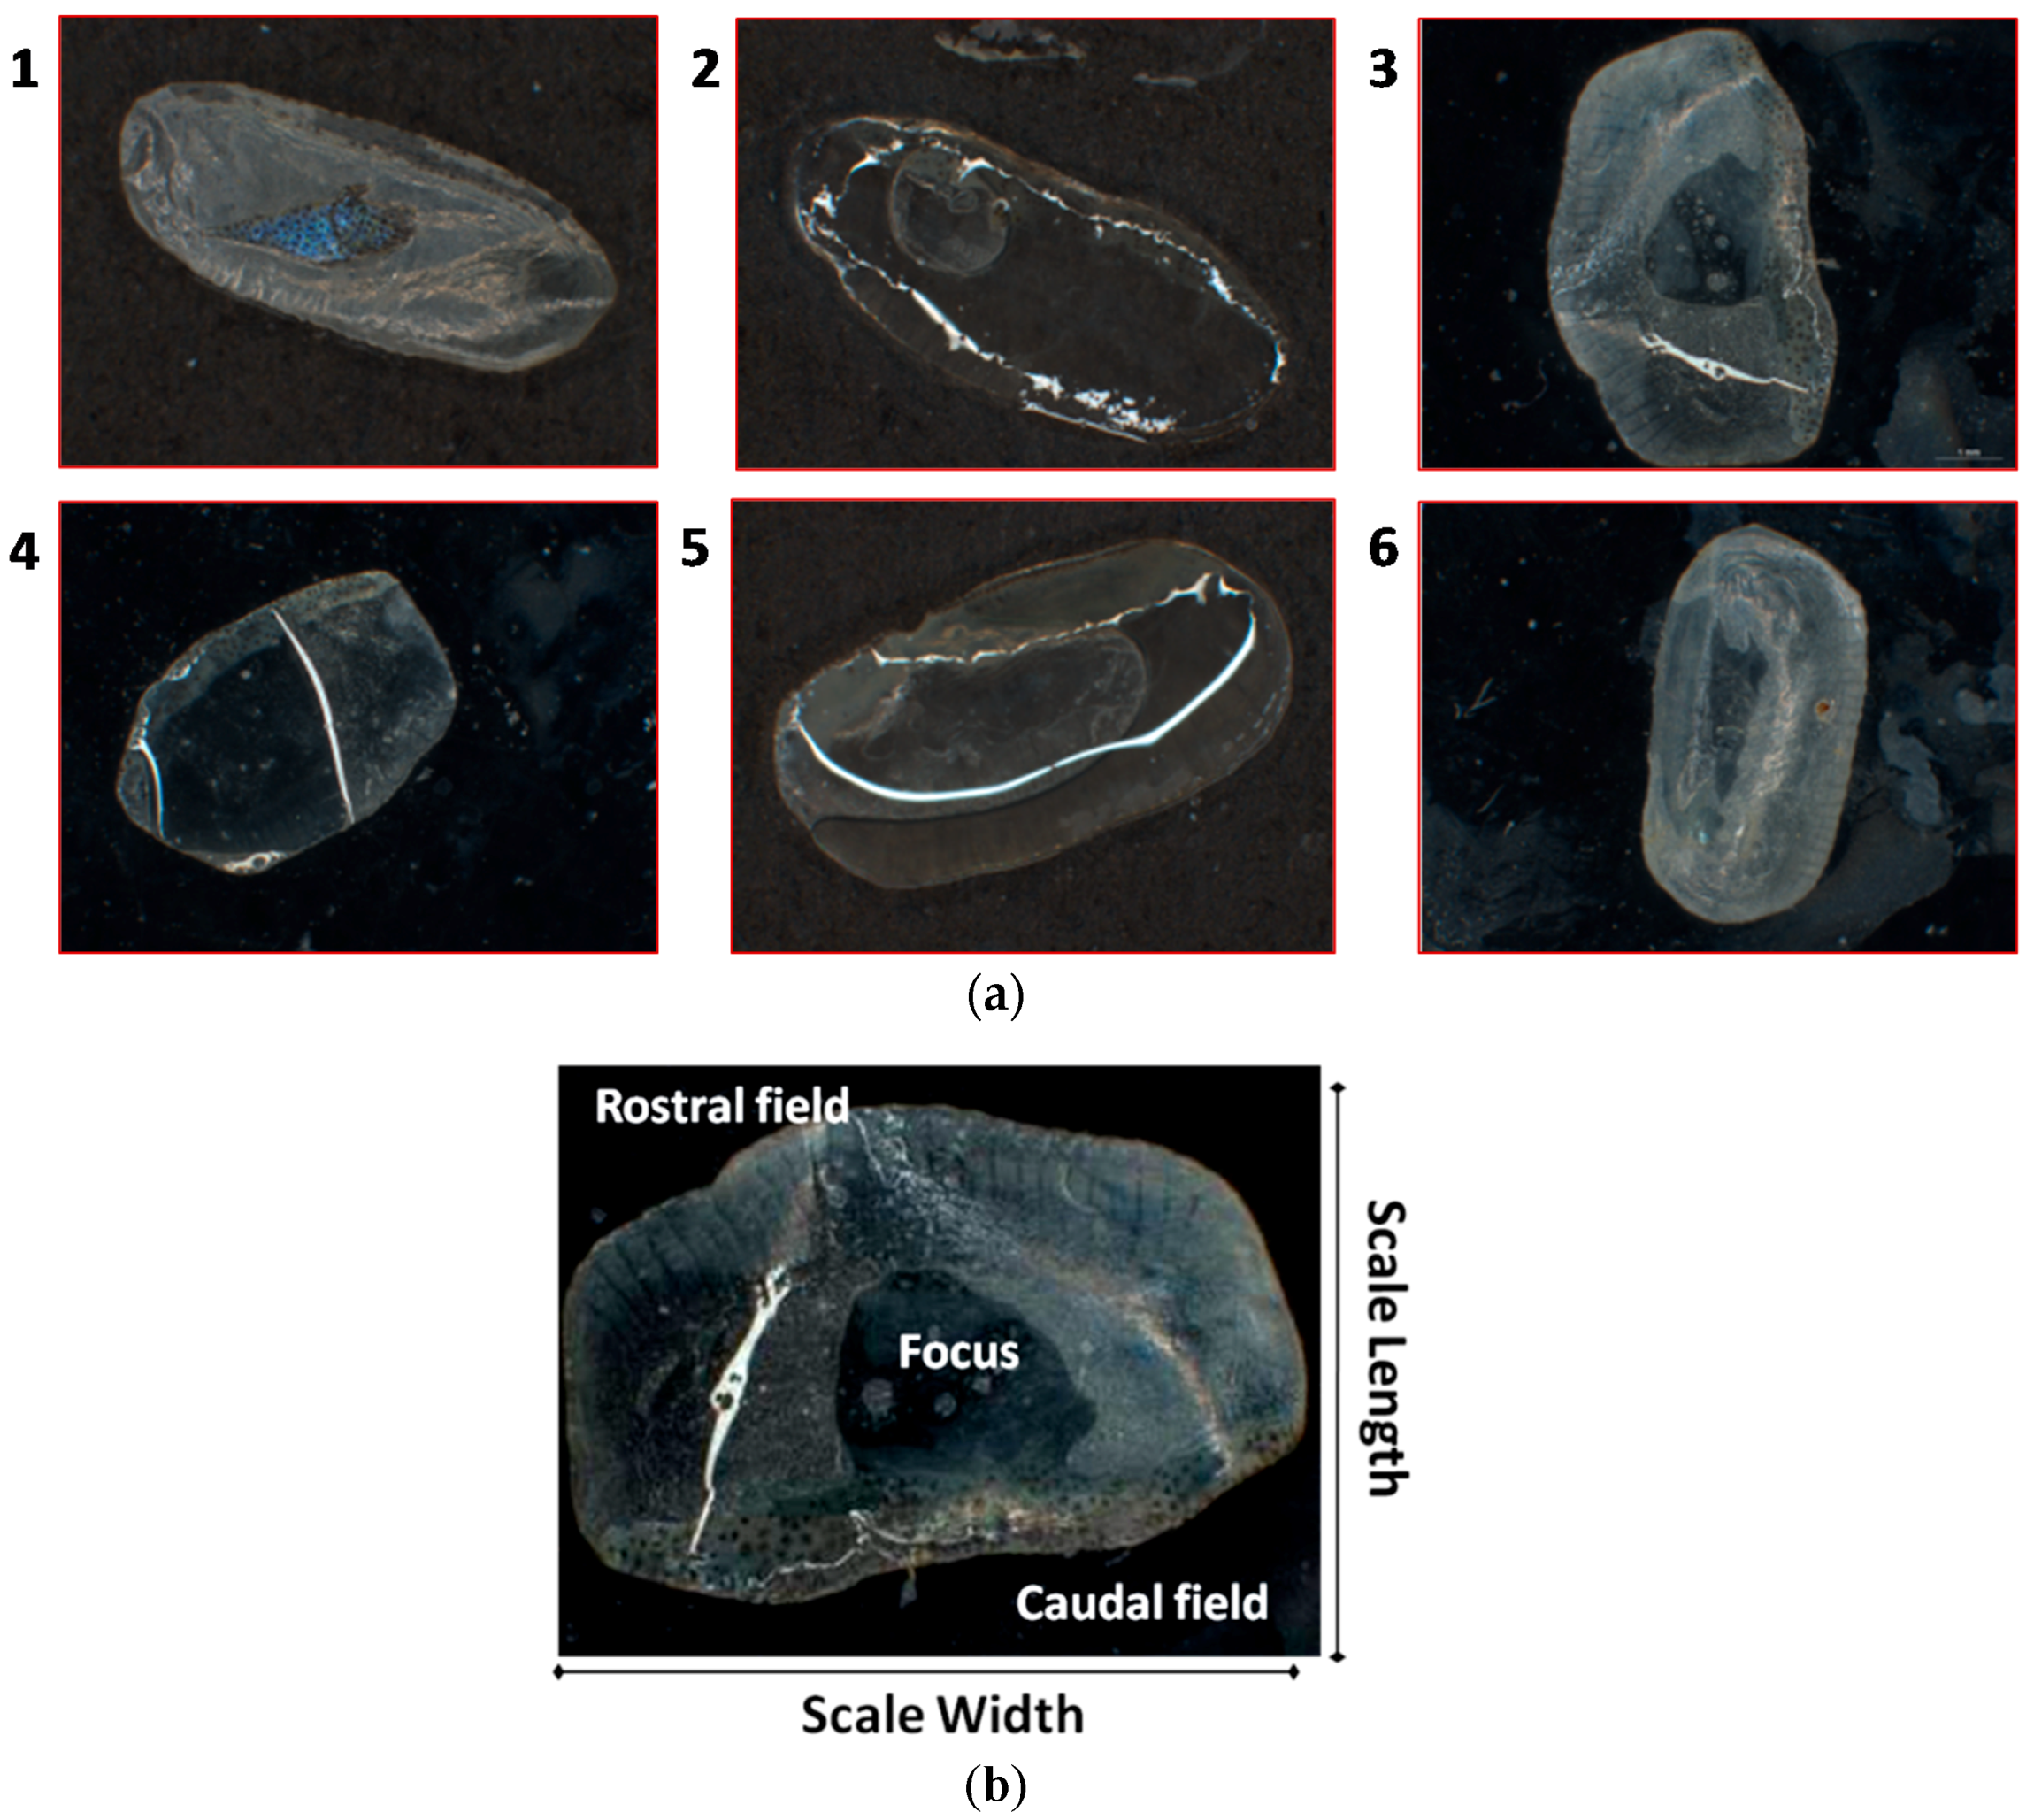
The Leica light microscope allowed us to obtain an amplified vision of scales and helped the visualization of their surface and the measurement of their size. Like other members of the Sparidae family, gilthead seabream has ctenoid scales on its skin [32], which usually have protrusions on their caudal field. In this case, no cteni were appreciated, probably due to the young age of the studied specimens. Scales from regions 1, 2 and 5 showed an enlarged shape, much wider than longer, while the other scales (scales from regions 3, 4 and 6) had a more rounded appearance (Figure 2a).
Visual detection of radii and circuli was also possible in most of the scales analyzed. In the studied specimens radii and circuli only remain visible in the outermost rim of the scale, being absent in most of the surface of the scale (Figure 2b), which is compatible with some degree of resorption as the scale grows larger [32,33].
When the size of scales from the different skin regions was compared, significant differences in the width and the total area were found, as shown in Figure 3. Differences in scale length, however, were not significant among regions. Regarding the width, scales from region 2 were significantly bigger than those from regions 3, 4 and 6. Measurements of the areas showed similar results, with the scales from region 2 being statistically larger than scales from regions 4 and 6, although no statistical differences were found with other regions. Altogether, these findings showed that scales from region 2 of the skin, which is on the back of the fish under the dorsal fin, are the largest of all the regions measured.
On the other hand, scales from region 4 have the shortest width and the smallestarea, being statistically smaller in both cases than regions 2 and 5.

2.2. Study of Scales with Atomic Force Microscopy

The circuli of the rostral field were scanned via AFM, showing their structure with great deal of detail and allowing the measurement of their height (Figure 4). Micron order heights were observed on the circuli of every region, which increased as we approached the scale edge. The height of circuli spanned from 1 to 4 µm, and it was compared between the six different regions analyzed. The scales from regions 2 and 6 were significantly higher than those from regions 4 and 5, and also from region 3 in case of the circuli from region 2 (Figure 5). Width of the same circuli was more variable, and spanned from 15 to 25 µm.
When focusing on the scale, the surface was more disorganized than in the rostral field and lacked any apparent organization. The tips near the focus reached heights commonly below 3 µm, probably as a result of focal resorption [33], or even of nucleus regeneration due to scale loss due to their rapid growth and mineralization [34]. This process of scale regeneration has also been studied in gilthead seabream by light microscopy and microarray [35]. On the other hand, it has to be taken into account that the process of scale damage or loss is very frequently observed in farmed fish, due to the high density of animals within the tank [34,36].
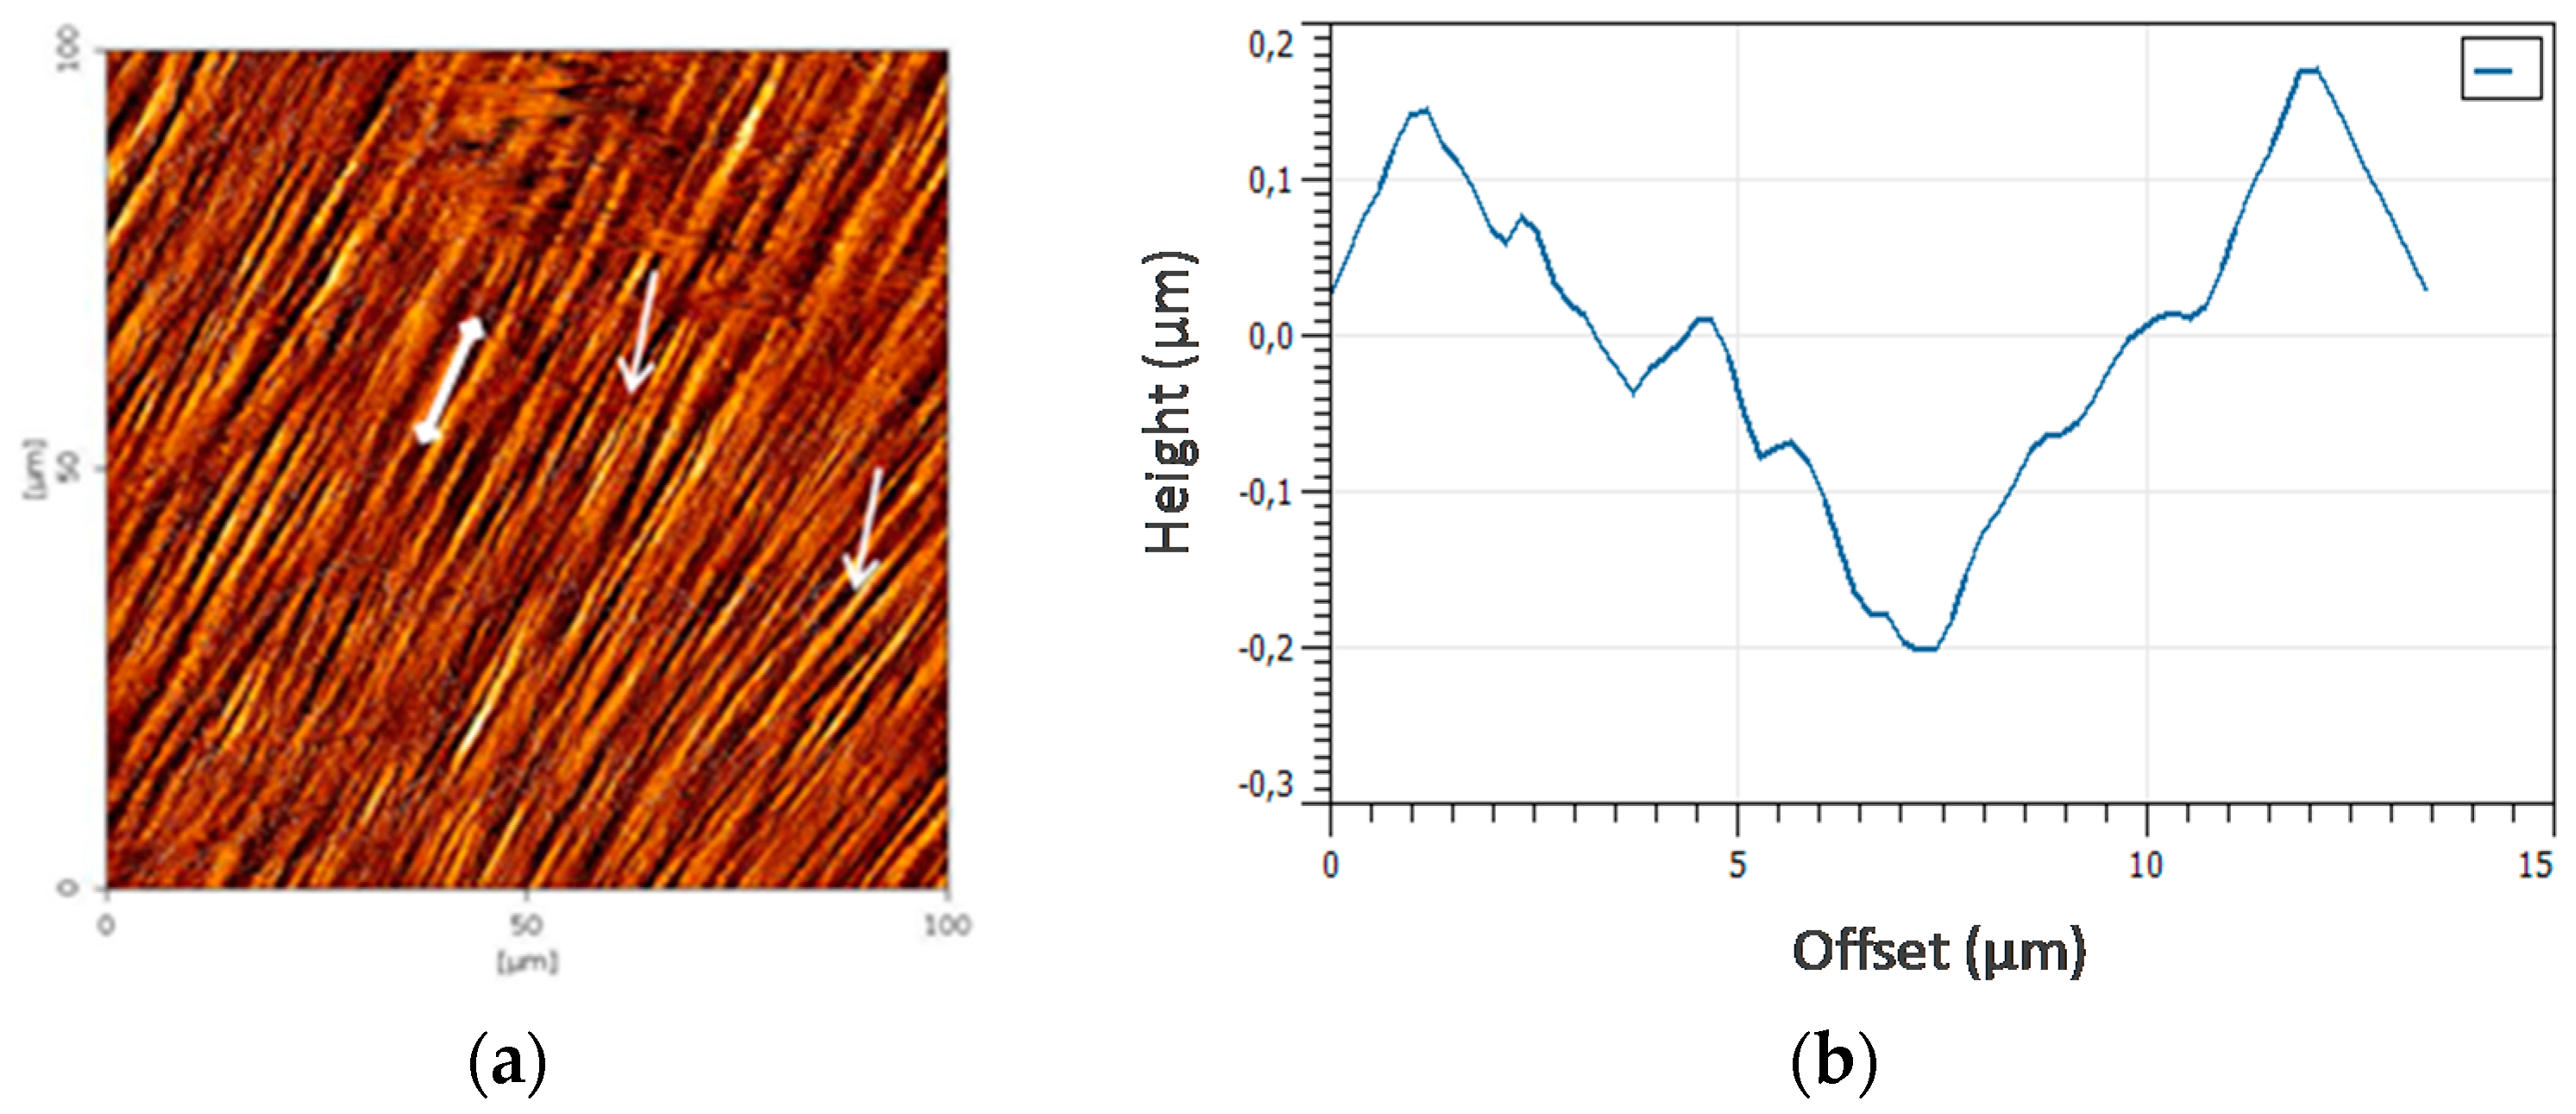
The internal side of the scales was also scanned with the AFM and the images showed an almost smooth surface with small depositions of material between 0.1 and 0.7 µm high that formed parallel lines oriented caudo-rostrally. Crossing those lines, there were subtle depressions that corresponded to the impression of the circuli from the opposite side (Figure 6).

3. Discussion

The measurement of scales with light microscopy revealed that scales were larger in the middle part of the body, with the scales from the base of the dorsal fin larger than those from the ventral side, while the smallest scales were found in the peduncle. This could be due precisely to the mobility of the regions; while the central parts of the skin might be more static, the tail is in constant movement, and needs to bend more often and more acutely, so smaller scales could be an advantage in the tail region. This is also in agreement with the finding of different scale morphologies depending on the skin region, which has been noted in other fish species [37].
Atomic Force Microscopy was also used for the study of scales. The AFM scans the surface of the sample using a silicon tip of nanometric diameter. This ability to “touch” instead of “see” the sample provides many advantages, such as perceiving the surface as it really is and not as it looks like, allowing the detection of features that might be invisible using other techniques [25]. Moreover, the AFM allowed us to work with almost unaltered samples, which were kept wet, in similar conditions to physiological ones, allowing us to obtain high-resolution images and 3D representations. This is an advantage compared to other techniques such as electron microscopy, which, although it is also useful for the study of micrometric structures, requires a previous transformation of the sample that involves desiccation and mounting, plus the need to work in vacuum conditions, which unavoidably alters its physiological conformation [38]. Confocal microscopy was also considered for this study, but the need for a precise fluorescent dye and the apparent absence of any literature regarding the measurement of dyed structures in fish scales made this technique quite challenging. Moreover, fluorescence might not cover the whole structure of the sample which could imply errors in the measurements, while AFM measures the actual surface with great precision.
The images obtained showed the surface features of both the external and internal sides of cycloid scales of gilthead seabream. In the external side, the height of the circuli proved to be in the micron order scale, varying depending on the distance to the edge to up to 4 µm and varying depending on the region, while the more disorganized prominences from the focus of the scale were commonly below 3 µm. On the internal side, low (0.1–0.7 µm) parallel lines were found oriented caudo-cranially, which probably corresponded to deposits of orthodentin constituting the limiting layer [15].
Study of fish scales has gained importance in recent years as these structures are proving to be a good indicator of the animal life-style, not to mention they are a source of inspiration for new synthetic materials [39,40,41]. Furthermore, their extraction does not cause any considerable damage to the individuals, since it can be done in low stress conditions and thus not cause a notable alteration of their health status [42]. For instance, some authors have been able to distinguish farmed from wild fish just by comparing their scales [38,43], which also applies to small-scale fisheries management [44]. Moreover, scales were found to be reservoirs of calcium [45] and cortisol, suggesting that they could be a tool to measure stress over time [46]. Other studies found a correlation between the growth rate of certain fish species and the uptake of glycine in their scales [47]. Learning how to obtain as much information as possible from fish scales could be advantageous at many levels. This work presents a general overview of the scales of gilthead seabream and suggests the use of scales from the dorsal region to perform morphological analysis, due to their bigger size, while scales from other regions could be considered for other purposes. The images obtained provide further knowledge about the scales of gilthead seabream that could be used for identification and classification. Although this study was conducted on specimens of small size, it provides useful information on the species. In the future, the technique should be applied on fully grown individuals of the same as well as related species for comparative purposes. We also introduced a highly specialized technique, the atomic force microscopy, which in the current work was proved to be very useful inanalyzing the ultrastructure of fish scales, thus offering many possibilities in the present field of study that will surely be explored in future research.

4. Materials and Methods

Three specimens of the hermaphroditic protandrous teleost gilthead seabream (S. aurata L.), measuring 14.1, 14.2 and 14.2 cm long and 5.6, 5.6 and 5.6 cm wide, respectively, and weighing 90 to 100 g were obtained from a local farm in Murcia (Spain). The Kolmogorov–Smirnov test proved that the selected fish had a statistically similar size. Specimens were kept in re-circulating seawater aquaria (250 L) with a flow rate of 900 L/h in the Marine Fish Facility at the University of Murcia, allowing acclimatizing for 2 weeks. The temperature and salinity were 22 ± 2 °C and 28‰, respectively. The photoperiod was of 12 h light: 12 h dark. A commercial diet (Skretting, Cojóbar, Spain) was administered at a rate of 2% body weight per day. Fish were anesthetized with 30 mg/L clove oil prior to sampling the skin in each trial. The protocol was approved by the Committee on the Ethics of Animal Experiments of the University of Murcia (Permit Number: A13150104), according to EU 63/2010 and RD53/2013.
Six different skin regions were considered for the gathering of scales (Figure 1). The animals, one at a time, were anesthetized with MS-222 and carefully placed in a smooth surface where ten scales were extracted from each region using a pair of metal tweezers. Five scales per region were fixed in glutaraldehide and placed between a slide and a coverslip to be measured under light microscopy. The remaining five scales were rinsed with phosphate buffered saline PBS rich in penicillin, streptomycin and amphotericin B, before being placed in flasks with RPMI and sent for analysis under AFM. A Leica Z6 APO optical microscope (Leica Microsystems Ltd., Barcelona, Spain) was used to visualize the scale preparations and a Leica DC500 camera (Leica Microsystems S.L.U.) to take photographs of each of them. The resulting images of seabream scales were examined using the Leica QWin software (Leica Microsystems Ltd.). Scales’ length was measured (being the length the diameter that crosses the scale from back to front), as well as the width (the distance between the two lateral fields), and the area. The aforementioned measurements were drawn in the images and the data were collected for comparison among regions. Since fish were chosen to be isometric, no standardization was thought necessary; additionally, Pearson’s chi-square proved that there were no statistical differences among the sizes of fish. The values measured on the scales were statistically analyzed by Tukey’s test to determine differences between the scales using Statistical Package for Social Science (SPSS for Windows; v19) and differences were considered statistically significant when p < 0.05.
An AFM JPK Nanowizard II® (JPK Instruments, Berlin, Germany) was used for the atomic force microscopy measurements, in contact mode, always moving the silicon tip over the surface of the sample. The samples were held by squishing part of them between half a coverslip and a glass slide. Immobilization was proved to be enough to avoid movement during AFM measurement of the exposed part of the scale. Special care was taken to maintain samples wet during the fixation and measurement processes. Both sides of each scale were examined, and areas for the external side were chose to provide a general overview of the surface, including parts of circuli in the rostral field (Figure 4a). Circuli were measured as shown in Figure 5a. Some areas close to the focus were also explored. In the internal side, two measurements were taken from the region close to the rim.

Acknowledgments

D.C.F. is grateful to the Spanish Ministry of Economy and Competitiveness (MINECO) for an F.P.I. fellowship (Grant No. BES-2015-074726). This work was supported by the MINECO (Grant No. AGL2014-51839-C5-1-R) co-funded by the European Regional Development Funds (ERDF/FEDER) and Fundación Seneca de la Región de Murcia (Grupo de Excelencia Grant No. 19883/GERM/15).

Author Contributions

M.A.E. and S.C. conceived and designed the experiments; D.C. and F.C. performed the experiments and analyzed the data; S.C. performed the AFM measurements; F.C. and M.A.E. wrote the paper.

Conflicts of Interest

The authors declare no conflict of interest.

References

  1. Food and Agriculture Organization (FAO). The State of World Fisheries and Aquaculture 2014; FAO: Rome, Italy, 2014; pp. 1–228. [Google Scholar]
  2. Groff, J.M. Cutaneous biology and diseases of fish. Vet. Clin. N. Am. 2001, 4, 321–411. [Google Scholar] [CrossRef]
  3. Magnadottir, B. Immunological control of fish diseases. Mar. Biotechnol. 2010, 12, 361–379. [Google Scholar] [CrossRef] [PubMed]
  4. Elliott, D.G. The Laboratory Fish; Otrander, G.K., Ed.; Academic Press: Millbrae, CA, USA, 2000; pp. 271–306. [Google Scholar]
  5. Vernerey, F.J.; Barthelat, F. Skin and scales of teleost fish: Simple structure but high performance and multiple functions. J. Mech. Phys. Solids 2014, 68, 66–76. [Google Scholar] [CrossRef]
  6. Vernerey, F.J.; Barthelat, F. On the mechanics of fish scale structures. Int. J. Solids Struct. 2010, 47, 2268–2275. [Google Scholar] [CrossRef]
  7. Hawkes, J.W. The structure of fish skin. I. General organization. Cell Tissue Res. 1974, 149, 147–158. [Google Scholar] [CrossRef] [PubMed]
  8. Ebensteina, D.; Calderon, C.; Troncoso, O.P.; Torres, F.G. Characterization of dermal plates from armored catfish Pterygoplichthys pardalis reveals sandwich-like nanocomposite structure. J. Mech. Behav. Biomed. Mater. 2015, 45, 175–182. [Google Scholar] [CrossRef] [PubMed]
  9. Sire, J.Y. From ganoid to elasmoid scales in the actinopterygian fishes. Neth. J. Zool. 1990, 40, 75–92. [Google Scholar] [CrossRef]
  10. Sire, J.Y.; Huysseune, A. Formation of dermal skeletal and dental tissues in fish: A comparative and evolutionary approach. Biol. Rev. 2013, 78, 219–249. [Google Scholar] [CrossRef]
  11. Yang, W.; Chen, I.H.; Gludovatz, B.; Zimmermann, E.A.; Ritchie, R.O.; Meyers, M.A. Natural Flexible Dermal Armor. Adv. Mater. 2013, 25, 31–48. [Google Scholar] [CrossRef] [PubMed]
  12. Bräger, Z.; Moritz, T. A scale atlas for common Mediterranean teleost fishes. Vertebr. Zool. 2016, 66, 275–386. [Google Scholar]
  13. Bartlett, J.D. Dental enamel development: Proteinases and their enamel matrix substrates. ISRN Dent. 2013, 2013, 684607. [Google Scholar] [CrossRef] [PubMed]
  14. Huysseune, A.; Sire, J.Y. Evolution of patterns and processes in teeth and tooth-related tissues in nonmammalian vertebrates. Eur. J. Oral Sci. 1998, 106, 437–481. [Google Scholar] [CrossRef] [PubMed]
  15. Sire, J.Y.; Akimenko, M.A. Scale development in fish: A review, with description of sonic hedgehog (shh) expression in the zebrafish (Danio rerio). Int. J. Dev. Biol. 2004, 48, 233–247. [Google Scholar] [CrossRef] [PubMed]
  16. Wainwright, D.K.; Lauder, G.V. Three-dimensional analysis of scale morphology in bluegill sunfish, Lepomis macrochirus. Zoology 2016, 119, 182–195. [Google Scholar] [CrossRef] [PubMed]
  17. Fauquet, B.M. Estructura y características de las escamas de Mullus barbatus (Linnaeus 1758) y Mullus surmuletus (Linnaeus 1758). Estudio al microscopio electrónico de barrido. Investig. Pesq. 1983, 47, 203–218. [Google Scholar]
  18. Szedlmayer, S.T.; Able, K.W.; Musick, J.A.; Weinstein, M.P. Are scale circuli deposited daily in juvenile weakfish, Cynoscion regalis? Environ. Biol. Fishes 1991, 31, 87–94. [Google Scholar] [CrossRef]
  19. Cerda-Reverter, J.M.; Haitina, T.; Schiöth, H.B.; Peter, R.E. Gene structure of the goldfish agouti-signaling protein: A putative role in the dorsal-ventral pigment pattern of fish. Endocrinology 2005, 146, 1597–1610. [Google Scholar] [CrossRef] [PubMed]
  20. Lazado, C.C.; Caipang, C.M. Probiotics-pathogen interactions elicit differential regulation of cutaneous immune responses in epidermal cells of Atlantic cod Gadus morhua. Fish Shellfish Immunol. 2014, 36, 113–119. [Google Scholar] [CrossRef] [PubMed]
  21. Cordero, H.; Mauro, M.; Cuesta, A.; Cammarata, M.; Esteban, M.A. In vitro cytokine profile revealed differences from dorsal and ventral skin susceptibility to pathogen-probiotic interaction in gilthead seabream. Fish Shellfish Immunol. 2016, 56, 188–191. [Google Scholar] [CrossRef] [PubMed]
  22. Cordero, H.; Ceballos-Francisco, D.; Cuesta, A.; Esteban, M.A. Dorso-ventral skin characterization of the farmed fish gilthead seabream (Sparusaurata). PLoS ONE 2017, 12, e0180438. [Google Scholar] [CrossRef] [PubMed]
  23. Chang, K.-C.; Chiang, Y.-W.; Yang, C.-H.; Liou, J.-W. Atomic force microscopy in biology and biomedicine. Tzu Chi Med. J. 2012, 24, 162–169. [Google Scholar] [CrossRef]
  24. Ushiki, T. Atomic Force Microscopy and Its Related Techniques in Biomedicine. Arch. Ital. Anat. Embriol. 2001, 106, 3–8. [Google Scholar]
  25. Combined AFM and Fluorescence Imaging of Cells. JPK Instruments Application Note. Available online: www.jpk.com/app-technotes-img/AFM/pdf/jpk-app-microtubules.14-2.pdf (accessed 10 January 2018).
  26. Gholami, Z.; Teimori, A.; Esmaeili, H.R.; Schulz-Mirbach, T.; Reichenbacher, B. Scale surface microstructure and scale size in the tooth-carp genus Aphanius (Teleostei, Cyprinodontidae) from endorheic basins in Southwest Iran. Zootaxa 2013, 3619, 467–490. [Google Scholar] [CrossRef] [PubMed]
  27. Louise Meyer, R.; Zhou, X.; Tang, L.; Arpanaei, A.; Kingshott, P.; Besenbacher, F. Immobilisation of living bacteria for AFM imaging under physiological conditions. Ultramicroscopy 2010, 110, 1349–1357. [Google Scholar] [CrossRef] [PubMed]
  28. Nowakowski, R.; Luckham, P.; Winlove, P. Imaging erythrocytes under physiological conditions by atomic force microscopy. Biochim. Biophys. Acta Biomembr. 2001, 1514, 170–176. [Google Scholar] [CrossRef]
  29. FAO. The State of World Fisheries and Aquaculture 2016; FAO: Rome, Italy, 2016; pp. 1–200. [Google Scholar]
  30. Vieira, F.A.; Gregorio, S.F.; Ferraresso, S.; Thorne, M.A.; Costa, R.; Milan, M.; Bargelloni, L.; Clark, M.S.; Canário, A.V.; Power, D.M. Skin healing and scale regeneration in fed and unfed sea bream, Sparus auratus. BMC Genom. 2011, 12, 49. [Google Scholar] [CrossRef] [PubMed] [Green Version]
  31. Ronald, J.R. Fish Pathology, 4th ed.; John Wiley & Sons: Hoboken, NJ, USA, 2012; pp. 1–581. [Google Scholar]
  32. Hernandez, K.; Copeland, T.; Wright, K. Quantitative Assessment of Scale Resorption in Migrating and Spawning Steelhead of the Snake River Basin. Trans. Am. Fish. Soc. 2014, 143, 1562–1568. [Google Scholar] [CrossRef]
  33. Bibler, B. Mechanism and Occurrence of Focal Scale Resorption among Chum Salmon (Oncorhynchus keta) of the North Pacific Ocean. Can. J. Fish. Aquat. Sci. 1989, 46, 1147–1153. [Google Scholar]
  34. Bereiter-Hahn, J.; Zylberberg, L. Regeneration of teleost fish scale. Comp. Biochem. Physiol. 1993, 105A, 625–641. [Google Scholar] [CrossRef]
  35. Ashley, P.J. Fish welfare: Current issues in aquaculture. Appl. Anim. Behav. Sci. 2007, 104, 199–235. [Google Scholar] [CrossRef]
  36. Arechavala-Lopez, P.; Sanchez-Jerez, J.P.; Bayle-Sempere, D.T.; Sfakianakis, G.; Somarakis, S. Discriminating farmed gilthead sea bream Sparusaurata and European sea bass Dicentrarchus labrax from wild stocks through scales and otoliths. J. Fish Biol. 2012, 80, 2159–2175. [Google Scholar] [CrossRef] [PubMed]
  37. Yedier, S.; Kontas, S.; Bostanci, D.; Polat, N. Otolith and scale morphologies of doctor fish (Garra rufa) inhabiting Kangal Balikli Cermik thermal spring (Sivas, Turkey). Iran. J. Fish. Sci. 2016, 15, 1593–1608. [Google Scholar]
  38. Poletti, G.; Orsini, F.; Lenardi, C.; Barborini, E. A comparative study between AFM and SEM imaging on human scalp hair. J. Microsc. 2003, 211, 249–255. [Google Scholar] [CrossRef] [PubMed]
  39. Ghosh, R.; Ebrahimi, H.; Vaziri, A. Non-ideal effects in bending response of soft substrates covered with biomimetic scales. J. Mech. Behav. Biomed. Mater. 2017, 72, 1–5. [Google Scholar] [CrossRef] [PubMed]
  40. Zhu, D.; Szewciw, L.; Vernerey, F.; Barthelat, F. Puncture resistance of the scaled skin from striped bass: Collective mechanisms and inspiration for new flexible armor designs. J. Mech. Behav. Biomed. Mater. 2013, 23, 30–40. [Google Scholar] [CrossRef] [PubMed]
  41. Vernerey, F.; Barthelat, F.; Musiket, K. Mechanics of fish skin: A computational approach for bio-inspired flexible composites. Int. J. Solids Struct. 2014, 51, 274–283. [Google Scholar] [CrossRef]
  42. Alves, R.M.; Pereira, B.F.; Pitol, D.L.; Senhorini, J.A.; Alcântara-Rocha, R.C.G.; Caetano, F.H. Scale morphology of Prochilodus lineatus with emphasis on the scale epithelium. Braz. J. Biol. 2012, 73, 44. [Google Scholar] [CrossRef] [PubMed]
  43. Arechavala-Lopez, P.; Fernandez-Jover, D.; Black, K.D.; Ladoukakis, E.; Bayle-Sempere, J.T.; Sanchez-Jerez, P.; Dempster, T. Differentiating the wild or farmed origin of Mediterranean fish: A review of tools for sea bream and sea bass. Rev. Aquac. 2013, 5, 137–157. [Google Scholar] [CrossRef]
  44. Izquierdo-Gómez, D.; Arechavala-Lopez, P.; Bayle-Sempere, J.T.; Sánchez-Jerez, P. Assessing the influence of gilthead sea bream escapees in landings of Mediterranean fisheries through a scale-based methodology. Fish. Manag. Ecol. 2017, 24, 62–72. [Google Scholar] [CrossRef]
  45. Rotllant, J.; Redruello, B.; Guerreiro, P.M.; Fernandes, H.; Canario, A.V.M.; Power, D.M. Calcium mobilization from fish scales is mediated by parathyroid hormone related protein via the parathyroid hormone type 1 receptor. Regul. Pept. 2005, 132, 33–40. [Google Scholar] [CrossRef] [PubMed]
  46. Aerts, J.; Metz, J.R.; Ampe, B.; Decostere, A.; Flik, G.; De Saeger, S. Scales Tell a Story on the Stress History of Fish. PLoS ONE 2015, 10, e0123411. [Google Scholar] [CrossRef] [PubMed] [Green Version]
  47. Adelman, I.R. Uptake of 4C-Glycine by Scales as an Index of Fish Growth: Effect of Fish Acclimation Temperature. Trans. Am. Fish. Soc. 1980, 109, 187–194. [Google Scholar] [CrossRef]
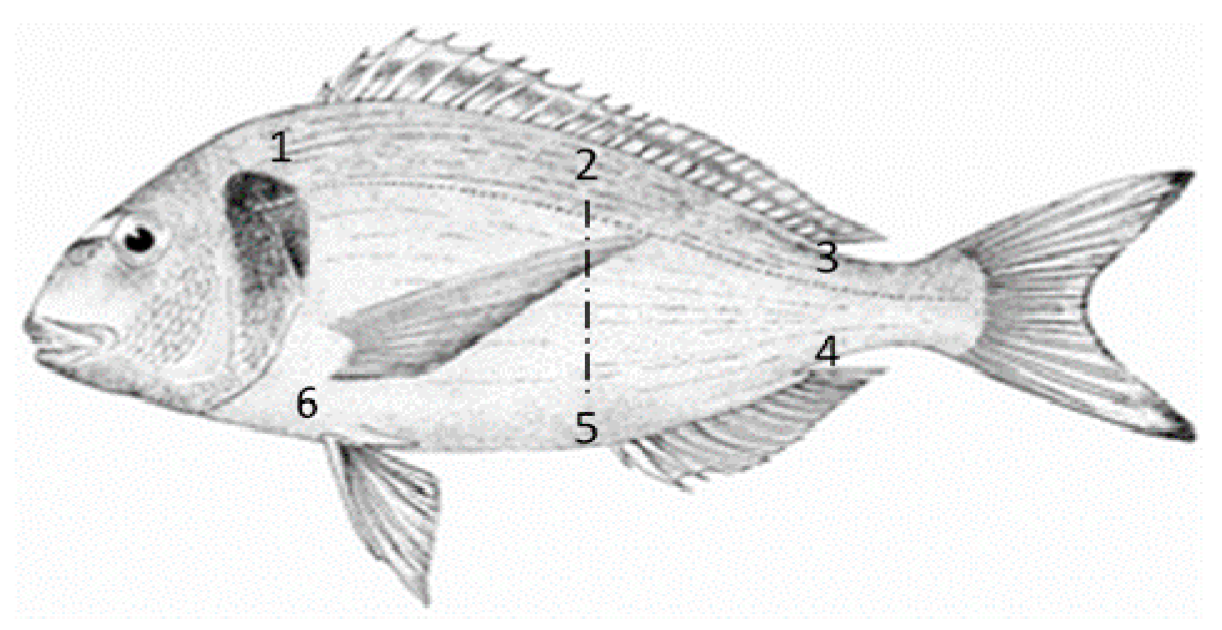
Figure 1. Scheme of the left side of a gilthead seabream specimen. Numbers represent the skin regions considered for scale extraction in the present study: 1 (operculum), 2 (dorsal), 3 (upper-peduncle), 4 (low-peduncle), 5 (anal), 6 (pectoral).
Fishes 03 00009 g001
Figure 2. (a) Optical images of representative scales from each region: 1 (operculum), 2 (dorsal), 3 (upper-peduncle), 4 (low-peduncle), 5 (anal), 6 (pectoral); (b) Gilthead seabream scale from this study, where length and width are labeled.
Fishes 03 00009 g002
Figure 3. (a) Average width of scales according to the region of the skin they were extracted from (1 (operculum), 2 (dorsal), 3 (upper-peduncle), 4 (low-peduncle), 5 (anal), 6 (pectoral). Non-coincident letters among regions indicate statistically significant differences according to a Tukey’s test (n = 5, p < 0.05); (b) Average size of the area of scales according to the region of the skin they were extracted from. The letter code indicates significance as previously described (n = 5, p < 0.05).
Fishes 03 00009 g003
Figure 4. Image of a representative gilthead seabream scale studied with atomic force microscopy (AFM). (a) Optical image of the rostral field of a scale from region 1, withthe black spike being the cantilever signaling the area about to be measured. (b) Map generated with AFM of the area under the cantilever in (a). (c) Topographic profile measured along the black line in B, where the height and length of the structures can be quantified.
Fishes 03 00009 g004
Figure 5. (a) Area of 50 µm2 of the rostral field of a scale of region 4 obtained by AFM. In one of the circuli, height has been measured through its extension (black lines) and the mean has been considered the mean height for circuli from region 4; (b) Graph showing the differences in the height of circuli. Significant differences occur when two regions do not share any letter (p < 0.05).
Fishes 03 00009 g005
Figure 6. (a) Map of the internal surface of a representative gilthead seabream scale; arrows point at the rifts that correspond to the impression of circuli from the other side. (b) Profile obtained along the white line in (a), where the depression caused by the presence of circuli from the other side can be appreciated.
Fishes 03 00009 g006