Article

Mugilids Display Distinct Trait-Mediated Patterns with a Reinvasion of Para Grass Urochloa mutica in a Tropical Estuary

by
Troy S. Sakihara
1,*,
Atsuko Fukunaga
2,† and
Kimberly A. Peyton
2
1
Division of Aquatic Resources, Department of Land and Natural Resources, State of Hawaii, 75 Aupuni Street Room 204, Hilo, HI 96720, USA
2
Division of Aquatic Resources, Department of Land and Natural Resources, State of Hawaii, 1039 Sand Island Parkway, Honolulu, HI 96819, USA
*
Author to whom correspondence should be addressed.
Present Address: Joint Institute for Marine and Atmospheric Research, University of Hawaii at Manoa, Honolulu, HI 96822, USA.
Submission received: 21 April 2017 / Revised: 18 May 2017 / Accepted: 18 May 2017 / Published: 23 May 2017

Abstract

:
Aggressive invasions by species such as para grass Urochloa mutica (Forssk.) are pervasive throughout the tropics, but the impacts on estuarine habitats and biota are poorly understood. After weed control was reduced in a tropical estuary, U. mutica reinvaded this area composed of two contiguous habitats: a shallow pond and a deeper river. These habitats are especially important for Mugil cephalus, a culturally prized native mullet, and introduced Moolgarda engeli not targeted in the fishery. We investigated the potential impacts of U. mutica on juvenile and adult mullets by comparing the catch per unit effort (CPUE) of the two mullet species and the physiochemical measurements from the two contiguous habitats during different stages of its reinvasion. Overall, negative effects on the CPUE of M. cephalus and M. engeli were found as a result of the U. mutica reinvasion. The M. cephalus CPUE was consistently higher in the shallow pond habitat compared to the deeper river habitat. It decreased after U. mutica was established, correlative to the invasive grass canopies smothering the shallow habitat favored by juveniles. The M. engeli CPUE significantly declined during the initial periods of U. mutica reinvasion, but did not decline further after the grass became established. No differences in the M. engeli CPUE between habitats were found, indicating that M. engeli are habitat generalists. These findings are among the first in an insular tropical estuary demonstrating a negative relationship between an invasive grass and relative abundances of two confamiliar fish, while revealing distinct patterns attributed to species-specific traits. Importantly, the broad overlapping biogeographic distribution of M. cephalus and U. mutica, and the negative relationship between these species, raises widespread concern for this mullet as a globally important fisheries species.

1. Introduction

Coastal and inland fish interact with aquatic plants, especially habitat-forming plant species. Vegetated habitats, overall, have been shown to support higher densities of fish than open habitats, because aquatic plants provide ecological services that benefit fish, and thus the productivity of fisheries [1,2,3]. In particular, vegetated aquatic habitats improve the water quality by releasing photosynthetically-derived oxygen, trapping sediments and stabilizing banks [4,5,6], and support communities of macroinvertebrates and periphyton that are important in fish diets [7]. However, in cases where the aquatic plant is an exotic species, challenges arise for the conservation of biological diversity, environmental policy, and fisheries management. Introduced macrophytes compete in new ecosystems to the extent that exotic plants routinely displace those which are native, reducing plant diversity and richness [8], while potentially altering ecosystem processes [9]. After native vegetation is outcompeted, it is critical to understand whether the invasive plant provides ecological services that benefit fish populations in the recipient communities or whether the systems are degraded by the introduced aquatic plant.
Previous studies on aquatic plant invasions have primarily focused on freshwater habitats, highlighting the complexity of factors that contribute to the success and effects of such invasions [10,11]. For example, dense canopies of the grass family Poaceae have been shown to reduce fish abundances, richness, species diversity, and habitat availability in the Neotropics [12,13]. Significant changes in habitat complexity and structure caused by invasive macrophytes have also been shown to affect the behavior of freshwater game fish by reducing their foraging efficiency [14,15]. In addition, canopies of invasive macrophytes can cause significant reductions in water flow, open water, and light availability, thus leading to lower dissolved oxygen levels, reduced periphytic production, and an altered trophic structure [16]. Yet, others have reported a lack of effects by macrophytic invasions on freshwater faunal communities in the tropics [17,18,19,20], confirming that the biological effects from macrophytic invasions are condition-specific, species-specific, and variable among recipient communities. In estuarine habitats, however, these types of invasive plant-animal interactions are understudied.
Invasive aquatic plants that negatively affect native fish possess traits such as allelopathy, phenotypic plasticity, and rapid growth that results in dense, monospecific canopies [10]. Found in both freshwater and estuarine habitats, para grass Urochloa mutica (Forssk.) TQ Nguyen is a semi-aquatic species that possesses these invasive plant traits. Urochloa mutica aggressively invades lowland areas, storm canals, wetlands, streams, estuaries, and other low energy habitats throughout many tropical regions including northern Australia, coastal Asia, southeastern North America [21,22,23], and many Pacific Islands, including Hawaii [24,25,26,27,28]. In particular, the salinity tolerance of U. mutica [29] and its proliferation in calm waters with especially fast-spreading fronts [30,31] put warm water estuaries at risk because it commonly displaces native vegetation.
Estuaries are highly productive ecosystems that serve critical ecological functions and services [32], including the provision of a habitat for recreationally, commercially, and ecologically important species [33], nursery areas for juvenile fishes [34], and passageways for amphidromous species [35,36]. One species that uses estuaries throughout its cosmopolitan range, particularly in shallow habitats, is the piscine herbivore striped mullet Mugil cephalus Linnaeus, 1758, [37,38,39]. This species is prized as a sport fish and food fish [40], as well as being highly esteemed for its historical and cultural value in Hawaii [41].
The M. cephalus population in Hawaii now co-occurs with an invasive mullet known as kanda mullet Moolgarda engeli (Bleeker, 1858). Although M. engeli was unintentionally introduced to Hawaii in 1955, this species has successfully established in estuaries statewide [42,43] and has surpassed M. cephalus in numerical abundance [41]. Both of these mullet species primarily graze on microphytobenthos that is prolific in shallow open habitats. Therefore, if such habitats become limited, competition for both food and habitats between these mullet species may increase [43,44]. M. engeli has displayed, however, more generalist traits by readily feeding on a broader variety of algae [45], and it is apparent that the invasive mullet is free of fishing pressure due to their smaller size and lower commercial value. This translates to the invasive mullet population having at least two competitive advantages over the native mullet population in Hawaii.
Hawaii’s Division of Aquatic Resources (DAR) conducted a bimonthly mullet monitoring program using cast-nets (0.6 cm and 1.0 cm meshes) between 2005 and 2014 (see Section 4.3 for details), and observed a U. mutica reinvasion within the sampling site that consisted of a shallow estuarine pond, Waiakea Public Fishing Area (PFA), and a deeper connected estuarine river, Wailoa River, in Hilo, HI, USA (Figure 1). Previously, invasive vegetation along the banks of the sampling site was regularly controlled with herbicide and trimming, but these efforts were reduced due to logistical and funding constraints ca. 2007. Based on the observations recorded by DAR staff, we determined that at the sampling site, U. mutica was rare at the land-water interface prior to September 2007 (invasion status: “pre-invasion”). Some rooted canopies (Figure 2) of U. mutica invaded the shoreline of the site between September 2007 and March 2010 (invasion status: “detected”), followed by an expansion of rooted canopies into floating canopies and drifting mats (Figure 2) after May 2010 (invasions status: “established”). Further, the expansion rates and its invasion potential (based on the bathymetric characteristics of the estuary and habitat preference of U. mutica) were notably different between these estuarine habitats, with the shallower Waiakea PFA experiencing a faster and more extensive invasion compared to the deeper Wailoa River (Figure 1, Table S1, Figure S1).
Here, we examined a reinvasion of U. mutica in a Hawaiian estuary—a critical habitat for both juvenile and adult M. cephalus and M. engeli—to understand the invasive plant’s effects, and any potentially associated effects, on the relative abundance of both mullet species. To examine if U. mutica affected the mullet abundance in shallow water, we used the nine-year catch-per-unit-effort data set that serendipitously monitored the relative abundance of M. cephalus and M. engeli, as well as physiochemical characteristics, every two months inside the Waiakea PFA and Wailoa River during three periods of the reinvasion: pre-invasion (U. mutica rare); detected (some rooted canopies present); and established (rooted canopies, floating canopies, drifting mats present). As an introduced species that is widely established throughout the Hawaiian Islands, we hypothesized that M. engeli, as juveniles and adults, would be a habitat generalist and therefore not have any detectable response to the reinvasion of U. mutica. In contrast, because shallow water is both the preferred habitat by M. cephalus and highly susceptible to invasion by U. mutica, we hypothesized that the overgrowth of dense canopies of invasive grass would negatively affect M. cephalus, especially as juveniles. From this investigation, we intend to provide insight into the biological and physical effects of aquatic grass invasions in tropical estuaries and its repercussions on inhabiting native fishes and supported fisheries.

2. Results

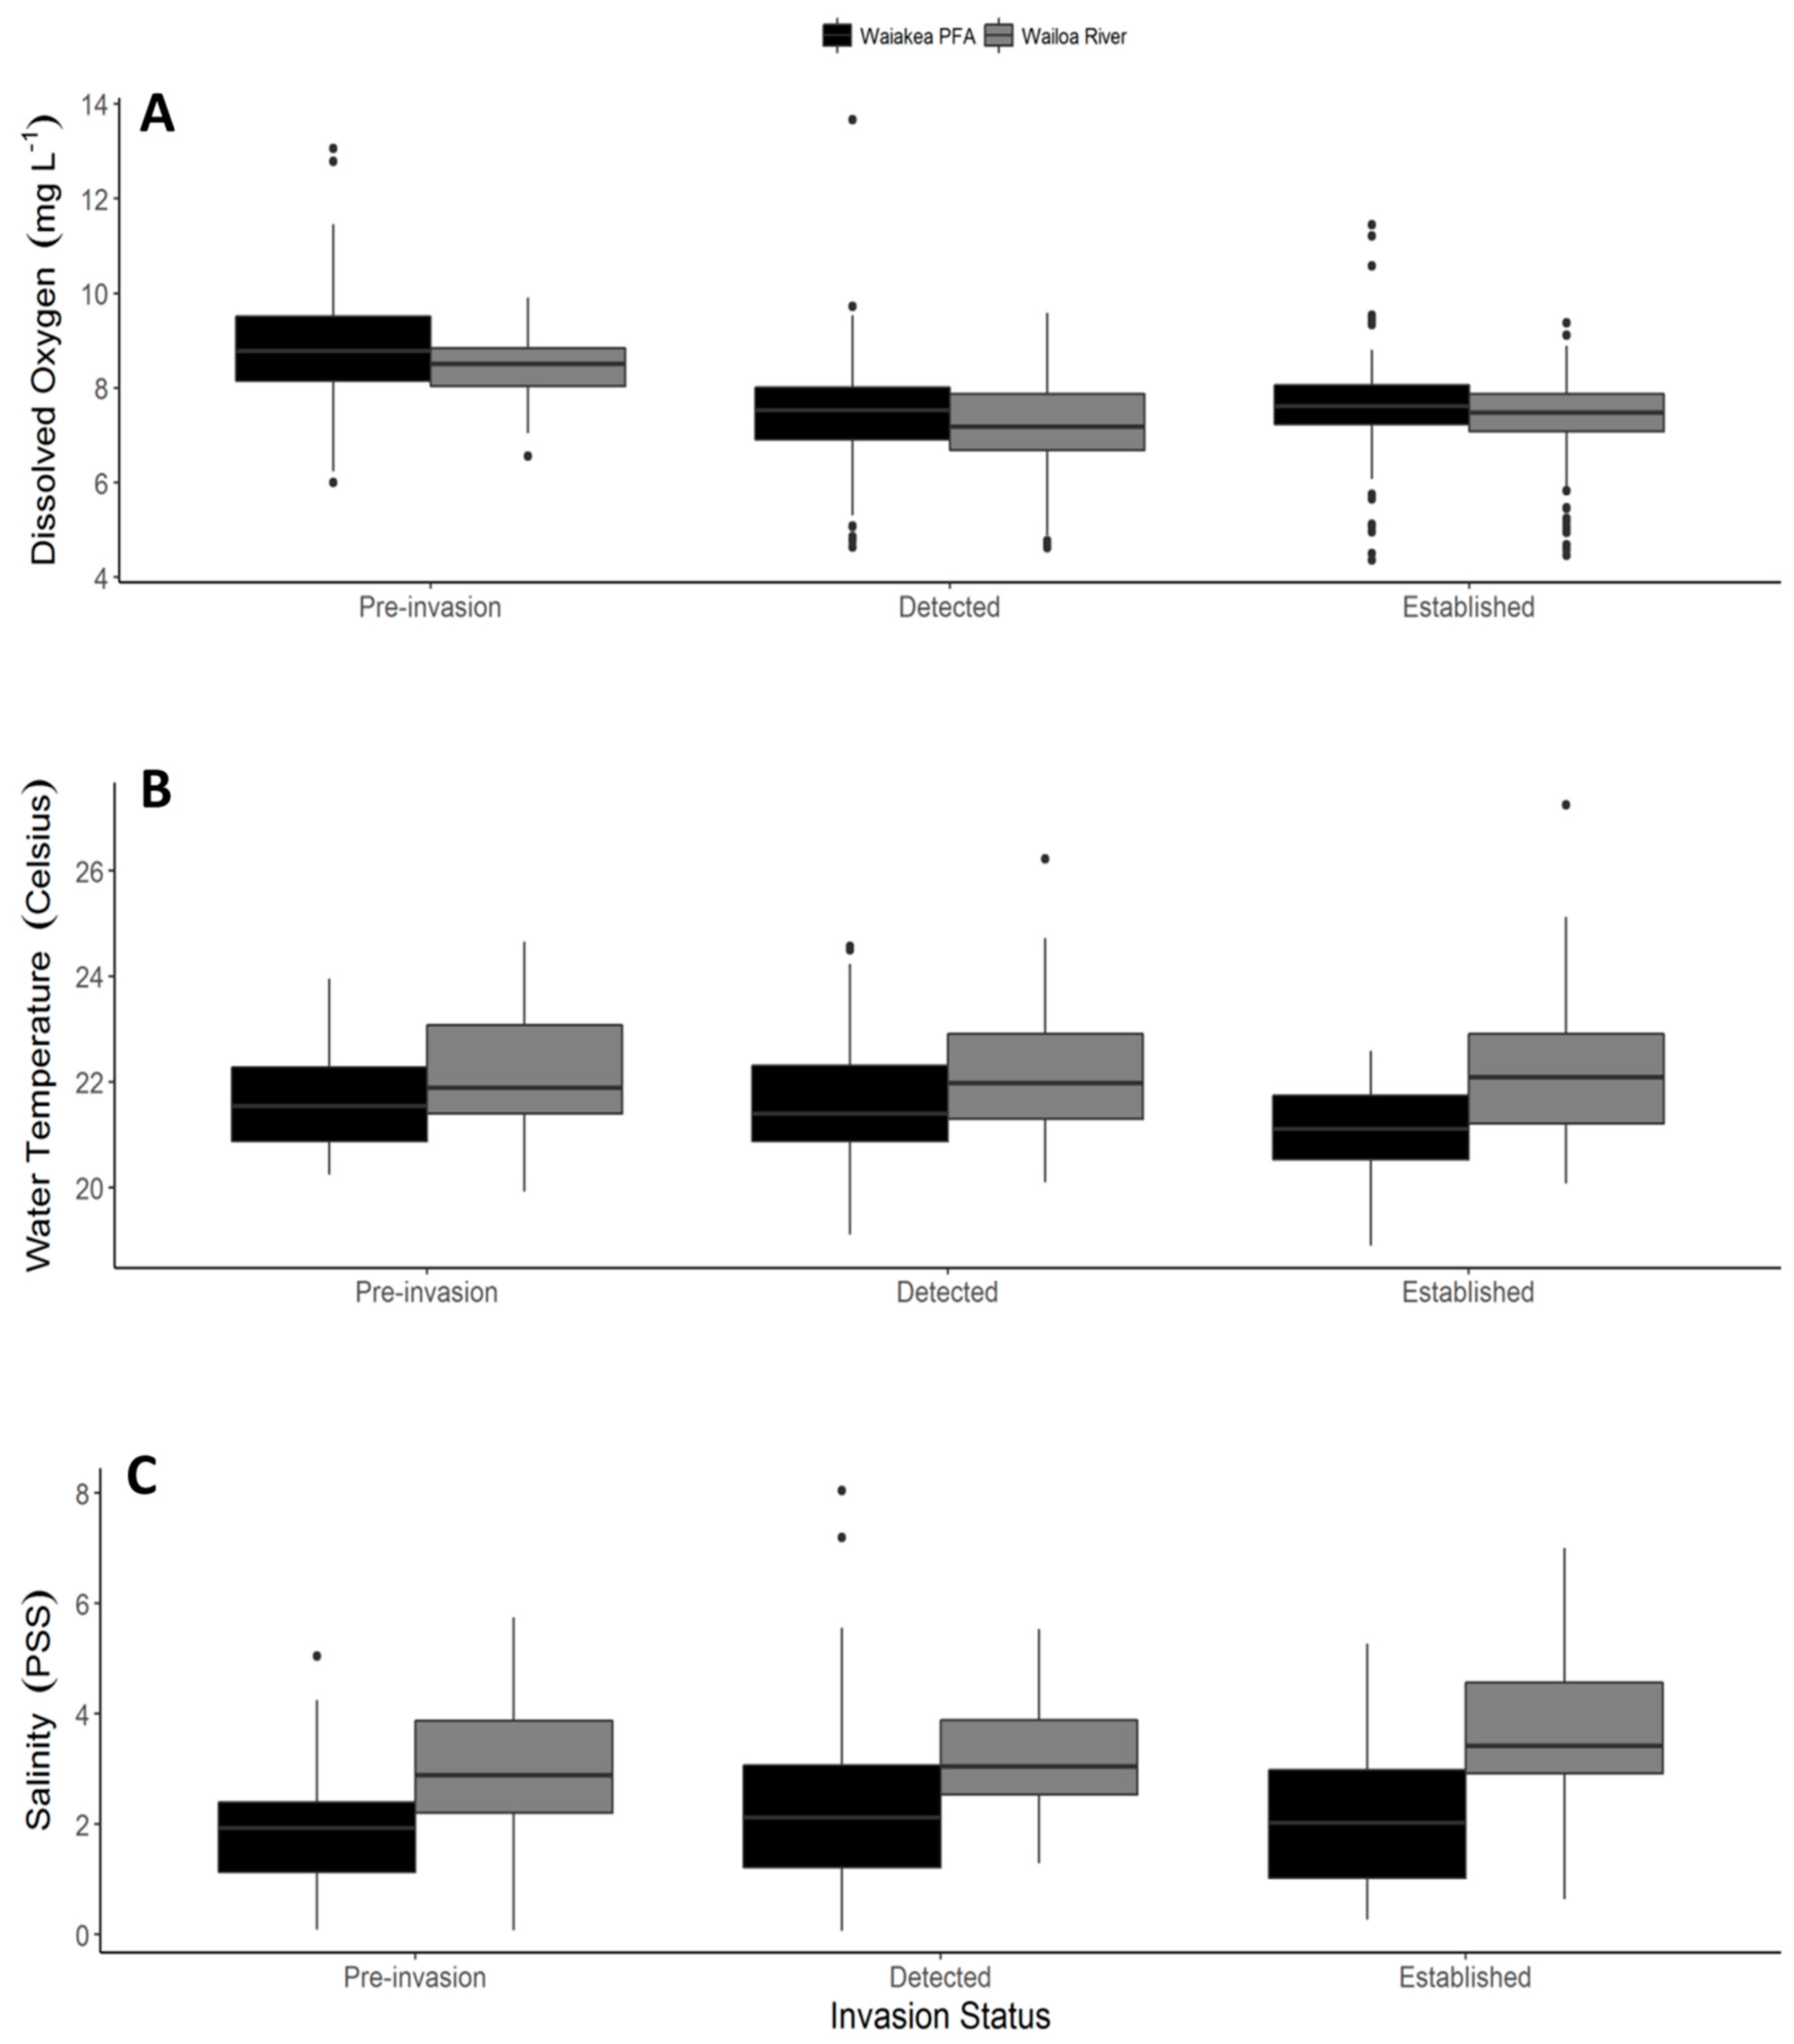
2.1. Shoreline Physiochemical Characteristics

Dissolved oxygen (DO) concentrations (mg L−1) were significantly different across invasion statuses (Table 1). Specifically, DO was significantly higher during the pre-invasion period compared to either the detected or established period (pairwise comparisons, p < 0.02, Figure 3A). In addition, DO concentrations were significantly higher throughout sampling stations in Waiakea PFA compared to Wailoa River (Table 1). In Waiakea PFA, the average DO (± standard error ‒ SE) was 8.87 ± 0.19 mg L−1 during pre-invasion, 7.46 ± 0.12 mg L−1 during the detected period, and 7.61 ± 0.13 mg L−1 during the established period. In Wailoa River, the DO averaged 8.44 ± 0.10 mg L−1 during pre-invasion, 7.16 ± 0.11 mg L−1 during the detected period, and 7.33 ± 0.09 mg L−1 during the established period. No significant interaction effect was found between the habitat and invasion status on DO concentrations.
A significant interaction effect between the habitat and invasion status was found for water temperature (Table 1). Water temperature in Waiakea PFA decreased by an average (±SE) difference of 0.63 ± 0.13 °C from pre-invasion to established periods, whereas the water temperature in Wailoa River was notably more stable, with an average difference of −0.002 ± 0.16 °C during the same periods. Further, the water temperature was consistently lower in Waiakea PFA (21.42 ± 0.06 °C) than in Wailoa River (22.14 ± 0.07 °C) (Figure 3B). Salinity (Practical Salinity Scale ‒ PSS) was also significantly different between the habitats. In particular, salinity was consistently and significantly higher in Wailoa River than in Waiakea PFA (Table 1, Figure 3C). In Wailoa River, salinity averaged 3.3 ± 0.08 PSS, whereas in Waiakea PFA, salinity averaged 2.12 ± 0.09 PSS. No main effect from the invasion status or interaction effects were found on salinity.

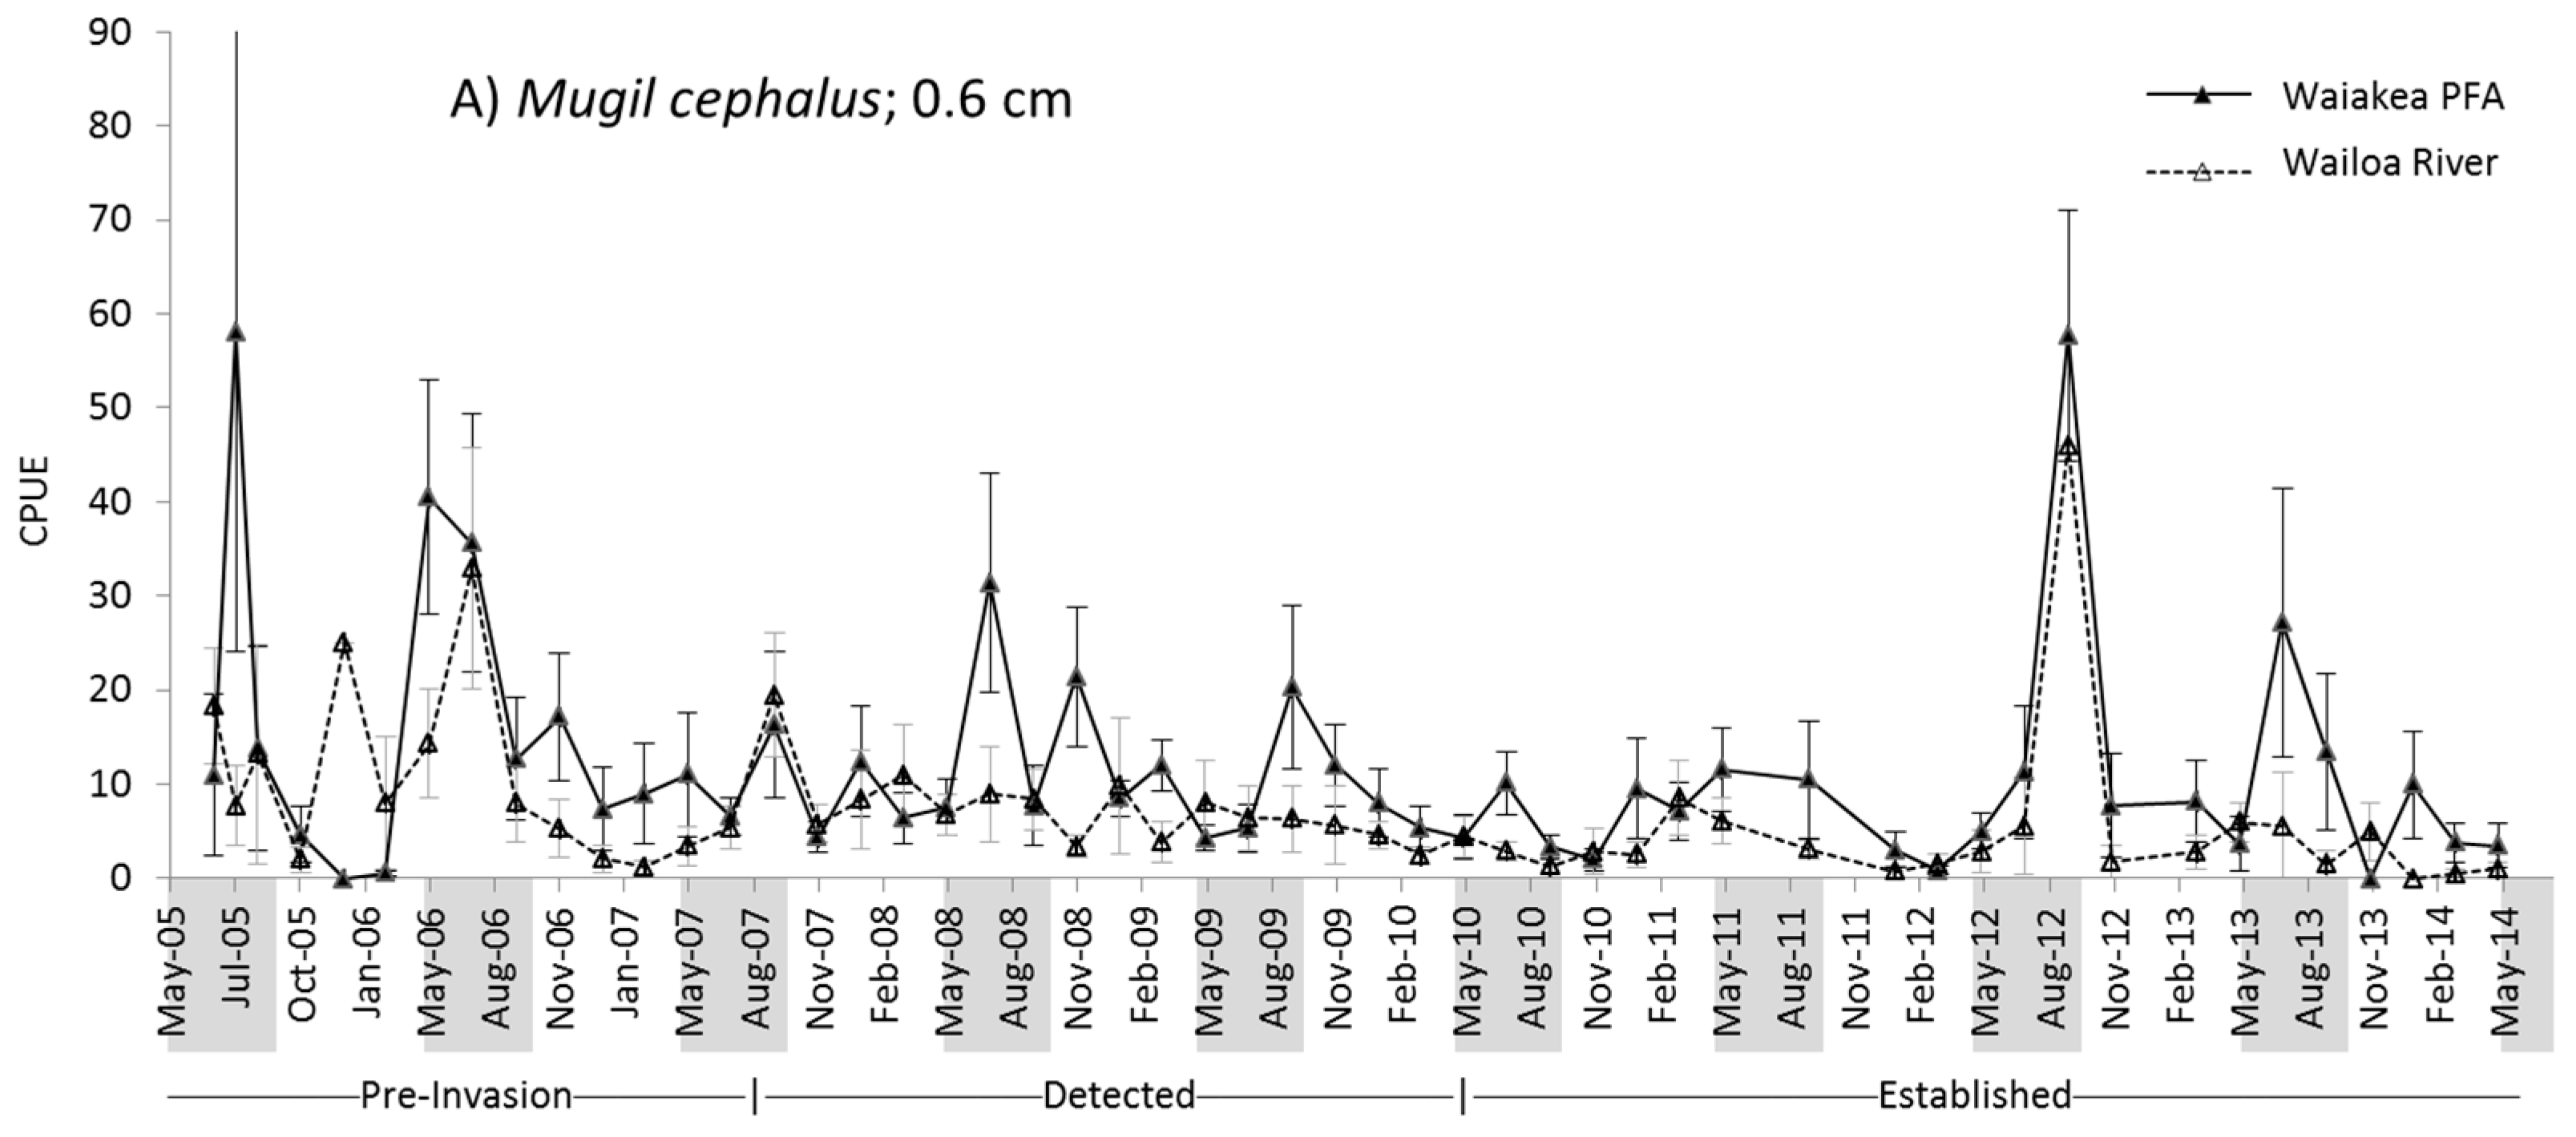
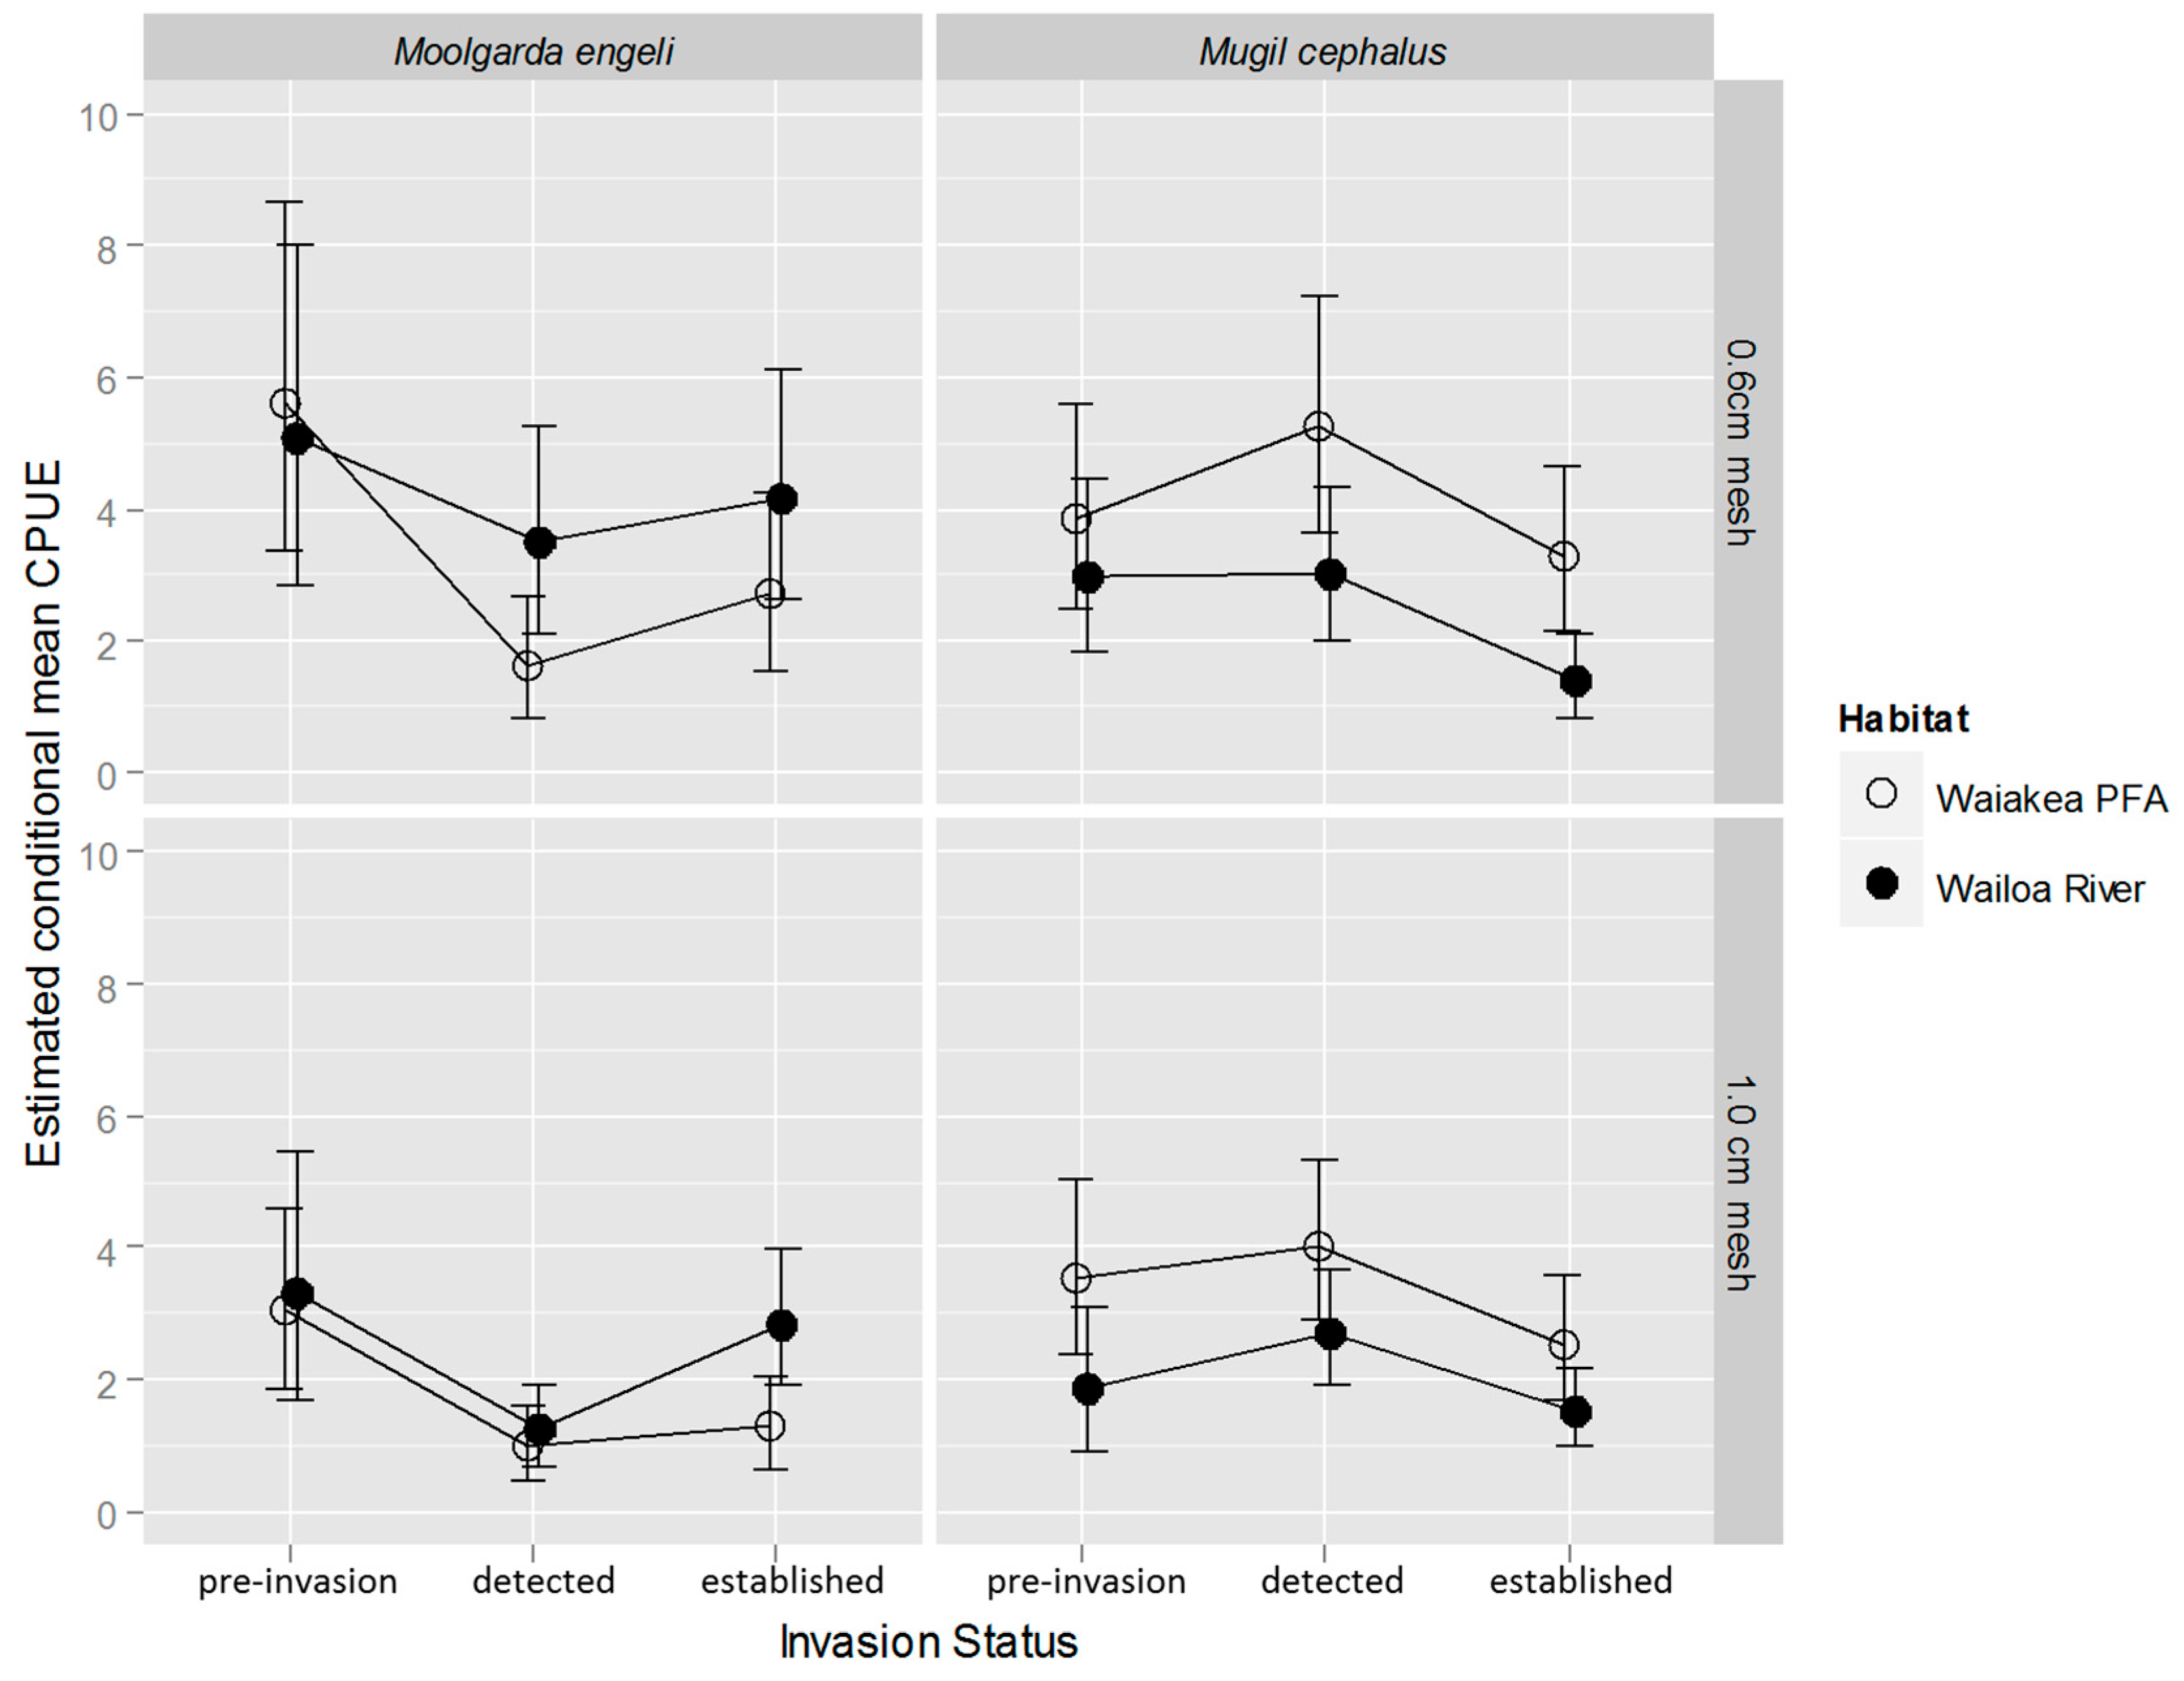
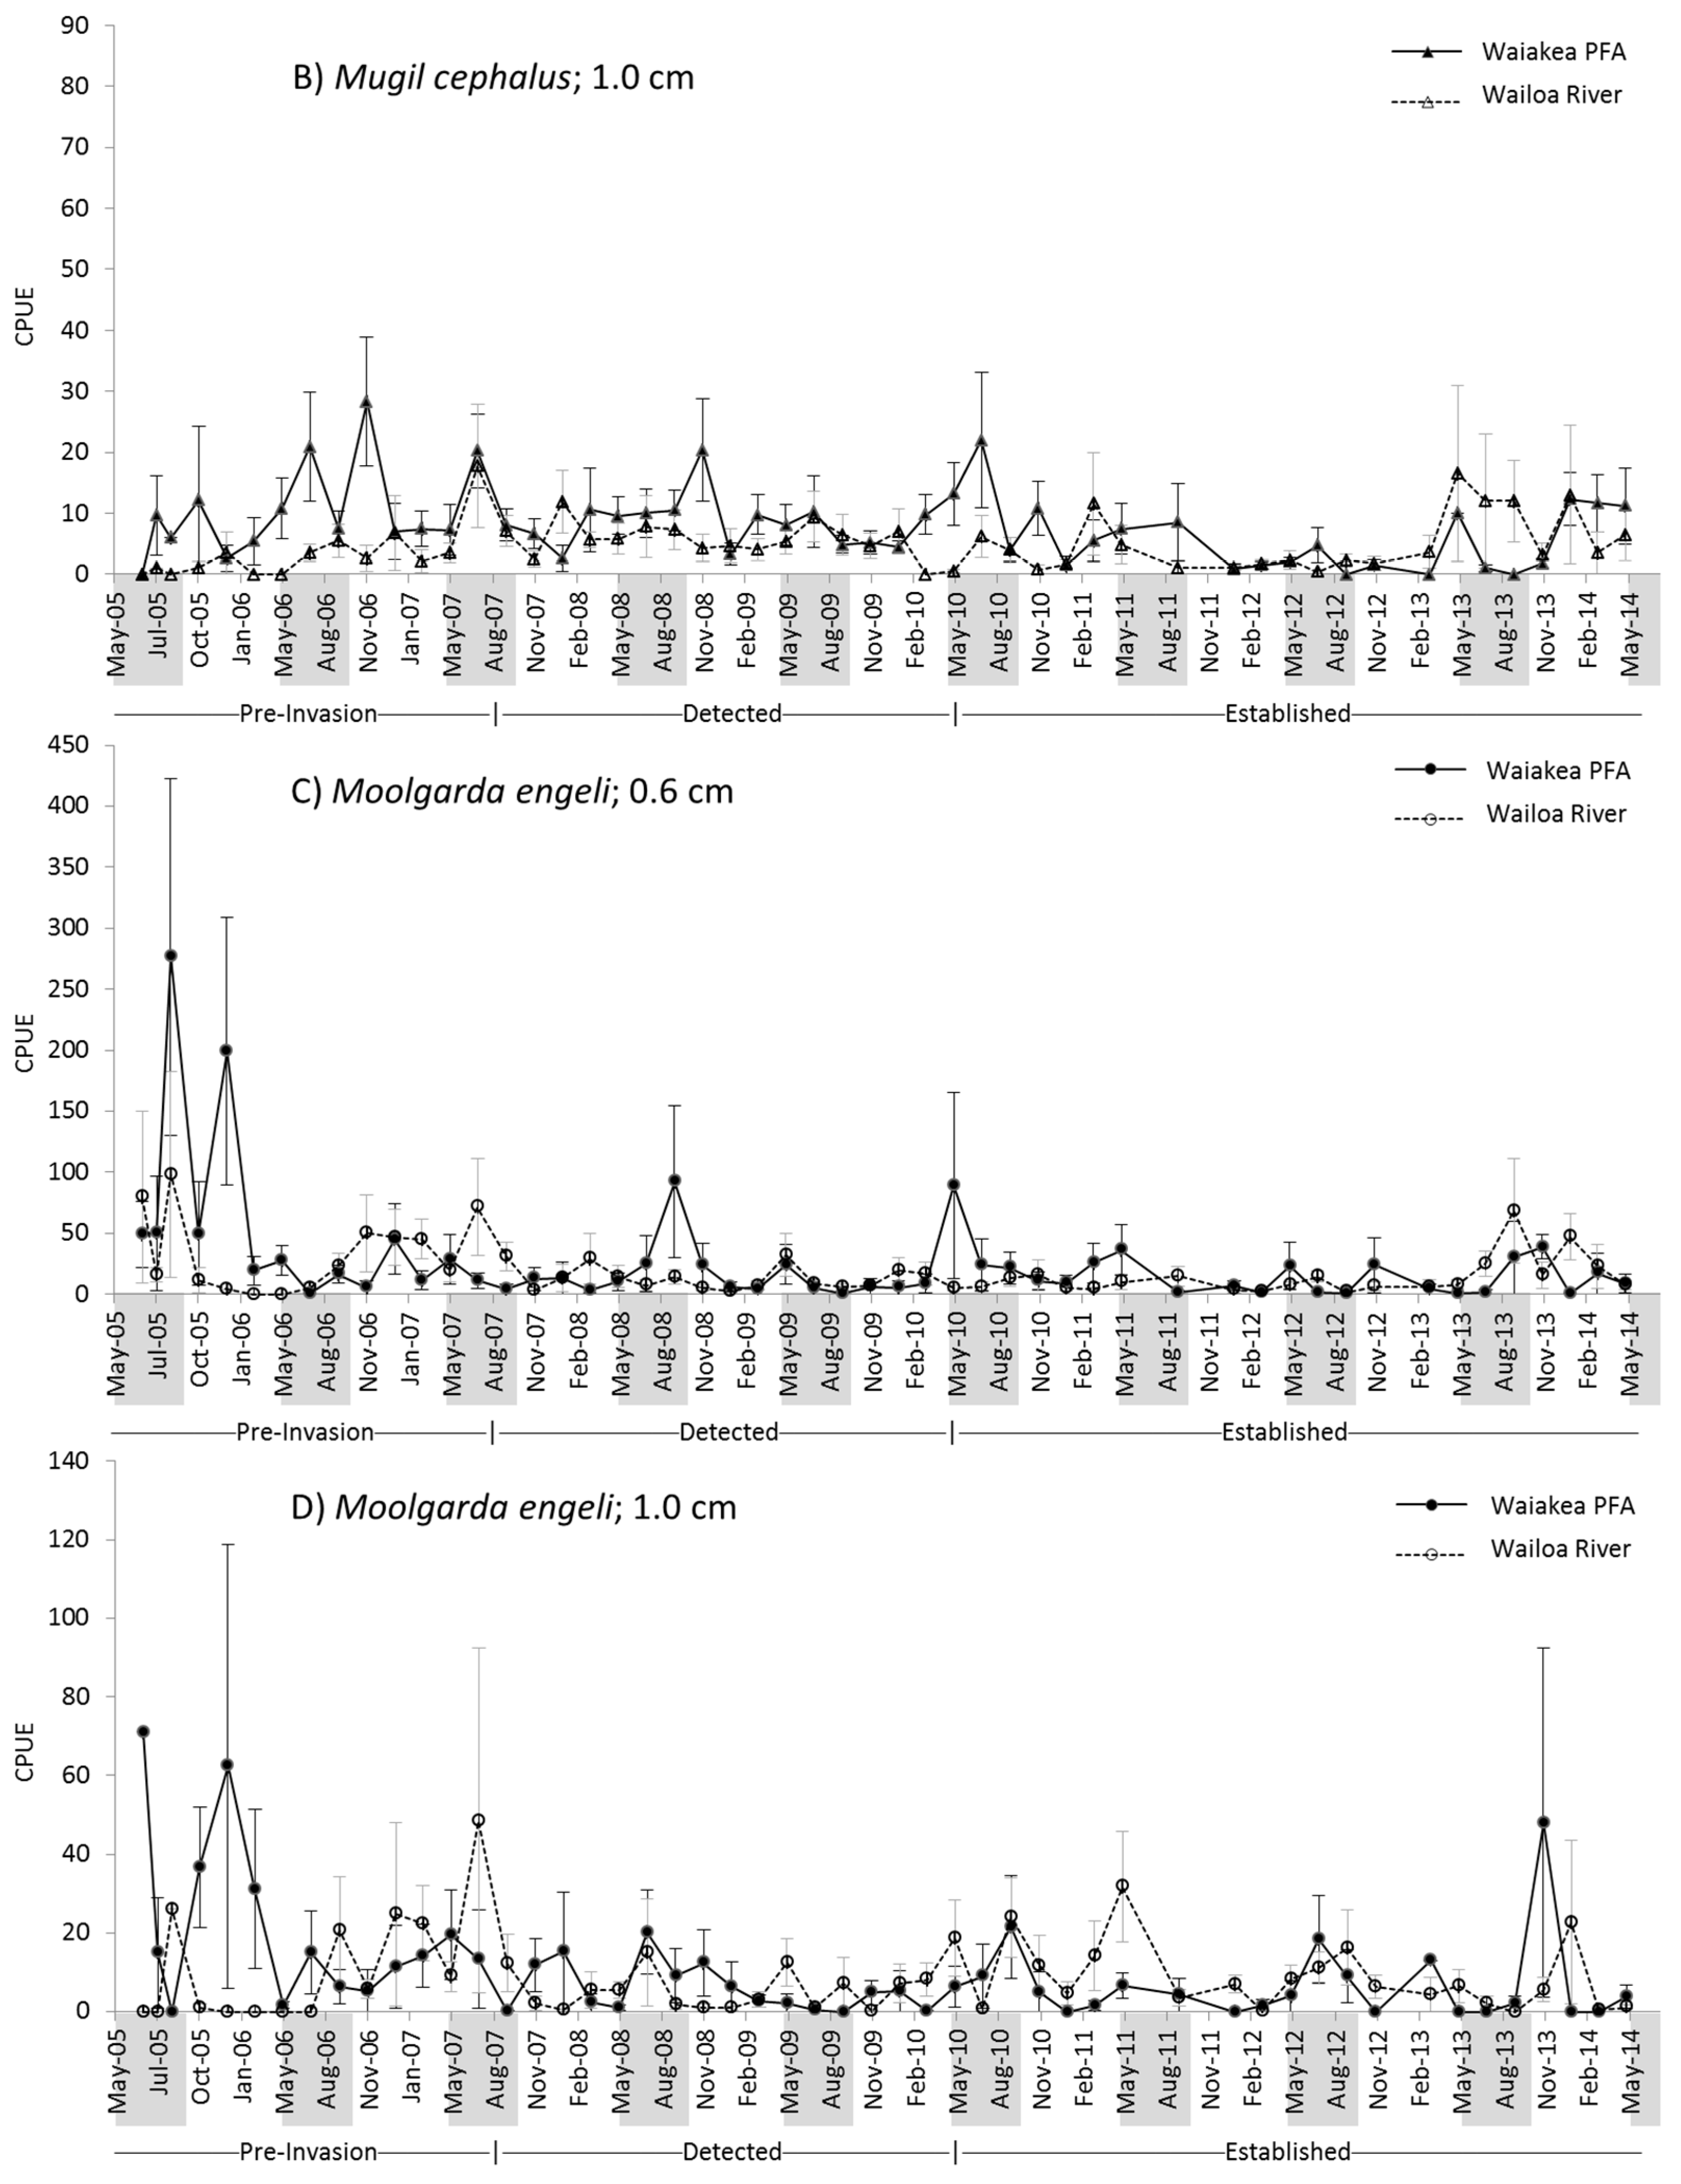
2.2. M. cephalus Catch per Unit Effort (CPUE)

For M. cephalus young-of-year (YOY) and smaller juveniles (0.6 cm mesh cast-net samples), temporal variability explained the greatest variation in the log-transformed CPUE, followed by the habitat and invasion status (Figure 4). Generally, the M. cephalus CPUE was greater during late spring and summer sampling periods (Figure 5A). After controlling for the effects of invasion status and temporal variability, the mean CPUE was 1.7 (habitat effects, 95% confidence interval—CI = 1.3–2.2) times higher in the estuarine pond habitat (Waiakea PFA) than in the estuarine river habitat (Wailoa River). For the entire study site, the conditional mean CPUE was relatively stable from the pre-invasion status to the detected period (initial invasion effects 1.22, 95% CI = 0.75–1.89), but decreased from the detected period to the established period (post-invasion effects 0.56, 95% CI = 0.35–0.85).
The importance of temporal variability was reduced when the CPUE of larger juveniles and adults were examined (1.0 cm mesh cast-net samples), with the habitat explaining the greatest variation, followed by the invasion status and temporal variability (Figure 4 and Figure 5B). Overall, the mean CPUE was 1.7 (95% CI = 1.2–2.3) times higher in Waiakea PFA than Wailoa River. There was no strong evidence for changes in the conditional mean CPUE from the pre-invasion status to the detected period (initial invasion effects 1.31, 95% CI = 0.86–1.96), but it decreased from the detected period to the established period (post-invasion effects 0.61, 95% CI = 0.42–0.86).
The estimated mean CPUE based on the habitat and invasion status effects confirmed these patterns, showing a consistently higher CPUE in Waiakea PFA than Wailoa River for both 0.6 and 1.0 mesh-size nets throughout all periods of the grass reinvasion and clear decreases from the detected to established periods in both habitats (Figure 6). Further, patterns in the CPUE were consistent across invaded and uninvaded areas of Waiakea PFA and Wailoa River, reflecting the overall CPUE characteristics in these habitats, respectively.

2.3. M. engeli CPUE

For M. engeli YOY and smaller juveniles (0.6 cm mesh cast-net samples), the invasion status and temporal variability were the most important factors in explaining the variation in the log-transformed CPUE (Figure 4). Like M. cephalus, the M. engeli CPUE was generally greater during late spring and summer sampling periods (Figure 5C). After controlling for the effects of habitat and temporal variability, the conditional mean CPUE decreased from the pre-invasion to detected periods (initial invasion effects 0.47, 95% CI = 0.27–0.75), but there was no strong evidence for changes in the CPUE from the detected to established periods (post-invasion effects 1.43, 95% CI = 0.86–2.27). In addition, the variance component associated with the interaction effects between the habitat and sampling period was relatively high, showing habitat effects that were not consistent from one sampling period to another.
Similar to M. cephalus, the importance of temporal variability was reduced when the CPUE values of larger juveniles and adults (1.0 cm mesh cast-net samples) were considered, with the invasion status explaining the greatest variation in the log-transformed CPUE of M. engeli (Figure 4 and Figure 5D). The conditional mean CPUE decreased from the pre-invasion to detected periods (initial invasion effects 0.36, 95% CI = 0.21–0.58) and then increased from the detected to established periods (post-invasion effects 1.82, 95% CI = 1.11–2.85).
The estimated mean CPUE based on the habitat and invasion status effects showed clear decreases in the conditional CPUE from the pre-invasion to detected periods for both mesh-sizes (Figure 6). Although the 95% credible intervals were relatively wide, the model also showed, on average, a higher CPUE from the 0.6 mesh-size nets in the estuarine river habitat than the pond habitat during the detected and established periods. The increase in the mean CPUE from the detected to established period for the 1.0 cm mesh-size was, on average, larger in the river habitat than the pond habitat.

3. Discussion

We demonstrated that while the relative abundances of M. cephalus and M. engeli decreased with the unconstrained spread of U. mutica in an insular tropical estuary, the two mullet species displayed distinct patterns with the reinvasion. On one hand, U. mutica negatively impacted the nursery habitat for M. cephalus, a valued gamefish; on the other hand, there was a more nuanced plant-animal interaction with M. engeli, an accidental introduction to Hawaiian waters. Specifically, with M. cephalus showing a strong preference for shallow water—consistent with previous findings [46,47,48,49]—the CPUE of this game fish decreased during the spread of U. mutica (detected to established period). Importantly, this result was consistent for both the YOY/larger juveniles and adults sampled. In contrast, all sizes of M. engeli displayed a more immediate reduction in CPUE from the onset of the U. mutica reinvasion, while larger juveniles and adults later displayed an increase in CPUE, despite U. mutica becoming established in the estuary.
Previous studies that examined the impacts of invasive macrophytes arrived at conflicting conclusions. Perna et al. [50] and Carniatto et al. [12] showed indiscriminate reductions in fish abundances and richness caused by exotic plant invasions. This, however, is not always the case, as others report a lack of effects, negative or positive, across aquatic faunal communities [17,18,19,20]. Our results partially agree with both of these conclusions because the U. mutica reinvasion response was species-specific, with M. cephalus experiencing a more clearly defined reduction in relative abundance, while M. engeli displayed a more size-specific interaction.

3.1. M. cephalus

As a well-studied food fish, M. cephalus recruits are known to prefer shallow habitats in estuaries [46,47,48,49]. In addition, smaller juvenile fishes have been shown to be in greater abundance in low-gradient shallow habitats along banks compared to altered shorelines where habitat gradients are steeper and more abrupt [51]. Consistent with this, the CPUE of the M. cephalus sampled with both 0.6 and 1.0 cm mesh nets was higher in Waiakea PFA, where the shallow habitat gradient is low and extensive relative to Wailoa River. The shallow, sheltered waters of Waiakea PFA also supported the growth of extensive canopies of U. mutica because its floating stolons grow well in this type of habitat [52]. Understanding the mutual habitat requirements of both M. cephalus and U. mutica, which is detrimental to this mullet species, is critical for the management of this important fishery. In addition, extensive areas of shallow water in Waiakea PFA have a high probability for the expansion of U. mutica (Figure 1), meaning that if growth continues unrestrained, this fishery resource is expected to diminish further as a result.
Using monitoring data, albeit long-term, and the biased sampling design to assess this plant-animal interaction means that determining causal agents is speculative for this study. Nevertheless, there are several plausible explanations for the negative interaction, primarily because U. mutica canopies are known to broadly degrade aquatic habitats [22,53]. For example, floating canopies observed during the established period may alter the foraging of M. cephalus because shallow water provides one of their primary food sources, microphytobenthos (MPB). Within the study area, the shallow-water diatom Melosira moniliformis [54] makes up the majority of the MPB, as well as the gut composition of the M. cephalus population under study [45]. Dense canopies of floating macrophytes, such as those formed by U. mutica, intercept light resulting in diminishing MPB, and in particular, M. moniliformis. Water depth influences light attenuation and, consequently, biofilm growth [55]. Therefore, deeper parts of the estuary are expected to have reduced MPB standing biomass relative to shallower areas that characteristically receive more photosynthetically active radiation. For this reason, we hypothesized that deep-water habitats in estuaries are less suitable for foraging by M. cephalus. This was supported by the lower abundances of juveniles and adults found in Wailoa River throughout the nine-year study. In addition, visual observations in deeper parts of the study site away from the shoreline have indicated notably fewer occurrences of juvenile mullets, particularly M. cephalus.
In addition to shading, the established period of U. mutica invasion, characterized by thick floating canopies, may leave juvenile M. cephalus vulnerable to predation. Although many plant species provide a habitat complexity that can be used as refuge from predation, an especially important function in nursery areas [56,57], U. mutica forms dense and nearly impenetrable canopies [24,50], and is known to be a less favorable habitat for native fishes [58]. This canopy structure may force juvenile mullet to use deeper water along the vegetation front of U. mutica, which exposes the juveniles to higher predation than in shallower water—similar to the effects of an armored shoreline [51]. Yet, this valid hypothesis remains to be tested.
Bunn et al. [53] described the altered ecosystem function and benthic communities associated with the reduced water quality and habitat caused by U. mutica. The monospecific canopies of U. mutica are also linked to degraded water quality through several mechanisms [21,22,23,24,27,28,59]. In addition to reduced MPB, the food availability and conditions of the benthic habitat may be further exacerbated by the high plant standing crop of U. mutica that contributes excessive amounts of organic material to the aquatic systems, leading to the decomposition of that material by bacteria that have high oxygen demands. Hyland [60] noted persistently low levels of dissolved oxygen (<2 ppm) in shallow wetland habitats dominated by U. mutica, resulting in conditions that can be stressful for fish. Our results align with these findings as measureable decreases in DO in Waiakea PFA and Wailoa River were found after the reinvasion of U. mutica. Therefore, M. cephalus may be negatively affected by this invasive plant, contributing to degraded water quality, especially as estuarine fishes in general are notably stressed by hypoxia [61,62]. However, it is important to consider that the decreased CPUE of M. cephalus may be a response to the additive effects of reduced food availability, increased predation pressure, and hypoxia, instead of these potential stressors separately, especially as CPUE patterns were delayed until U. mutica became established, despite the decrease in DO in both habitats in the detected period.

3.2. M. engeli

Monitoring M. engeli over nine consecutive years showed that this invasive species is a habitat generalist in this recipient community, with juveniles and adults showing no habitat preference in a tropical estuary. For this mullet species, there appears to be less stringent preferences and requirements for the habitat condition than U. mutica, as M. engeli may readily occupy other habitats, such as deeper parts of the estuary or other connected habitats within Hilo Bay [41]. This may explain how the population fluctuations of M. engeli described here showed a distinctly different pattern compared to those of M. cephalus. Specifically, M. engeli showed a clear decline in relative abundance from U. mutica pre-invasion to the detected period. However, larger juveniles and adults of M. engeli were not measurably affected by the spatial expansion of U. mutica by showing a relative increase in CPUE from the detected to established period. As available shallow habitats along the shoreline were reinvaded by U. mutica, competition for limited habitat and food resources may have increased between M. engeli and M. cephalus. Therefore, this may have stimulated M. engeli, as a generalist, to relocate to a habitat with less competition. This may also explain the relative increase in the adult and larger juvenile M. engeli CPUE from detected to established periods, as the relative abundance of M. cephalus decreased during this period, thereby reducing competition for food and the habitat. Yet, possible explanations for changes in the population of the smaller juveniles during the monitoring period are tentative due to limited research on the ecology and life history of M. engeli. This is attributable to this species having little economic value in its native range because of its comparatively smaller size to larger and more desirable food fishes. As an invasive species, this mullet is also understudied because there is only a single exotic population reported, which is restricted to the Hawaiian Islands [42]. Nonetheless, the apparent adaptability of larger juveniles and adults of M. engeli to the U. mutica reinvasion revealed another competitive advantage that this invasive mullet has over M. cephalus when food and habitat resources become limited.
While further research is needed for M. engeli, there is anecdotal evidence that shows that the juveniles of this species, particularly newer recruits, have a lower sub-lethal threshold for hypoxia than M. cephalus. Consistent with reports by Randall [43], our observations confirmed that M. engeli, especially YOY and juveniles, were notably more sensitive to oxygen stress than M. cephalus when temporarily held in buckets during sampling. This was evident by a quicker loss of equilibrium and more labored opercular movement by M. engeli compared to M. cephalus. Consequently, combined with a potential increase in interspecific competition for resources with M. cephalus, changes in physiochemical conditions caused by U. mutica may partially explain why the M. engeli CPUE declined during the detected period of the macrophyte reinvasion. For this reason, it is important to note that U. mutica was not present in Wailoa River during the detected period, as the invasion status of U. mutica was collectively determined for the entire study site and not separately for the two connected habitats. Therefore, the reinvasion of U. mutica may have affected the entire study site along the shoreline and became a relatively less suitable habitat for M. engeli. This was supported by the significant and overall reduction in DO in Waiakea PFA and Wailoa River after the U. mutica reinvasion began. Further, consistent reductions in DO throughout both habitats, particularly at the surface, may be explained by the fact that water from Waiakea PFA feeds directly into Wailoa River and is the primary source of water flowing through the entire site.
Despite the significant relationships between DO and the U. mutica reinvasion, and significant patterns in mullet CPUE, we remain cautious and inclusive when considering what caused, directly or indirectly, the significant patterns in the relative abundances of these mullets. For instance, although the DO significantly declined after U. mutica reinvasion, DO concentrations in the water column remained >7 mg L−1, which is still well above the sub-lethal hypoxic threshold for marine fish [63]. Instead of a direct effect from U. mutica, reductions in DO may be a reflection of reduced productivity by MPB caused by shading from U. mutica; the latter of which may also explain the reduction in water temperature in Waiakea PFA after the reinvasion. We must therefore consider that any or all of these possible factors, as well as others not measured in this study, can collectively have an influence on the behavior of M. engeli and M. cephalus.

4. Materials and Methods

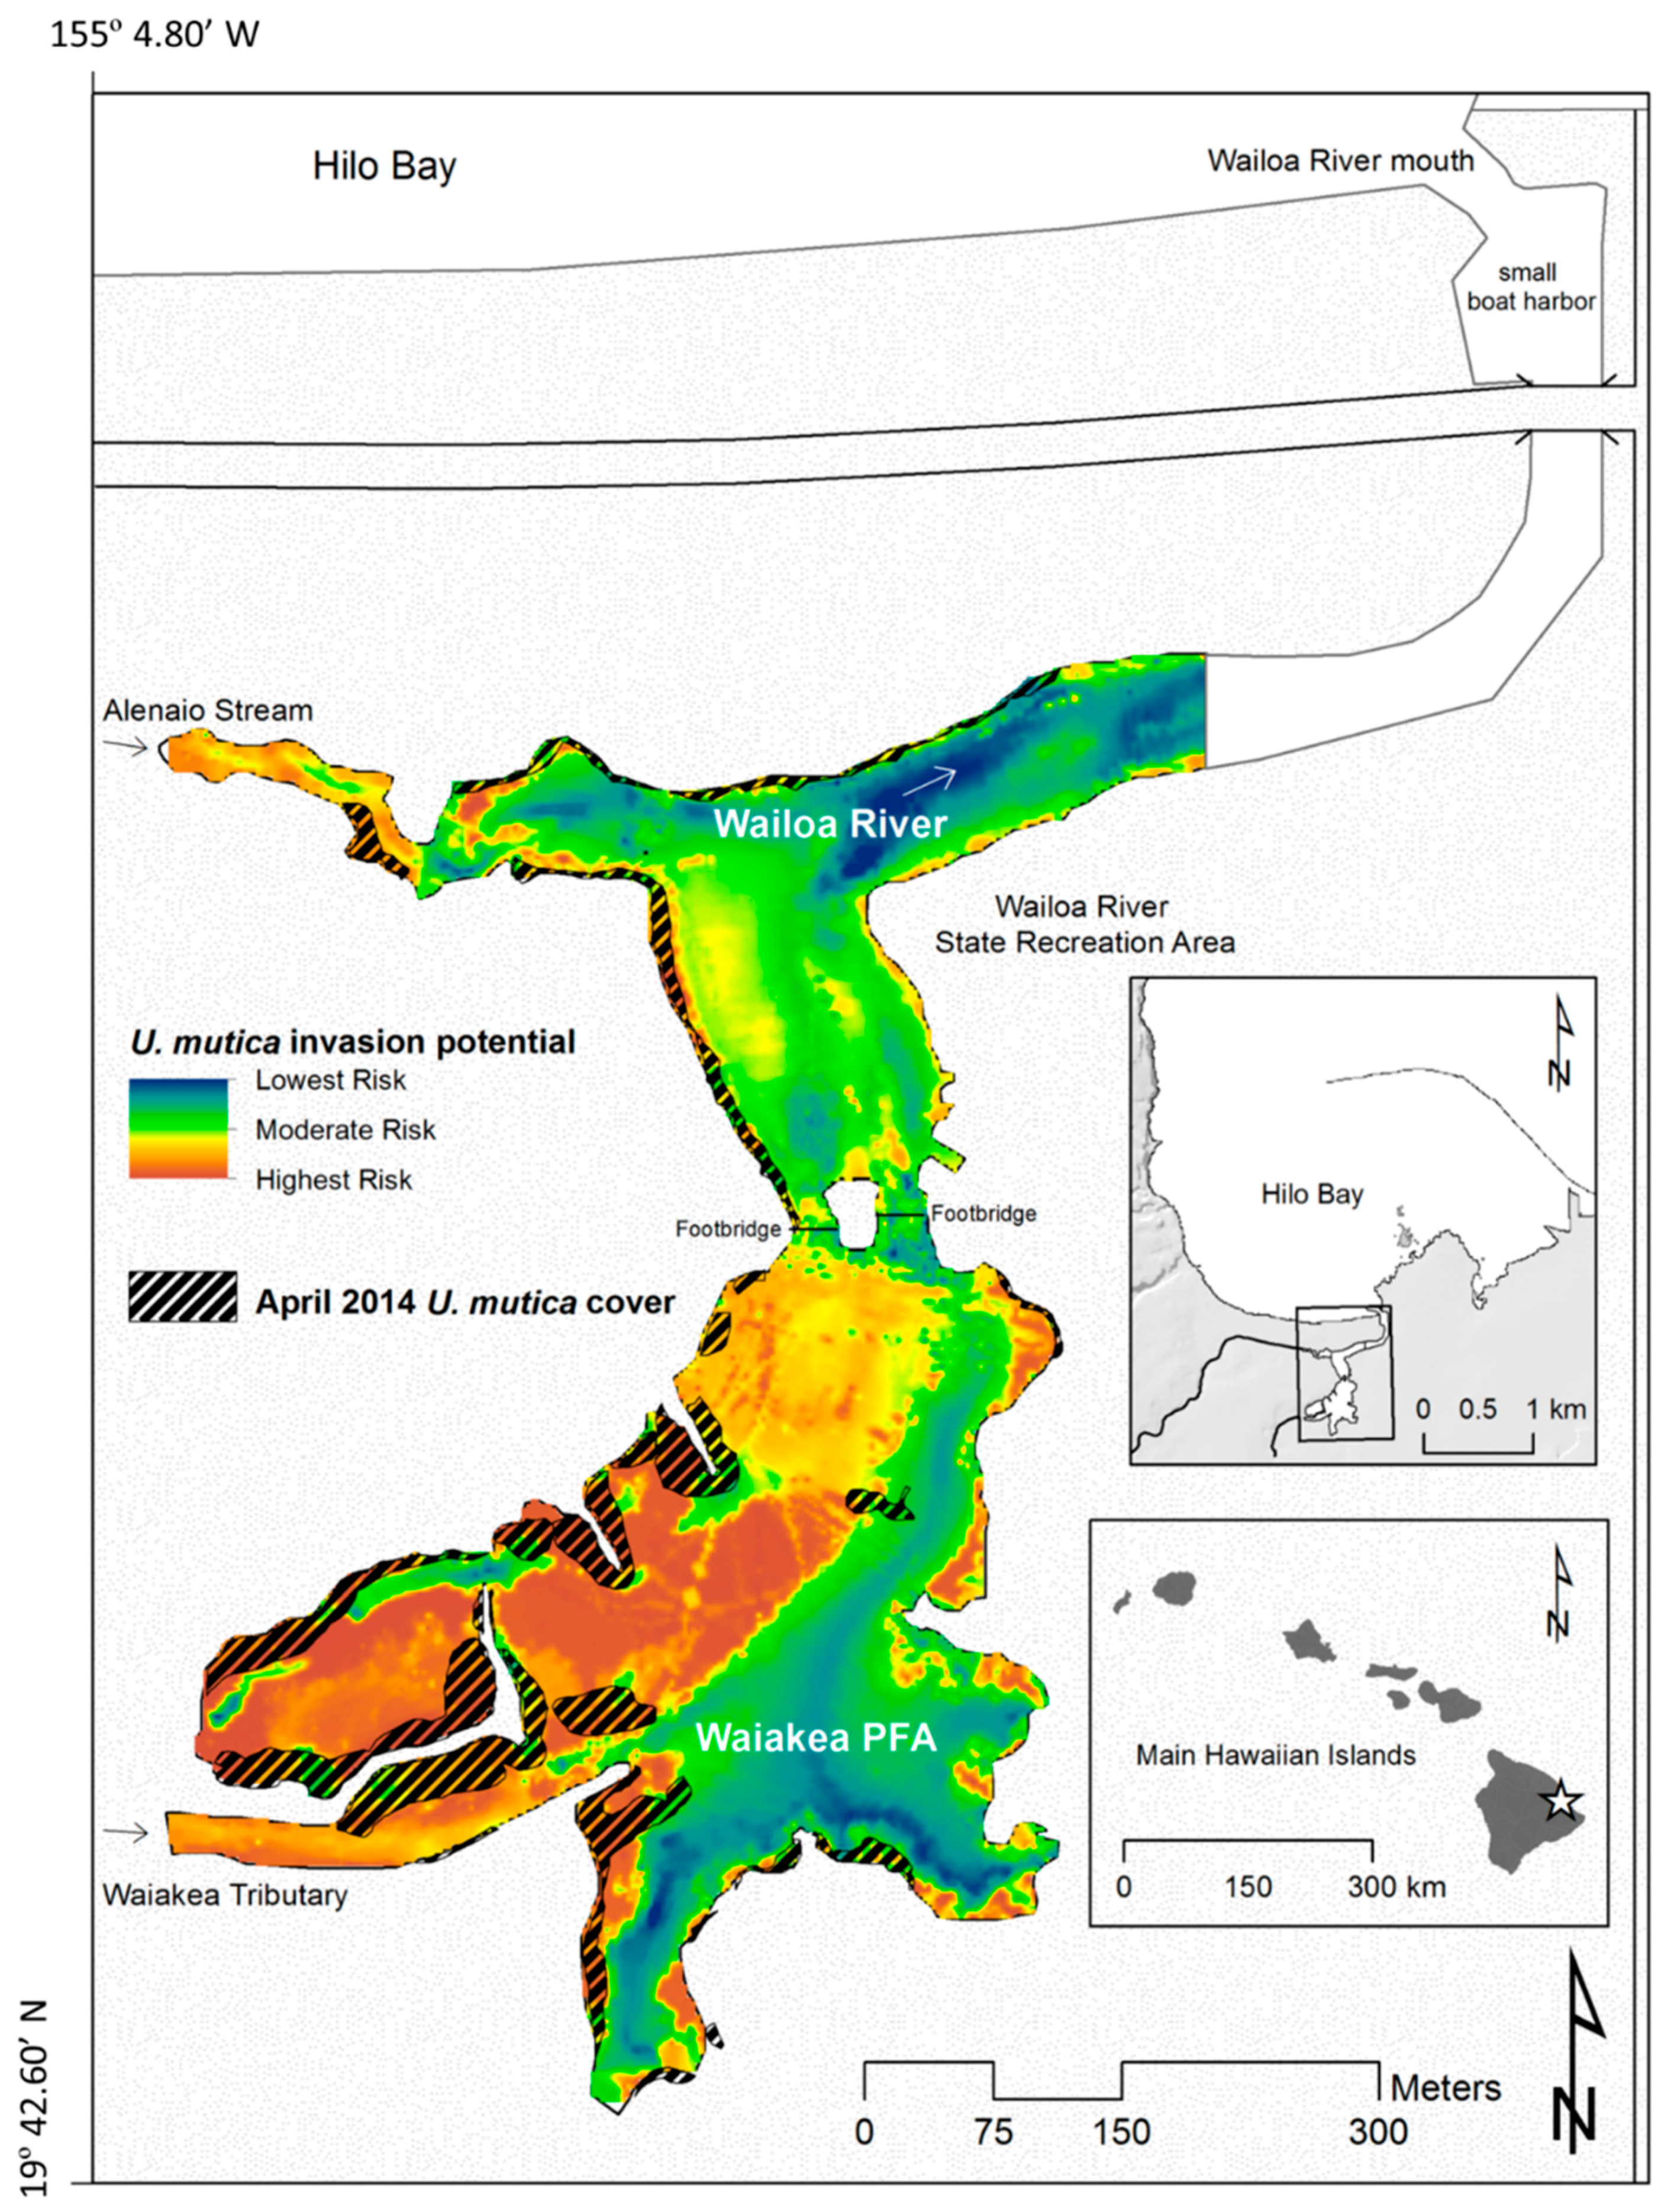
4.1. Site Description

The survey site is located on the east shore of Hawaii Island and consists of two connected habitats, Waiakea PFA (estuarine pond habitat) and Wailoa River (estuarine river habitat) (Figure 1). Both habitats are primarily fed by groundwater discharge, and occasionally by flashy intermittent streams. Water conditions are generally calm, with surface salinities ranging between 0 and 10 [64], although a tidal salt wedge penetrates daily, raising the salinity levels to as high as 34 in deeper parts of the estuary [65]. Water temperature averages 21.8 °C ± 1.2 SD year round, and the benthos primarily consists of fine sediments, rocks, and boulders covered with epiphytic microalgae. Background nutrient concentrations (NO3 + NO2) are relatively high, consistently exceeding the Hawaii Department of Health’s mean standard (5.0 μM) for rivers during wet conditions [66]. Together, Waiakea PFA and Wailoa River provide a premier estuarine pond and river habitat, respectively, for juvenile and adult M. cephalus, and as such, support a pole-and-line M. cephalus fishery unique to the area [41].

4.2. U. mutica Expansion Rates and Potential

The expansion rates and potential of U. mutica were examined using ArcInfo 10.0 GIS software (ESRI, Redlands, California, USA). Emergent stands, floating mats, and drifting mats of U. mutica were mapped throughout the survey site using the tracking feature of a GPS unit (Garmin® GPSMAP 62, Olathe, Kansas, USA) during the established period of the reinvasion on three dates: 15 April 2013, 26 November 2013, and 24 April 2014 (Figure S1). However, the spatial extent of the observed U. mutica canopies prior to 2013, during pre-invasion and detected periods, or any historical invasions, was not measured. All recorded GPS tracks were converted into line feature classes by mapping the date and a polygon feature class of U. mutica cover was created, excluding riparian coverage on land. The total areal coverage (ha) of U. mutica on each of the mapping dates was calculated as the total area of all polygon features. Expansion rates (m2 day−1) of U. mutica were calculated by dividing increases in the total areal coverage of U. mutica by the number of days since the previous mapping date.
The relationship between U. mutica invasion and water depth was visually examined by creating a bar chart showing water depths and the percent occurrence of invasion at a given depth. For this, we used bathymetry data collected between March and June 2011 from a boat using a Humminbird® 998c SI Combo depth sounder (Humminbird, Eufaula, Alabama, USA). All sounding data were tide-corrected to the nearest 0.3 cm using tide levels and times from TideComp software ver. 8.00 (Pangolin Communications, Bristol, UK). Water depths were binned into 0.2 m depth intervals, and the percent occurrence of invasion at each depth category (i.e., areal coverage of U. mutica at each depth category divided by the total areal coverage of U. mutica) was calculated based on U. mutica cover on 24 April 2014.
A map was created to visualize the invasion potential of U. mutica throughout Waiakea PFA and Wailoa River according to the percent occurrence of invasion at each depth category and the bathymetric characteristics of the study site (See Supplementary Materials). We classified an invasion potential gradient from “lowest risk”, based on areas with water depths where the lowest percent occurrence of U. mutica invasions occurred, to “highest risk”, as areas where the highest percent occurrence of U. mutica invasions occurred.

4.3. Mullet Sampling

We used the catch per unit effort (CPUE) as a proxy for the relative abundance of juvenile and adult mullet for both M. cephalus and M. engeli. The CPUE of each species was calculated using catch data from the shoreline cast-net mullet sampling program by DAR from July 2005 to May 2014 in Waiakea PFA and Wailoa River. The mullet sampling methods were adapted from methods described in Nishimoto et al. [41] and conducted every two months. Schools of mullets were targeted and collected from the shore using 0.6 cm and 1.0 cm mesh cast-nets (4.9 m diameter). Primarily, YOY and smaller juvenile mullets (≤100 mm FL) were targeted with 0.6 cm mesh nets, while larger juveniles and adults (>100 mm FL) were targeted with 1.0 cm mesh nets.
The banks of Waiakea PFA and Wailoa River were each divided into six sampling stations, averaging a 389 ± 33.02 m linear distance to ensure that cast-net sampling was well-spaced throughout the survey site. Two surveyors each made a maximum of two casts per mesh size anywhere within each station from shore. Sampling was limited to the shoreline as to primarily target juveniles of each mullet species, which were most prevalent in these areas of the survey site. Deeper areas offshore were not conducive towards cast net sampling, particularly to target juvenile fish. Also, as mentioned previously, visual observations confirmed fewer occurrences of juvenile M. cephalus away from the shoreline and in deeper parts of the study site. Each cast was geo-referenced, and all individuals caught per cast were identified to species, counted, and measured for the fork length (FL) to the nearest mm. Each surveyor was limited to 20 min to visually find the largest schools of juvenile or adult mullet that were within a station. Surveyors were allowed discretion to not cast on a school of mullet only if obstructions or objects (e.g., tree branches, large boulders) were present that would considerably inhibit fish captures and net retrieval, and therefore, confound sampling efforts. In this regard, marginal habitats along canopies of U. mutica did not inhibit cast net sampling, and mullet schools found within these marginal habitats were also sampled if no cast-net obstructions were present. If no individuals of either mullet species were caught within a cast, the abundance was recorded as 0 for that cast and species, and included as such in the CPUE calculations. In order to reduce the inherent variability in using cast-nets, sampling was conducted by the same two individuals, or by samplers with an equal skill at using the cast net. The CPUE for each mullet species was calculated as the total number of mullets (by species) caught per individual cast. In addition to cast-net sampling, physiochemical parameters were concurrently measured at the surface from shore at each sampling station within Waiakea PFA and Wailoa River during each sampling effort. The dissolved oxygen concentration (mg L−1), water temperature (°C), and salinity (PSS) were measured using a Hydrolab Quanta.

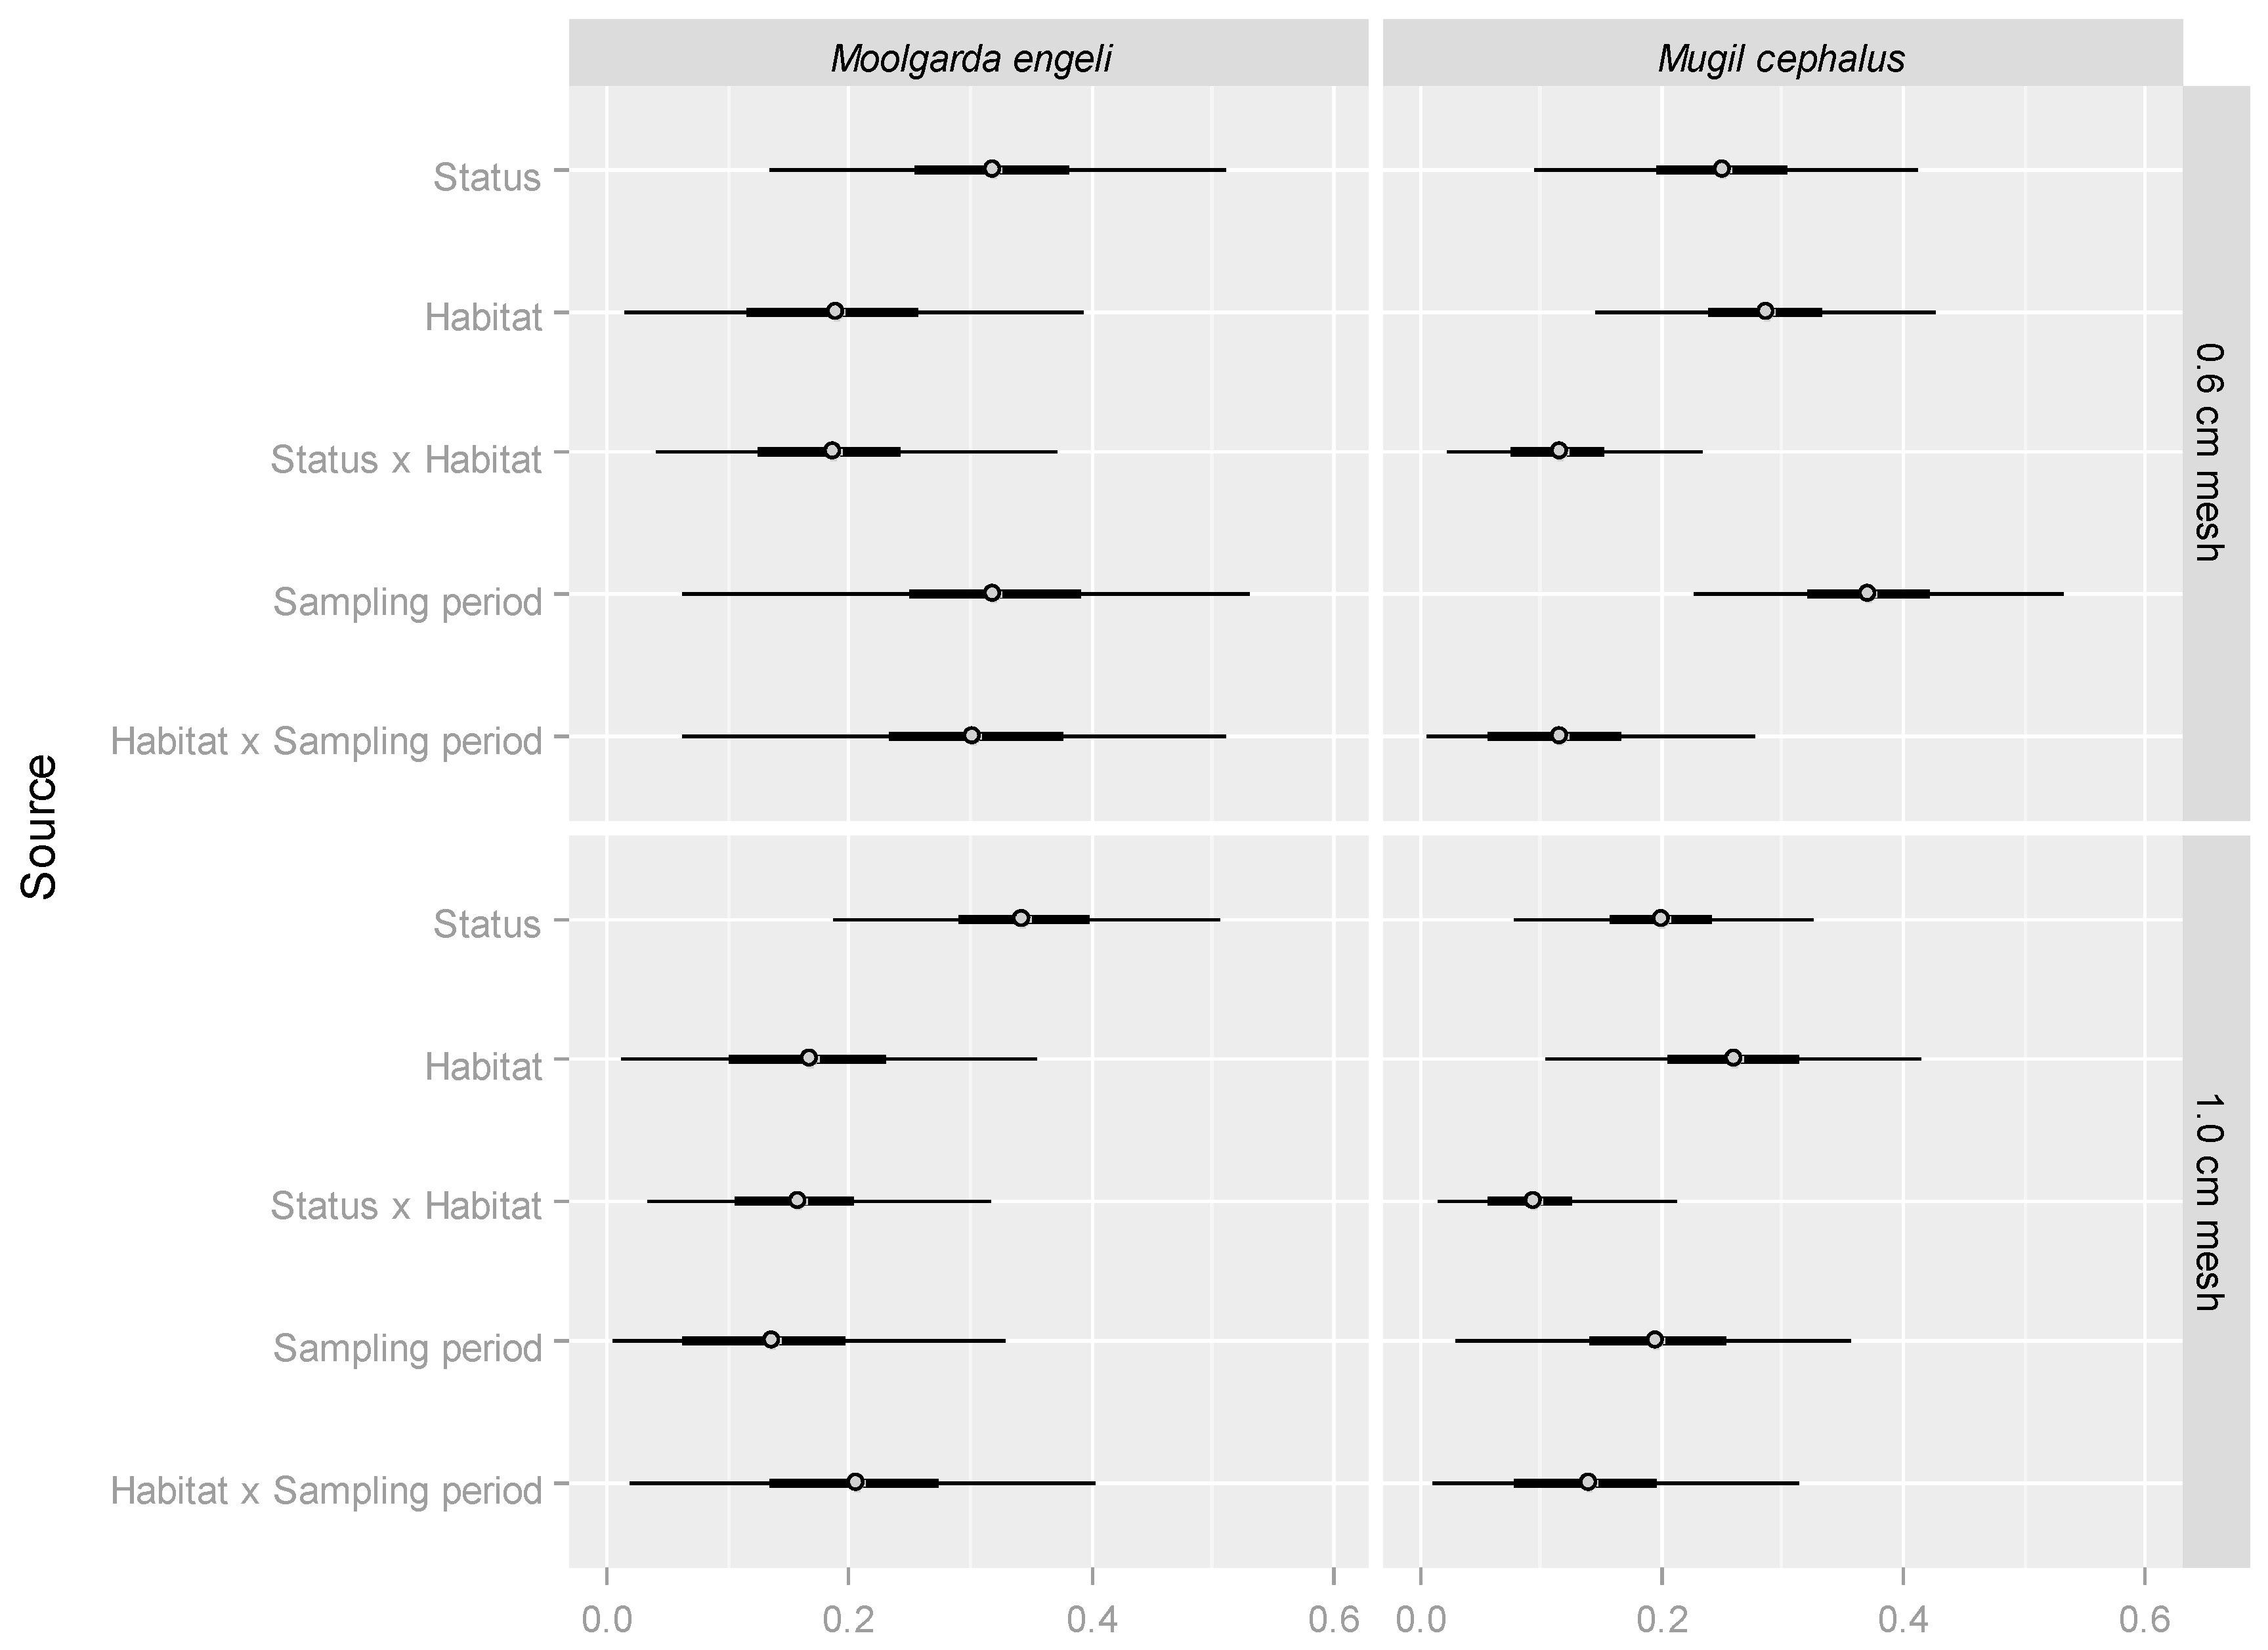
4.4. Statistical Analyses

Three-factor mixed effects models were used for formal statistical analyses of physiochemical parameters and mullet CPUE data. The factors considered were: the habitat (fixed with two levels: shallow estuarine pond, Waiakea PFA, and estuarine river, Wailoa River); U. mutica invasion status (fixed with three levels: pre-invasion, detected, and established); and sampling period (month and year when samples were collected, random factor nested in invasion status).
For the physiochemical parameters, models included three fixed-effect terms (invasion status, habitat, and interaction between invasion status and habitat), as well as two random-effect terms (sampling period and interaction between sampling period and habitat) to account for any effects of temporal variability. The DO concentration, water temperature, and salinity were separately analyzed according to the full three-factor design. The dissolved oxygen concentration and water temperature were first log-transformed (Y′ = log (Y)), and salinity was square-root-transformed. An examination of the transformed data showed no significant violations to the assumptions of ANOVA. Each model was constructed using the function lmer() in the lme4 package of the statistical software R version 3.3.2 [67] and for each model, an ANOVA table of Type III was obtained for fixed effects using the function anova() in the lmerTest package [68]. When statistically significant effects were detected for fixed effects, post-hoc pairwise comparisons were done by the use of the lsmeans and multcomp packages.
Due to inconsistency in the cast net samples, an overall design for mullet sampling was highly unbalanced, with some of the sampling periods not having data from 1.0 cm mesh-size nets. In addition, the cast-net data for this analysis was used opportunistically and was the only dataset available to statistically assess any interaction between U. mutica reinvasion and estuarine fishes in the area. To work with this unbalanced design, we employed ANOVA using a hierarchical Bayesian framework [69]. In order to explicitly model changes in the CPUE of each mullet species during the grass reinvasion at the two habitats, CPUE data were separately analyzed for M. cephalus (0.6 cm and 1.0 cm mesh cast-nets) and M. engeli (0.6 cm and 1.0 cm mesh cast-nets), according to the full three-factor design. These four response variables were first log-transformed (Y′ = log (Y + 1)) to avoid high skewness and heterogeneity.
The analyses were done using a Markov chain Monte Carlo methodology with the software JAGS 3.4.0 [70] run from within program R by the use of the rjags and R2jags packages. For each of the four CPUE response variables, the linear predictor of the ANOVA model for the log-transformed CPUE in Habitat i (Hi), Invasion Status j (Sj), and sampling period Tk (nested in Invasion Status) was Y′ijk = β0 + Hi + Sj + (HS)ij + Tk(j) + (HT)ik(j), in which β0 was the overall mean. The parameterization of model terms followed the methods described in Smith et al. [71]. For a fixed factor with m levels, a sum-to-zero constraint was used, and prior distributions of coefficients β were β ~ Normal (0, 100) for β1 to βm−1, and βm = −(β1 + … + βm−1). For interactions between fixed and random factors, the same constraint was used for the fixed factor within each level of the random factor. For a random factor, prior distributions of coefficients β were β ~ Normal (0, σ2) with a standard non-informative hyper-prior σ ~ Uniform (0, 10), where σ2 is the variance component for the factor. The variance component estimates for fixed factors were sums of squared fixed effects (β1 to βm) divided by the appropriate degrees of freedom [69]. Each analysis was run with three chains, each with 100,000 iterations, from which 50,000 were discarded as a burn-in. The thinning rate of each chain was one in six. Convergence was assessed using the Brooks-Gelman-Rubin diagnostic (R hat; [72]).
In order to visually identify the source of variation in the mullet CPUE, variance components, expressed as the estimate of the standard deviation among levels, were plotted for each of the four analyses (ANOVA display; [69]). We also derived the following ratios of conditional means as part of the ANOVA analyses: the ratio of the conditional mean CPUE in the estuarine pond habitat vs. the river habitat (habitat effects), the ratio of the conditional mean CPUE in the pre-invasion vs. detected periods (initial invasion effects), and the ratio of the conditional mean CPUE in the detected vs. established period (post-invasion effects). The estimated conditional mean CPUE values based on both the Habitat and Invasion Status effects (Y(H*S)ij = eβ0+Hi+Sj+(HS)ij − 1) were also obtained and plotted with their 95% credible intervals (95% CI) for each of the four analyses.

5. Conclusions

While we have a nascent understanding of the interaction between plant invasions and fish, we have provided a clearer picture of the different traits of a native and invasive mullet of contrasting value, and the potential effects of a macrophytic invasion on these fish and their habitat. Although by using monitoring data direct causation could not be demonstrated, there was a negative relationship between U. mutica invasion and the M. cephalus CPUE, insofar as not having any positive relationship with the M. engeli CPUE. We may also consider that notable differences in mullet CPUE patterns correlating to the U. mutica reinvasion and physiochemical characteristics were caused by species-specific traits, diverging among habitat fidelity, food preference and availability, refuge from predation, and physiological resilience to oxygen stress. These findings underscore the need to further examine the potential interactive effects of macrophyte invasions on coastal nekton communities and native coastal ecosystems. This is especially important for tropical estuaries inhabited by invasive species that transcend physical and ecological barriers, which may overwhelm the resilience of native fish.

Supplementary Materials

The following are available online at www.mdpi.com/2410-3888/2/2/7/s1, Assessment of Urochloa mutica expansion and invasion potential in Waiakea PFA and Wailoa River in Hilo, Hawaii USA, Table S1: Urochloa mutica cover and expansion rates in Waiakea Public Fishing Area (PFA) and Wailoa River, Figure S1: Maps of Waiakea PFA and Wailoa River prior to Urochloa mutica invasion, and U. mutica areal coverage across three dates, Figure S2: Percent (%) distribution of total Urochloa mutica cover vs. water depth (m) in Waiakea PFA and Wailoa River.

Acknowledgments

We thank L. Nishiura, T. Shimoda, T. Shindo, E. Lapp, K. Hind, N. Ahu, M. Fujimoto, B. Kanenaka, B. Anderson, and R. Nishimoto (retired) (DAR) for providing vital assistance and support towards this project. We also thank W. Walsh and B. Neilson (DAR), two anonymous reviewers, as well as the Research Corporation of the University of Hawaii for providing valuable comments and suggestions for this manuscript, and A. Smith for his advice on Bayesian statistical analysis. Funding was provided by the U.S. Fish and Wildlife Service Sport Fish Restoration (Dingell-Johnson) Program through the Hawaii DLNR Division of Aquatic Resources’ Freshwater and Marine Fisheries Surveys program (FY2006 to FY2007) and by the State of Hawaii.

Author Contributions

Troy S. Sakihara was involved in all portions of data collection and field work, spatial data mapping, and initiated the overall study. Formal statistical analyses were led by Atsuko Fukunaga. Kimberly A. Peyton provided expert advice and information on tropical estuarine habitat ecology, microalgae and macrophytes. All authors contributed substantially to the interpretation of the results and writing of the manuscript.

Conflicts of Interest

The authors declare no conflict of interest. The founding sponsors had no role in the design of the study; in the collection, analyses, or interpretation of data; in the writing of the manuscript, and in the decision to publish the results.

References

  1. Orth, R.; Heck, K.; van Montfrans, J. Faunal communities in seagrass beds: A review of the influence of plant structure and prey characteristics on predator-prey relationships. Estuaries 1984, 7, 339–350. [Google Scholar] [CrossRef]
  2. Lubbers, L.; Boynton, W.R.; Kemp, W.M. Variations in structure of estuarine fish communities in relation to abundance of submersed vascular plants. Mar. Ecol. Prog. Ser. 1990, 65, 1–14. [Google Scholar] [CrossRef]
  3. Randall, R.; Minns, C.; Cairns, V.; Moore, J. The relationship between an index of fish production and submerged macrophytes and other habitat features at three littoral areas in the Great Lakes. Can. J. Fish. Aquat. Sci. 1996, 53, 35–44. [Google Scholar] [CrossRef]
  4. Reddy, K.; Patrick, W.; Lindau, C. Nitrification-denitrification at the plant root-sediment interface in wetlands. Limnol. Oceanogr. 1989, 34, 1004–1013. [Google Scholar] [CrossRef]
  5. Brix, H. Do macrophytes play a role in constructed treatment wetlands? Water Sci. Technol. 1997, 35, 11–17. [Google Scholar] [CrossRef]
  6. Summerfelt, S.T.; Adler, P.R.; Glenn, D.M.; Kretschmann, R.N. Aquaculture sludge removal and stabilization within created wetlands. Aquac. Eng. 1999, 19, 81–92. [Google Scholar] [CrossRef]
  7. Casatti, L.; Mendes, H.; Ferreira, K.M. Aquatic macrophytes as feeding site for small fishes in the Rosana Reservoir, Paranapanema River, Southeastern Brazil. Braz. J. Biol. 2003, 63, 213–222. [Google Scholar] [CrossRef] [PubMed]
  8. Michelan, T.S.; Thomaz, S.; Mormul, R.P.; Carvalho, P. Effects of an exotic invasive macrophyte (tropical signalgrass) on native plant community composition, species richness and functional diversity. Freshw. Biol. 2010, 55, 1315–1326. [Google Scholar] [CrossRef]
  9. Gordon, D.R. Effects of invasive, non-indigenous plant species on ecosystem processes: Lessons from Florida. Ecol. Appl. 1998, 8, 975–989. [Google Scholar] [CrossRef]
  10. Schultz, R.; Dibble, E. Effects of invasive macrophytes on freshwater fish and macroinvertebrate communities: The role of invasive plant traits. Hydrobiologia 2012, 684, 1–14. [Google Scholar] [CrossRef]
  11. Thomaz, S.; Mormul, R.; Michelan, T. Propagule pressure, invasibility of freshwater ecosystems by macrophytes and their ecological impacts: A review of tropical freshwater ecosystems. Hydrobiologia 2015, 746, 39–59. [Google Scholar] [CrossRef]
  12. Carniatto, N.; Thomaz, S.M.; Cunha, E.R.; Fugi, R.; Ota, R.R. Effects of an invasive alien Poaceae on aquatic macrophytes and fish communities in a Neotropical reservoir. Biotropica 2013, 45, 747–754. [Google Scholar] [CrossRef]
  13. Casatti, L.; de Paula Ferreira, C.; Carvalho, F.R. Grass-dominated stream sites exhibit low fish species diversity and dominance by guppies: An assessment of two tropical pasture river basins. Hydrobiologia 2009, 632, 273–283. [Google Scholar] [CrossRef]
  14. Valley, R.D.; Bremigan, M.T. Effects of macrophyte bed architecture on largemouth bass foraging: Implications of exotic macrophyte invasions. Trans. Am. Fish. Soc. 2002, 131, 234–244. [Google Scholar] [CrossRef]
  15. Theel, H.J.; Dibble, E.D. An experimental simulation of an exotic aquatic macrophyte invasion and its influence on foraging behavior of bluegill. J. Freshw. Ecol. 2008, 23, 79–89. [Google Scholar] [CrossRef]
  16. Pusey, B.J.; Arthington, A.H. Importance of the riparian zone to the conservation and management of freshwater fish: A review. Mar. Freshw. Res. 2003, 54, 1–16. [Google Scholar] [CrossRef]
  17. Douglas, M.; Bunn, S.; Pidgeon, R.; Davies, P.; Barrow, P.; O’Connor, R.; Winning, M. Weed Management and the Biodiversity and Ecological Processes of Tropical Wetlands; Draft Final Report; National Wetlands R & D Program; Environment Australia & Land and Water Australia: Canberra, Australia, 2002. [Google Scholar]
  18. Douglas, M.M.; O’Connor, R.A. Effects of the exotic macrophyte, para grass (Urochloa mutica), on benthic and epiphytic macroinvertebrates of a tropical floodplain. Freshw. Biol. 2003, 48, 962–971. [Google Scholar] [CrossRef]
  19. Fernandes, I.M.; Machado, F.A.; Penha, J. Spatial pattern of a fish assemblage in a seasonal tropical wetland: Effects of habitat, herbaceous plant biomass, water depth, and distance from species sources. Neotropical Ichthyol. 2010, 8, 289–298. [Google Scholar] [CrossRef]
  20. Cunha, E.R.; Thomaz, S.M.; Evangelista, H.B.A.; Carniato, J.; Souza, C.F.; Fugi, R. Small-sized fish assemblages do not differ between a native and a recently established non-indigenous macrophyte in a Neotropical ecosystem. Nat. Conserv. 2011, 9, 61–66. [Google Scholar] [CrossRef]
  21. Parsons, J.J. Spread of African pasture grasses to the American tropics. J. Range Manag. 1972, 25, 12–17. [Google Scholar] [CrossRef]
  22. Humphries, S.E.; Groves, R.H.; Mitchell, D.S. Plant invasions of Australian ecosystems: A status review and management directions. In Kowari; Australian National Parks and Wildlife Service: Sydney, Australia, 1991; Volume 2, pp. 1–134. [Google Scholar]
  23. Hannan-Jones, M.; Csurhes, S. Invasive Species Risk Assessment: Para Grass (Urochloa mutica); Queensland Department of Agriculture, Fisheries and Forestry: Brisbane, Australia, 2012. [Google Scholar]
  24. Wagner, W.L.; Herbst, D.R.; Sohmer, S.H. Manual of the Flowering Plants of Hawaii, Volumes 1 and 2; University of Hawaii and Bishop Museum Press: Honolulu, HI, USA, 1999. [Google Scholar]
  25. Space, J.C.; Flynn, T. Observations on Invasive Plant Species in American Samoa; USDA Forest Service, Pacific Southwest Research Station, Institute of Pacific Islands Forestry: Honolulu, HI, USA, 2000. [Google Scholar]
  26. Space, J.C.; Flynn, T. Report to the Kingdom of Tonga on Invasive Plant Species of Environmental Concern; USDA Forest Service, Pacific Southwest Research Station, Institute of Pacific Islands Forestry: Honolulu, HI, USA, 2001. [Google Scholar]
  27. Bantilan-Smith, M.; Bruland, G.L.; MacKenzie, R.A.; Henry, A.R.; Ryder, C.R. A comparison of the vegetation and soils of natural, restored, and created coastal lowland wetlands in Hawaii. Wetlands 2009, 29, 1023–1035. [Google Scholar] [CrossRef]
  28. Bruland, G.L.; MacKenzie, R.A. Nitrogen source tracking with δ15N content of coastal wetland plants in Hawaii. J. Environ. Qual. 2010, 39, 409–419. [Google Scholar] [CrossRef] [PubMed]
  29. Singh, G. Salinity-related desertification and management strategies: Indian experience. Land Degrad. Dev. 2009, 20, 367–385. [Google Scholar] [CrossRef]
  30. Boudet, G. The Inventory and Mapping of Rangeland in West Africa, Evaluation and mapping of tropical African rangelands. In Proceedings of the Seminar Held in Bamako, Mali, Bamako, Mali, 3–8 March 1975; pp. 3–8. [Google Scholar]
  31. Willis, M.; Zerbe, S.; Breitung, W. Habitat survey, mapping, and assessment in the Mai Po Nature Reserve, Hong Kong (China). Arch. Nat. Conserv. Landsc. Res. 2006, 45, 53–70. [Google Scholar]
  32. Granek, E.F.; Polasky, S.; Kappel, C.V.; Reed, D.J.; Stoms, D.M.; Koch, E.W.; Kennedy, C.J.; Cramer, L.A.; Hacker, S.D.; Barbier, E.B. Ecosystem services as a common language for coastal ecosystem-based management. Conserv. Biol. 2010, 24, 207–216. [Google Scholar] [CrossRef] [PubMed]
  33. Hadwen, W.L.; Arthington, A.H. Ecology, Threats and Management Options for Small Estuaries and ICOLLS; Sustainable Tourism CRC: Gold Coast, Australia, 2006. [Google Scholar]
  34. Beck, M.W.; Heck, K.L., Jr.; Able, K.W.; Childers, D.L.; Eggleston, D.B.; Gillanders, B.M.; Halpern, B.; Hays, C.G.; Hoshino, K.; Minello, T.J.; et al. The identification, conservation, and management of estuarine and marine nurseries for fish and invertebrates: A better understanding of the habitats that serve as nurseries for marine species and the factors that create site-specific variability in nursery quality will improve conservation and management of these areas. Bioscience 2001, 51, 633–641. [Google Scholar]
  35. Fitzsimons, J.; McRae, M.; Nishimoto, R. Behavioral ecology of indigenous stream fishes in Hawaii. Biol. Hawaii. Streams Estuaries 2007, 3, 11–21. [Google Scholar]
  36. Potter, I.C.; Tweedley, J.R.; Elliott, M.; Whitfield, A.K. The ways in which fish use estuaries: A refinement and expansion of the guild approach. Fish Fish. 2013, 16, 230–239. [Google Scholar] [CrossRef]
  37. McDowall, R.M. Diadromy in Fishes: Migrations between Freshwater and Marine Environments; Timber Press: Portland, OR, USA, 1988. [Google Scholar]
  38. Cardona, L. Habitat selection by grey mullets (Osteichthyes: Mugilidae) in Mediterranean estuaries: The role of salinity. Sci. Mar. 2006, 70, 443–455. [Google Scholar] [CrossRef]
  39. Briggs, J.C. Fishes of worldwide (circumtropical) distribution. Copeia 1960, 3, 171–180. [Google Scholar] [CrossRef]
  40. Thomson, J.M. Synopsis of Biological Data on the Grey Mullet Mugil cephalus, Linnaeus 1758; Commonwealth Scientific and Industrial Research Organization: Melbourne, Australia, 1963. [Google Scholar]
  41. Nishimoto, R.T.; Shimoda, T.E.; Nishiura, L.K. Mugilids in the muliwai: A tale of two mullets. Biol. Hawaii. Streams Estuaries Bish. Mus. Bull. Cult. Environ. Stud. 2007, 3, 143–156. [Google Scholar]
  42. Randall, J.E.; Kanayama, R.K. Hawaiian fish immigrants. Sea Front. 1972, 18, 144–153. [Google Scholar]
  43. Randall, J.E. Introductions of marine fishes to the Hawaiian Islands. Bull. Mar. Sci. 1987, 41, 490–502. [Google Scholar]
  44. Maciolek, J. Exotic fishes in Hawaii and other islands of Oceania. In Distribution, Biology, and Management of Exotic Fishes; Johns Hopkins University Press: Baltimore, MD, USA, 1984; pp. 131–161. [Google Scholar]
  45. Julius, M.L. Why sweat the small stuff: The importance of microalgae in Hawaiian stream ecosystems. Bish. Mus. Bull. Cult. Environ. Stud. 2007, 3, 183–194. [Google Scholar]
  46. Silva, S.; Silva, E. Biology of young grey mullet, Mugil cephalus L., populatioins in a coastal lagoon in Sri Lanka. J. Fish Biol. 1979, 15, 9–20. [Google Scholar] [CrossRef]
  47. Blaber, S. Factors affecting recruitment and survival of mugilids in estuaries and coastal waters of southeastern Africa. Am. Fish. Soc. Symp. 1987, 1, 18. [Google Scholar]
  48. Mwandya, A.; Mgaya, Y.; Öhman, M.; Bryceson, I.; Gullström, M. Distribution patterns of striped mullet Mugil cephalus in mangrove creeks, Zanzibar, Tanzania. Afr. J. Mar. Sci. 2010, 32, 85–93. [Google Scholar] [CrossRef]
  49. Whitfield, A.K.; Panfili, J.; Durand, J.D. A global review of the cosmopolitan flathead mullet Mugil cephalus Linnaeus 1758 (Teleostei: Mugilidae), with emphasis on the biology, genetics, ecology and fisheries aspects of this apparent species complex. Rev. Fish Biol. Fish. 2012, 22, 641–681. [Google Scholar] [CrossRef]
  50. Perna, C.; Cappo, M.; Pusey, B.J.; Burrows, D.; Pearson, R. Removal of aquatic weeds greatly enhances fish community richness and diversity: An example from the Burdekin River floodplain, tropical Australia. River Res. Appl. 2012, 28, 1093–1104. [Google Scholar] [CrossRef]
  51. Munsch, S.H.; Cordell, J.R.; Toft, J.D. Fine-scale habitat use and behavior of a nearshore fish community: Nursery functions, predation avoidance, and spatiotemporal habitat partitioning. Mar. Ecol. Prog. Ser. 2016, 557, 1–15. [Google Scholar] [CrossRef]
  52. Stone, K.R. Urochloa mutica. Fire Effects Information System. Available online: http://www.webcitation.org/6o71dwj67 (accessed on 1 May 2017).
  53. Bunn, S.E.; Davies, P.M.; Kellaway, D.M. Contributions of sugar cane and invasive pasture grass to the aquatic food web of a tropical lowland stream. Mar. Freshw. Res. 1997, 48, 173–179. [Google Scholar] [CrossRef]
  54. Woelfel, J.; Schoknecht, A.; Schaub, I.; Enke, N.; Schumann, R.; Karsten, U. Growth and photosynthesis characteristics of three benthic diatoms from the brackish southern Baltic Sea in relation to varying environmental conditions. Phycologia 2014, 53, 639–651. [Google Scholar] [CrossRef]
  55. Mariotti, G.; Fagherazzi, S. Modeling the effect of tides and waves on benthic biofilms. J. Geophys. Res. Biogeosci. 2012, 117. [Google Scholar] [CrossRef]
  56. Laegdsgaard, P.; Johnson, C. Why do juvenile fish utilise mangrove habitats? J. Exp. Mar. Biol. Ecol. 2001, 257, 229–253. [Google Scholar] [CrossRef]
  57. Lehtiniemi, M. Swim or hide: Predator cues cause species specific reactions in young fish larvae. J. Fish Biol. 2005, 66, 1285–1299. [Google Scholar] [CrossRef]
  58. Arthington, A.H.; Milton, D.A.; McKay, R.J. Effects of urban development and habitat alterations on the distribution and abundance of native and exotic freshwater fish in the Brisbane region, Queensland. Aust. J. Ecol. 1983, 8, 87–101. [Google Scholar] [CrossRef]
  59. Low, T. Tropical pasture plants as weeds. Trop. Grassl. 1997, 31, 337–343. [Google Scholar]
  60. Hyland, S. An Investigation of the Impacts of Ponded Pastures on Barramundi and Other Finfish Populations in Tropical Coastal Wetlands; Department of Primary Industries, Queensland Report QO02005; Fisheries Research and Development Corporation: Brisbane, Australia, 2002. [Google Scholar]
  61. Wannamaker, C.M.; Rice, J.A. Effects of hypoxia on movements and behavior of selected estuarine organisms from the southeastern United States. J. Exp. Mar. Biol. Ecol. 2000, 249, 145–163. [Google Scholar] [CrossRef]
  62. Rabalais, N.N.; Harper, D.E.; Turner, R.E. Responses of nekton and demersal and benthic fauna to decreasing oxygen concentrations. In Coastal Hypoxia: Consequences for Living Resources and Ecosystems; American Geophysical Union as Part of the Coastal and Estuarine Studies: Washington, DC, USA, 2001; pp. 115–128. [Google Scholar]
  63. Vaquer-Sunyer, R.; Duarte, C.M. Thresholds of hypoxia for marine biodiversity. Proc. Natl. Acad. Sci. USA 2008, 105, 15452–15457. [Google Scholar] [CrossRef] [PubMed]
  64. Paquay, F.S.; Mackenzie, F.T.; Borges, A.V. Carbon dioxide dynamics in rivers and coastal waters of the “big island” of Hawaii, USA, during baseline and heavy rain conditions. Aquat. Geochem. 2007, 13, 1–18. [Google Scholar] [CrossRef]
  65. Hallacher, L.E.; Kho, E.B.; Bernard, N.D.; Orcutt, A.M.; Dudley, W.C., Jr.; Hammond, T.M. Distribution of arsenic in the sediments and biota of Hilo Bay, Hawaii. Pac. Sci. 1985, 39, 266–273. [Google Scholar]
  66. Wiegner, T.N.; Mead, L. Water Quality in Hilo Bay, Hawaii, USA, under Baseflow and Storm Conditions; Professional Report to Hawaii County’s Department of Public Works; Engineering Division: Hilo, HI, USA, 2009. [Google Scholar]
  67. R Development Core Team. R: A Language and Environment for Statistical Computing; R Foundation for Statistical Computing: Vienna, Austria, 2013; Available online: http://www.R-project.org/ (accessed on 12 May 2017).
  68. Kuznetsova, A.; Brockhoff, P.B.; Christensen, R.H.B. lmerTest: Tests in Linear Mixed Effects Models. Cran, R Package, Version 2. 2015. Available online: http://CRAN.R-project.org/package=lmerTest (accessed on 12 May 2017).
  69. Gelman, A. Analysis of variance—Why it is more important than ever. Ann. Stat. 2005, 33, 1–53. [Google Scholar] [CrossRef]
  70. Plummer, M. Jags: Just Another Gibbs Sampler; Version 3.4.0. Available online: http://mcmc-jags.sourceforge.net (accessed on 1 October 2015).
  71. Smith, T.; Marshall, L.; Sharma, A. Predicting hydrologic response through a hierarchical catchment knowledgebase: A Bayes empirical Bayes approach. Water Resour. Res. 2014, 50, 1189–1204. [Google Scholar] [CrossRef]
  72. Brooks, S.; Gelman, A. General methods for monitoring convergence of iterative simulations. J. Comput. Graph. Stat. 1998, 7, 434–455. [Google Scholar] [CrossRef]
Figure 1. Map depicting the areal coverage of Urochloa mutica in April 2014 and its invasion potential based on the bathymetric characteristics of the Waiakea Public Fishing Area (PFA) and Wailoa River in Hilo, HI, USA. Invasion potential is based on a negative relationship between the existing U. mutica invasion and water depth (Figure S2).
Fishes 02 00007 g001
Figure 2. Schematic of a successive triphasic Urochloa mutica invasion and the potential effects per phase in the Waiakea Public Fishing Area and Wailoa River, Hilo, HI, USA.
Fishes 02 00007 g002
Figure 3. Box plot of (A) dissolved oxygen concentrations (mg L−1), (B) water temperature (°C), and (C) Salinity (Practical Salinity Scale ‒ PSS) in Waiakea PFA (black bars) and Wailoa River (grey bars) across invasion statuses (Pre-invasion, Detected, and Established). Horizontal lines are median concentrations, shaded boxes indicate the interquartile range, whiskers indicate the upper and lower quartile limits, and points represent outliers.
Fishes 02 00007 g003
Figure 4. Variance component estimates per factor combination. Status = Urochloa mutica invasion status (pre-invasion, detected, established); Habitat = Pond vs. River; Sampling Period = month and year. Bars display 50% and 95% credible intervals.
Fishes 02 00007 g004
Figure 5. Mean CPUE of M. cephalus ((A): 0.6 cm mesh cast net; (B): 1.0 cm mesh cast net) and M. engeli ((C): 0.6 cm mesh cast net; (D): 1.0 cm mesh cast net) across sampling dates (month-year), across periods of U. mutica invasion (pre-invasion, detected, and established), and between the pond and river habitat (Waiakea PFA and Wailoa River). Shaded dates indicate late spring and summer months. Error bars are ±1 standard error.
Fishes 02 00007 g005aFishes 02 00007 g005b
Figure 6. Estimated conditional mean CPUE of mullets per factor combination: habitat (pond vs. river) and invasion status (pre-invasion, detected, established). Error bars are ±1 standard error.
Fishes 02 00007 g006
Table 1. Type III ANOVA table for dissolved oxygen concentration (mg L−1), water temperature (°C), and salinity (PSS), showing fixed-effect terms: habitat (Waiakea PFA vs. Wailoa River), invasion status (pre-invasion, detected, and established), and interaction between habitat and invasion status. Each model also included two random-effect terms, the sampling period and interaction between the sampling period and habitat, to account for any effects of temporal variability. The model for salinity estimated a variance component of zero for the interaction between the sampling period and habitat, and this term was thus removed from the model. Bolded p values indicate significant effects.
Dissolved Oxygen (mg L−1)
Source1SS2MS3numDF4denDFF5p
Habitat0.0740.074141.988.7350.0051
Invasion status0.0920.046243.075.4690.0076
Habitat: Invasion status0.00050.0003242.170.02980.97
Water Temperature (°C)
Source1SS2MS3numDF4denDFF5p
Habitat0.0790.079140.7644.76<0.001
Invasion status0.00310.0016241.580.890.42
Habitat: Invasion status0.0160.0079241.064.460.018
Salinity (PSS)
Source1SS2MS3numDF4denDFF5p
Habitat16.6816.681434.08126.94<0.001
Invasion status0.310.16242.121.200.31
Habitat: Invasion status0.700.352434.132.670.07
1SS = sums of squares, 2MS = mean square, 3numDF = numerator degrees of freedom, 4denDF = denominator degrees of freedom, 5p = calculated probability.

