Article

Fishery Resource Assessment with eDNA Metabarcoding and Acoustic Survey in Xiangyun Bay, Bohai Sea

1
College of Fisheries and Life Science, Dalian Ocean University, Dalian 116023, China
2
Center for Marine Ranching Engineering Science Research of Liaoning, Dalian Ocean University, Dalian 116023, China
*
Authors to whom correspondence should be addressed.
Fishes 2026, 11(9), 525; https://doi.org/10.3390/fishes11090525 (registering DOI)
Submission received: 24 July 2026 / Revised: 26 August 2026 / Accepted: 2 September 2026 / Published: 5 September 2026
(This article belongs to the Special Issue Technology for Fish and Fishery Monitoring—2nd Edition)

Abstract

Xiangyun Bay Marine Ranch, in the Bohai Sea, China, is an important fishery resource area but has long been affected by eutrophication, habitat destruction, and overfishing. To support resource conservation and management, this study combined environmental DNA (eDNA) metabarcoding, acoustic survey, and a traditional net survey to assess fish resources. The traditional net survey collected 18 fish species (2143 individuals), with Speartailed goby (Chaeturichthys stigmatias) and Indian flathead (Platycephalus indicus) as the dominant species (~70% of total). An acoustic survey revealed that fish resource density in the reef area ranged from 6.05 × 10⁻⁵ to 9.38 × 10⁻⁵ ind/m2, with vertical distribution concentrated in the 1–3 m water layer; strong scatterers (−47 to −42 dB) at 3 m depth indicated benthic large individuals. The eDNA analysis generated 1,091,731 high-quality sequences assigned to 39 fish species, with dominant species including Kammal thryssa (Thryssa kammalensis), Yellow-spotted slipmouth (Nuchequula flavaxilla), and Large-mouth naked goby (Gymnoglobus macrognathos). In conclusion, the acoustic survey demonstrates unique advantages in assessing spatial distribution of fishery resources, while eDNA technology serves as an effective supplement to traditional net surveys. Their combined application provides more accurate scientific evidence for the production management and sustainable utilization of marine ranches.
Key Contribution: This study demonstrates, for the first time in Xiangyun Bay Marine Ranch, that the combined application of acoustic survey and environmental DNA (eDNA) technology effectively compensates for the limitations of traditional net surveys. The acoustic survey precisely identified the vertical distribution (1–3 m water layer) and density range (6.05 × 10⁻⁵–9.38 × 10⁻⁵ ind/m2) of fish resources, while eDNA uncovered a broader range of fish species (39 species) compared to traditional nets (18 species), providing a more comprehensive assessment of fishery resources in eutrophic and overfished coastal waters.

1. Introduction

Resource assessment refers to the quantitative study of the species composition, population size, resource density, spatial and temporal distribution, and dynamic changes of fishery resources in waters through systematic investigation and analysis. Its core purpose is to objectively evaluate the status of fishery resources and the effect of proliferation and conservation, and to provide scientific basis and technical support for water area construction, resource management and sustainable utilization [1,2]. At present, the common methods of fishery resource assessment are the net survey [3], acoustic survey [4], and eDNA survey [5]. The survey of nets is mainly divided into two categories: mobile nets (such as bottom trawl, truss trawl, middle trawl) and fixed nets (such as gill net and longline fishing). Mobile nets have become the mainstream tool for large-scale continental shelf resource surveys because of their relatively low selectivity, standardized operating parameters, and the ability to provide unbiased body length and age structure data. However, the capture efficiency is affected by many factors, such as fish activity level, circadian rhythm, water temperature, and bait competition, and the effective sampling area is also difficult to quantify [3,6].
Over the past few decades, acoustic survey techniques have become a rapidly developing and integral component of marine fishery monitoring programs [7]. Compared with traditional fishery assessment techniques, acoustic technology enables broader spatial coverage and allows for non-selective, non-lethal sampling. Although acoustic technology offers clear advantages, it cannot accurately identify target species without the use of accompanying nets, which limits its application in certain fishery management activities [8]. Li et al. [9] used a split-beam acoustic system (SIMRAD EY60) in combination with net-based sampling to conduct a quantitative analysis of fish resources in the confluence area of Poyang Lake and the Yangtze River. This study established an acoustic baseline and provided a spatial management framework for evaluating the effectiveness of the fishing ban, designating protected areas, and restoring large-scale spawning grounds along the Poyang Lake–Yangtze River ecological corridor.
Environmental DNA (eDNA) technology, as an emerging method for resource survey and assessment, requires only 1–2 L of water samples or a small amount of sediment [10] to rapidly identify a variety of fish and other aquatic organisms in the samples through high-throughput sequencing [11]. This technology is widely applicable across various aquatic environments, including freshwater, saltwater, and brackish water, enabling the effective monitoring of fish resources in different water bodies, from shallow to deep waters [11,12,13]. Among these, marine sediments serve as the largest reservoir of environmental DNA [5]. When research objectives involve the evolution of fish communities, fish species dependent on benthic habitats, or when water environments are unsuitable for filtration sampling, sediments serve as a superior sampling medium for eDNA technology compared to water samples [14]. Ryan P. Kelly [15] and colleagues used eDNA metabarcoding technology to conduct a census of fish communities with known species compositions at the Monterey Bay Aquarium in the United States, verifying the accuracy of eDNA technology in reconstructing the composition of teleost communities and reflecting relative abundances. This provided a core technical pathway and important parameter basis for establishing a low-cost, non-invasive marine biodiversity monitoring system in California’s nearshore waters in the future.
Although existing methods for assessing fishery resources each have their own advantages, the unique topography of marine ranches and the deployment of artificial reefs cause fish to tend to congregate and inhabit the areas surrounding the reefs, thereby significantly affecting their activity patterns [16]. Furthermore, artificial reefs are typically constructed from materials, such as concrete, that strongly block sound waves, making it difficult for acoustic detection equipment to effectively penetrate the reef structure for internal detection. This limits, to some extent, the effectiveness of acoustic detection methods in areas with artificial reefs [17]. eDNA technology, on the other hand, lacks real-time capabilities; it is qualitative rather than quantitative, and its results are influenced by environmental factors such as season and water flow [18,19].
Given the shortcomings of existing resource survey and assessment methods, this study proposes a combined approach using acoustic detection technology and eDNA technology to investigate and analyze the fish resources and ecosystem status of the Xiangyun Bay Marine Pasture in the Bohai Sea, China (hereinafter referred to as the “Xiangyun Bay Marine Pasture”) through fisheries acoustics and environmental DNA (eDNA) technologies. The Xiangyun Bay Marine Pasture, in the Bohai Sea, is located at the confluence of the Bohai Sea’s vertical warm current zone and the Luan River, with water depths ranging from 6 to 13 m, and serves as a key source of fishery resources in the Bohai Bay. However, due to various factors, such as eutrophication, habitat destruction, and overfishing, the fishery resources in the Xiangyun Bay Marine Pasture have exhibited issues such as a decline in trophic levels, a shift toward smaller-sized populations, and a younger age structure [20,21]. Therefore, understanding the status of fish resources in Hebei’s marine ranches is crucial for achieving the sustainable use of local fishery resources. To restore these resources, this study conducts an in-depth analysis of the local ecosystem’s health and a comprehensive evaluation of the current resource status. It explores whether combining two technical approaches can establish a new method for the comprehensive evaluation of fish resources in marine ranches, thereby providing more comprehensive and efficient data support, offering a solid basis for the scientific management and rational development of fishery resources, and promoting the development and innovation of marine ecological restoration efforts.

2. Materials and Methods

2.1. Sample Collection

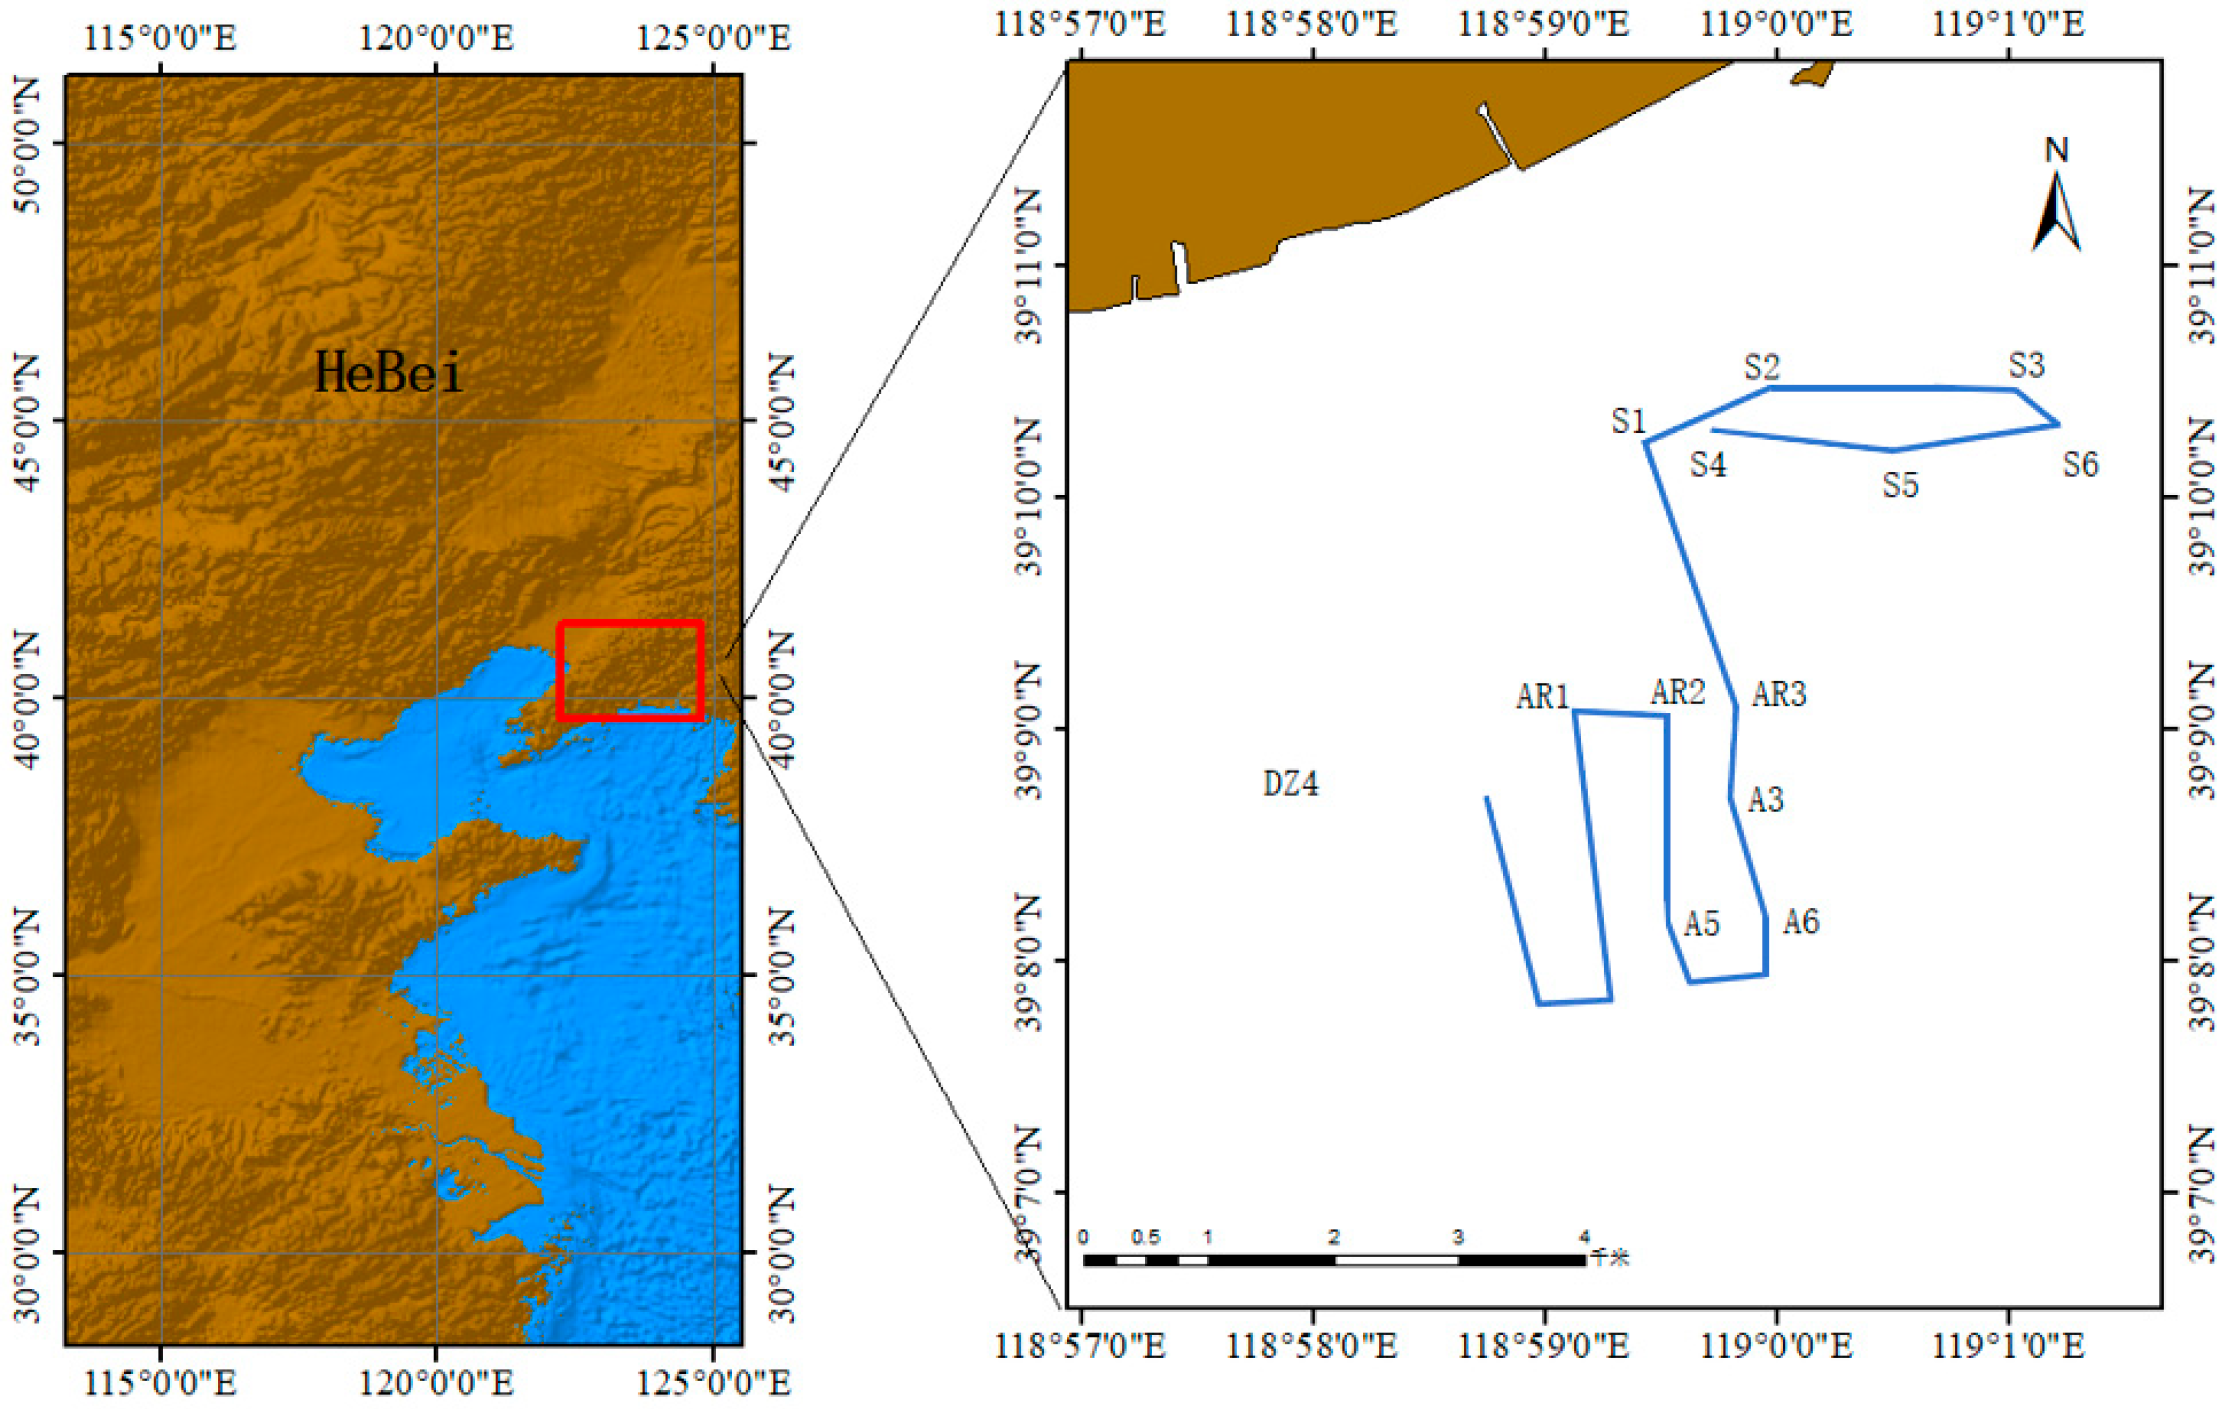
The study area is located at the Xiangyun Bay Marine Pasture in the northern part of the Bohai Sea, China. This area is situated in the southern part of Leting County, Tangshan City, Hebei Province (39°10′15″ to 39°10′54″ N), with water depths ranging from 7 to 15 m. The survey was conducted in October 2024. The acoustic survey transect was designed in accordance with *Marine Survey Specifications—Part 6* (GB/T 12763.6-2007) [22], adopting an equidistant parallel transect configuration. Based on this acoustic survey transect, a total of 13 sampling points were established (Figure 1). The selection of the transect spacing for this survey balanced the requirements for survey duration and accuracy, while also allowing for sufficient time for round trips to the port and for conducting biological trawl sampling.

2.2. Acoustic Survey Method

The primary instruments used in the acoustic survey were a split-beam scientific fish finder (Model EK80, Simrad, Horten, Norway) and a GPS unit (Model 60CSx, Garmin, Olathe, KS, USA). The scientific fish finder’s transceiver (WBT) (Model EK80, Simrad, Horten, Norway) was connected to a laptop via Ethernet for sonar control and data acquisition; dedicated software EK80 (Model EK80, Simrad, Horten, Norway) was used to collect and record acoustic data. The GPS was connected to the laptop via an RS232 serial port to obtain real-time latitude and longitude information.
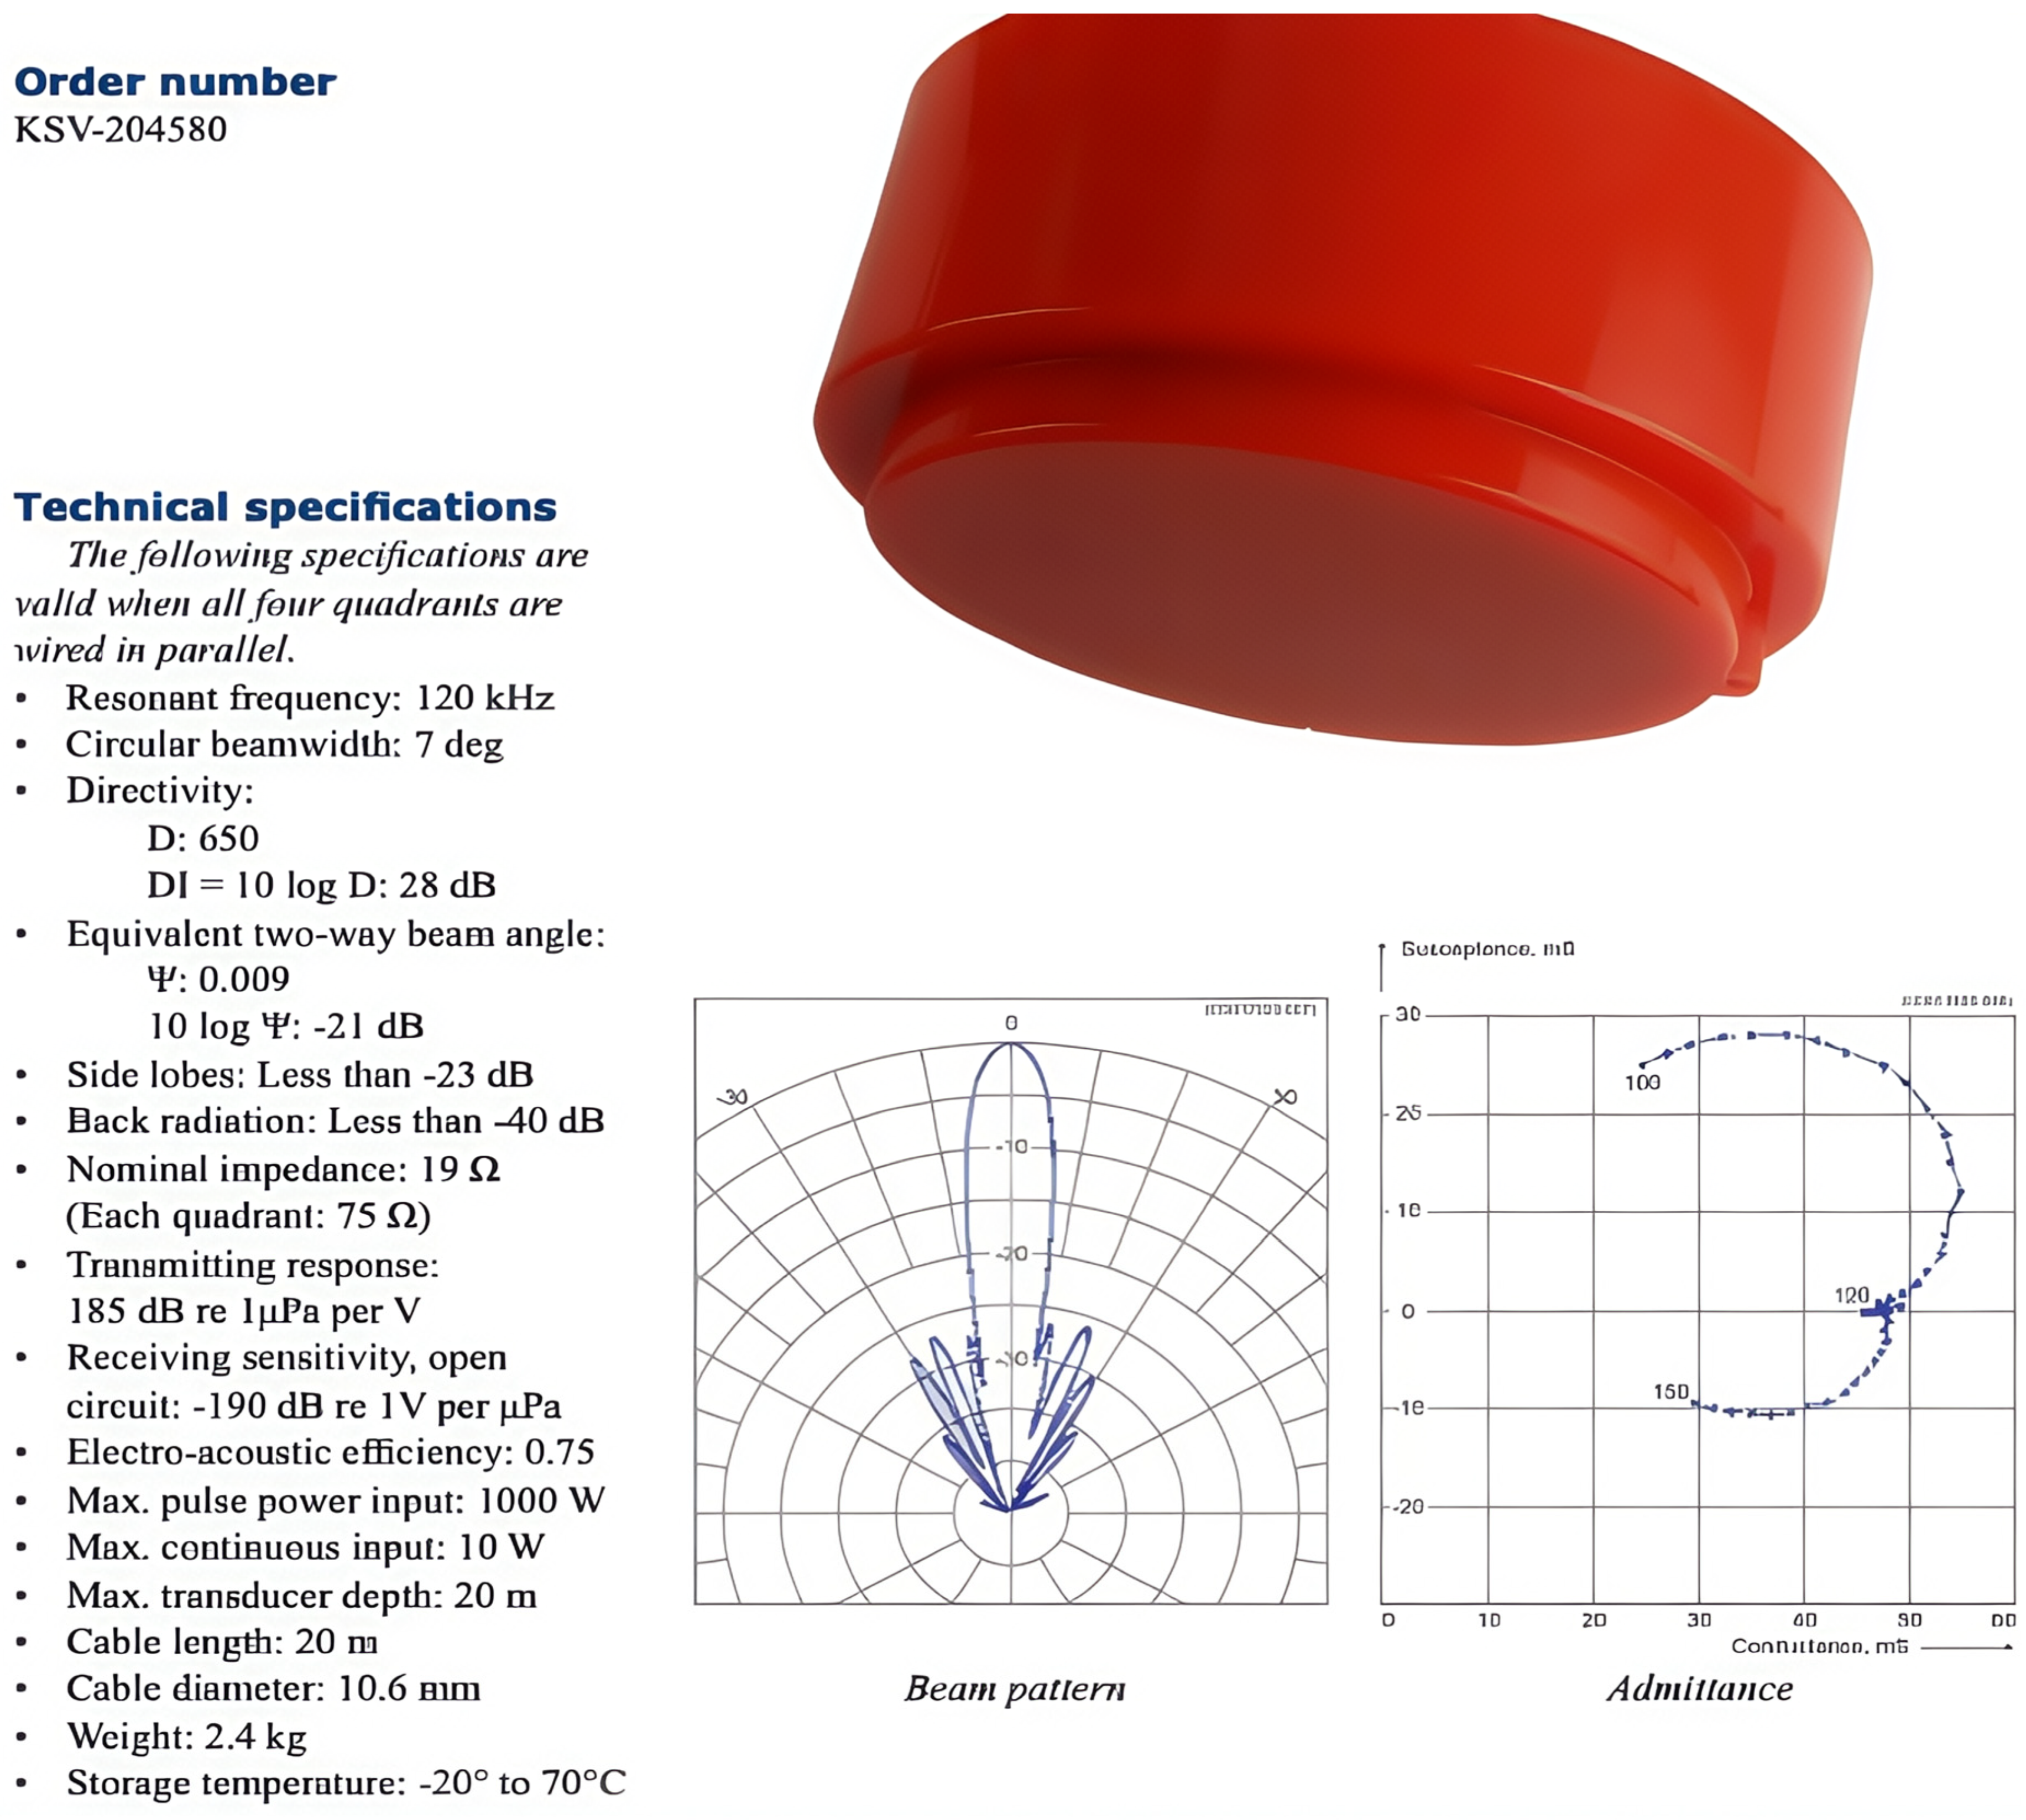
The transducer (Model KSV-204580 (Model KSV-204580, Simrad, Horten, Norway), with all four quadrants wired in parallel) operated at a center frequency of 120 kHz with an operating bandwidth of 90–170 kHz. It featured a half-power beamwidth of 7°, a directivity index of 28 dB, and an equivalent two-way beam angle of −21 dB (Ψ = 0.009). Side lobe levels were below −23 dB and back radiation was below −40 dB. The transmitting voltage response (TVR) was 185 dB re 1 μPa/V; the open-circuit receiving sensitivity was −190 dB re 1 V/μPa, with an electro-acoustic efficiency of 0.75. Other electrical specifications included a nominal impedance of 19 Ω (75 Ω per quadrant), a maximum pulse power input of 1000 W, a maximum continuous power input of 10 W, and a maximum operating depth of 20 m (Figure 2). The absorption coefficient and sound speed were calculated by the instrument based on a computational model using in situ water temperature measurements to compensate for echo intensity and distance. The absorption coefficient and sound speed were calculated by the instrument based on a computational model using in situ water temperature measurements to compensate for echo intensity and distance. The transducer was suspended on the port side of the hull at a draft of 0.5 m. Sampling was conducted using the navigation cross-section biological echo method at a speed of approximately 5 kn.

2.2.1. Regional Division

Based on the actual survey route and the sampling sites of the traditional net survey, the survey area was divided into five areas for resource statistics. The average water depth in each area and the volume of water swept by the route was directly exported into the software.

2.2.2. Acoustic Echo Image Data Processing

The special evaluation software, Echoview (8.0, Echoview Software Pty Ltd., Hobart, Australia), was used for acoustic data processing and resource assessment; the echo integration method was used to calculate resource density and analyze spatial distribution characteristics.
During the processing of echo image data, different types of echo images are classified and images, such as sea surface, navigation bubble echo, plankton, cavitation noise, and lake bottom multiple echo, are eliminated. The upper limit of the surface integral and the lower limit of the bottom integral are reset, the fish group and individual fish image data used to evaluate fishery resources are retained, and the average sound absorption coefficient (Sound Absorption Coefficient, hereinafter referred to as the “sa”) of each area is output.

2.2.3. Fish Target Intensity

The fish target intensity is estimated using the length of the caught object. Based on the average body length of different fish, the empirical formula of body length and target intensity (the following formula) is used to calculate the average target intensity of different fish:
TS i = 20   log L cmi + b 20 i
Among these, “i” represents the type of fish, and “Lcm” is the body length of the fish in cm (Using total length “TL”). The value of “b20” was determined based on the morphological differences of the sampled fish species, following relevant specifications and studies in the literature: −67.4 dB is used for closed swim bladder fish and −71.9 dB for tube swim bladder fish. The composition ratio (frequency distribution) of different fish populations is calculated based on the actual number of catches.

2.2.4. Resource Density

According to the set EDSU interval and the integral value “sa” obtained by its measurement, the fish resource density per unit water surface (m2) in this section can be calculated:
ρ = sa σ bs
where “σbs” is the fish backscattering cross section (m2), and its relationship with TS is:
TS = 10   lg σ bs .
The target strength of fish can be calculated by Formula (1) through the sampling composition of fish. For different fish compositions, “sa” requires species allocation:
sa i = sa p i σ bs   i ¯ i = 1 k p i σ bs   i ¯ .
Among these, “p” is the composition percentage of sampled fish, “pi” represents the type of fish, and pi is calculated by sampling fish species using nets. The denominator is the weighted average of the target strengths (linear values) of different fish species. The average value of different body lengths of a single fish species also needs to be weighted and calculated according to the quantitative composition of the body length. The density of each fish species per unit water surface is:
ρ i ¯ = sa i σ bs   i ¯ .

2.3. eDNA Technology Method

2.3.1. Sediment Sample Collection and Processing

This study was conducted in accordance with the survey plan for the Xiangyun Bay National Marine Pasture in Tangshan, Hebei, as part of the National Key Research and Development Program project entitled “Construction and Integrated Development Model of an Ecological Smart Marine Pasture in the Yellow and Bohai Seas.” Thirteen sampling points were established along the acoustic survey route to cover the entire Xiangyun Bay Marine Pasture. Sediment samples were collected at a depth of 2.0 cm from the surface using a DDCI-2 grab sampler. The collected samples were stored temporarily in sterile, sealed bags with dry ice and subsequently transported to the laboratory for storage in a low-temperature freezer pending further processing.

2.3.2. DNA Extraction, PCR Amplification, and the Sequencing of Illumina

DNA was extracted from 0.25 g of sediment using the DNeasy PowerSoil kit (QIAGEN, Hilden, Germany) following the manufacturer’s instructions. A negative control without sediment was added to each extraction step; three DNA replicates were extracted from each sample. The hypervariable region of the fish 12s RNA gene (163–185 bp) was amplified. The study used primers Mi-Fish (GTCGGTAAAACTCGTGCCAGC, CATAGTGGGGTATCTAATCCCAGTTTG) [23]. Six nucleotide tag sequences were added to the 5′ ends of all forward and reverse primers for multiplex sorting of PCR products and the construction of unique sequencing libraries. The total volume of the PCR reaction system was 30 μL, including 15 μL Pusion High-Fidelity PCR Master Mix (New England Biolabs, Ipswich, MA, USA), 0.2 μM forward and reverse primers, and approximately 10 ng template DNA. The thermal cycle program was set as follows: pre-denaturation at 98 °C for 1 min, followed by 30 cycles (denaturation at 98 °C for 10 s → annealing at 50 °C for 30 s → extension at 72 °C for 30 s), and, finally, a final extension at 72 °C for 5 min. A PCR blank control without DNA was set for each amplification experiment. A DNA-free PCR blank control was included in each amplification experiment. After mixing each PCR product with an equal volume of 1× loading buffer, the products were analyzed by 2% agarose gel electrophoresis. Three replicate PCR products of the same sample were mixed in an isoelectric density ratio; the mixed products were purified using the QIAGEN Gel Extraction Kit (QIAGEN, Hilden, Germany).
The sequencing library was prepared using the TruSeq DNA PCR-free sample preparation kit (Illumina, San Diego, CA, USA), according to the instructions. The library quality was detected using Qubit and real-time PCR for quantification. The sequencing work was completed on the NovaSeq 6000 platform at Novogene Bioinformatics Technology Co., Ltd. (Beijing, China).

2.3.3. Sequence Processing

Based on sample-specific barcodes, raw paired-end sequencing reads were demultiplexed using Python (version 3.6.13); sequence trimming was performed using Cutadapt (version 3.3) with the --minimum-length parameter. Eligible sequences were assembled using FLASH (version 1.2.11) with the -min-overlap parameter [24], followed by quality filtering using fastp (version 0.23.1) with the -q parameter [25]. VSEARCH (version 2.16.0) was used to align the sequences against a reference database and remove chimeric sequences. Sequence clustering was performed using Uparse (v7.0.1001), which grouped valid sequences into operational taxonomic units (OTUs) based on a 97% similarity threshold. Representative sequences from each OTU were selected for species annotation using the MitoFish database as the reference database [26]. Based on the annotation results and the OTU abundance tables for each sample, a species-level relative abundance table was constructed.

2.3.4. Statistical Analysis

Taxonomic composition at the species level in the 13 sites was visualized using the R package ggplot 2. The Shannon and Chao1 indices were calculated and visualized using R software (V4.0.3) as indicators of α-diversity. Before calculating the two α-diversity indices, the data for each sample were normalized based on the sample with the minimum number of sequences. The top 35 taxa with the highest relative abundance at each taxonomic level in each sample were selected and visualized using the pheatmap package in R package.

2.4. Traditional Net Survey Method

Sampling using traditional fishing gear was conducted to provide acoustic–DNA cross-validation. The entire process strictly adhered to the relevant provisions of the *Marine Survey Specifications, Part 6* (GB/T 12763.6-2007) [22]. In the field, standard survey nets for the Yellow and East China Seas—single-vessel winged single-bag trawls—were used, with a mesh size of 54 mm selected for each trawl bag. Each station was towed for one hour and the towing speed was maintained at 5 kn. For each haul, the catch was sorted by species and recorded by weight and the number of individuals. Biological measurements were conducted for key species; identification was based on *Fish of the Bohai Sea* [27].

3. Results

3.1. Acoustic Survey Results

3.1.1. Length and Weight of the Catch Through Acoustic Technology

Based on the biological parameters of each fish species obtained from traditional gillnet surveys (see Section 3.3 for details), the target strength (TS) and contribution to the total acoustic echo integral for each species were calculated using Equation (1)–(5). The results are shown in Table 1. As shown in Table 1, there are significant differences in the individual sizes of different fish species, with average total lengths ranging from 2.25 to 24.10 cm and average weights ranging from 5.68 to 139.99 g. Among them, the Brown flounder (Paralichthys olivaceus) had the largest average body length (24.10 cm) and average body weight (139.99 g), while the Speartailed goby (Chaeturichthys stigmatias) had the smallest average body length (2.25 cm) and average body weight (5.68 g).
In terms of acoustic contribution, the Indian flathead (Platycephalus indicus) (84.17%) had the greatest contribution, followed by the Fat greenling (Hexagrammos otakii) (35.75%). Although the Speartailed goby had the highest proportion by number (47.37%) (see Table 1), its acoustic contribution rate was only 11.29% due to its extremely small size (TS = −60.4 dB), indicating that target intensity significantly affects the acoustic echo integral. The contribution rates of the remaining fish species were all below 10%.

3.1.2. Resource Abundance Density Obtained Based on Acoustic Method

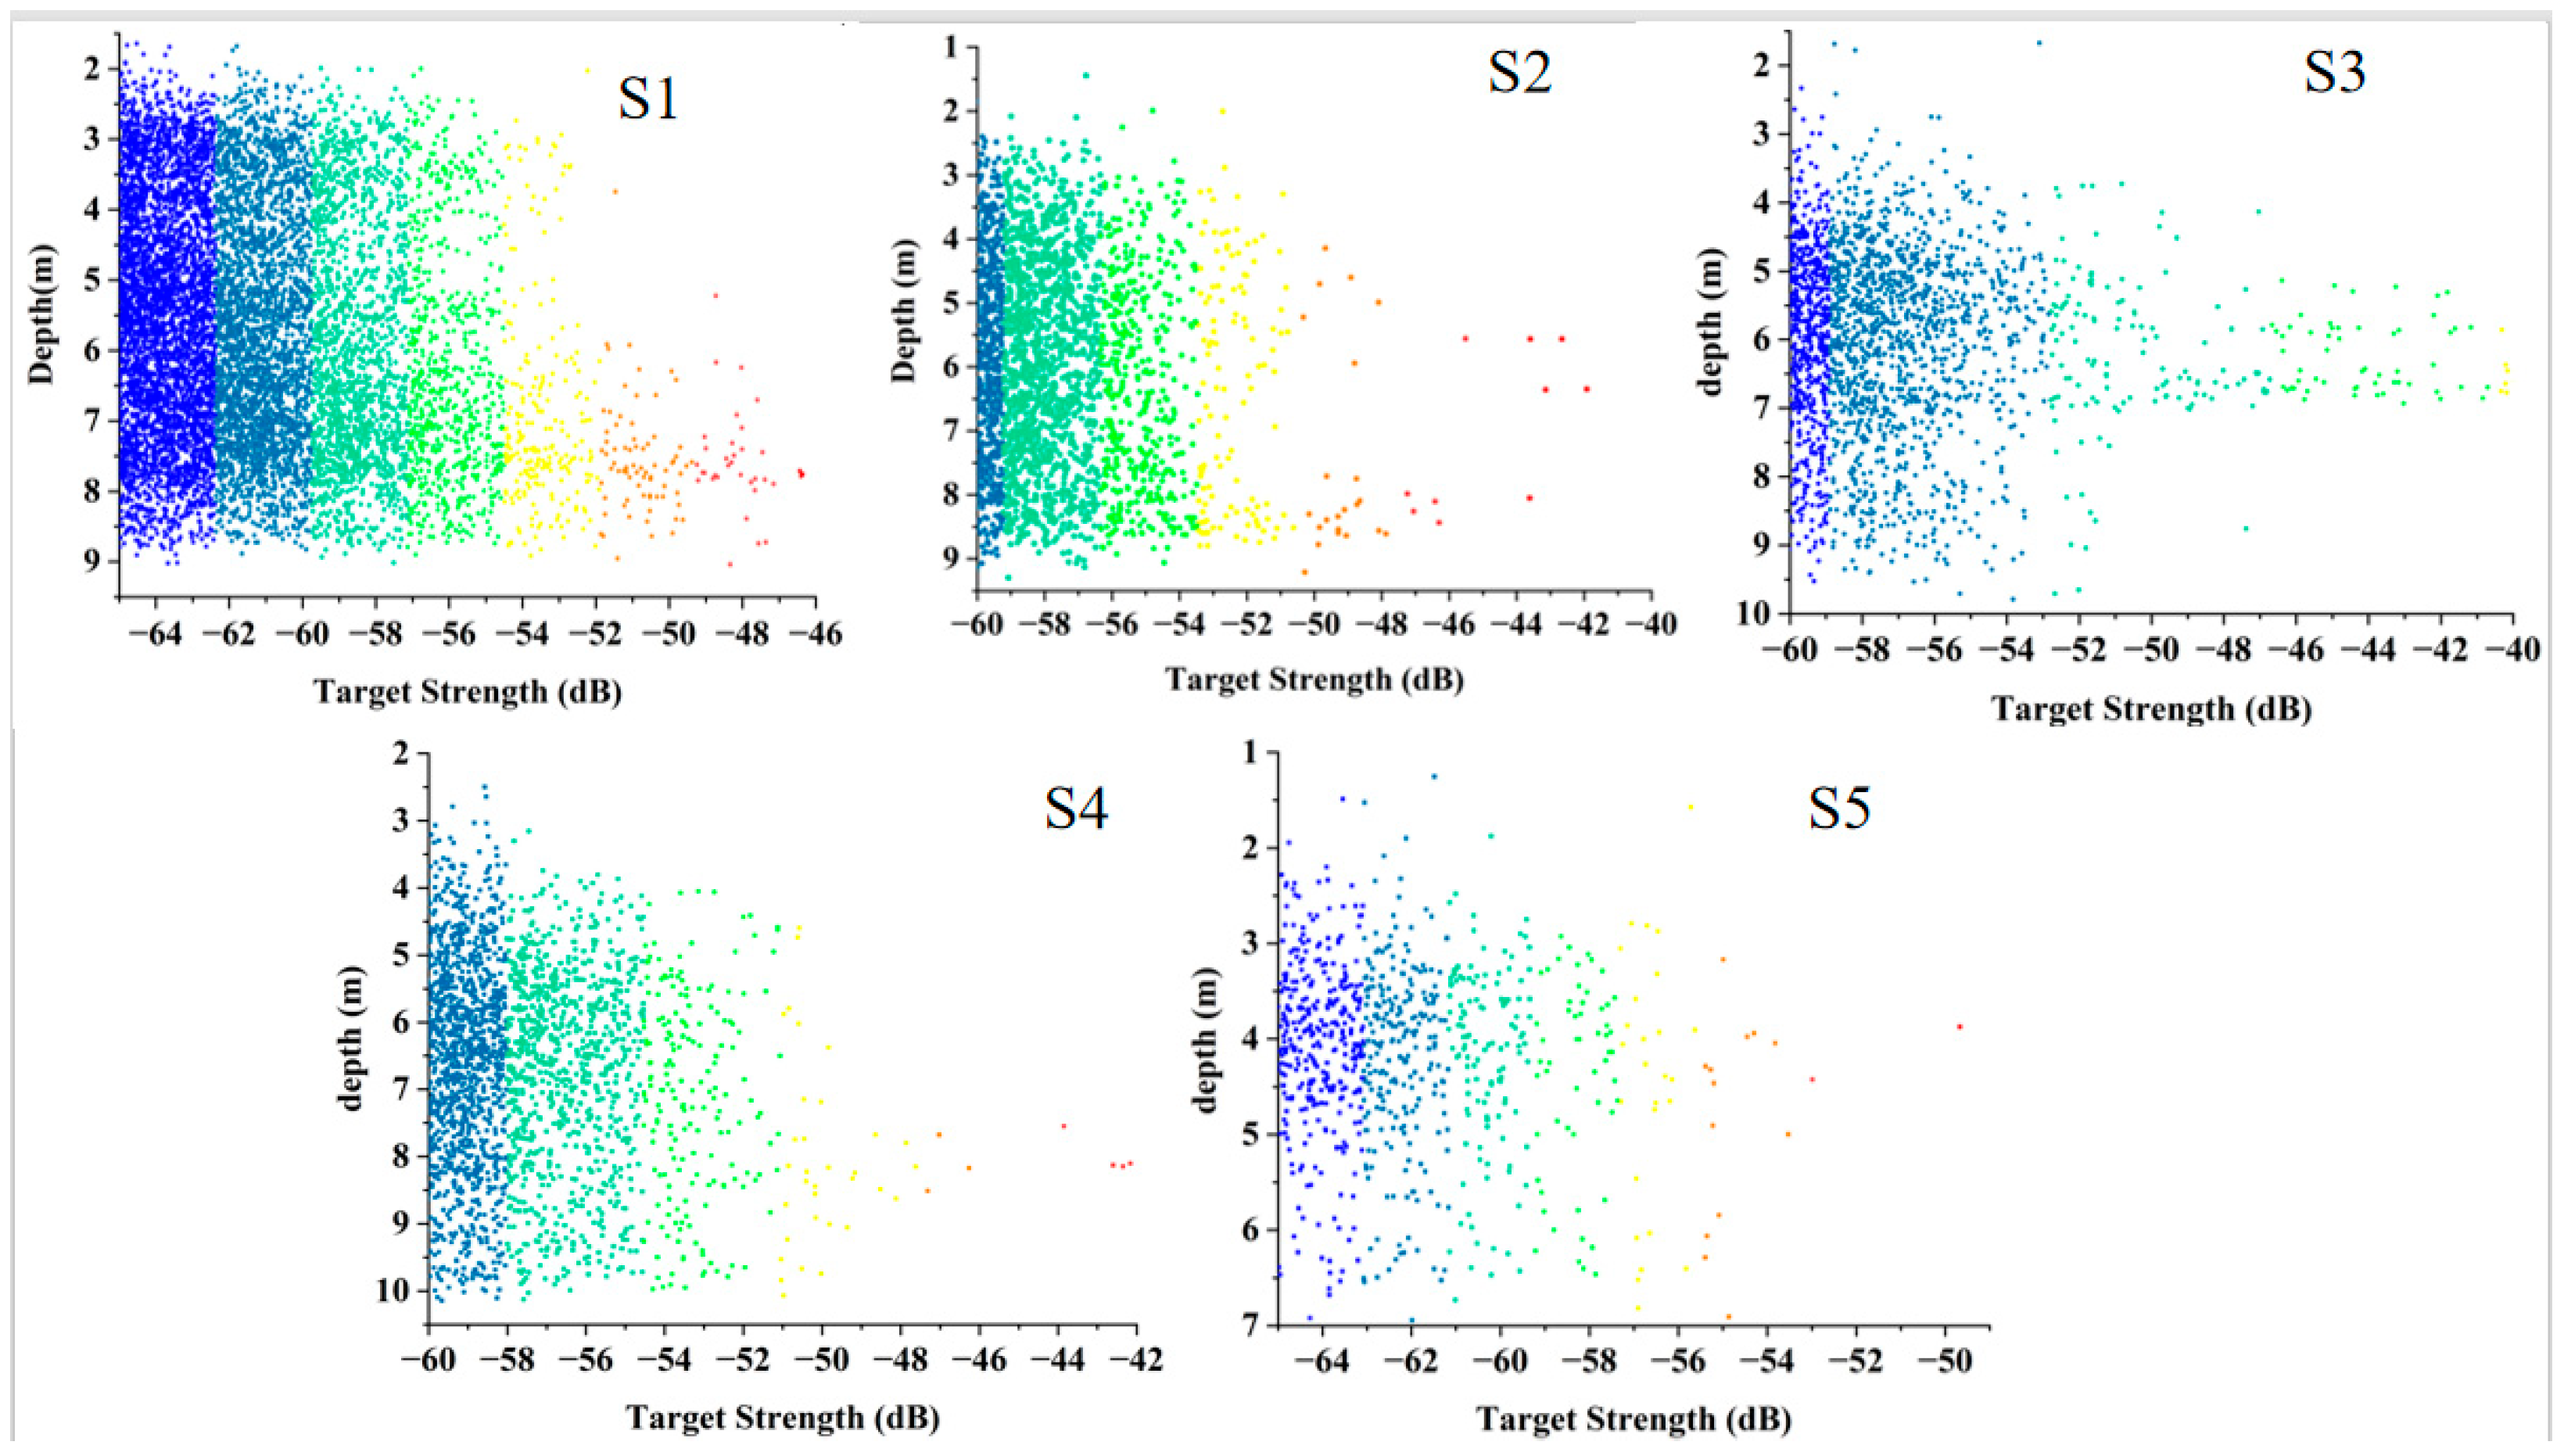
The horizontal distribution of fish resources in the Xiangyun Bay Marine Pasture is represented by survey zones S1 through S5. The results show that fish resources are unevenly distributed across the zones (Table 2). Among them, Zone S5 has the highest fish abundance density at 9.376 × 10⁻⁵ ind/m2, which is 55% higher than that of Zone S2 (6.047 × 10⁻⁵ ind/m2), the zone with the lowest density. The densities in sections S1, S3, and S4 increased in that order, at 6.105 × 10⁻⁵, 6.289 × 10⁻⁵, and 7.508 × 10⁻⁵ ind/m2, respectively, showing a gradual upward trend with increasing water depth, although all were lower than that of S5. The distribution of the target signal intensity was concentrated between −67 and −46 dB, corresponding to dominant, small reef-dwelling fish with body lengths of 8–10 cm. Overall, the shallow waters of S5 exhibited the highest density, while densities in the remaining areas increased with depth.

3.1.3. Vertical Distribution of Target Intensity

The individual detection of fish target intensity was performed on the acoustic data in each area, and its vertical distribution is as shown in the Figure 3. The fish target intensity (TS) of Xiangyun Bay Marine Ranch shows an obvious “weak-strong-weak” stratification characteristic with depth and is basically distributed in the 1–10 m water layer: no individuals were detected in the 0–1 m surface water layer, possibly due to the influence of navigation bubbles and lateral avoidance, and the TS was lower than −65 dB throughout the whole process. The 1–3 m water layer is a concentrated distribution zone and the main peak of TS was located at −55 dB to −47 dB, corresponding to dominant small individuals such as Speartailed goby (Chaeturichthys stigmatias), Indian flathead (Cynoglossus semilaevis) and Tongue sole (Platycephalus indicus) at 8–12 cm. The density accounted for 60–70% of the total detected in each layer and maintained the same depth range in different research waters, indicating that 1–2 m above the top of the reef was the most active feeding and cruising zone for small reef-dwelling fish. The TS signal near the bottom below 3 m weakened again, but strong scatterers of −47 dB to −42 dB appeared sporadically, which were speculated to be large individuals, such as Olive flounder (Paralichthys olivaceus) and Schlegel’s black rockfish (Hexagrammos otakii), living on the reef. Their appearance depth was consistent with the average water depth in each area (S1 4.75 m, S2 4.77 m, S3 5.13 m, S4 5.53 m, S5 3.22 m) and moved slightly downward as the water depth increased. Combined with the net sampling results, it shows that the reef base is a shelter for large fish.

3.2. eDNA Technology Analysis Results

3.2.1. Data Overview

A total of 13 samples were studied and 1,172,005.0 paired-end reads (Rawb PE) were obtained from the sequencing platform. Fastp 0.23.1 software was used to perform quality filtering on the raw tags and 1,091,731.0 tags were obtained by splicing. Sequence analysis was performed using Uparse v7.0.1001 software [28] and 1395 OTUs were obtained. Q30 was >97%, and the low-quality filtration ratio of samples was <0.11%. In order to ensure that the sequencing depth used for comparison between samples was consistent, 48,994 reads were selected for each sample for subsequent analysis to ensure that the sequencing depth was the same.

3.2.2. Community Composition and Distribution

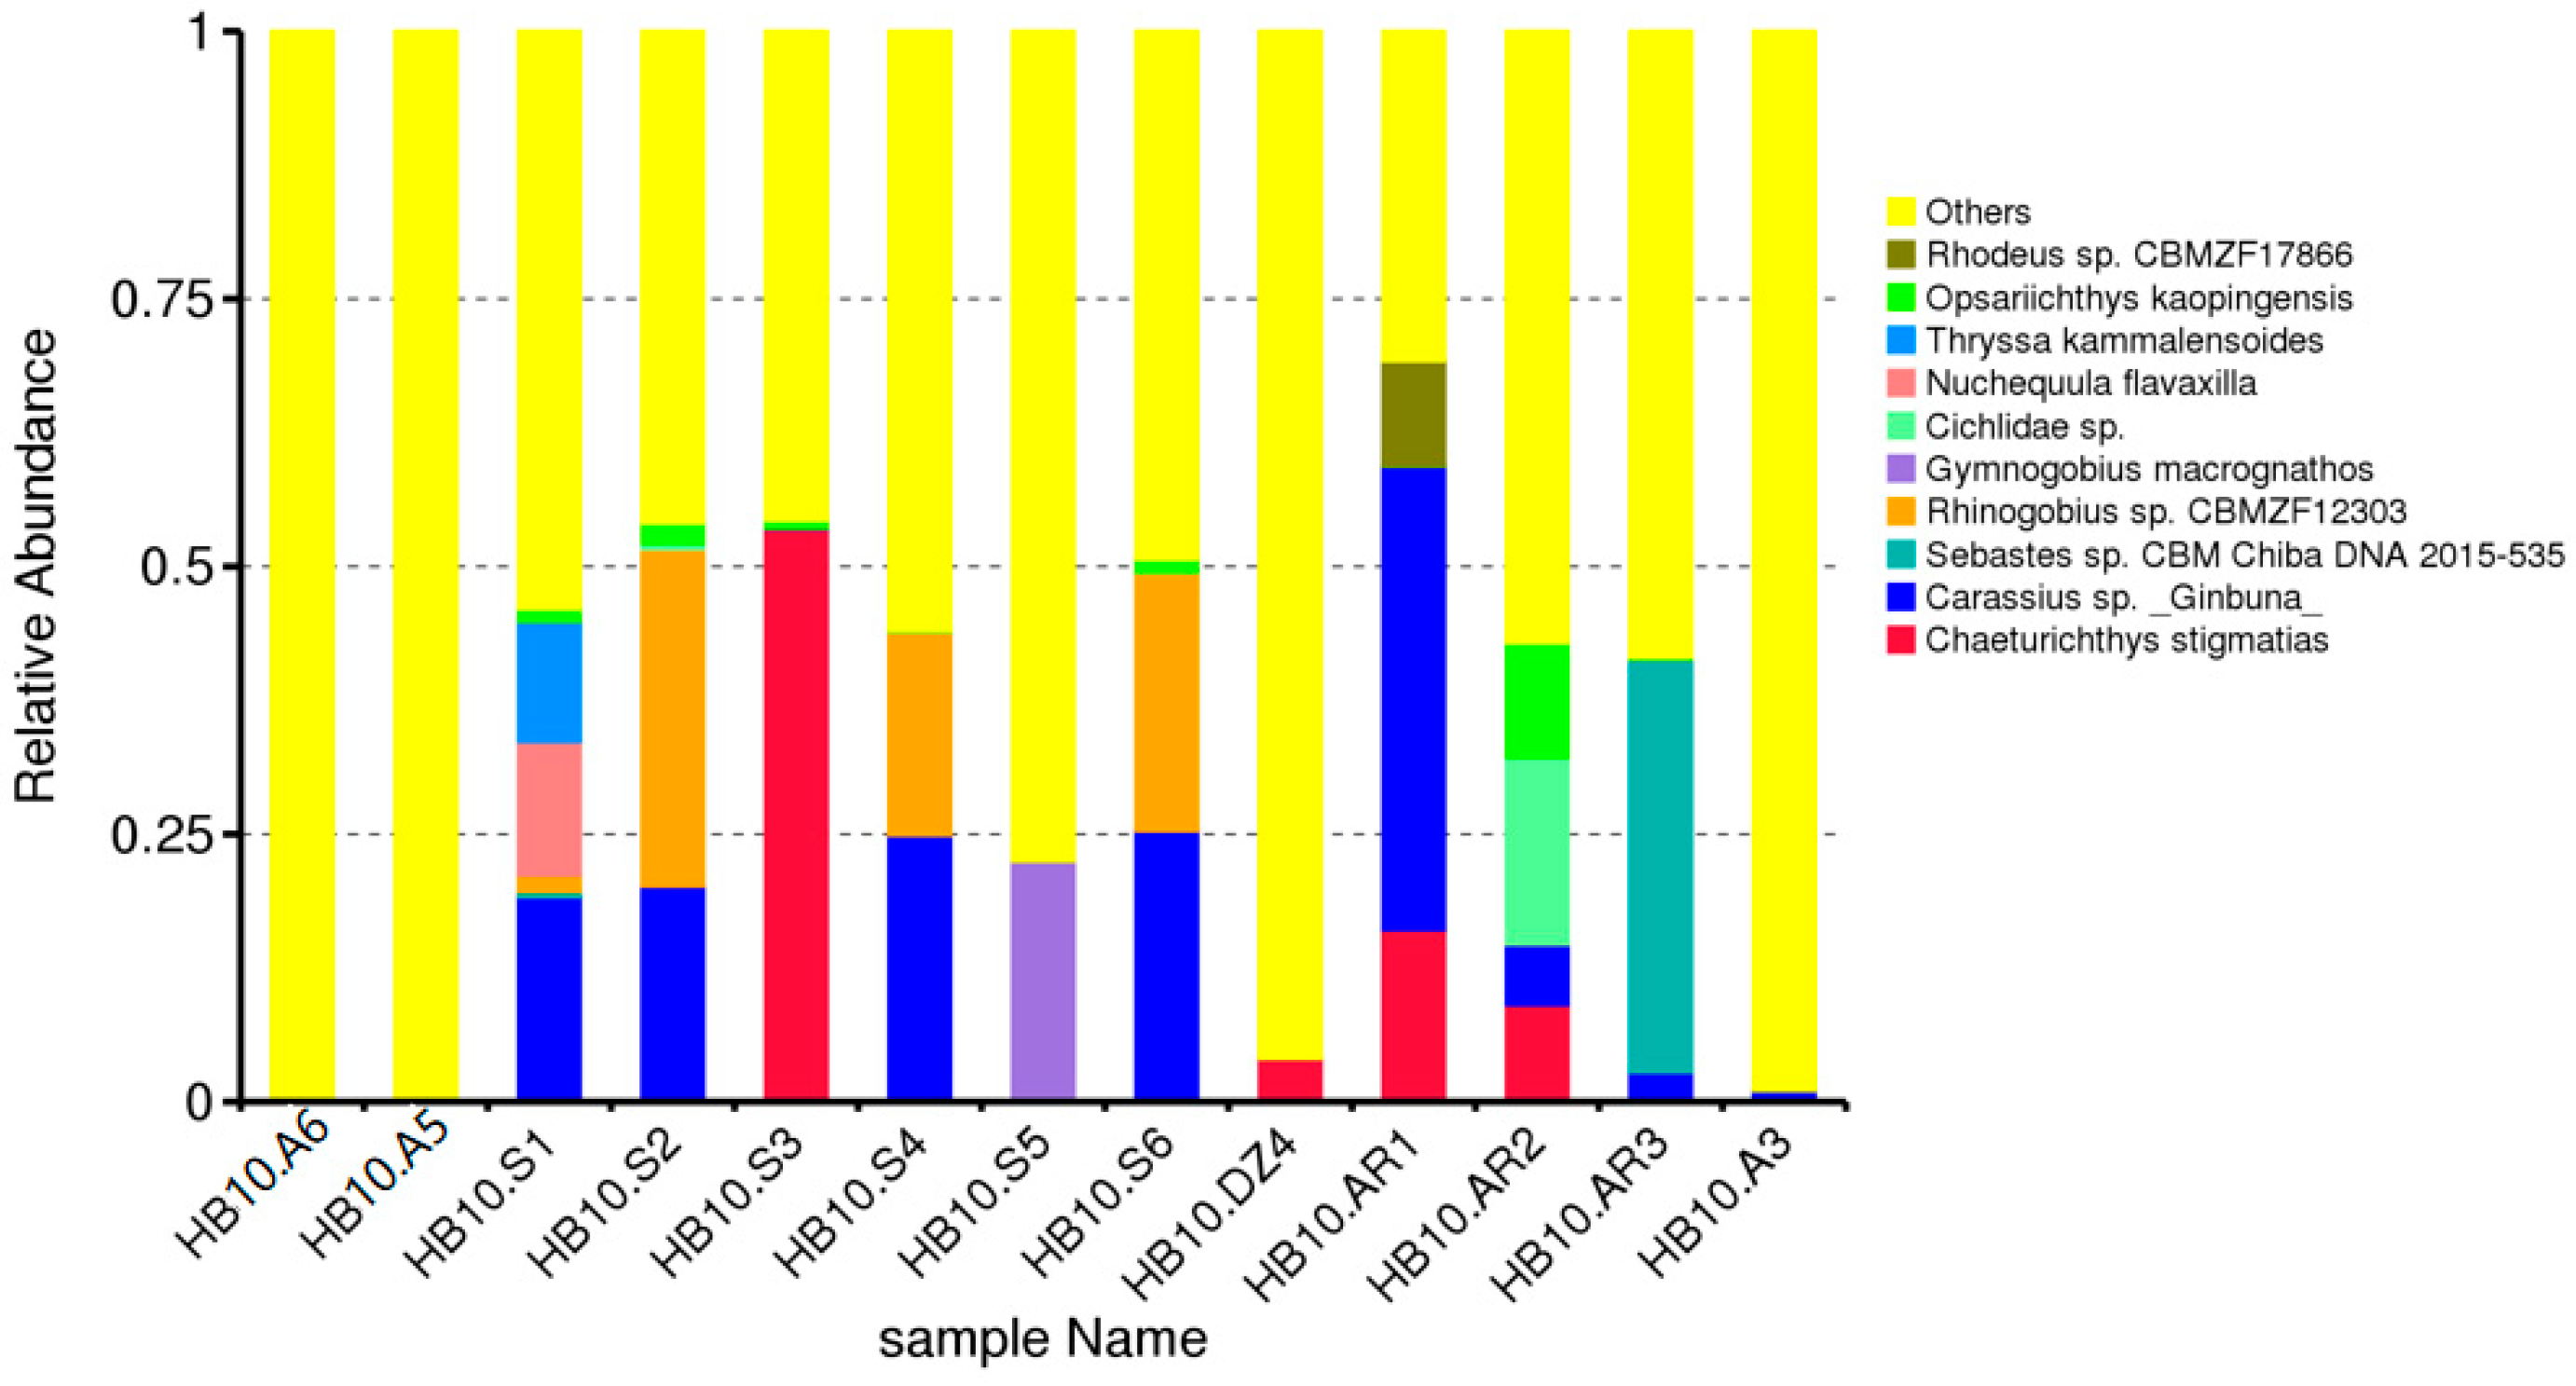
As shown in Figure 4, the top 10 species by relative abundance at the OTU level primarily include Yellow-spotted slipmouth, Kammal thryssa, Large-mouth naked goby, and several undetermined species (such as Carassius sp., Sebastes sp., Rhinogobius sp., etc.). From the perspective of distribution pattern, the Rhinogobius sp. and Carassius sp. account for a prominent proportion of community abundance in most study areas (such as HB10.S1, HB10.S2, HB10.S4, HB10.S6, HB10. AR1, HB10. AR2, and HB10. AR3) and are the main dominant fish species; the abundance of Speartailed goby is significantly increased in HB10.S3, with attachment sexual and cave-dwelling taxa (such as undetermined species of the genus Carassius) accounting for relatively high proportions. Among the samples named after ‘AR’, the genus Carassius accounts for a prominent proportion in HB10: AR1, the Kaoping River minnow (Opsariichthys kaopingensis), accounts for a prominent proportion in HB10; AR2, the genus Sebastes, accounts for a prominent proportion in HB10; and AR1, the species evenness of the “AR series”, is low and each sample has an obvious dominant fish species. In the sample named ‘A’, no dominant fish species is shown.

3.2.3. Alpha Diversity

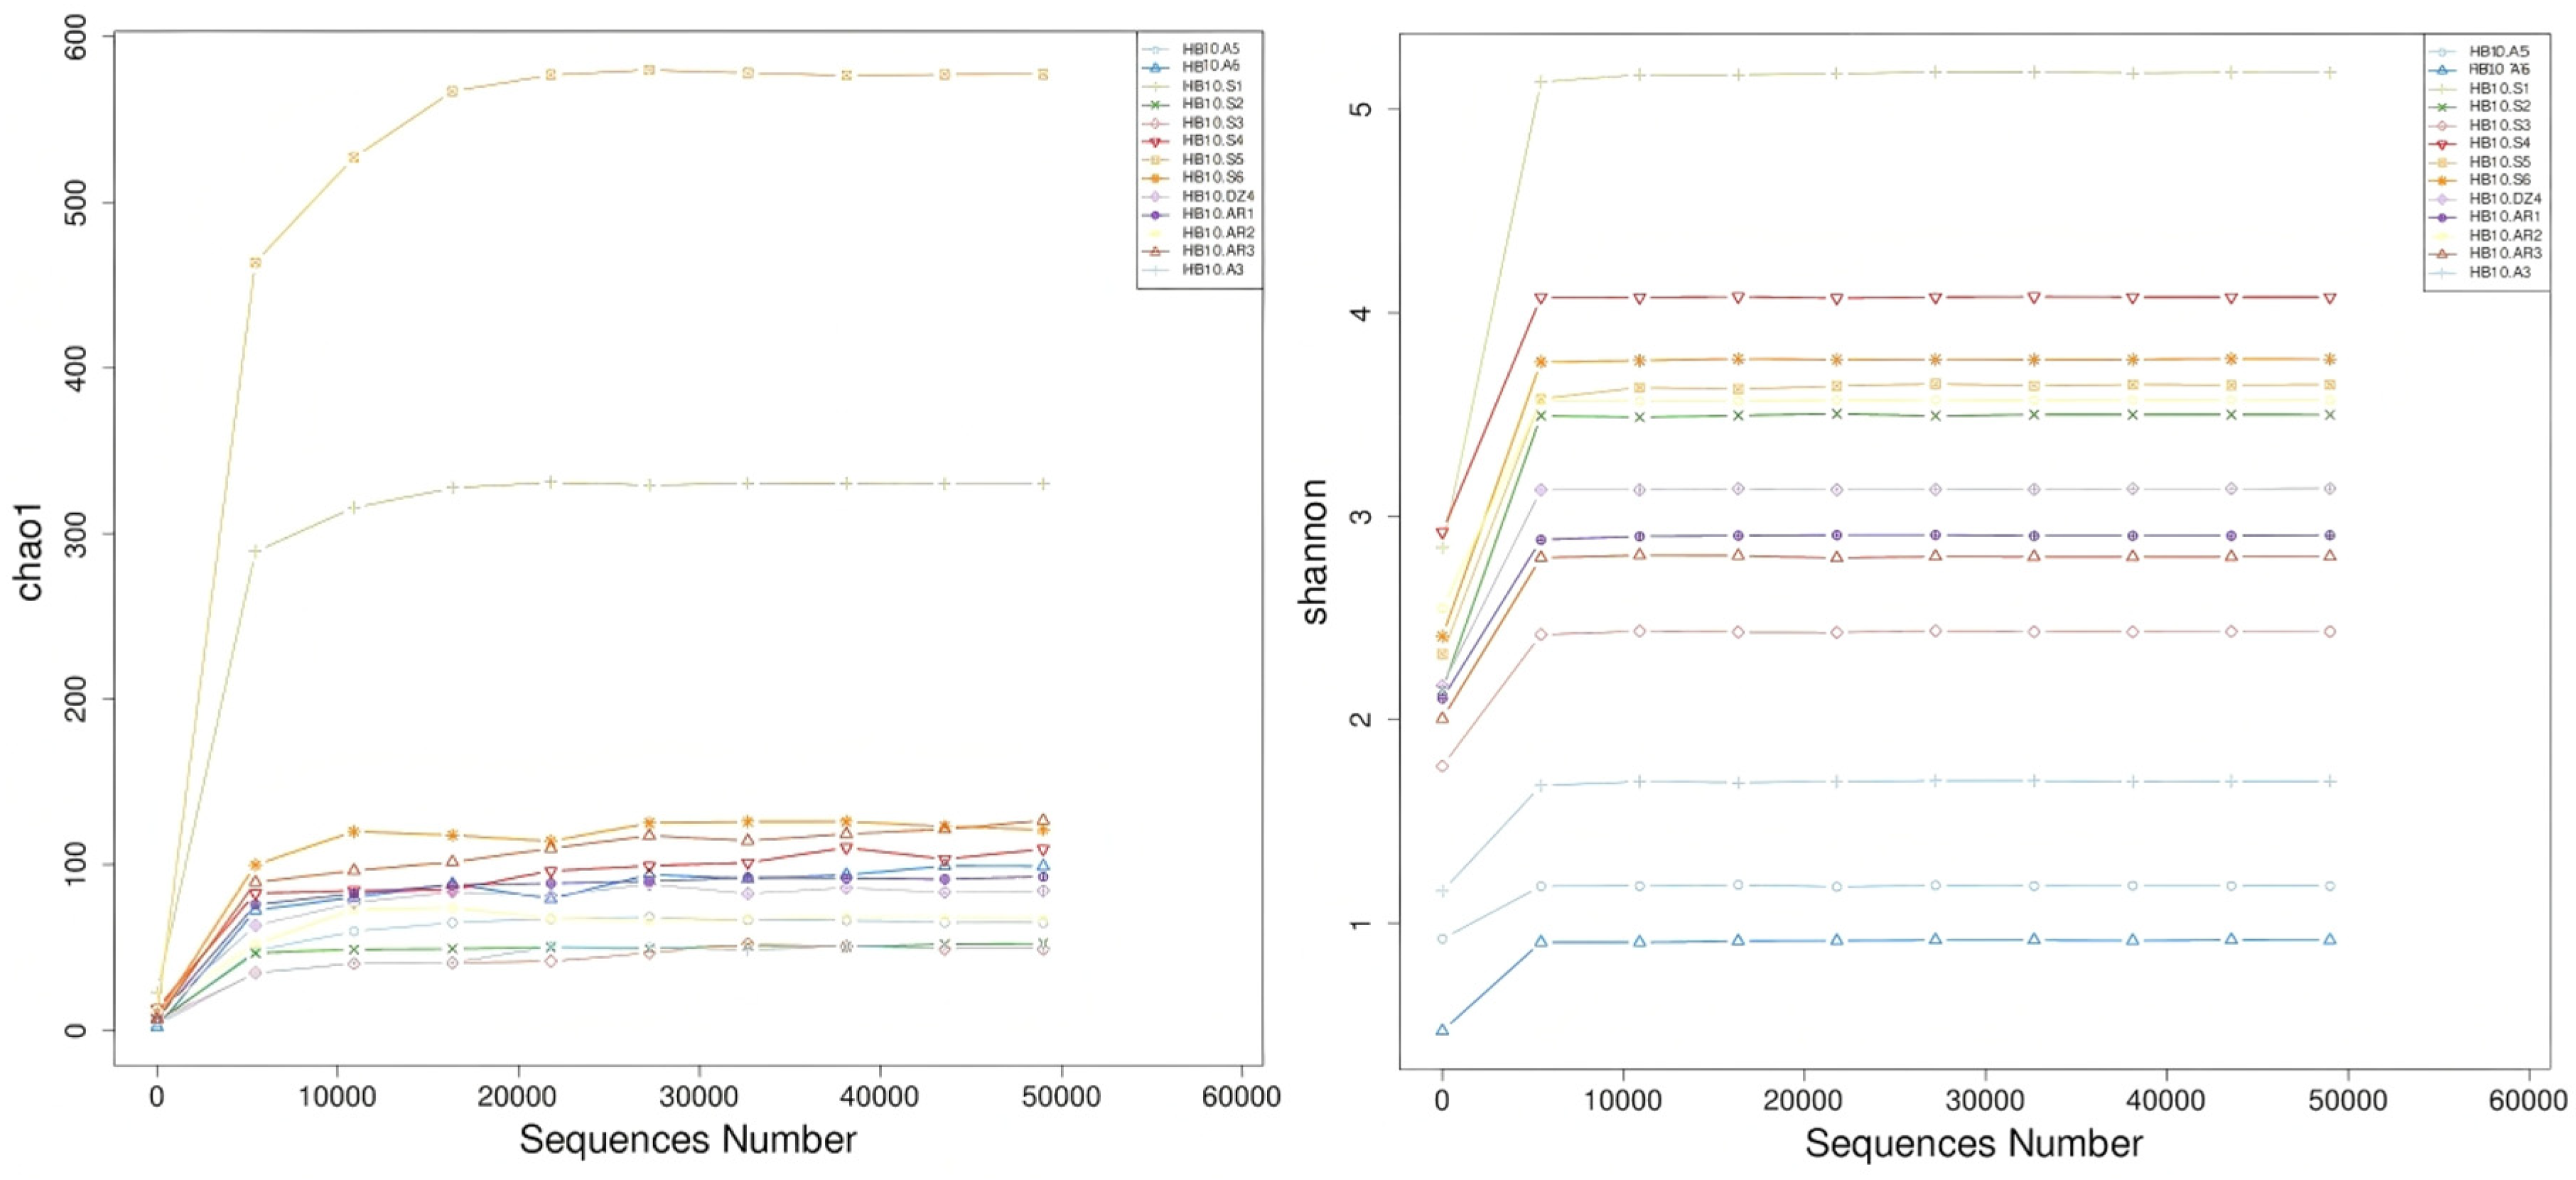
Alpha diversity indices of fish eDNA were analyzed across different sampling sites in the Xiangyun Bay Marine Ranch (Figure 5). The Chao1 curve showed that species richness changed with sequencing depth and could be divided into three groups: HB10.S5 and HB10.S1 had the highest species richness. The sites curves are as follows: HB10.S6, HB10. AR3, HB10. S4, HB10. AR1, HB10. A6 and HB10. DZ were densely overlapped, and the species richness was highly similar. The species richness of HB10 is as follows: AR2, HB10. A5, HB10. S2, HB10. A3 and HB10. S3 was about 60% lower than that of the highest group. The slope of all curves approached zero after 30,000 reads, indicating that the sequencing depth was sufficient to capture more than 95% of species information. Shannon index analysis showed that HB10. S1 and HB10. S4 sites were higher than 4, which were at a high level. The end of HB10. S2, HB10. S3, HB10. S5, HB10. S6, HB10. AR1, HB10. AR2, HB10. AR3 and HB10. DZ4 was stable at 2–4, which is a medium level; HB10. A3, HB10. A5 and HB10. A6 were flat before 10,000 reads, and the end point was < 2, which was low level. The Shannon index of most sites tended to be stable at 10,000 reads, and no longer increased after 30,000 reads, indicating that the sequencing was close to saturation.
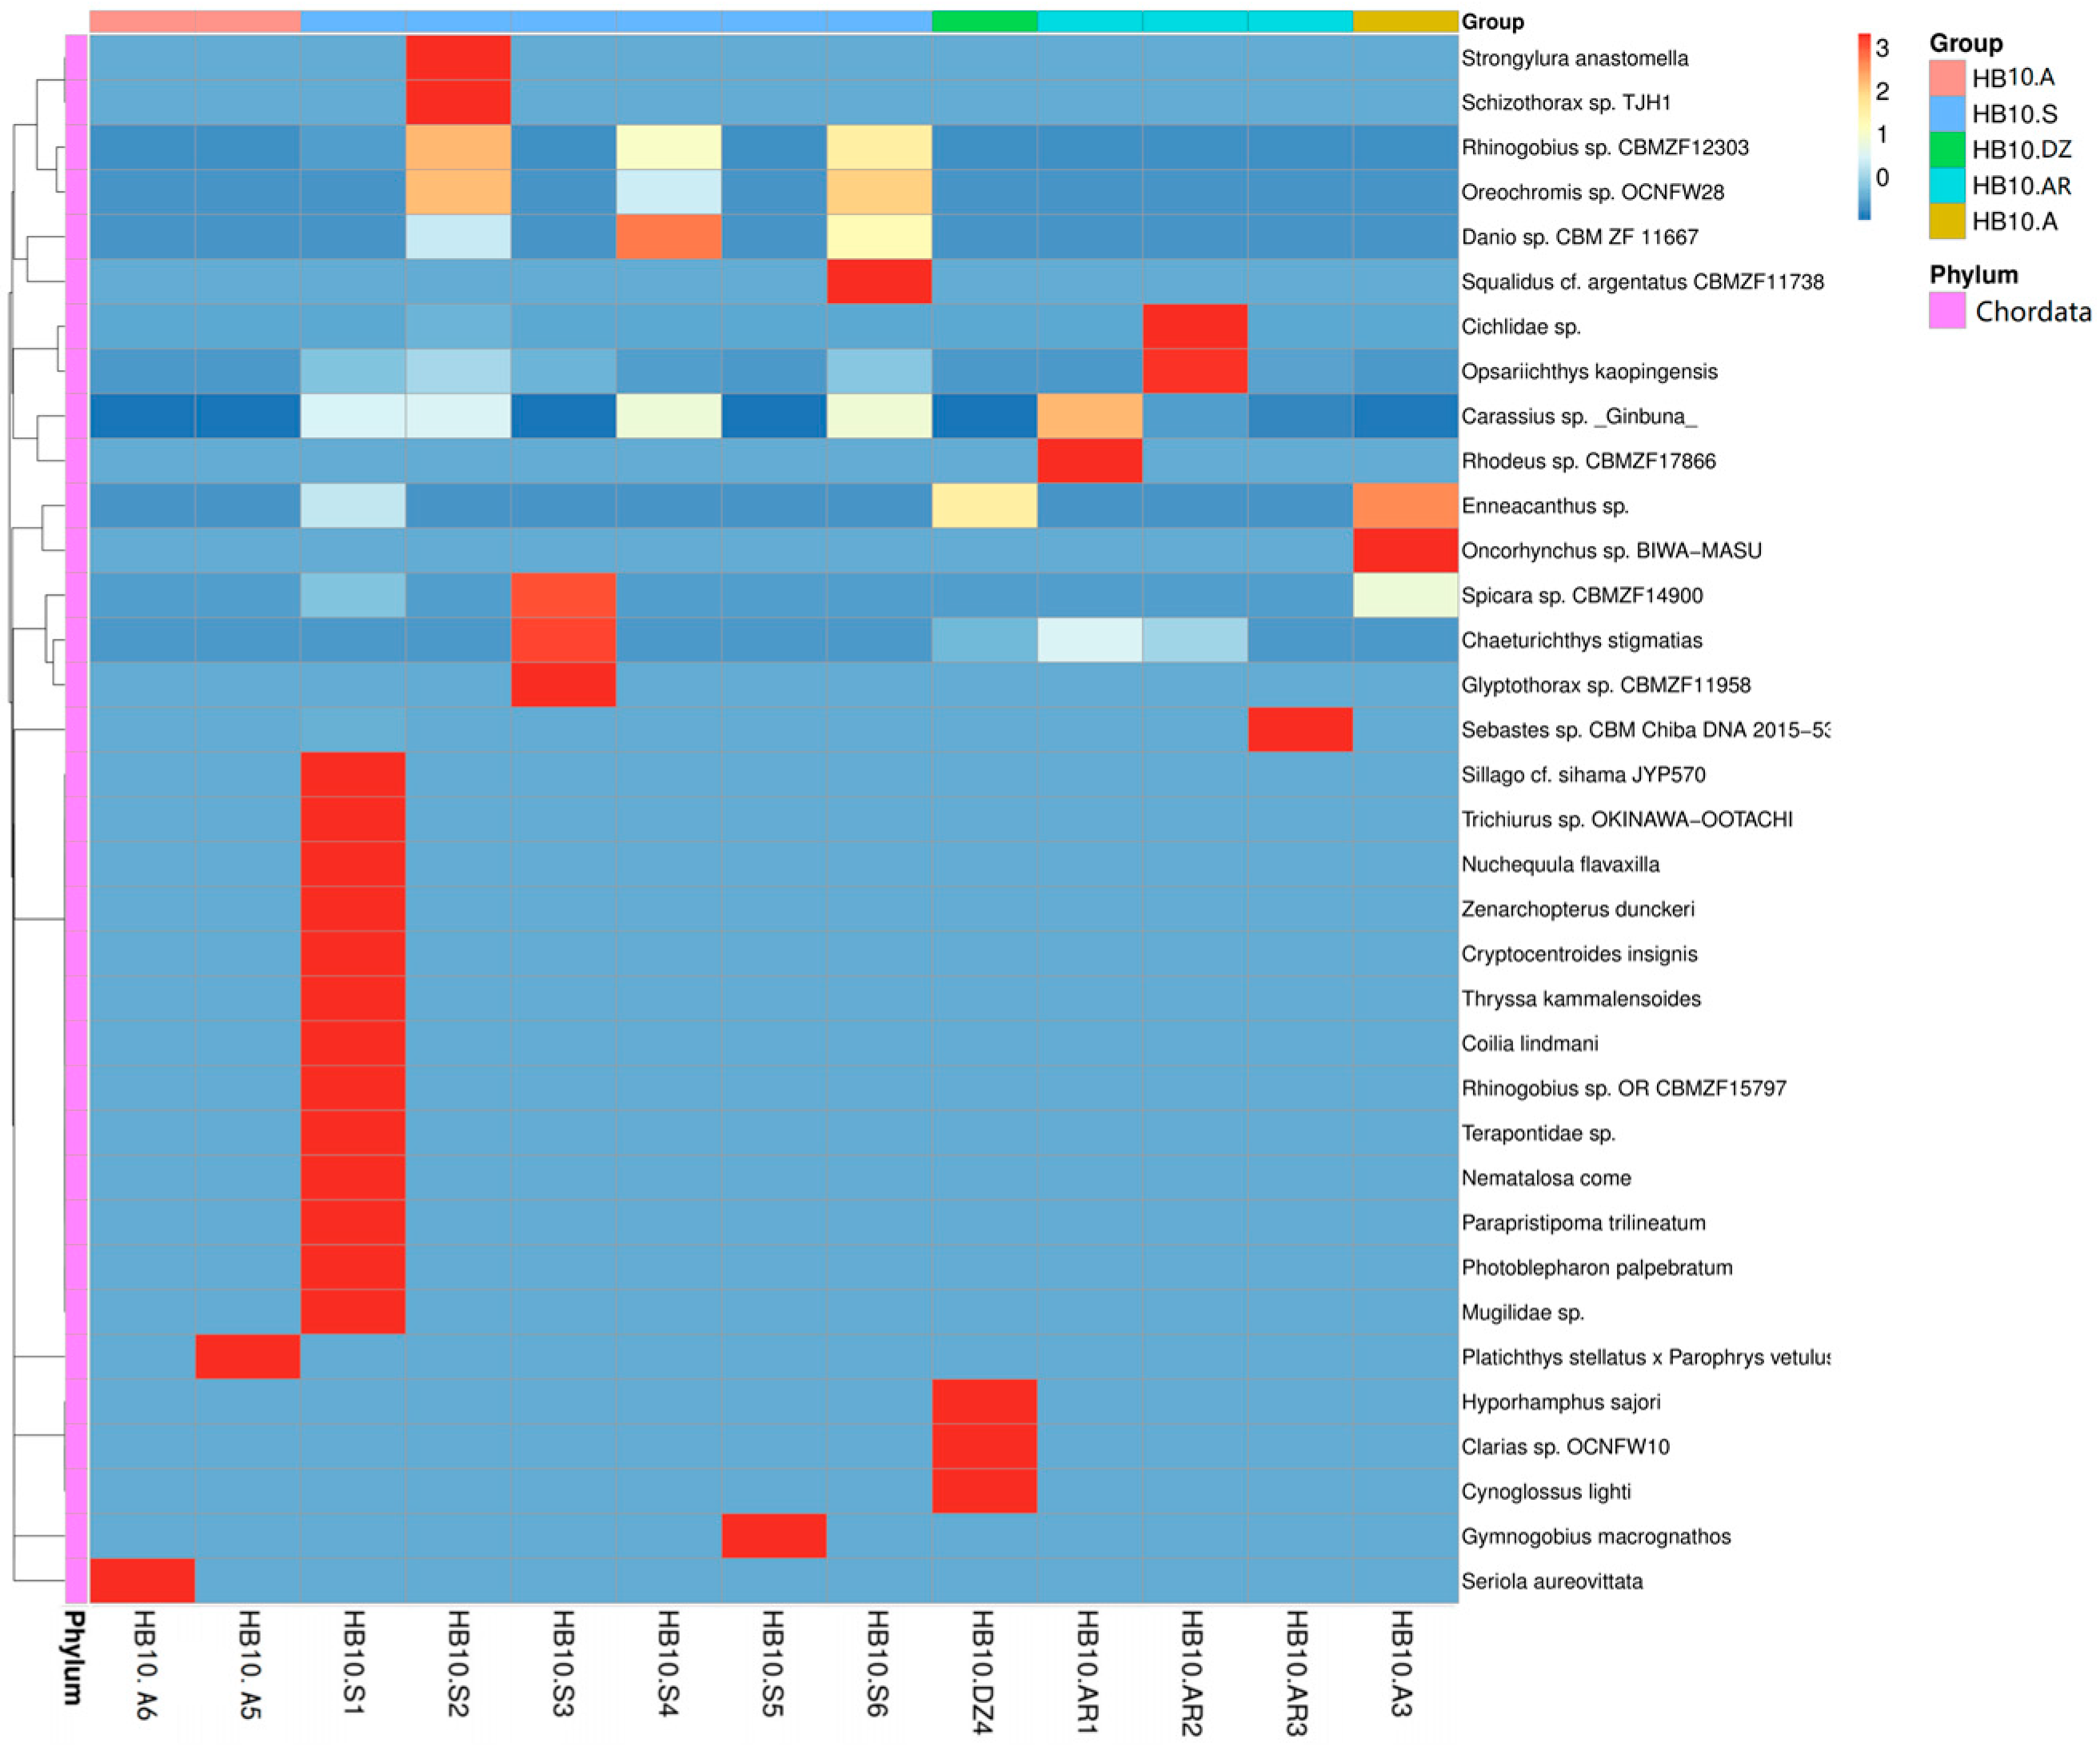
Based on the heatmap data (Figure 6), the characteristics of each sampling series can be summarized as follows: In the S, HB10.S exhibited the highest species richness, with concentrated detections of Sand smelt (Sillago cf.), Okinawan hairtail (Trichiurus sp.), Yellow-spotted ponyfish (Nuchequula flavaxilla), Duncker’s halfbeak (Zenarchopterus dunckeri), Insignia prawn-goby (Cryptocentroides insignis), and an unidentified species of Grey mullet (Mugilidae sp.), among more than ten OTUs, exhibiting high abundance signals and the greatest diversity. In stark contrast, HB10.S5 showed high abundance only for the Edohaze (Gymnogobius macrognathos), which was present at high abundance and exhibited the lowest species evenness, forming a stark contrast. The A exhibited relatively low overall diversity; among them, HB10.A5 had the Yellowtail amberjack (Seriola aureovittata) as its sole dominant species, while HB10.A6 showed high abundance only of the Starry flounder × English sole (Platichthys stellatus × Parophrys vetulus), making it the most representative. At each site in the AR, dominant species were prominent: AR1 was dominated by species of the Carpinus genus and Rhodeus genus, while AR3 was dominated by Sebastes sp., reflecting the simple community structure and distinct dominant species characteristic of artificial reef areas. DZ4, on the other hand, was enriched with species such as the Japanese halfbeak (Hyporhamphus sajori) and Light’s tongue sole (Cynoglossus lighti). Some freshwater or escaped aquaculture species (such as Tilapia genus, Oreochromis genus, and Catfish genus, Clarias genus) showed high abundance signals at multiple sites, which may be related to land-based inputs or database errors, reflecting the limitations of eDNA technology in species identification.

3.3. Catch Composition by Traditional Net Survey

This study used a traditional net survey to collect a total of 18 species of fish, totaling 2143 fish (Table 3). In terms of abundance, the Speartailed goby (Chaeturichthys stigmatias) (47.4%) and the Indian flathead (Platycephalus indicus) (21.5%) were the two dominant species, together accounting for approximately 68.91% of the total abundance. Other species, including Schlegel’s black rockfish (Sebastes schlegelii), Spotted gizzard shad (Konosirus punctatus), Fat greenling (Hexagrammos otakii), Tongue sole (Cynoglossus semilaevis), and Belanger’s croaker (Johnius belangerii), each contributed less than 8% to the total abundance.
In terms of biomass composition, Schlegel’s black rockfish stood out particularly; although it accounted for only 5.67% of the total number of individuals, its contribution to biomass reached 21.02% of the total weight, ranking first. Furthermore, although large fish species, such as the Olive flounder (Paralichthys olivaceus) and Fat greenling, accounted for less than 4% of the total number of individuals, their combined biomass represented more than 15% of the total weight, demonstrating the significant impact of individual body weight on the community’s biomass structure.
Table 3. Composition, quantity and percentage of fish sampled by traditional net survey in Xiangyun Bay Marine Ranch.
SpeciesNumberPercentage (%)Weight Percentage (%)
Spotted gizzard shad
Konosirus punctatus
763.564.31%
Tongue sole
Cynoglossus semilaevis
1587.378.96
Kammal thryssa
Thryssa kammalensis
472.211.65
Fat greenling
Hexagrammos otakii
592.7712.40
Fang’s blenny
Pholis fangi
432.000.98
Japanese sea bass
Lateolabrax japonicus
60.280.85
Olive flounder
Paralichthys olivaceus
70.353.36
Yellow croaker
Nibea albiflora
120.550.72
Japanese Spanish mackerel
Scomberomorus niphonius
20.070.07
Black scraper
Thamnaconus modestus
311.449.06
Speartailed goby
Chaeturichthys stigmatias
101547.3718.68
Belanger’s croaker
Johnius belangerii
592.752.26
Japanese sardinella
Sardinella zunasi
30.120.25
Spotted puffer
Takifugu niphobles
70.340.95
Schlegel’s black rockfish
Sebastes schlegelii
1215.6721.02
Silver pomfret
Pampus argenteus
200.951.34
Indian flathead
Platycephalus indicus
46121.5412.12
Bearded goby
Tridentiger barbatus
140.651.00

4. Discussion

4.1. Background of the Xiangyun Bay Survey and Overview of Fishery Resources Analyzed in This Study

In the second half of the 20th century, the structure of fish communities in the Yellow and Bohai Seas underwent a fundamental shift due to factors such as long-term overfishing and high fishing pressure. Specifically, this led to a simplification of the community structure and an overall decline in the trophic level. Dominant species have gradually shifted from the original slow-growing, high economic-value demersal and sub-demersal fish, such as Yellow croaker (Larimichthyspolyactis) and Cutlassfish (Trichiurusjaponicus) to smaller, lower trophic-level, short-lifecycle, mid- and upper-water column fish [29,30]. The Xiangyun Bay Marine Ranch, which is the focus of this study, is located in the Bohai Bay. The artificial reef deployment project there began in January 2017 and was completed in June 2018. Cui Chen et al. [31] conducted fishery resource surveys in June 2017 (before reef deployment) and June 2019 (after reef deployment), respectively. The results showed that the number of fish species increased from 6 to 10 after reef deployment. After the reef deployment, Joyner’s tonguesole (Cynoglossus joyneri) remained the dominant species, while new species of high economic value, such as the Tongue sole and Pennahia argentata, were added. In addition, the status of non-fish economic species, such as Japanese cod (Gadus macrocephalus) and Veined rapa whelk (Rapana venosa), among the dominant species, also significantly increased, indicating that the initial phase of marine ranch development has had a certain positive effect on fish species richness.
Based on the results of previous resource surveys, and to systematically assess the current status of the fish community in the Xiangyun Bay Marine Pasture, this study conducted experiments in October 2025 using two survey methods simultaneously: fishery acoustics combined with traditional gillnet calibration data, and eDNA metabarcoding. Acoustic surveying was conducted in accordance with the relevant requirements of *Marine Survey Specifications—Part 6* (GB/T 12763.6-2007) [22]. Referring to the simulation results by Liang Yaowei et al. for spawning grounds in the Beibu Gulf, when the number of eDNA + hydroacoustic collaborative survey stations is ≥12, the relative estimation error can be controlled to within 15%. Therefore, this study designed 13 core stations. [32] and the sampling points were divided into three groups based on their spatial location and sample origin: Group S (nearshore) included HB10.S1–S6; Group A (mid-shore) included HB10.A3, A5, and A6; and Group AR (offshore) included HB10.AR1–AR3 and HB10.DZ4.
The hydroacoustic data were used to quantitatively estimate fish target intensity based on biological parameters—such as fish length and community composition—obtained from net surveys. A total of 18 fish species were identified in the hydroacoustic catch samples and it was determined that the 1–3 m water layer serves as the core habitat zone for small reef-dwelling fish, with the highest resource density observed in the shallow reef area, S5.
A total of 38 fish species were identified through sequencing using eDNA technology. Analysis of α-diversity indices, species abundance stack plots, and genus-level heatmaps revealed significant spatial heterogeneity in fish communities across different functional zones. At the “S” sampling site, Chao-1 and Shannon diversity indices were the highest, with stable eDNA signals from a variety of benthic and pelagic fish species; at “AR,” dominant species were prominent and community evenness was poor; at “A,” diversity was relatively low and species turnover was frequent;

4.2. Overall Characteristics of the Fish Community in the Xiangyun Bay Artificial Reef Area

4.2.1. Fish Community Characteristics Based on Acoustics

To assess the health of the fish stock structure, this study classified fish into three categories—small, medium, and large—based on body length and biomass data from bottom trawl catches, combined with results from the inversion of acoustic target intensity. Small fish (including Spotted gizzard shad, Fang’s blenny, Japanese Spanish mackerel, Belanger’s croaker, Japanese sardinella, Yellow croaker, and Bearded goby) accounted for a high proportion of the current sample, indicating that this group has strong reproductive capacity and rapid population replenishment. Large fish (such as the Fat greenling and Olive flounder) are relatively scarce, which may be related to their long growth cycles, low reproduction rates, or historical overfishing pressure. The composition of bottom trawl catches shows that, in terms of abundance, small benthic fish, such as the Speartailed goby, 47.4%, and the Indian flathead, 21.5%, absolutely dominate. In terms of biomass composition, large fish, such as Schlegel’s black rockfish, although accounting for a limited proportion of the total number (5.7%), contributed a significant share of the total biomass (21%) to the community structure. In summary, the current fish resource structure continues the trend toward smaller-sized fish, as observed by Cui Chen et al. [31] during the early stages of reef deployment (2019), indicating that after seven years of succession, the fish community in Xiangyun Bay remains dominated by small benthic fish.
In terms of vertical distribution, the target strength (TS) of fish exhibits distinct stratification, with the majority concentrated in the 1–10 m water column. The 1–3 m water column constitutes the zone of concentrated distribution, with target strength corresponding to small reef-dwelling fish (such as Goby, Indian flathead, and Tongue sole) measuring 8–12 cm in length, accounting for 60–70% of the total detections across all layers, indicating that this layer is the primary activity area for small fish. Below 3 m, near-bottom TS signals weaken, but strong scatterers ranging from −47 dB to −42 dB appear sporadically; these are presumed to be large reef-dwelling fish, such as Schlegel’s black rockfish and Olive flounder, whose occurrence depths generally align with the average water depths of each area (S1–S5: 3.22–5.53 m). Acoustic data reveal that fish are densely distributed in the 1–3-m water column, with resource density peaking in the HB10.S5 zone, where water depth is shallowest and reef structures are most dense. From the perspective of habitat preference, these vertical and horizontal distribution characteristics provide empirical support for the notion that small, reef-dwelling fish constitute the majority of the population. Accordingly, the primary scattering signals in the acoustic images (main peaks ranging from −55 dB to −47 dB) can be clearly attributed to populations of small fish such as Speartailed gobies and Indian flathead. The above acoustic observations are consistent with theories on the ecological succession of artificial reefs. A systematic assessment of the effectiveness of artificial reefs worldwide by Higgins et al. [33] indicated that, in the early stages of community succession in reef areas, small, highly prolific opportunistic species often dominate, while the recovery of large predators requires a longer succession period.

4.2.2. Spatial Differentiation Characteristics of Fish Communities Based on eDNA

A map of fish species relative abundance generated from eDNA data in this study shows that species evenness at the “AR” site is low, with a significantly dominant fish species present in all samples. This indicates that the ecosystem of this artificial reef area is still in its early stages of development, with a relatively simple habitat structure, which may lead to certain species gaining a clear advantage within the community. This phenomenon is consistent with the findings of Bohnsack (1989) [34] in his study on the causes of high fish densities in artificial reefs: in relatively simple, newly formed reef habitats, fish communities are typically dominated by a small number of species capable of rapidly occupying ecological niches, resulting in low species evenness; as the structural complexity of the reef increases and the epibenthic community develops, more species are able to coexist and the dominance of the dominant species gradually weakens. The pattern of a single dominant species and low species evenness observed in the “AR” site in this study is consistent with these early community development characteristics. In contrast, no single dominant species emerged in the “A” sample; this may be due to significant disturbances during the early successional stage of the ecosystem in the newly deployed artificial reef area, preventing any species from fully adapting and occupying a dominant ecological niche. A study by Perkol-Finkel [35] et al. similarly noted that community establishment on artificial reefs takes time; during the early stages, species turnover is frequent, community structure is unstable, and the community is significantly influenced by the surrounding environment. Furthermore, based on regional maps, this study infers that “S” is closer to the coast, where nutrient inputs are typically more abundant, which may facilitate ecosystem recovery; conversely, as the area extends toward deeper waters, the degree of ecological recovery in the artificial reef zone diminishes. This spatial variation is consistent with the view proposed by Cloern et al. [36] that nearshore eutrophication influences community structure. Overall, the results of this study are consistent with previous research trends regarding the ecological succession of artificial reefs and habitat heterogeneity. A review by Kovalenko et al. [37] indicates that habitat structural complexity is a key factor influencing community composition. Consistent with this, a study by Gratwicke et al. [38] confirmed that structurally complex habitats typically support more benthic, burrowing, or sessile species, whereas open waters favor highly mobile pelagic fish as dominant groups. The aforementioned spatial differentiation patterns indicate that the successional stages of fish communities vary across different functional zones in Xiangyun Bay: Zone S, located near the shore, exhibits the highest diversity but is significantly influenced by terrestrial sources, whereas Zone AR, located farther offshore, is characterized by prominent dominant species but low evenness.

4.3. Results Based on Two Monitoring Techniques: Underwater Acoustics and eDNA

Acoustic methods and eDNA technology overlap in species detection but also have their own distinct strengths. eDNA species annotation relies on a database (Mi-Fish); however, because reference DNA barcode sequences for some native fish species in the Bohai Sea are missing or incomplete in the current database, a small number of sequences were annotated as species of the same genus or closely related species found in other geographic regions (e.g., Nuchequula flavaxilla, Thryssa kammalensoides, etc.). Based on relevant studies in the literature and historical survey records of fish in the Bohai Sea, these species were determined to be false positives and were excluded from the data analysis.
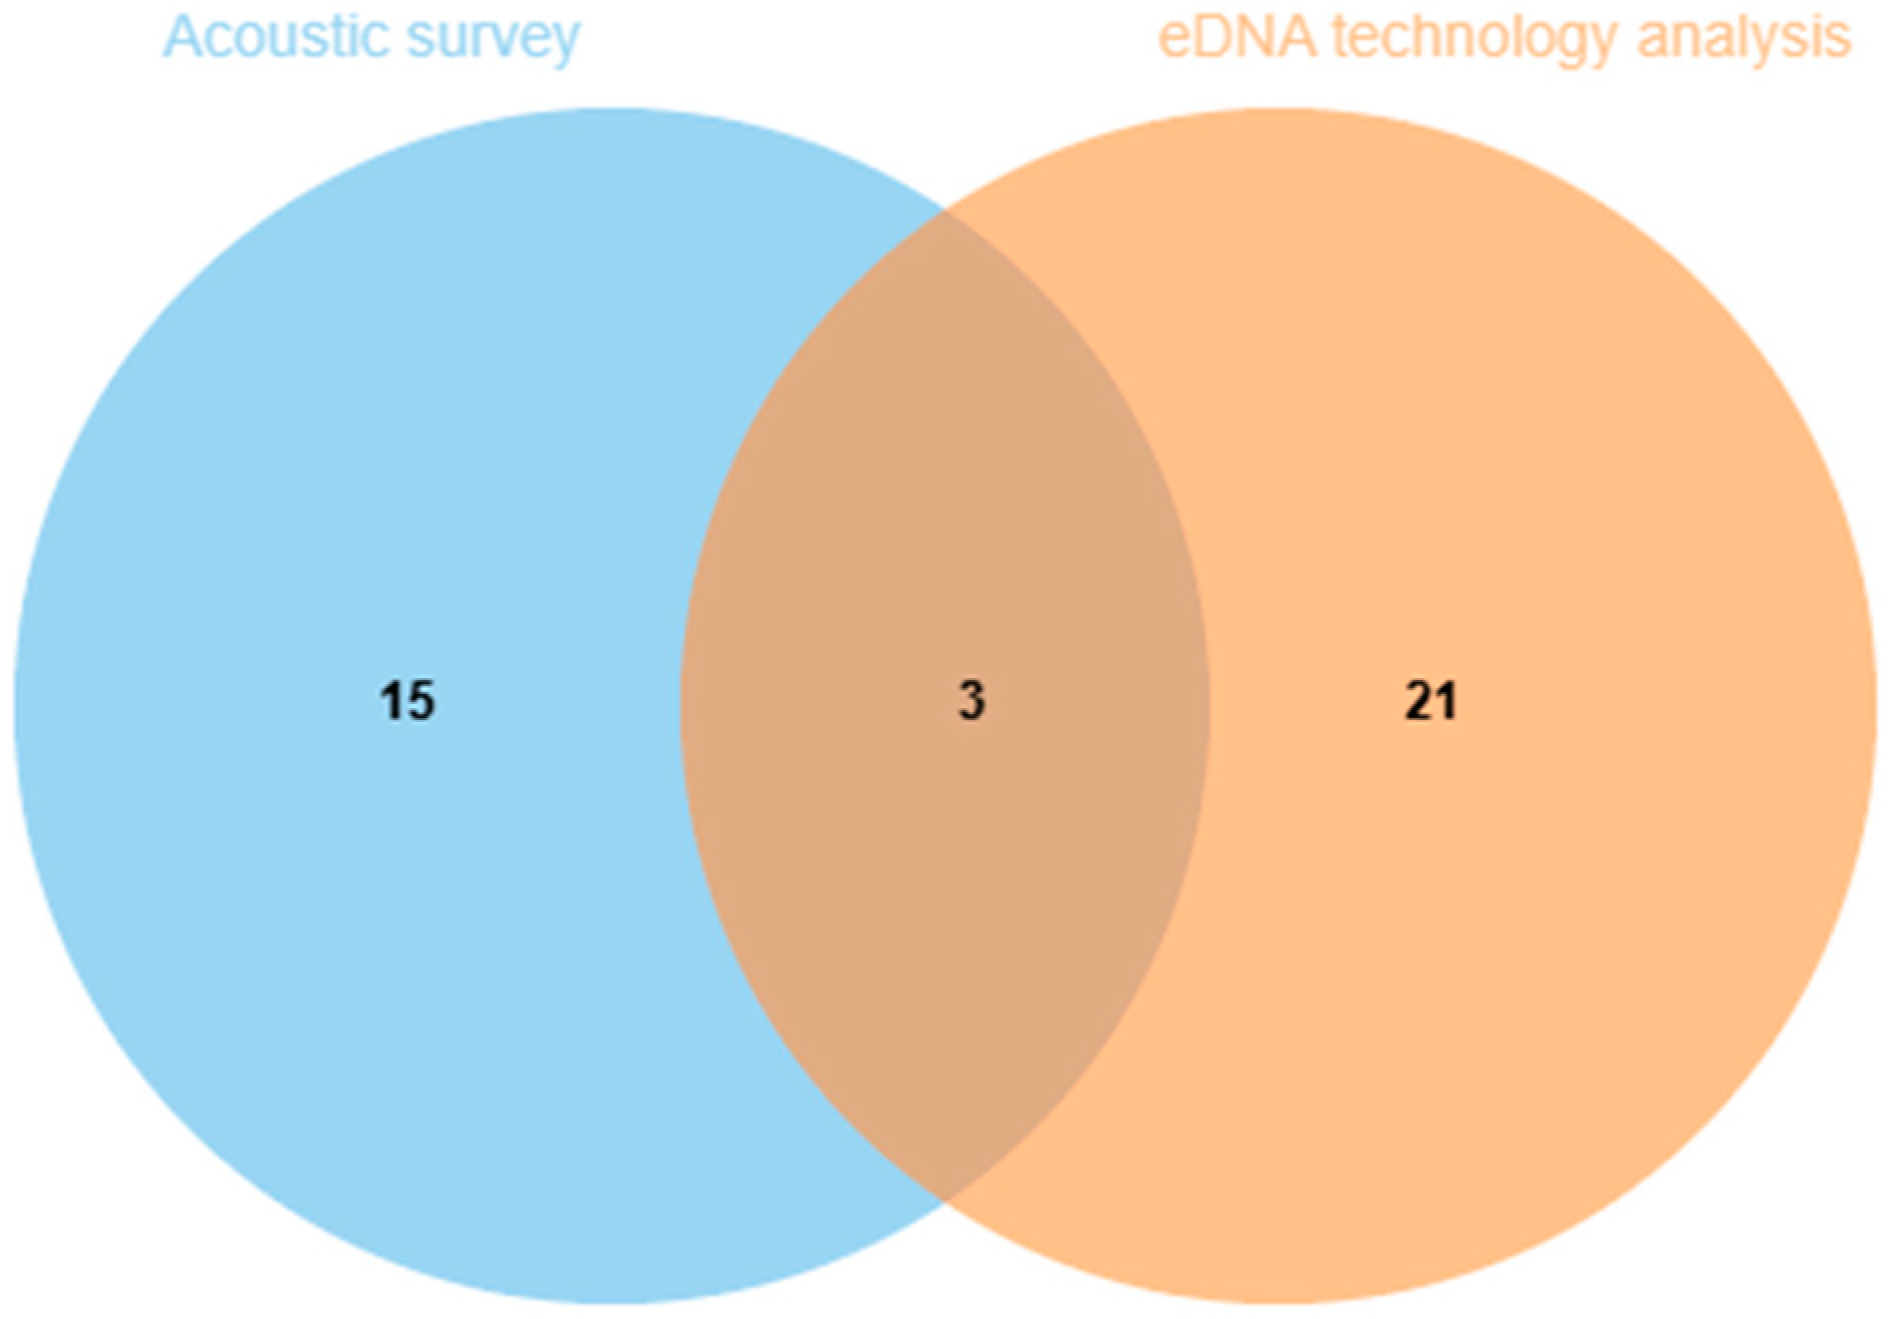
As shown in the Figure 7, the results of the horizontal Venn diagram for fish genera indicate that the acoustic survey detected a total of 18 fish genera, 15 of which were captured exclusively through acoustic methods; the eDNA analysis detected a total of 24 fish genera, 21 of which were unique to eDNA; only 3 fish genera were detected by both methods, resulting in a cumulative total of 39 distinct fish genera identified across all surveys. Among the species detected by both methods, the Speartailed goby, Indian flathead, and Schlegel’s black rockfish all ranked highly in the combined acoustic and net survey, net catch composition, and eDNA relative abundance, indicating that these species are the backbone of the Xiangyun Bay fish community. This result is highly reliable.
The extremely low overlap in fish genus detection between the two monitoring methods is an inevitable result of inherent technical limitations. Acoustic monitoring relies on swim bladder echo signals and can only identify large- and medium-sized fish swimming in the upper and middle water columns; small, burrowing, and benthic fish are simultaneously obscured by acoustic signals from artificial reefs [39]. Sediment eDNA is not limited by body size or habitat-related obstruction and can efficiently capture genetic information from cryptic bottom-dwelling fish; however, it cannot distinguish between living organisms and remains, cannot provide information on individual abundance or spatial density, and has low spatial resolution due to the effects of water current dispersion [11]. At the same time, factors, such as the stratification of fish habitats, further reduce the number of taxa detected by both methods.
In summary, the two monitoring methods detected overlap in only three fish genera; this is an inevitable result of the inherent differences in sensitivity between the two technologies regarding fish ecological types and detection resolution. Relying on a single survey method would severely underestimate the genus-level diversity of fish in marine areas; therefore, combined acoustic and eDNA monitoring is essential for comprehensively characterizing fish communities in artificial reef areas.

5. Conclusions

Based on the results of the combined acoustic and eDNA assessment, the fish resources in the Xiangyun Bay Marine Pasture exhibit the following trends. First, resource density is generally low and spatially distributed in a highly uneven manner, with a 55% difference in density between the high-density zone (S5) and the low-density zone (S2), indicating that fish resources in this area have not yet formed a stable, widespread distribution pattern. Second, the community structure has long been in a state of degradation. Small, low trophic-level fish, such as the Speartailed goby and the Indian flathead, in terms of both abundance and acoustic contribution, while large, economically important fish species, such as Schlegel’s black rockfish and Olive flounder, are present in extremely low numbers. This is consistent with the trends of trophic-level decline, miniaturization of the population structure, and youth bias reported by Li Xinyu and Yang and Hao and Chen [20,21], indicating that the trend of resource decline has not yet been effectively curbed. Furthermore, Xiaolin Wang et al. [40], who previously conducted a study on fish diversity in the Bohai Sea using eDNA technology, noted that the dominant species in the Bohai Sea during winter are primarily small pelagic fish such as the anchovy (Engraulis japonicus) and the goby (Liparis tanakae). This is consistent with some of the findings of the present study, suggesting that the influence of environmental variables must be comprehensively considered in eDNA analyses.
The above trends indicate that the Xiangyun Bay Marine Pasture continues to face pressures from an imbalance in fishery resource structure and the degradation of ecological functions. To achieve scientific and targeted resource conservation, upgrading monitoring methods is a prerequisite. This study validated the complementary nature of acoustic and eDNA technologies in fish stock assessment: acoustic technology provides high-resolution data on the spatial distribution of stock density, while eDNA technology efficiently captures species composition and information on cryptic species. When combined, these two methods can address the respective shortcomings of each individual approach in species identification and quantitative estimation without significantly increasing the survey workload. Therefore, it is recommended that combined acoustic and eDNA surveys be incorporated into the long-term monitoring system for the Xiangyun Bay Marine Ranch, gradually establishing a dual-pronged monitoring model centered on acoustic quantification and supplemented by eDNA species identification. Through the continuous accumulation of time-series data, signals of stock fluctuations can be detected early, providing a scientific basis for the dynamic adjustment of management measures, thereby laying the monitoring foundation for the sustainable use of fishery resources in Xiangyun Bay.

Author Contributions

L.Y., H.C. and Q.L. conceived and designed the experiment. S.L., Z.W., H.Y. and J.S. conducted the experiment. S.S. and B.X. are involved in data analysis. L.Y., Q.L. and H.C. wrote the manuscript. T.T. contributed to supervision and validation. H.C. and L.Y. contributed equally to this work and share first authorship. All authors have read and agreed to the published version of the manuscript.

Funding

This work received financial supports from the following projects: National Key Research and Development Program of China (2023YFD2401103); Liaoning Province Doctoral Research Start-up Fund Program (2024-BS-213); Liaoning Province Department of Education Basic Research Project (LJ212410158046); Special Funding Support for Basic Research Operating Expenses of Provincial Universities (2024JBQNZ022).

Institutional Review Board Statement

The animal study protocol was approved by the Institutional Animal Care and Use Committee (IACUC) of Dalian Ocean (protocol code DLOU2026051401 and date of approval: 1 April 2024).

Informed Consent Statement

Not applicable.

Data Availability Statement

The original contributions presented in the study are included in the article. Further inquiries can be directed to the corresponding authors.

Acknowledgments

We would like to thank the Novogene Bioinformatics Technology Co., Ltd. (Beijing, China) for technical support for this study. Thanks to all the authors for their valuable time. Without the hard work of all the authors, we would not have completed this study.

Conflicts of Interest

The authors declare no conflicts of interest.

Abbreviations

The following abbreviations are used in this manuscript:
eDNAEnvironmental DNA
WBTWide-band transceiver
saSound absorption
ASVsAmplicon sequence variants
Rawb PEPaired-end reads

References

  1. National Research Council. Improving Fish Stock Assessments; The National Academies Press: Washington, DC, USA, 1998. [Google Scholar]
  2. Zhan, B.Y. Fisheries Stock Assessment; China Agriculture Press: Beijing, China, 1995. [Google Scholar]
  3. Walsh, S.J. Performance of Mobile and Static Gears Used in Single and Multi-Species Resource Surveys: A Review; ICES CM 1997/W:02; ICES: Copenhagen, Denmark, 1997. [Google Scholar]
  4. Johannesson, K.A.; Mitson, R.B. Fisheries Acoustics: A Practical Manual for the Estimation of Fish Biomass; FAO Fisheries Technical Paper No. 240; FAO: Rome, Italy, 1983. [Google Scholar]
  5. Cevik, T.; Cevik, N. Environmental DNA (eDNA): A Review of Ecosystem Biodiversity Detection and Applications. Biodivers. Conserv. 2025, 34, 2999–3035. [Google Scholar] [CrossRef] [Scilit]
  6. Engås, A.; Løkkeborg, S. Abundance Estimation Using Bottom Gillnet and Long-Line—The Role of Fish Behaviour. In Marine Fish Behaviour in Capture and Abundance Estimation; Fernö, A., Olsen, S., Eds.; Fishing News Books: Oxford, UK, 1994; pp. 130–163. [Google Scholar]
  7. Parker-Stetter, S.L.; Rudstam, L.G.; Sullivan, P.J.; Warner, D.M. Standard Operating Procedures for Fisheries Acoustic Surveys in the Great Lakes. ICES J. Mar. Sci. 2009, 66, 1308–1319. [Google Scholar] [CrossRef] [Scilit]
  8. Simmonds, J.; MacLennan, D.N. Fisheries Acoustics: Theory and Practice, 2nd ed.; Wiley-Blackwell Publishing: Oxford, UK, 2006. [Google Scholar]
  9. Li, H.F.; Yu, X.J.; Wu, B.B.; Yu, L.; Wang, D.; Wang, K.; Wang, S.; Chen, D.; Li, Y.; Duan, X.; et al. Temporal and Spatial Distribution Characteristics of Fish Resources in a Typical River–Lake Confluence Ecosystem During the Initial Period of Fishing Ban. Fishes 2024, 9, 492. [Google Scholar] [CrossRef] [Scilit]
  10. Rees, H.C.; Maddison, B.C.; Middleditch, D.J.; Patmore, J.R.M.; Gough, K.C. Review: The Detection of Aquatic Animal Species Using Environmental DNA: A Review of eDNA as a Survey Tool in Ecology. J. Appl. Ecol. 2014, 51, 1450–1459. [Google Scholar] [CrossRef] [Scilit]
  11. Deiner, K.; Bik, H.M.; Mächler, E.; Seymour, M.; Lacoursière-Roussel, A.; Altermatt, F.; Creer, S.; Bista, I.; Lodge, D.M.; De Vere, N.; et al. Environmental DNA Metabarcoding: Transforming How We Survey Animal and Plant Communities. Mol. Ecol. 2017, 26, 5872–5895. [Google Scholar] [CrossRef] [Scilit]
  12. Thomsen, P.F.; Kielgast, J.; Iversen, L.L.; Møller, P.R.; Rasmussen, M.; Willerslev, E. Detection of a Diverse Marine Fish Fauna Using Environmental DNA from Seawater Samples. PLoS ONE 2012, 7, e41732. [Google Scholar] [CrossRef] [Scilit]
  13. Yang, H.L.; Wu, J.M.; Zhang, H.; Du, H.; Li, J.Y.; Wang, Y.C.; Shen, L.; Liu, Z.G.; Wei, Q.W. Monitoring Efficiency of Fish Composition in Large Rivers Using Environmental DNA: A Case Study of the Wuhan Section of the Yangtze River. J. Fish. Sci. China 2021, 28, 796–807. [Google Scholar]
  14. Turner, C.R.; Uy, K.L.; Everhart, R.C. Fish Environmental DNA Is More Concentrated in Aquatic Sediments Than Surface Water. Biol. Conserv. 2015, 183, 93–102. [Google Scholar] [CrossRef] [Scilit]
  15. Kelly, R.P.; Port, J.A.; Yamahara, K.M.; Crowder, L.B. Using Environmental DNA to Census Marine Fishes in a Large Mesocosm. PLoS ONE 2014, 9, e86175. [Google Scholar] [CrossRef] [Scilit]
  16. Wang, Z.H.; Zhang, S.Y.; Wang, K. Fish and Macroinvertebrates Community Structure in Artificial Habitat Around Sanheng Isle, Shengsi, China. Acta Ecol. Sin. 2010, 30, 2026–2035. [Google Scholar]
  17. Sarriá, D.; Molino, E. Monitoring Species in Artificial Reefs Using Acoustic Communications. In Proceedings of the MARTECH-2011, 1st International Conference on Maritime Technology and Engineering, Lisbon, Portugal, 10–12 May 2011. [Google Scholar]
  18. Kou, Y.X.; Weng, Z.H.; Ji, F.F.; Xie, Y.J.; Wang, J.Q.; Pan, H.Z.; Shi, G.; Zeng, Z.C.; Ye, K.; Li, J.; et al. Application of Environmental DNA Technology in Monitoring Endangered Aquatic Animals. Biodivers. Sci. 2025, 33, 24574. [Google Scholar]
  19. Tomke, S.A.; Price, S.J. Drivers Behind Spatiotemporal Variation in Environmental DNA: An Assessment Using a Rare Aquatic Salamander, the Eastern Hellbender (Cryptobranchus alleganiensis alleganiensis). Environ. DNA 2025, 7, e70217. [Google Scholar] [CrossRef] [Scilit]
  20. Yang, H.C. Ecological Effect Assessment of Artificial Reef Areas in Tangshan Marine Ranching Based on the Ecopath Model. Master’s Thesis, Dalian Ocean University, Dalian, China, 2019. [Google Scholar]
  21. Li, X.Y.; Zhang, Y.L.; Qi, Z.L.; Shi, B.; Zhao, X. Analysis of Ecosystem Structure and Energy Flow in Xiangyun Bay Marine Ranching Based on the Ecopath Model. J. Dalian Ocean Univ. 2023, 38, 311–322. [Google Scholar]
  22. GB/T 12763.6-2007; Specifications for Oceanographic Survey—Part 6: Marine Biological Survey. Standards Press of China: Beijing, China, 2007.
  23. Miya, M.; Sato, Y.; Fukunaga, T.; Sado, T.; Poulsen, J.Y.; Sato, K.; Minamoto, T.; Yamamoto, S.; Yamanaka, H.; Araki, H.; et al. MiFish, a set of universal PCR primers for metabarcoding environmental DNA from fishes: Detection of more than 230 subtropical marine species. R. Soc. Open Sci. 2015, 2, 150088. [Google Scholar] [CrossRef] [Scilit]
  24. Magoc, T.; Salzberg, S.L. FLASH: Fast Length Adjustment of Short Reads to Improve Genome Assemblies. Bioinformatics 2011, 27, 2957–2963. [Google Scholar] [CrossRef] [Scilit]
  25. Bokulich, N.A.; Kaehler, B.D.; Rideout, J.R.; Dillon, M.; Bolyen, E.; Knight, R.; Huttley, G.A.; Gregory Caporaso, J. Optimizing Taxonomic Classification of Marker-Gene Amplicon Sequences with QIIME 2’s q2-Feature-Classifier Plugin. Microbiome 2018, 6, 90. [Google Scholar] [CrossRef] [Scilit]
  26. Iwasaki, W.; Fukunaga, T.; Isagozawa, R.; Yamada, K.; Maeda, Y.; Satoh, T.P.; Sado, T.; Mabuchi, K.; Takeshima, H.; Miya, M.; et al. MitoFish and MitoAnnotator: A mitochondrial genome database of fish with an accurate and automatic annotation pipeline. Mol. Biol. Evol. 2013, 30, 2531–2540. [Google Scholar] [CrossRef] [Scilit]
  27. Liu, J.; Fu, Z.; Zhao, C.L.; Liu, H.J. Fishes of Bo Hai; Science Press: Beijing, China, 2019. [Google Scholar]
  28. Edgar, R.C.; Haas, B.J.; Clemente, J.C.; Quince, C.; Knight, R. UCHIME Improves Sensitivity and Speed of Chimera Detection. Bioinformatics 2011, 27, 2194–2200. [Google Scholar] [CrossRef] [Scilit]
  29. Jin, X.; Tang, Q. Changes in Fish Species Diversity and Dominant Species Composition in the Yellow Sea. Fish. Res. 1996, 26, 337–352. [Google Scholar] [CrossRef] [Scilit]
  30. Ding, Q.; Shan, X.J.; Jin, X.S.; Gorfine, H. Research on Utilization Conflicts of Fishery Resources and Catch Allocation Methods in the Bohai Sea, China. Fish. Res. 2020, 225, 105477. [Google Scholar] [CrossRef] [Scilit]
  31. Cui, C.; Zhang, Y.L.; Zhang, X.W.; Pan, Z.; Ye, M.; Zhao, Q.; Qi, Z. Evaluation of Fishery Resources Enhancement Effect in Tangshan Xiangyun Bay Marine Ranching. Hebei Fish. 2021, 1, 25–31. [Google Scholar]
  32. Liang, Y.W.; Li, Z.L.; Feng, B. Impact of station design on the assessment of fishery resource density in the spawning grounds of the Beibu Gulf. J. Fish. China 2025, 50, 029310. [Google Scholar]
  33. Higgins, E.; Metaxas, A.; Scheibling, R.E. A Systematic Review of Artificial Reefs as Platforms for Coral Reef Research and Conservation. PLoS ONE 2022, 17, e0261964. [Google Scholar] [CrossRef] [Scilit]
  34. Bohnsack, J.A. Are High Densities of Fishes at Artificial Reefs the Result of Habitat Limitation or Behavioral Preference? Bull. Mar. Sci. 1989, 44, 631–645. [Google Scholar]
  35. Perkol-Finkel, S.; Benayahu, Y. Recruitment of Benthic Organisms onto a Planned Artificial Reef: Shifts in Community Structure One Decade Post-Deployment. Mar. Environ. Res. 2005, 59, 79–99. [Google Scholar] [CrossRef] [Scilit]
  36. Cloern, J.E. Our Evolving Conceptual Model of the Coastal Eutrophication Problem. Mar. Ecol. Prog. Ser. 2001, 210, 223–253. [Google Scholar] [CrossRef] [Scilit]
  37. Kovalenko, K.E.; Thomaz, S.M.; Warfe, D.M. Habitat Complexity: Approaches and Future Directions. Hydrobiologia 2012, 685, 1–17. [Google Scholar] [CrossRef] [Scilit]
  38. Gratwicke, B.; Speight, M.R. The Relationship Between Fish Species Richness, Abundance and Habitat Complexity in a Range of Shallow Tropical Marine Habitats. J. Fish. Biol. 2005, 66, 650–667. [Google Scholar] [CrossRef] [Scilit]
  39. Conti, S.G.; Demer, D.A. Acoustic Shadowing by Fish Aggregations and Reef Structures. ICES J. Mar. Sci. 2006, 63, 1295–1306. [Google Scholar]
  40. Wang, X.L.; Wang, L.; Wang, A.Y.; Zhao, L.L. New Insights into Fish Diversity in the Yellow and Bohai Seas Based on Environmental DNA Technology. Fishes 2024, 9, 435. [Google Scholar] [CrossRef] [Scilit]
Figure 1. Distribution of eDNA sampling sites and acoustic survey route map. Note: The map background was created by the author based on geographic information of the study area; the 13 eDNA sampling sites and acoustic survey transects were established in accordance with the project proposal for the National Key Research and Development Program titled “Construction of Ecological Smart Marine Pastures in the Yellow and Bohai Seas and Models for Integrated Development.”.
Fishes 11 00525 g001
Figure 2. Transducer parameter settings.
Fishes 11 00525 g002
Figure 3. Distribution relationship between fish target intensity and depth for single target detection in the HB10.S1–5 area.
Fishes 11 00525 g003
Figure 4. Relative abundance accumulation diagram of fish species.
Fishes 11 00525 g004
Figure 5. Chao1 and Shannon’s diversity index calculated from fish species data at different sampling sites.
Fishes 11 00525 g005
Figure 6. Heatmap of species distribution at the species level. This heatmap shows the detection of different fish species in multiple samples. The value indicates the detection intensity or presence of the marker in the corresponding family, where ‘1’ represents detected, ‘2’ represents a relatively strong signal, ‘3’ represents a strong signal, ‘0’ represents weak or undetected.
Fishes 11 00525 g006
Figure 7. Venn diagram of fish genera detected by acoustic surveys and eDNA barcoding analysis.
Fishes 11 00525 g007
Table 1. Acoustic inversion parameters and resource contribution rates for each fish species.
SpeciesAverage Body Length (cm)Average Weight (g)Target Strength
(dB)
Acoustic Contribution Ratio (%)
Spotted gizzard shad
Konosirus punctatus
10.0317.45−51.875.98
Tongue sole
Cynoglossus semilaevis
8.2617.51−53.56 8.40
Kammal thryssa
Thryssa kammalensis
9.8510.76−52.823.00
Fat greenling
Hexagrammos otakii
16.5564.53−43.0235.75
Fang’s blenny
Pholis fangi
10.217.06−47.229.84
Japanese sea bass
Lateolabrax japonicus
9.5343.93−47.82 1.20
Olive flounder
Paralichthys olivaceus
24.10139.99−44.263.39
Yellow croaker
Nibea albiflora
11.4618.91−46.223.39
Japanese Spanish mackerel
Scomberomorus niphonius
7.8614.81−49.490.20
Black scraper
Thamnaconus modestus
17.7690.39−42.4121.42
Speartailed goby
Chaeturichthys stigmatias
2.255.68−60.3611.29
Belanger’s croaker
Johnius belangerii
8.6711.86−48.649.77
Japanese sardinella
Sardinella zunasi
11.6929.77−50.540.27
Spotted puffer
Takifugu niphobles
12.1540.30−45.712.36
Schlegel’s black rockfish
Sebastes schlegelii
10.0753.43−47.3426.94
Silver pomfret
Pampus argenteus
13.3820.26−44.87 8.03
Indian flathead
Platycephalus indicus
9.118.11−48.2184.17
Bearded goby
Tridentiger barbatus
7.3622.12−50.061.66
Note: The acoustic contribution rate refers to the percentage of the total echo integral attributed to a given fish species. These relative intensity values are calculated independently and have not been normalized; therefore, the sum of the individual values does not equal 100%.
Table 2. Echo image processing and analysis results in different survey route areas.
Route Sampling AreaS1S2S3S4S5
target intensity range (dB)−67.04~−46.57−67.52~−46.23−67.11~−40.32−67.51~−46.73−67.26~−52.42
average water depth (m)4.754.775.135.533.22
route length (km)1.8703.0013.0353.0604.102
fish stock density (ind/m2)6.11 × 10−56.05 × 10−56.29 × 10−57.51 × 10−59.38 × 10⁻⁵
Disclaimer/Publisher’s Note: The statements, opinions and data contained in all publications are solely those of the individual author(s) and contributor(s) and not of MDPI and/or the editor(s). MDPI and/or the editor(s) disclaim responsibility for any injury to people or property resulting from any ideas, methods, instructions or products referred to in the content.