Article

Differential Environmental Response Patterns Between Spawning and Nursery Habitats of Coilia mystus in the Yangtze Estuary

1
Zhejiang Marine Fisheries Research Institute, Zhoushan 316201, China
2
College of Marine Resource Sciences and Management, Shanghai Ocean University, Shanghai 200120, China
3
College of Animal Science and Technology, Shandong Vocational Animal Science and Veterinary College, Weifang 261000, China
*
Author to whom correspondence should be addressed.
Fishes 2026, 11(9), 499; https://doi.org/10.3390/fishes11090499
Submission received: 9 July 2026 / Revised: 22 August 2026 / Accepted: 22 August 2026 / Published: 26 August 2026
(This article belongs to the Special Issue Sustainable Fisheries Dynamics—2nd Edition)

Abstract

Estuaries support distinct spawning and nursery habitats for migratory fishes, yet the differential environmental response patterns between these two critical early life habitats remain poorly understood from a spatial non-stationarity perspective. Based on six ichthyoplankton surveys conducted during peak and late spawning seasons from 2018 to 2020 in the Yangtze Estuary, this study applied geographically weighted regression (GWR) models to quantify the spatially varying effects of sea surface temperature, sea surface salinity, chlorophyll-a, water depth and distance to coast on the distributions of Coilia mystus eggs and larvae. The results reveal clear divergence in both spatial pattern and environmental drivers between spawning and nursery habitats. Spawning grounds were persistently concentrated in the middle reaches of the South Branch, and shifted approximately 10 km upstream during the spring saltwater intrusion event in 2020. Nursery grounds, by contrast, formed a stable dual-core structure, with the northern core at the North Branch mouth consistently supporting higher larval densities than the southern core in the North and South Passages. Salinity was the primary limiting factor for spawning in spring, while temperature dominated in summer, and chlorophyll-a was never retained in optimal egg models. For larvae, chlorophyll-a emerged as a consistent key driver alongside salinity and temperature, and local regression coefficients spanned a wider range than those for eggs, indicating greater spatial heterogeneity in larval distribution–environment relationships. This study provides the first comparative analysis of spatially non-stationary environmental controls on spawning versus nursery habitats of C. mystus, and offers empirical support for stage-specific habitat conservation and fisheries management in the Yangtze Estuary.
Key Contribution: This study provides the first comparative analysis of spatially non-stationary environmental drivers between spawning and nursery habitats of Coilia mystus in the Yangtze Estuary, revealing distinct differences in environmental response patterns across the egg-to-larva transition and identifying a persistent dual-core structure of nursery grounds shaped jointly by hydrodynamic transport and prey availability.

1. Introduction

Estuaries represent critical areas where freshwater and sea interact, providing essential spawning grounds, nursery habitats and migration corridors for numerous fish species [1]. As the largest estuary in China, the Yangtze Estuary is shaped by the combined influence of river runoff, tides and coastal currents [2]. It features pronounced temperature and salinity gradients, high nutrient loads and abundant prey resources, and has long ranked among the most important traditional fishing grounds in China’s marine fisheries [2]. This complex ecosystem supports economically valuable migratory fishes such as Coilia mystus and Coilia nasus, and also functions as the exclusive migration pathway for rare and protected species including Acipenser sinensis.
Coilia mystus, a member of the Engraulidae family within Clupeiformes, mainly inhabits inshore and coastal waters. Historically, its annual spawning migration formed one of the five major fishing seasons in the Yangtze Estuary [3]. Each May, sexually mature individuals move upstream into the open waters of the South Branch to reproduce. Existing studies indicate that C. mystus is a single-batch spawner, reproducing only once per breeding season [3,4]. The reproductive period extends from May to October, with peak spawning occurring between May and August [5]. Its eggs are mainly distributed in the South Branch from Changxing Island to Jiuduansha and outside the North Branch mouth, while larvae and juveniles concentrate outside the South Branch mouth, in the North Branch and along Chongming East Beach [6]. In particular, the nearshore waters in the North Branch host the highest larval and juvenile densities and serve as a core nursery habitat for the species [5].
Despite its ecological and economic importance, C. mystus stocks in the Yangtze Estuary have declined sharply over the past decades, driven by environmental change and human activities including overfishing, hydraulic engineering and waterway regulation [7,8]. In recent years, the seasonal stock has dropped to approximately 40 tonnes, and the fishery can no longer support a viable fishing season [3]. In January 2020, the Ministry of Agriculture and Rural Affairs launched the 10-Year Yangtze River Fishing Ban [9]. Under this policy context, systematic research on C. mystus spawning and nursery grounds, covering periods before and after the ban, has become an urgent priority. The early life history stage is the most vulnerable period in a fish’s life cycle and experiences the highest mortality [10]. Survival during this stage directly determines annual recruitment strength and is a primary driver of population fluctuations and age structure shifts [11]. Habitat reduction in the Yangtze Estuary has been identified as one of the main causes of reduced early recruitment of C. mystus [6]. Therefore, clarifying how environmental factors shape the distribution of its spawning and nursery habitats is essential for understanding recruitment dynamics and informing stock recovery and habitat conservation measures.
The spatial distribution of fish spawning grounds is governed jointly by reproductive physiological constraints and species-specific responses to environmental conditions. Temperature, salinity and topographic features have all been shown to significantly influence spawning patterns [12,13]. Early life stages are generally more sensitive to environmental variation than adults. The generalized additive model (GAM) has been the most widely used tool for quantifying fish–environment relationships. Hu et al. (2021) applied GAM to analyze the spatiotemporal distribution of C. mystus larvae and juveniles in the Yangtze Estuary, and identified salinity, temperature and dissolved oxygen as the main drivers of abundance [5]. Their optimal model explained 65.50% of the deviance, with optimal ranges of 5–12 for salinity and 20–28 °C for temperature. Using survey data from 2022 to 2023, Zhao et al. (2025) further confirmed significant effects of temperature, salinity and pH on larval and juvenile abundance, with suitable ranges of 20–32 °C and 2–16 [14]. These studies have provided an important reference for identifying environmental controls on the early-stage distribution of C. mystus. Nevertheless, global regression models such as generalized linear models (GLMs) and GAM operate under the assumption that species–environment relationships are stationary across the entire study area, and thus cannot capture spatial variation of environmental effects [15].
Estuarine ecosystems are spatially heterogeneous. In the Yangtze Estuary, the runoff, tides, coastal currents and saltwater intrusion create spatial gradients and non-stationarity in temperature, salinity and other environmental variables [5]. Geographically weighted regression (GWR), a local regression framework, allows relationships between response and explanatory variables to vary across space by fitting a separate regression equation at each sampling location, making it well suited for quantifying spatial heterogeneity in environmental effects [15]. In recent years, GWR has gained increasing attention in fisheries ecology. Jian et al. (2022) reported that GWR outperformed GAM in capturing spatially non-stationary relationships between Sillago sihama distribution and environmental factors in Shandong coastal waters [16]. Cullen et al. (2021) found that GWR yielded better fit and higher prediction accuracy than both GLM and GAM for modeling the distributions of Centropristis striata and Stenotomus chrysops in the Mid-Atlantic Bight [17]. Wang et al. (2021) applied GWR to potential spawning grounds of C. mystus in the Yangtze Estuary, and demonstrated significant spatially non-stationary effects of key environmental factors on egg density [18].
Notably, the above study by Wang et al. (2021) focused exclusively on the spawning habitat of C. mystus based on 2019–2020 egg survey data [18], and did not involve larval nursery habitats or any cross-stage comparative analysis. Building on this earlier foundational field work, the present study extends both the dataset and the analytical framework: we supplement the 2018 peak-spawning season survey data to enrich the temporal coverage of spawning habitat analysis, and more importantly, incorporate the full larval dataset across all six cruises to establish a parallel GWR analytical system for nursery habitats (Table S1). Taking the differentiation between spawning and nursery habitats as the core scientific question, this study systematically compares the similarities and differences in spatial distribution patterns and environmental driving mechanisms between the two early life stages.
Despite these advances, two important gaps remain. First, existing GWR studies on C. mystus have focused almost exclusively on spawning ground distribution based on egg data [18]. Second, spawning and nursery grounds are two closely linked but functionally distinct critical habitats, and their respective environmental drivers may differ substantially, yet no comparative study of the two has been conducted. To address these gaps, this study applied GWR models to ichthyoplankton survey data collected during the peak and late spawning seasons in the Yangtze Estuary from 2018 to 2020. We propose two testable research hypotheses. First, the spatial distribution patterns of spawning and nursery habitats of C. mystus differ significantly in the Yangtze Estuary. The hatched larvae are transported downstream by hydrodynamics and aggregate to form stable nursery grounds at the estuary mouth. Second, the dominant environmental drivers diverge between the two life stages. Salinity and temperature are the dominant drivers of spawning habitat distribution, and for nursery habitats, chlorophyll-a acts as an additional consistent key driver alongside salinity and temperature. The findings are expected to advance our understanding of the distribution mechanisms governing the early life stages of this species, and to provide a scientific foundation for habitat conservation, restoration of spawning grounds, and evaluation of the effectiveness of fishing ban.

2. Materials and Methods

2.1. Study Area

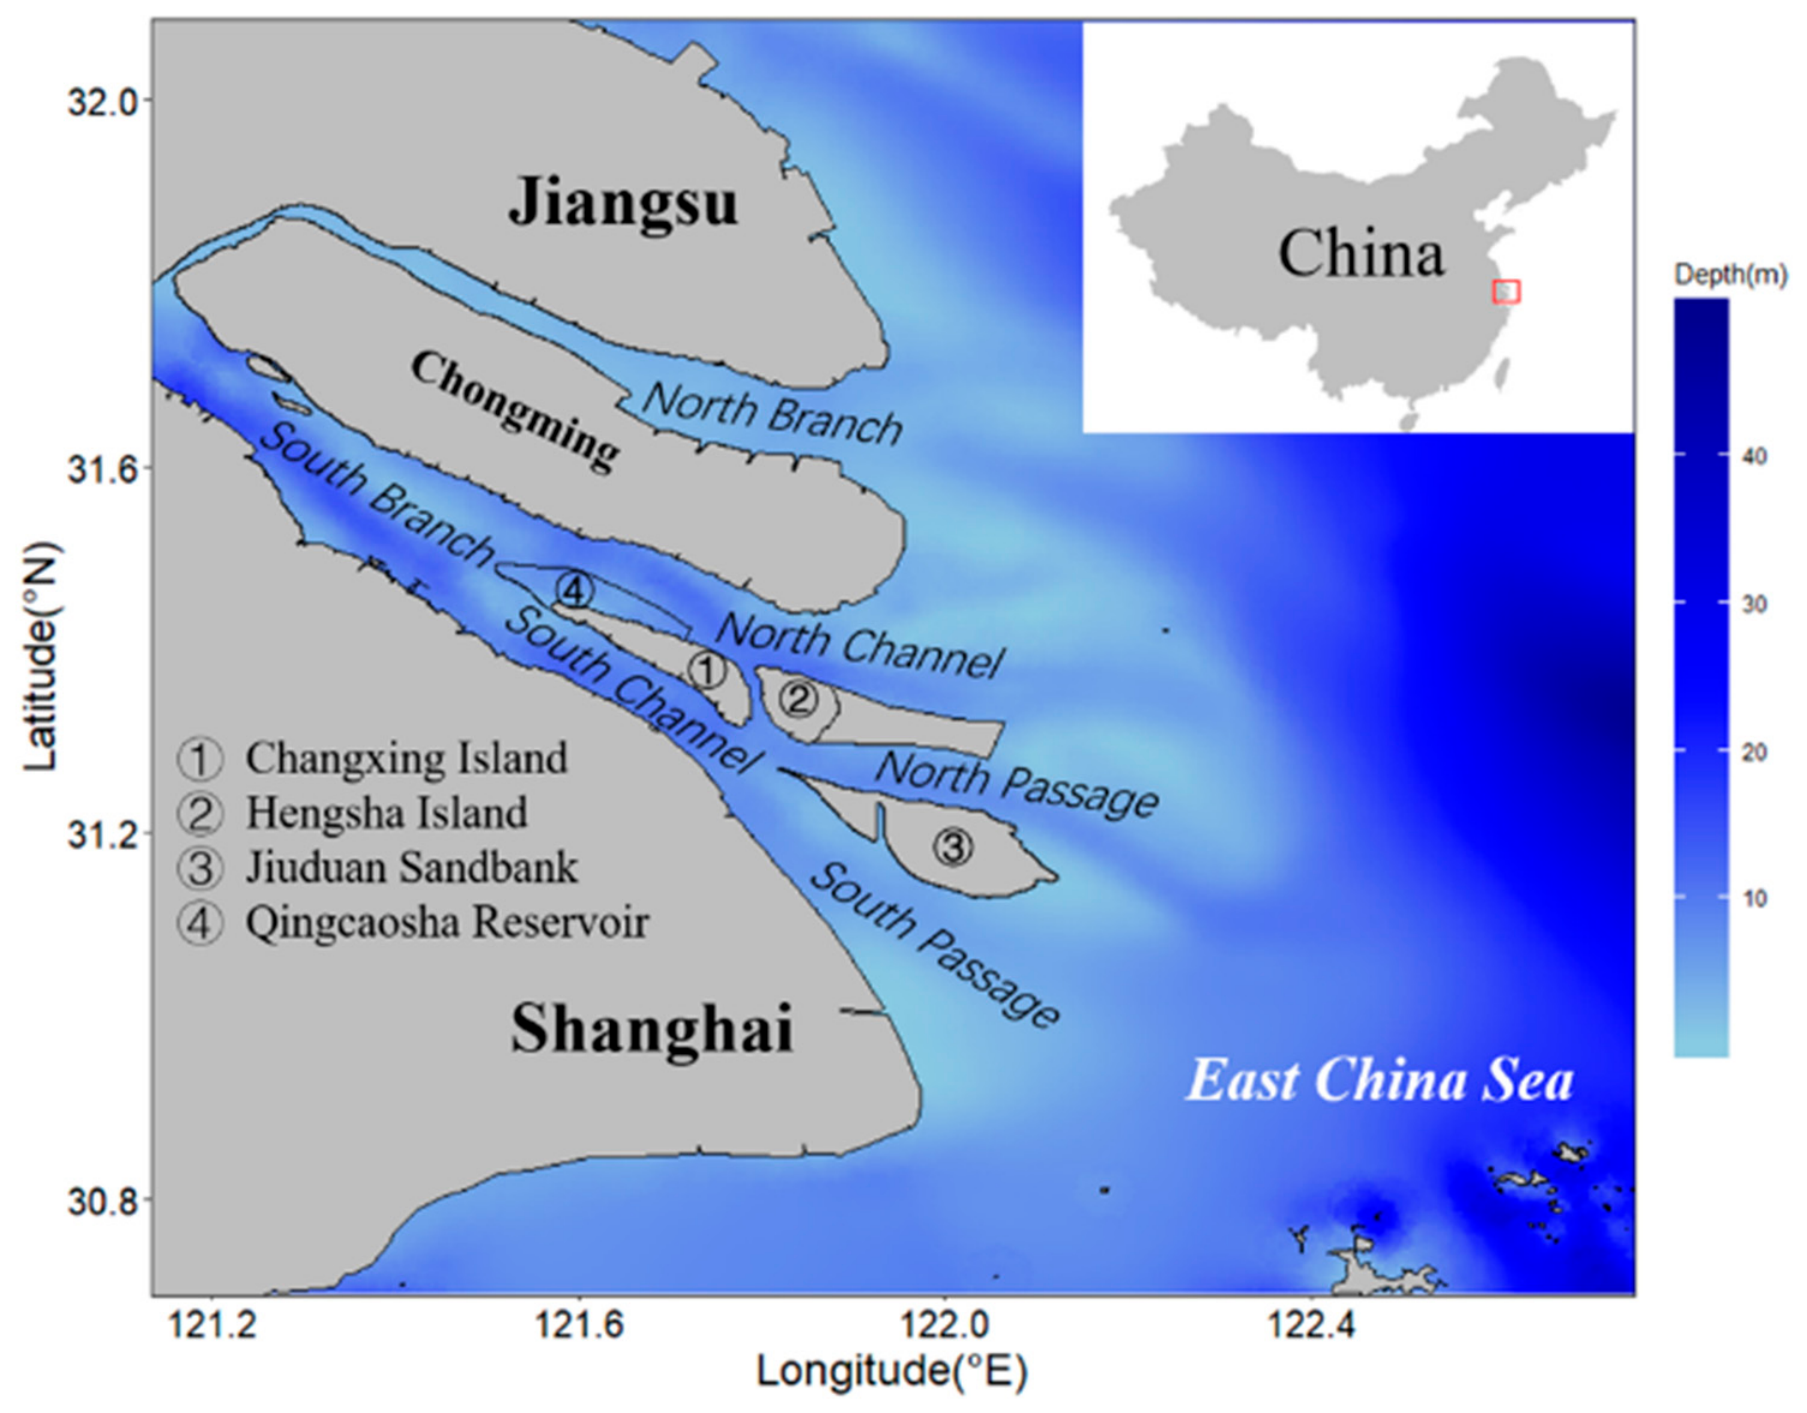
Data applied in this study were collected from field ichthyoplankton surveys carried out during the peak and late spawning seasons of C. mystus in the Yangtze River Estuary from 2018 to 2020. The study area covers the South Branch, North Branch, and adjacent coastal waters of the Yangtze Estuary, encompassing key geomorphic units including Chongming Island, Changxing Island, Hengsha Island, and the North/South Passages. The field investigations were conducted in June and July, 2018; May and August, 2019; and May and August, 2020. The 2018 surveys were initially designed to cover the peak spawning period; starting in 2019, the schedule was extended to include early (May) and late (August) spawning stages to capture the full reproductive season. This difference in monthly coverage does not affect within-cruise stage-to-stage comparison, but limits formal continuous interannual trend analysis. The sampling scope covered the southern branch, northern branch and outer estuarine waters of the Yangtze River Estuary (Figure 1).

2.2. Sampling Design

The actual number of sampling stations was 50 in June 2018, 55 in July 2018, 57 in May 2019, 55 in August 2019, 56 in May 2020 and 55 in August 2020. Sampling was conducted using a large plankton net with a mouth width of 80 cm and a mesh size of 505 um. A calibrated flow meter was mounted at the net mouth to calculate the volume of filtered seawater. Daily sampling operations commenced at approximately 4:00 a.m. and continued throughout daytime. At each sampling station, horizontal towing was performed against the current at a speed of 2–3 nautical miles per hour for 10 min. Meanwhile, a Sea-Bird 19plus V2 CTD instrument was synchronously deployed to measure environmental parameters including water temperature, salinity and chlorophyll concentration. All environmental measurements were conducted within the surface water layer (0–3 m depth).
All samples collected at each station were preserved in 5% formalin–seawater solution for subsequent species identification. Eggs and larvae of C. mystus were identified via morphological comparison under a biological stereomicroscope. Based on the developmental staging criteria proposed by Thompson et al. [19], C. mystus eggs were divided into five developmental stages. Larval identification was performed referring to morphological descriptions recorded in authoritative monographs, namely Fish eggs and larvae in China offshore waters [20], Fish eggs and larvae in China offshore [21] and adjacent seas and Fishes of the Yangtze River Estuary [2].
Since all fish eggs and larvae were captured from surface water, only surface environmental data were adopted for subsequent analysis in this study. The surface water layer was defined as the water column from the sea surface down to 3 m depth. Mean values of corresponding environmental parameters measured by CTD within this layer were calculated, including sea surface temperature (SST), sea surface salinity (SSS) and sea surface chlorophyll a concentration (SSCHL). Spatial variables such as water depth (DEP) and distance to coast (DTC) were also incorporated into the analysis. Water depth data were derived from electronic nautical charts of the Yangtze River Estuary, and coastal distance of each station was calculated using the raster package in R 4.3.0.

2.3. Data Analysis

2.3.1. GWR Model Construction

GWR models were constructed separately for eggs (spawning habitat) and larvae (nursery habitat) for each survey month. The square root of egg density (SED) and larval density (SLD) were used as dependent variables to reduce strong right-skewness of count-based density data, following standard practice in fisheries spatial modeling. Prior to model construction, variance inflation factor (VIF) analysis was performed for all candidate variables to diagnose global multicollinearity, with a threshold of VIF < 10 applied for variable retention. Optimal variable combinations were selected via AIC-based stepwise selection to avoid redundant predictors. The general form of the GWR model is:
y i   =   β 0 X i , Y i   +   β 1 X i , Y i DTC i   +   β 2 X i , Y i DEP i   +   β 3 X i , Y i SST i   +   β 4 X i , Y i SSS i   +   β 5 X i , Y i SSCHL i
where yi is SED or SLD at location i, and β k X i , Y i is the local regression coefficient for the k-th independent variable at location i. The spatial weighting matrix was constructed using great circle distance, bisquare kernel function and adaptive bandwidth determined by cross-validation [15]. All models were implemented using the R package GWmodel.

2.3.2. Model Selection and Validation

Before model construction, collinearity among the five environmental variables (SST, SSS, SSCHL, DTC, DEP) was tested using VIFs derived from global linear models [22]. Optimal GWR models for spawning habitat and nursery habitat were selected based on the minimum Akaike Information Criterion (AIC) from all possible combinations of environmental variables. Model performance was evaluated using the coefficient of determination (R2) and root mean square error (RMSE). Spatial autocorrelation of model residuals was assessed using Moran’s I statistic to ensure that the GWR models adequately accounted for spatial dependence in the data [23].

3. Results

3.1. Model Performance

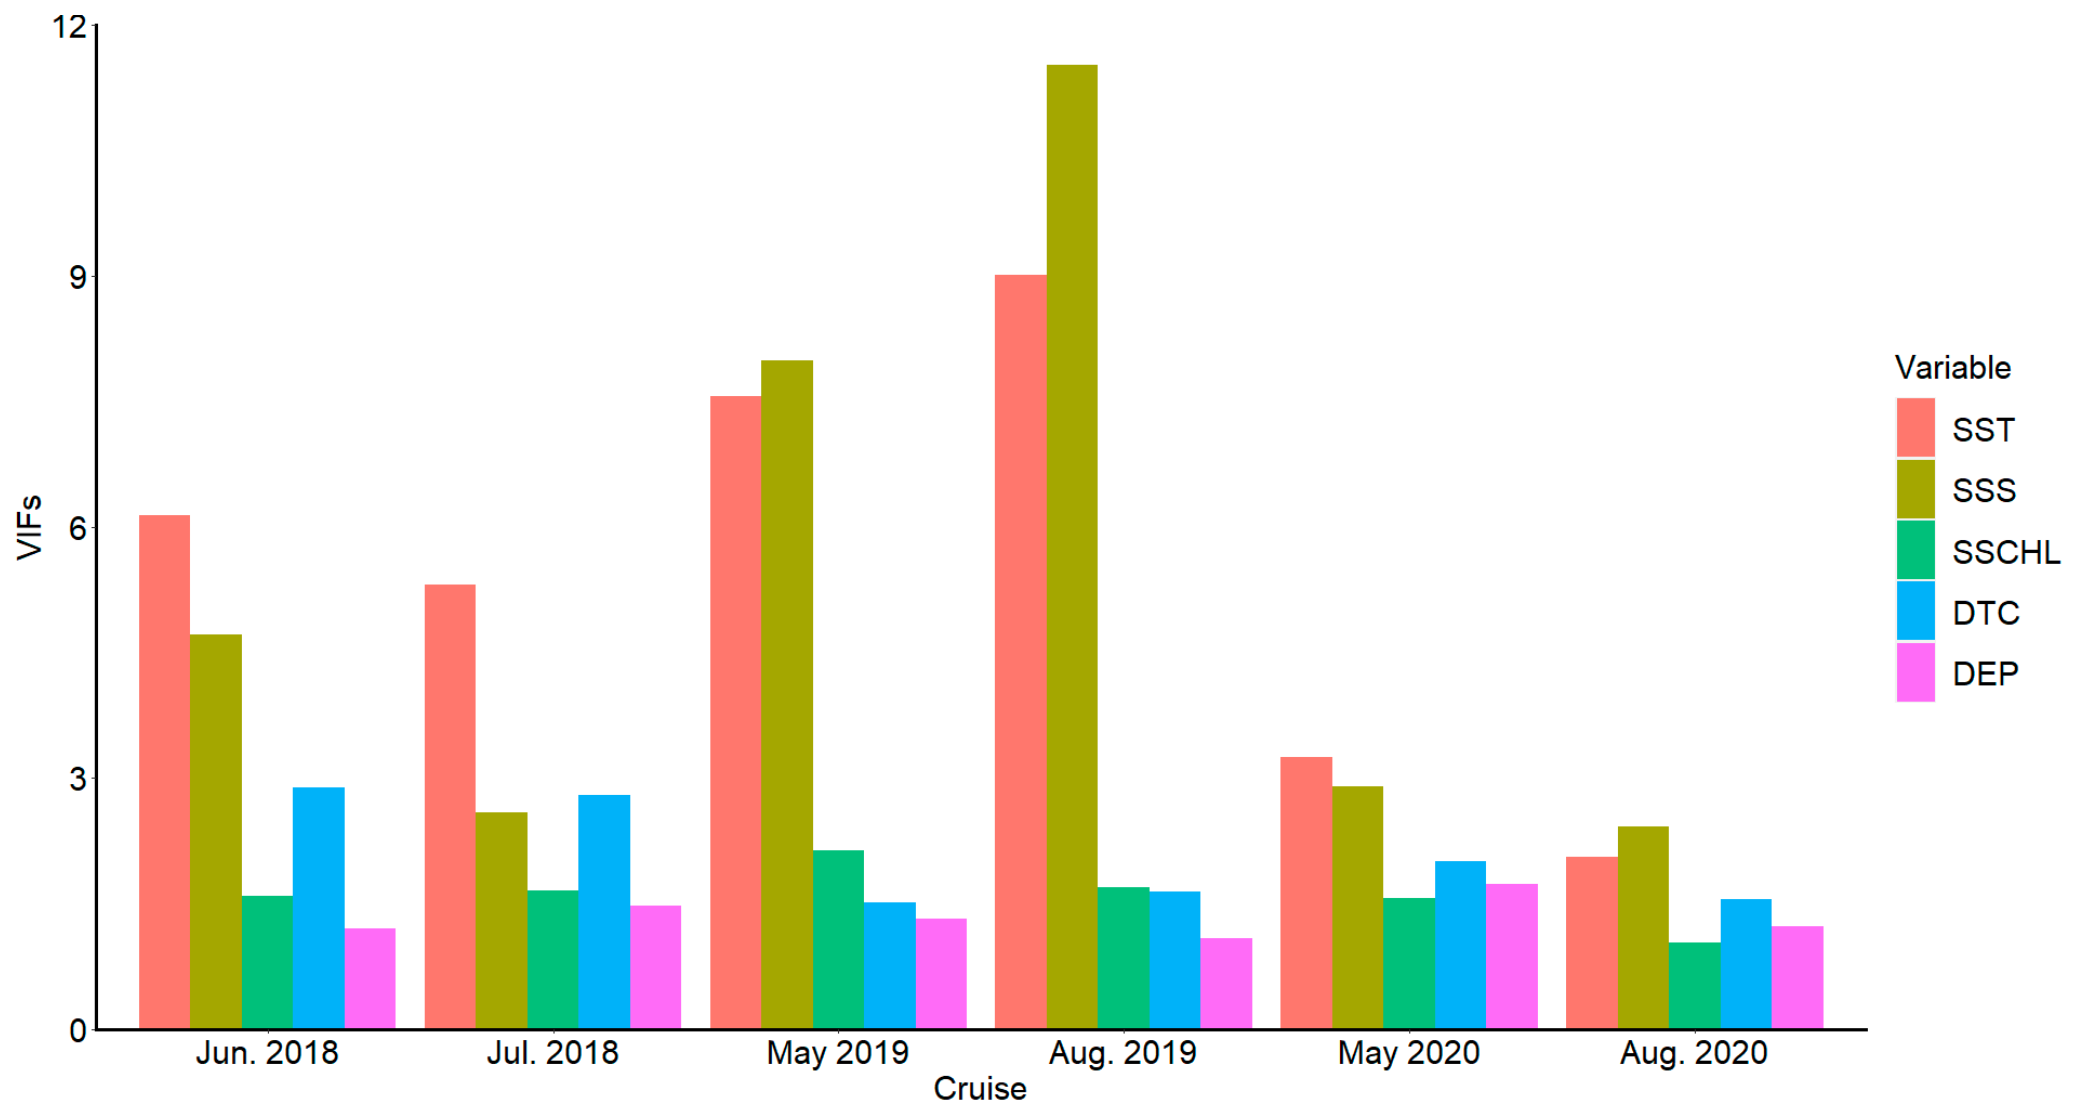
The results showed that only sea surface salinity (SSS) in August 2019 had a VIF value slightly exceeding the threshold of 10 (VIF = 11.5). Given the small deviation and the ecological importance of salinity for estuarine fish early life stages, this variable was retained in the model. All other variables had VIF values < 10, indicating no significant multicollinearity issues (Figure 2). Zero-catch stations accounted for 12–38% of total stations across egg surveys and 8–29% across larval surveys.
The variable compositions of the optimal models for each survey month are presented in Table 1. Notably, SSCHL was included in all larval models except July 2018, but was never selected in any egg model, indicating a fundamental difference in environmental requirements between the two early life stages.
The performance metrics of the optimal models are summarized in Table 2. All egg models demonstrated goodness-of-fit, with R2 values ranging from 0.53 to 0.69. Larval models showed more variable performance, with R2 values between 0.33 and 0.79. The relatively low R2 for the June 2018 larval model likely reflects the highly patchy distribution of newly hatched larvae during the early spawning period.
Root mean square error (RMSE) values were consistently low for both egg (0.01–0.14) and larval (0.002–0.32) models. Spatial autocorrelation of model residuals was assessed using Moran’s I statistic. The May 2020 larval model showed significant residual spatial autocorrelation (Moran’s I = 0.03, p = 0.03), so its local coefficient estimates should be interpreted with caution. All other models had p-values > 0.05 for Moran’s I, indicating that spatial autocorrelation was effectively eliminated in most cases. This validates the appropriateness of the GWR approach for capturing spatial non-stationarity in this estuarine system.
The ratio of optimal bandwidth to total stations was used to evaluate the strength of local spatial effects. Smaller ratios indicate that environmental relationships vary at finer spatial scales, while larger ratios indicate more spatially homogeneous patterns across the study area. The May 2020 egg model and the May–August 2019 and May 2020 larval models had smaller bandwidth ratios, corresponding to finer-scale spatial variation. In contrast, the July 2018 larval model had a bandwidth ratio of 0.89, suggesting that environmental effects were relatively uniform across the study area during this period.

3.2. Spatiotemporal Patterns of Environmental Variables

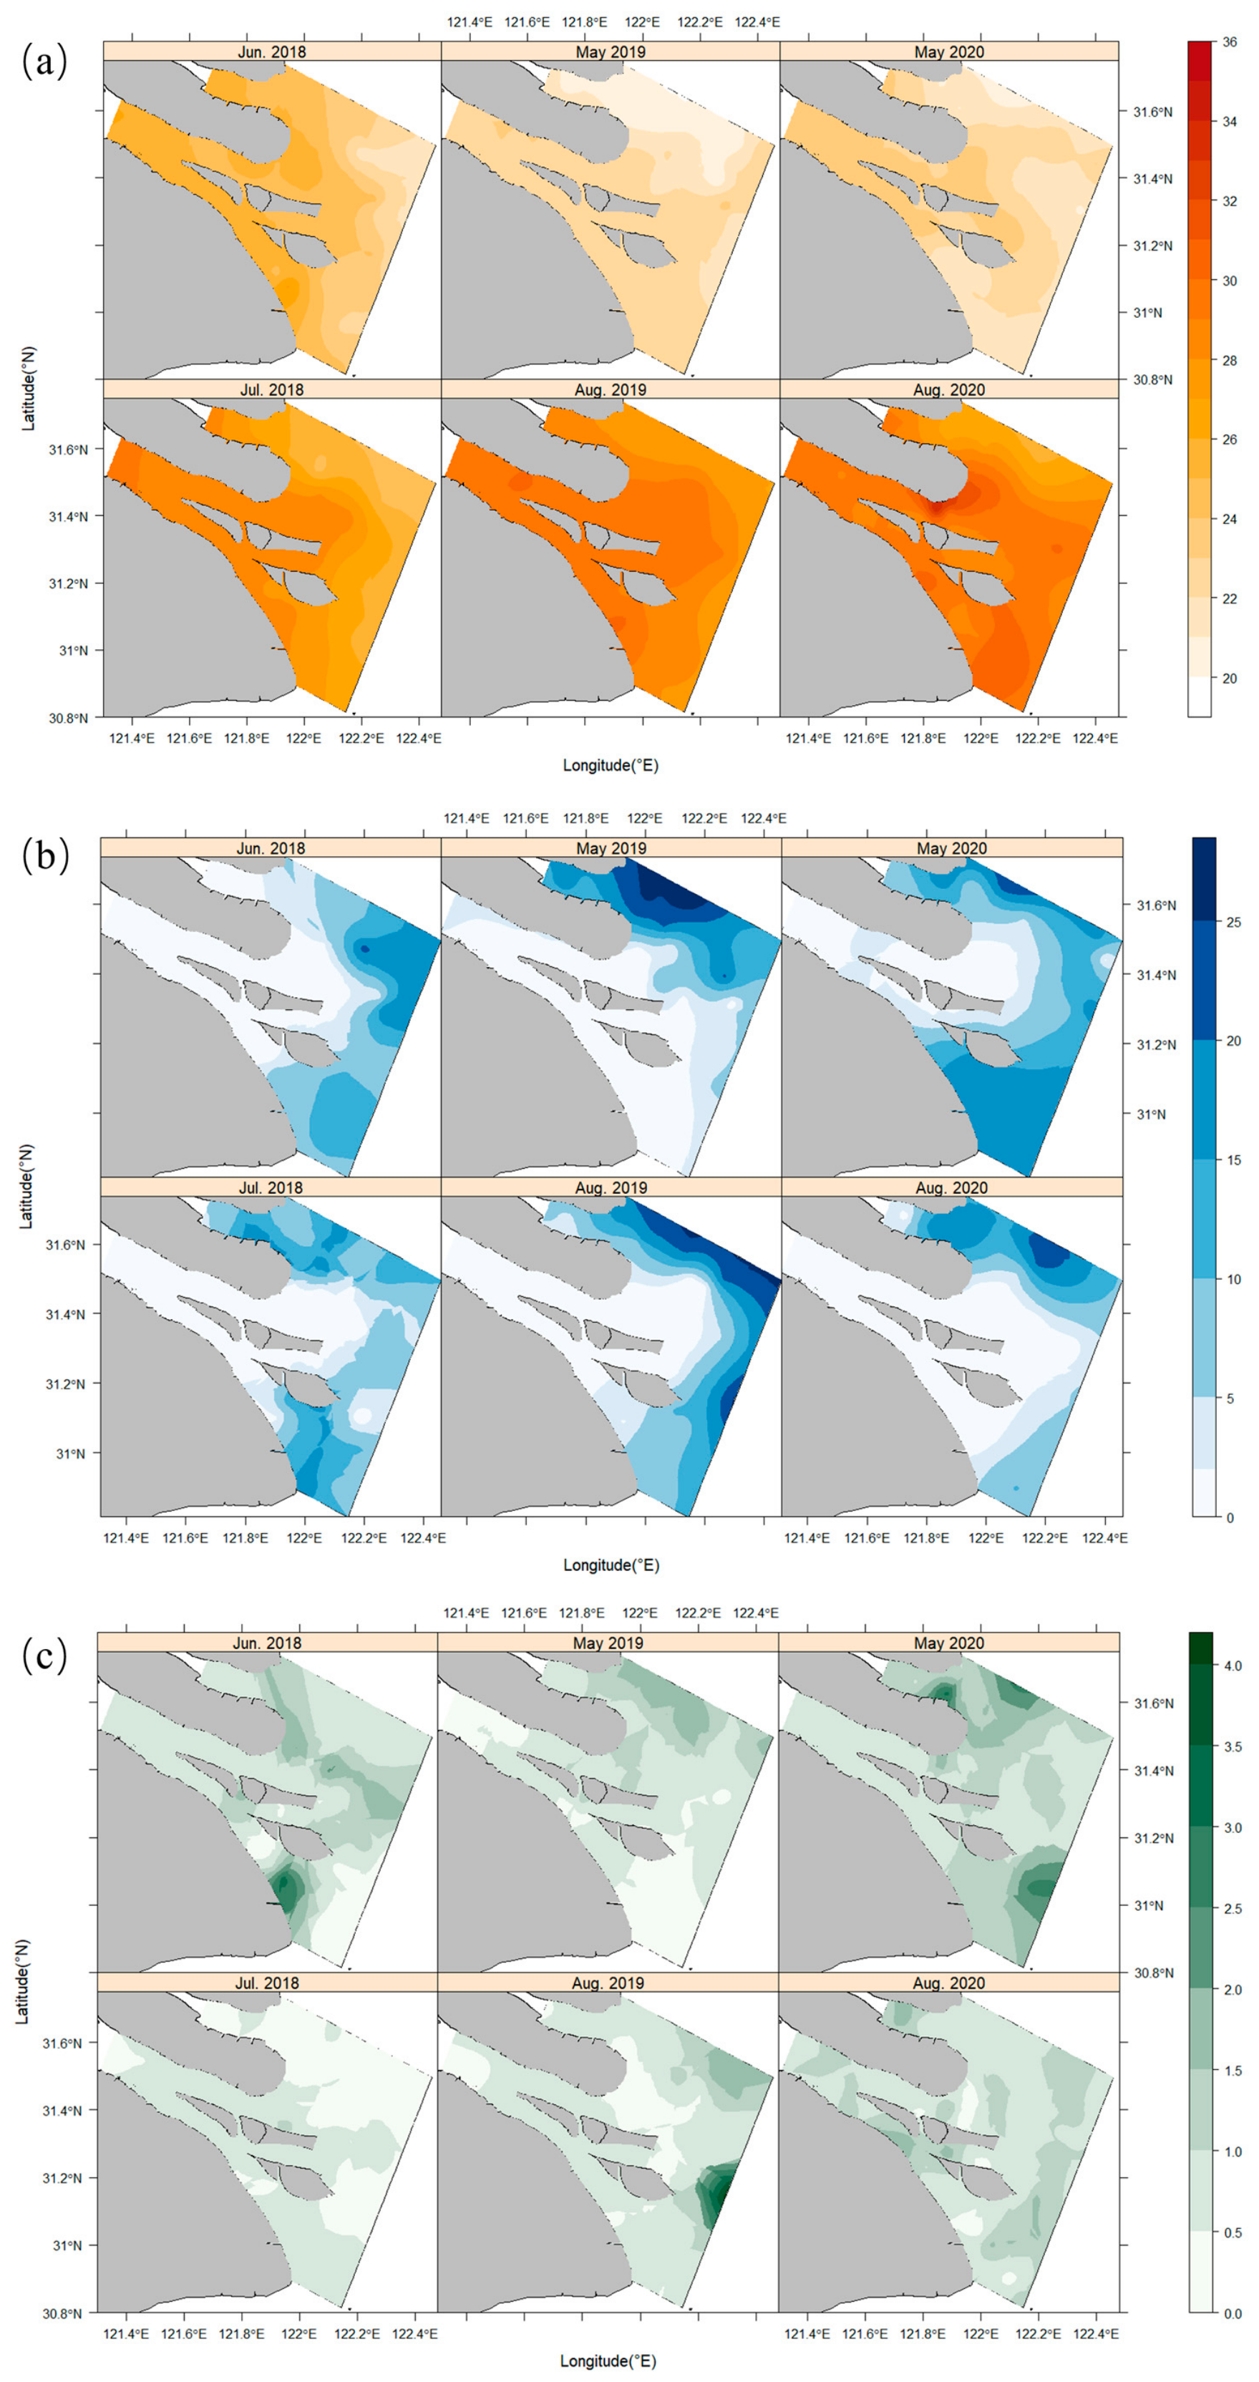
Across all six surveys, SST exhibited a persistent spatial decline from the South Branch to the North Branch and from inshore to offshore (Figure 3a). Spring values in May were moderate and narrowly ranged, averaging 22.08 °C (2019) and 22.48 °C (2020), with both years falling between 20.0 and 24.0 °C. Summer readings were notably higher and far more heterogeneous: June 2018 averaged 24.55 °C (21.49–27.16 °C), July 2018 averaged 27.41 °C (24.48–29.63 °C), August 2019 averaged 28.96 °C (28.0–30.0 °C), and August 2020 averaged 29.14 °C (26.0–34.17 °C). The study-wide maximum of 34.17 °C, observed in the North Channel and off Chongming East Beach during August 2020, marked a distinct thermal extreme.
SSS followed the opposite spatial gradient, rising from <2 in the upper South Branch to >25 offshore, and a sharp inter-branch contrast prevailed: the South Branch remained under freshwater influence from the Yangtze, whereas the North Branch sustained higher SSS (>10) due to East China Sea saltwater incursion (Figure 3b). A notable intrusion event struck the South Branch in May 2020, with SSS of 2–5 recorded near Changxing Island; in contrast, August 2020 yielded the lowest summer-mean SSS (4.30) across all surveys, as flood-season runoff expanded the low-salinity footprint.
SSCHL concentrations were highly variable in both space and time, spanning 0.01–4.56 mg·m−3 (Figure 3c). The highest mean SSCHL (1.87 mg·m−3) occurred in August 2019, peaking at 4.56 mg·m−3 in the South Passage, while spring means were moderate: 0.75 mg·m−3 (0.01–1.96) in May 2019 and 1.14 mg·m−3 (0.12–3.18) in May 2020. During the latter survey, patches with SSCHL > 3 mg·m−3 appeared at the North Branch mouth and South Passage.

3.3. Distribution Patterns of Spawning and Nursery Habitats

3.3.1. Spawning Habitat Distribution

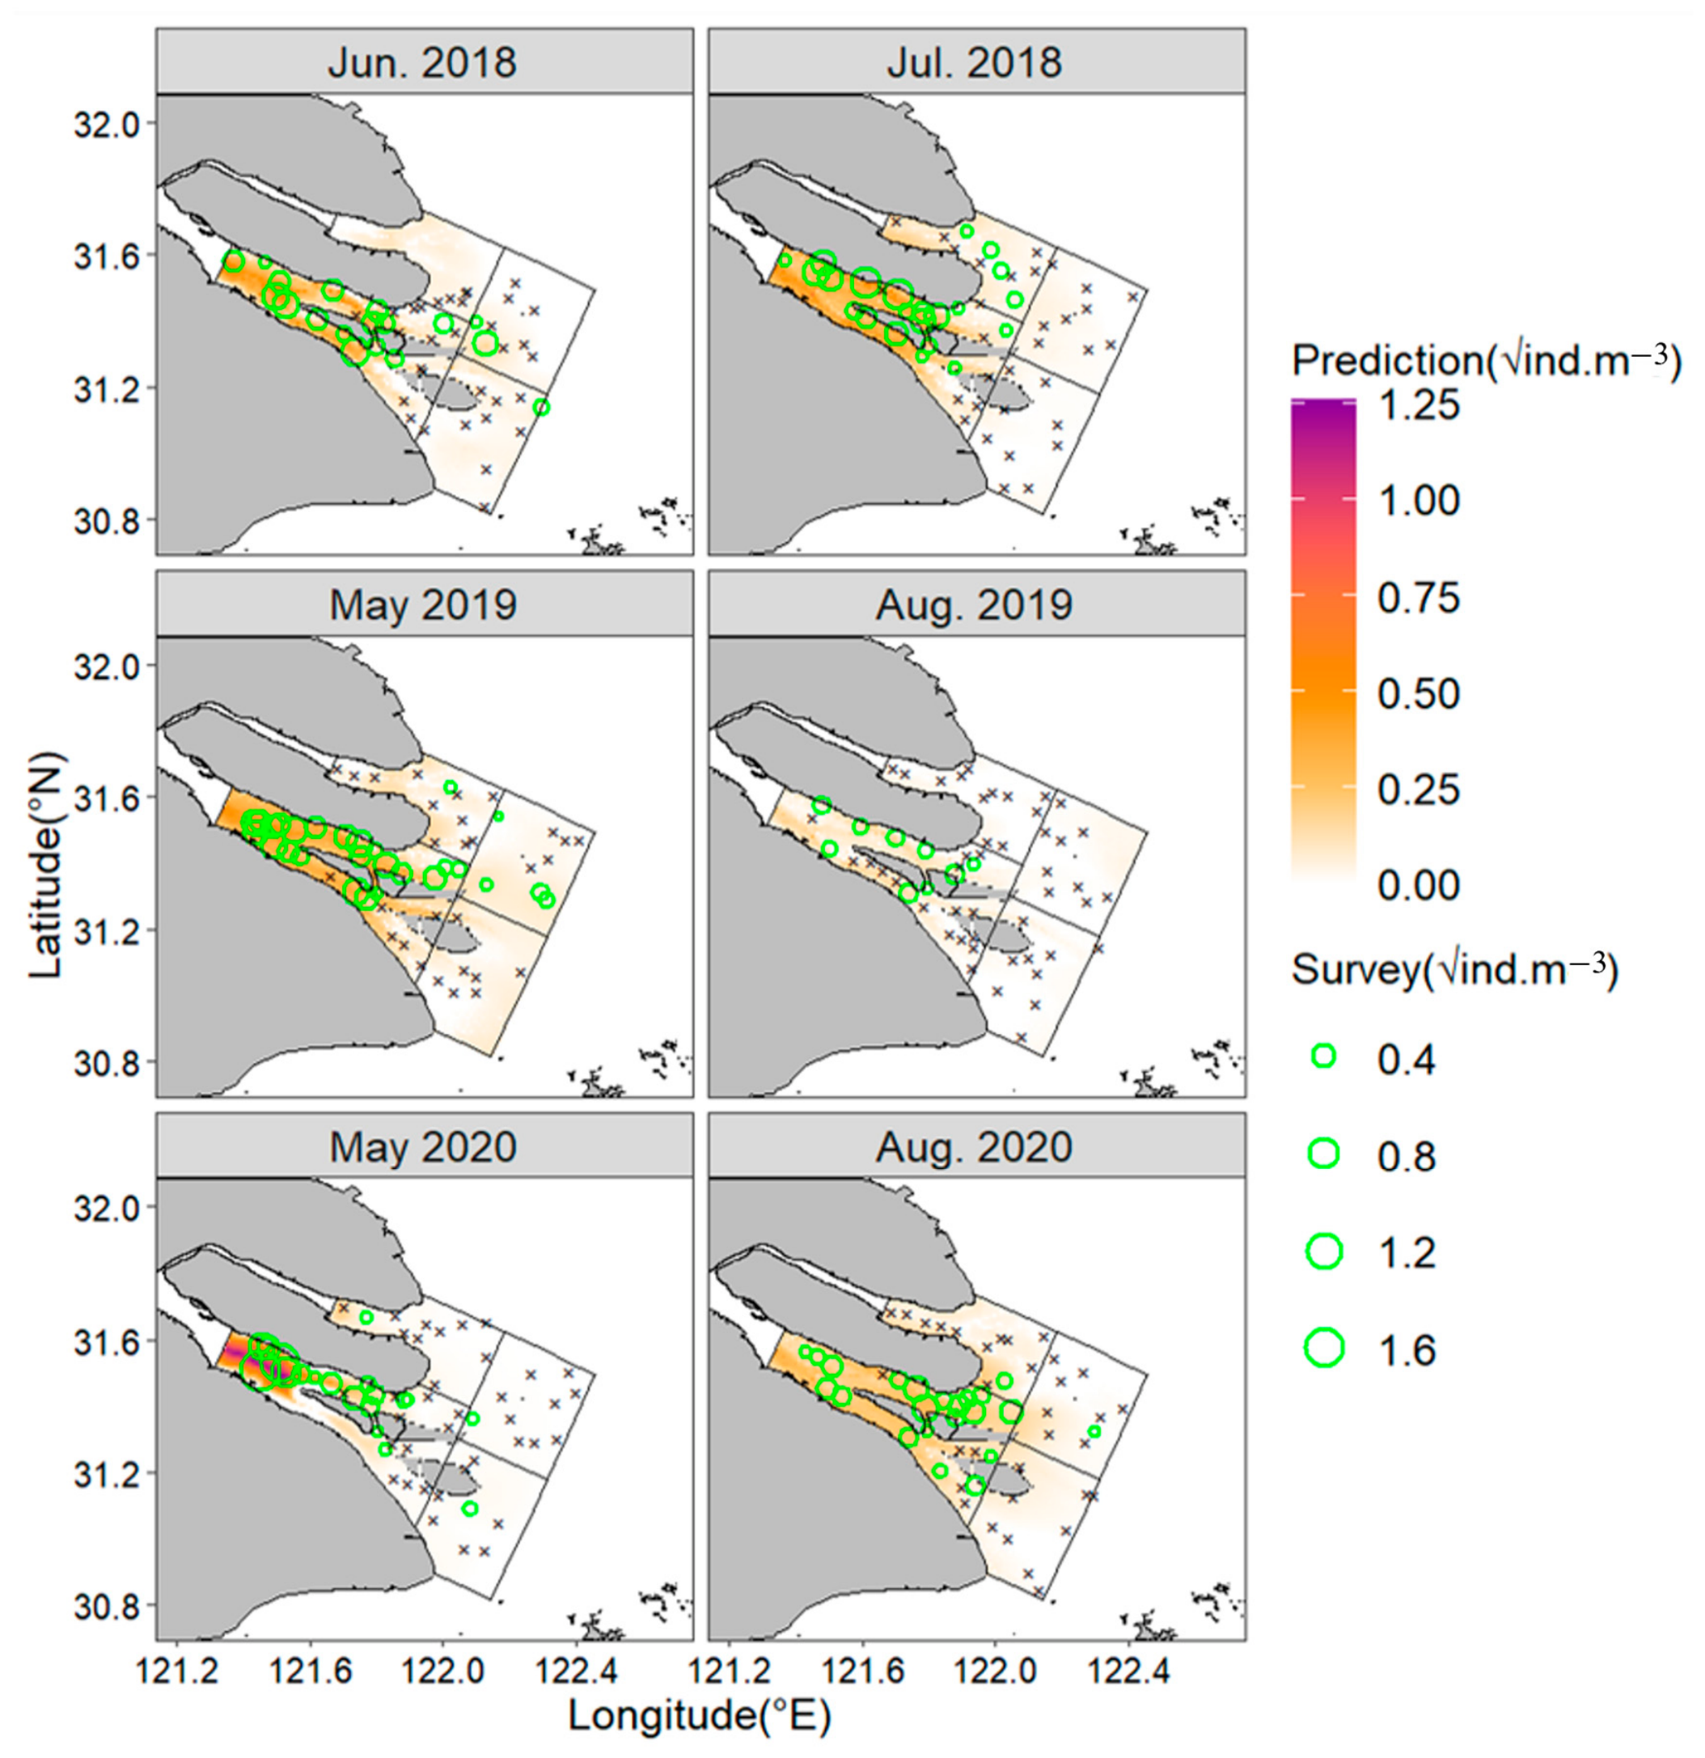
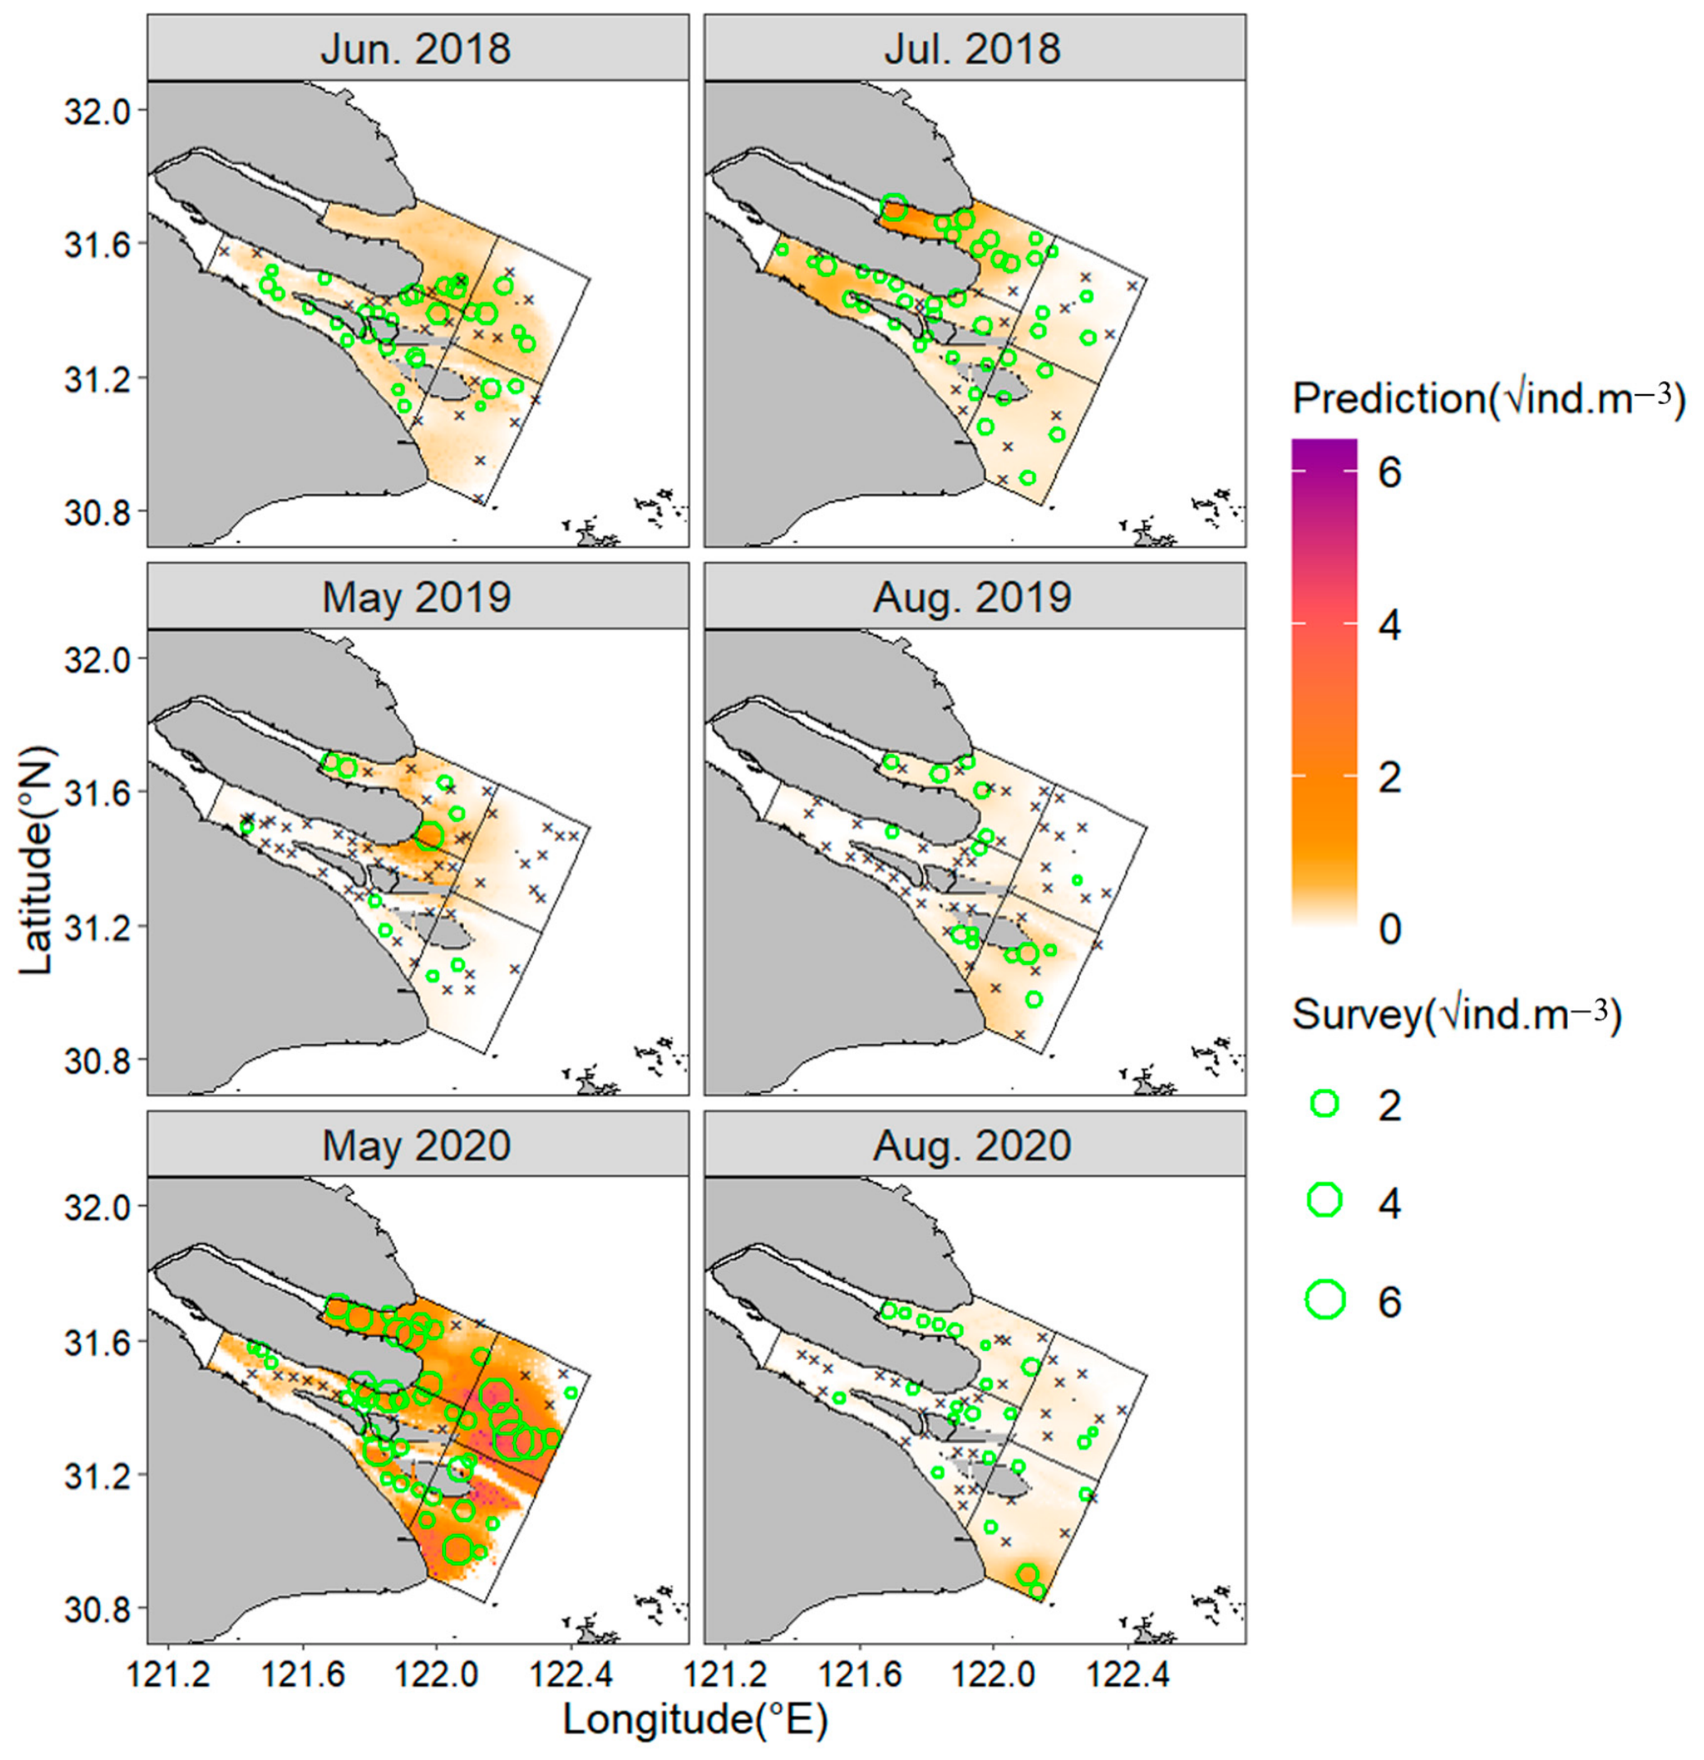
Across the six surveys, 4146 eggs of C. mystus were collected, with monthly catches ranging from 50 to 1355 individuals. GWR predictions consistently placed the primary spawning grounds in the middle reaches of the South Branch, near Chongming, Changxing, and Hengsha Islands (Figure 4), across all study years. In the North Branch, by contrast, no persistent spawning habitat was indicated, and only isolated eggs were recovered on occasion. Spawning intensity exhibited a clear seasonal rhythm, peaking in May–June and then falling off sharply by August. Interannual comparisons revealed a marked increase from 2018 to 2020. The mean egg density in May 2020 was about double that in May 2019, and the August 2020 value exceeded its 2019 counterpart by more than sevenfold.

3.3.2. Nursery Habitat Distribution

A total of 47,476 C. mystus larvae were collected, with monthly catches ranging from 574 individuals in August 2019 to 40,357 in May 2020. Larval density showed distinct seasonal variation, reaching its highest levels during the peak spawning period from May to July and declining sharply toward late August (Figure 5). Interannual comparison revealed a pronounced increase in larval abundance over the study period. The maximum larval density in May 2020 was roughly 15 times that observed in May 2019, while densities in August were comparable between 2019 and 2020 despite the general reduction in spawning activity at the end of the reproductive season.
In contrast to the relatively concentrated distribution of spawning habitats in the middle South Branch, nursery habitats of C. mystus exhibited a consistent dual-core aggregation structure across all six survey cruises from 2018 to 2020. The northern core, located in the North Branch mouth and Chongming East Beach, consistently harbored higher larval densities than the southern core, with a peak value of 44.02 ind·m−3 recorded in May 2020. The southern core was distributed in the North and South Passages, with a maximum density of 7.42 ind·m−3 in May 2019. High-chlorophyll patches (>3 mg·m−3) observed in May 2020 coincided spatially with these two larval core areas. Low-density larvae were also widely dispersed in the offshore waters of the North Branch, but no additional high-density aggregation was identified in this region.

3.4. Spatially Non-Stationary Environmental Effects

3.4.1. Effects on Spawning Habitat

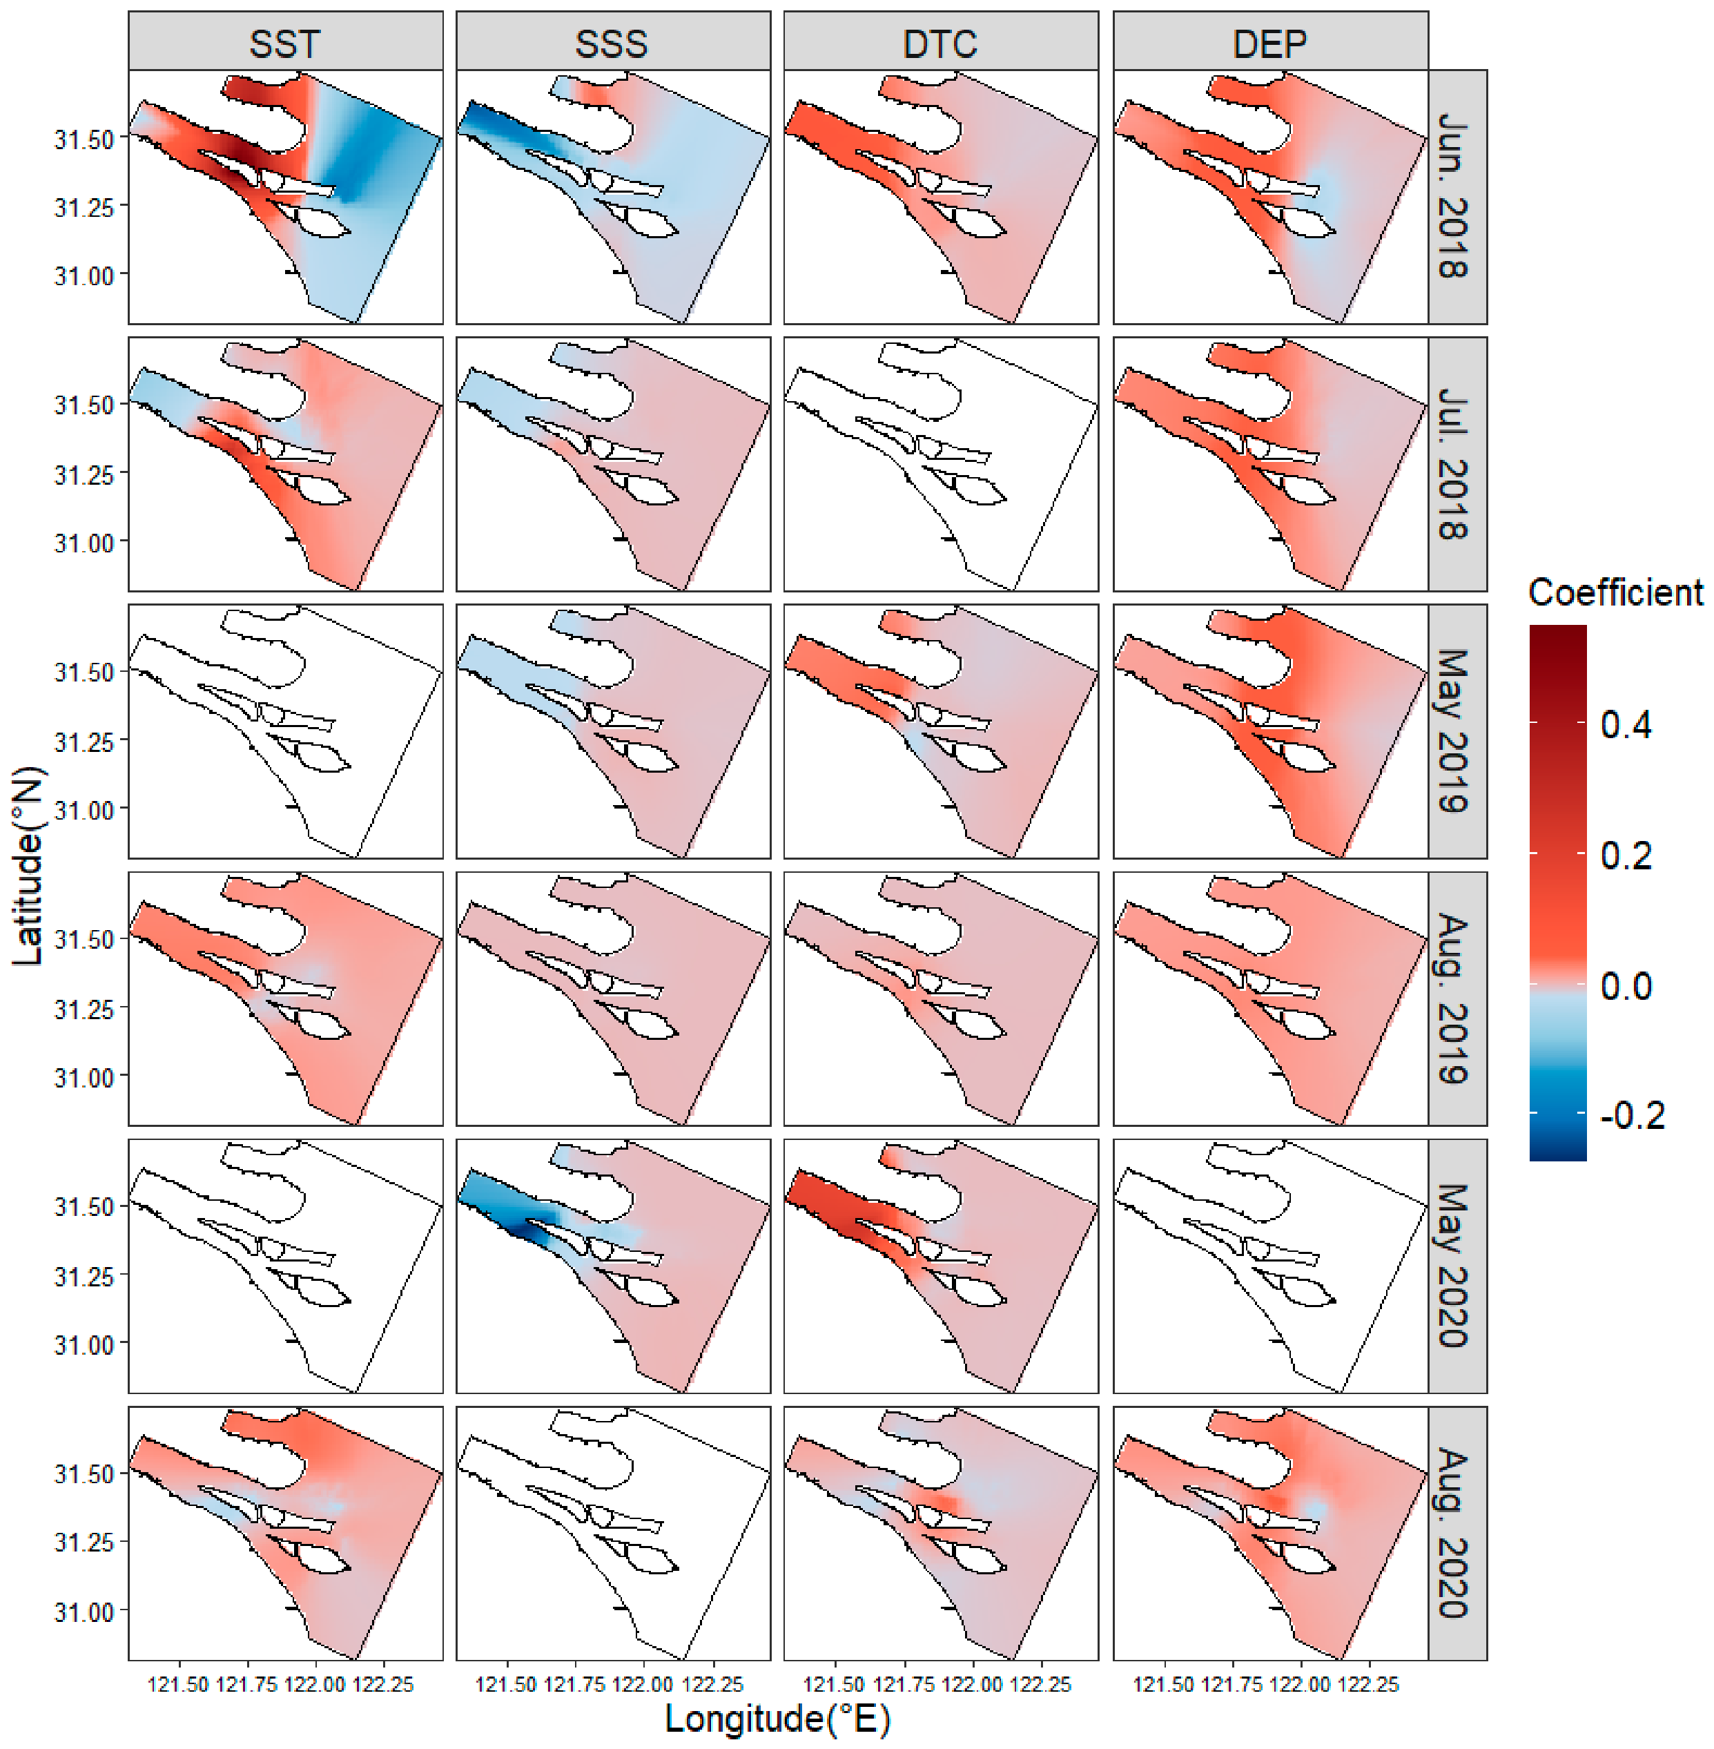
The non-stationary environmental effects on spawning habitat showed distinct seasonal patterns (Figure 6). In spring, SSS and DTC were the dominant drivers of egg distribution, both with strong spatial heterogeneity. SSS was negatively correlated with egg density in the upper South Branch and the North Branch mouth, and the magnitude of this negative effect increased sharply from −0.022 in May 2019 to −0.275 in May 2020, consistent with the intensified saltwater intrusion in the South Branch during the latter period. DTC showed positive effects on egg density in upstream waters near Changxing Island but negative effects in downstream reaches near Hengsha Island. DEP was generally positively associated with egg density across most of the study area, though this positive effect weakened in the deepest reaches of the Deepwater Navigation Channel, where egg densities were similar to those in adjacent shallower habitats. In summer, SST replaced SSS as the primary environmental driver, and its effects also varied markedly across space. In June and July 2018, SST was positively correlated with egg density in the upper South Branch but negatively correlated in offshore waters, with more intricate spatial patterns within the South Branch. In August 2019, when SST remained within a moderately high range (28–30 °C), it exerted a broadly positive effect on egg density. Under extreme high temperatures in August 2020 (maximum SST > 32 °C), however, SST showed significant negative correlations in the North Channel and waters around Changxing Island. Compared with spring, the influence of SSS on egg distribution weakened substantially in summer, with coefficients approaching zero in most regions. DTC and DEP maintained spatially heterogeneous effects throughout summer, with positive correlations in upstream reaches and negative correlations in offshore waters.

3.4.2. Effects on Nursery Habitat

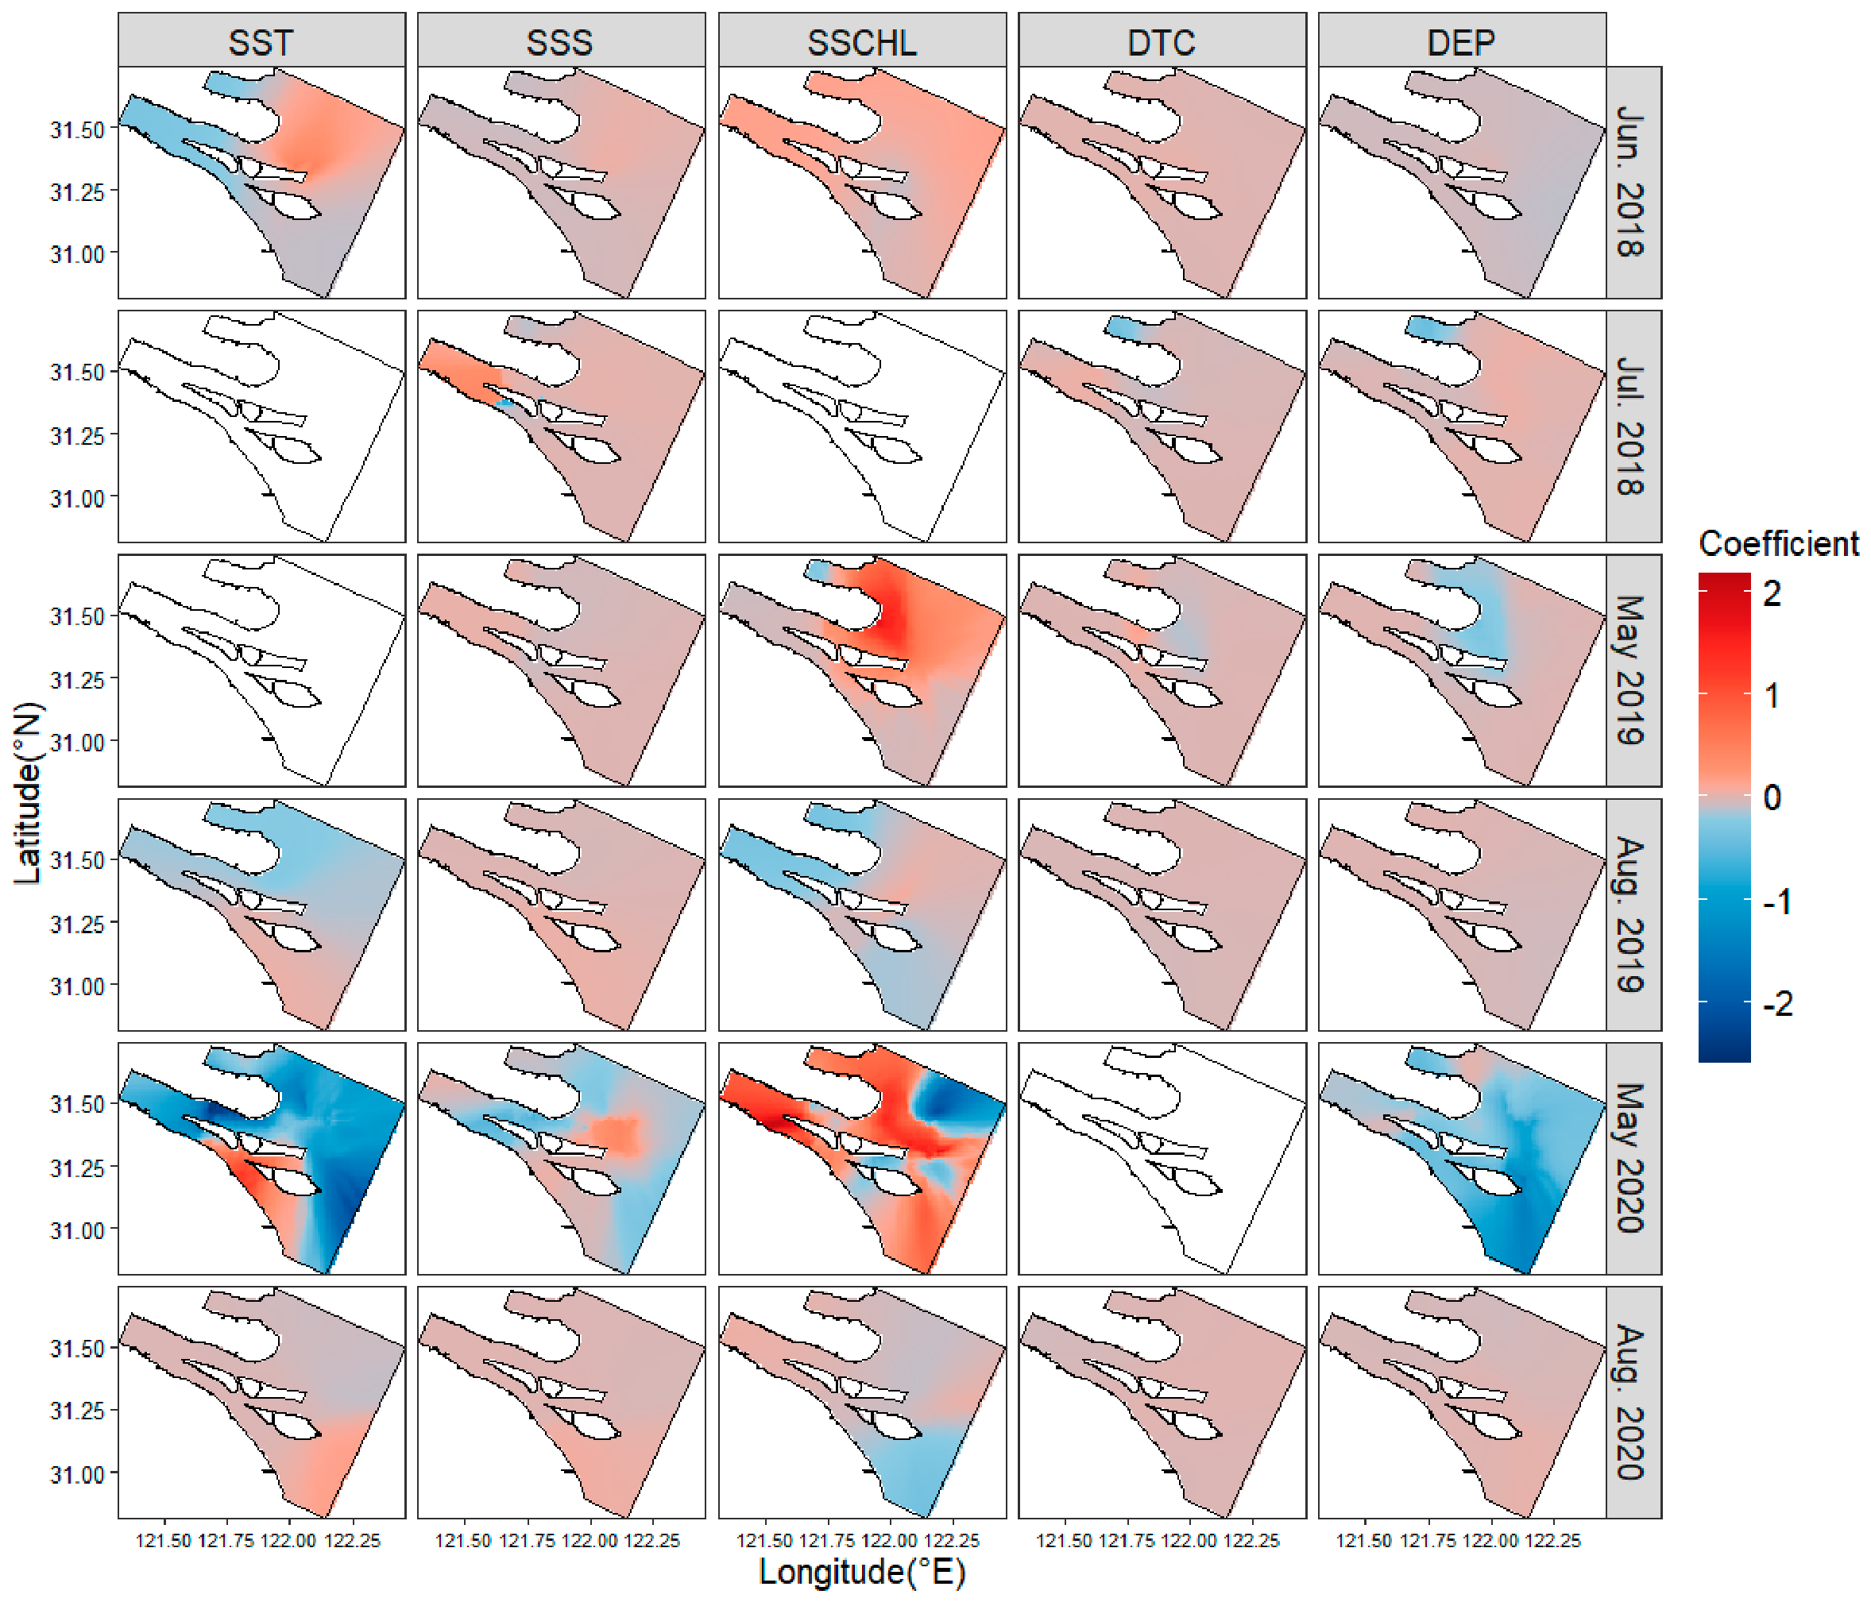
The environmental effects on larval distribution displayed more complex spatial non-stationarity than those on eggs, with SSCHL emerging as a key explanatory variable that was not included in any optimal egg model (Figure 7). In spring, SSCHL showed an extremely strong positive correlation with larval density in the North Channel, Chongming East Beach and the North Branch mouth in May 2019 (maximum coefficient = 1.69), reflecting a close association between larval distribution and food availability. In May 2020, by contrast, SST became the dominant factor: strong negative correlations were observed in the North Branch and offshore waters (minimum coefficient = −2.59), corresponding to lower larval densities in high-temperature waters. SSCHL showed mixed effects in this month, with positive correlations across most areas but negative correlations in waters with extremely high concentrations (>3 mg·m−3). SSS was negatively related to larval density around Changxing Island but positively related in the estuary mouth. In summer, the dominant drivers of larval distribution shifted month by month. In June 2018, SST and SSS were the primary factors: SST was positively associated with larval density in the estuary mouth but negatively associated in the upper South Branch, while SSS exhibited the opposite spatial pattern. In July 2018, DTC and DEP became the dominant variables, both showing strong negative correlations in the North Branch mouth and around Hengsha Island, consistent with higher larval densities in shallow, nearshore waters. In August of both 2019 and 2020, SSS and SSCHL exerted more prominent effects; SSCHL was negatively correlated with larval density in the upper South Branch and nearshore waters, a pattern potentially linked to deteriorated water quality in these high-chlorophyll zones. Overall, the regression coefficients for larval models spanned a wider range than those for egg models.

4. Discussion

4.1. Methodological Performance of GWR Models

Global regression approaches such as GLM and GAM have been extensively used to quantify associations between fish habitats and environmental variables [24,25]. These methods treat the entire study area as a homogeneous unit and operate under the assumption of spatial stationarity. In estuarine systems characterized by steep environmental gradients and pronounced spatial heterogeneity, however, such an assumption tends to obscure fine-scale, location-specific relationships between organisms and their surroundings. In the present study, local regression coefficients for all examined environmental variables showed clear spatial variation across the Yangtze Estuary, demonstrating that the effects of abiotic conditions on the distribution of C. mystus spawning and nursery habitats are spatially non-stationary. For this reason, GWR is more appropriate than global models for this study system, as it captures the spatially varying mechanisms of habitat selection that would otherwise be masked.
Model validation indicated that spatial autocorrelation in residuals was effectively eliminated for most survey cruises, with generally acceptable goodness-of-fit and prediction error. Egg models showed moderate-to-good goodness-of-fit, with R2 values ranging from 0.53 to 0.69, while larval model performance was more variable across cruises. Several limitations of the GWR specification should be acknowledged. First, the relatively small number of stations per cruise may lead to instability in local coefficient estimates, particularly for models with small bandwidths. Second, while local VIF values remain largely acceptable, fine-scale collinearity may still affect interpretation in specific sub-areas. Third, the square-root transformation reduces skewness but does not fully resolve the count-data nature of egg/larval abundance, and residual non-normality remains for the most patchy larval dataset. Although GWR has been applied to marine and freshwater habitat studies in several regions [26,27,28], it has rarely been used to explore spatially non-stationary effects on the early life stages of estuarine fishes [18]. Our results confirm the applicability of this approach in estuarine ichthyoplankton research and provide a methodological reference for similar studies.

4.2. Spawning Habitat of C. mystus

4.2.1. Environmental Drivers of Spawning Distribution

The abiotic factors governing spawning habitat distribution exhibited distinct seasonal patterns. In spring, water temperatures ranged from 19 to 24 °C, which falls within the optimal range for C. mystus reproduction, and SSS accordingly became the primary limiting factor for spawning distribution [29]. Previous studies based on stepwise regression and GAM have reported an overall negative linear relationship between SSS and egg abundance [30,31]. Our GWR results further revealed substantial spatial heterogeneity in this relationship: during the saltwater intrusion event in the South Branch in May 2020 [32], the negative effect of salinity on egg density intensified markedly in the upper and middle reaches. It is inferred that spawning adults shifted upstream to avoid advecting eggs into unsuitable high-salinity waters, a behavioral strategy that maximizes egg survival. However, we note that egg distribution patterns reflect the combined outcome of adult spawning site selection and passive hydrodynamic transport after spawning, and cannot be used to pinpoint exact spawning locations of adults.
In summer, SST replaced salinity and geographic variables as the dominant driver of spawning distribution. This conclusion differs from some earlier findings [29], which may be explained by the fact that average summer water temperature in earlier surveys was below 28 °C. Accumulated evidence shows that seasonal water temperature rise accelerates gonadal maturation and stimulates spawning activity [33], consistent with the widespread positive correlation between SST and egg density in high-density spawning areas in August 2019. In August 2020, however, when water temperature reached as high as 34 °C, SST was negatively correlated with egg density across most of the study area. This reversal indicates that excessive thermal stress inhibits spawning activity and may increase egg mortality, which aligns with historical observations that rising water temperature in the Yangtze Estuary caused a pronounced decline in C. mystus catch [34].
Depth and distance to coast also exerted spatially non-stationary effects on spawning distribution. DEP was positively associated with egg density in most months, supporting the established view that C. mystus prefers deeper waters for spawning [35]. This positive effect weakened in the deepest sections of the Deepwater Navigation Channel, where egg densities were comparable to those in adjacent shallower waters. The negative depth effect observed in offshore North Branch is attributable to hydrodynamic transport of eggs rather than active spawning site selection. The spatial pattern of DTC coefficients reflects divergent position preferences along the estuarine gradient: spawning adults favor mid-channel habitats in inner estuary reaches but shift to nearshore waters in more seaward sections. The atypical DTC effect in August 2020 is probably because, under extreme heat stress, spawning adults prioritize suitable water temperature over geographic position to maximize egg survival.

4.2.2. Distribution Patterns of Spawning Grounds

Predicted spawning grounds were consistently concentrated in the middle reaches of the South Branch, in waters adjacent to Chongming, Changxing and Hengsha Islands. This distribution matches well with historically documented spawning grounds of C. mystus in the Yangtze Estuary [8]. Given that C. mystus has a freshwater phase in its life history, the upper South Branch also has the potential to serve as spawning habitat. The core range of spawning grounds remained relatively stable across survey years, suggesting that C. mystus, like many migratory fish species, may exhibit natal homing tendencies, although the specific environmental cues driving this behavior remain unclear.
On an interannual scale, total egg abundance increased notably from 2019 to 2020. This increasing trend coincides with the suspension of the C. mystus special fishing permit in 2019 and the implementation of the Yangtze River 10-Year Fishing Ban in 2020. However, a two-year comparison without control sites or multi-year baseline data cannot establish a causal link between management measures and stock recovery. Interannual hydrological variation, environmental conditions and survey catchability may also contribute to abundance changes. Long-term continuous monitoring is required to verify population recovery trajectories. Superimposed on this trend are hydrologically driven spatial shifts: the spawning ground moved approximately 10 km upstream in spring 2020 in response to saltwater intrusion. Overall, the distribution of C. mystus spawning grounds is shaped jointly by anthropogenic management and natural hydrological variability, both of which should be considered in long-term conservation planning.

4.3. Nursery Habitat of C. mystus

4.3.1. Environmental Drivers on Larval Distribution

Compared with eggs, larval distribution is regulated by a more complex set of environmental factors. Early-stage larvae have limited swimming ability, and their distribution is largely governed by local hydrodynamic transport [36]. As larvae develop, autonomous behavior gradually becomes the dominant driver of distribution, and environmental factors such as prey availability, temperature and salinity play increasingly important roles [37]. Among these factors, prey distribution is one driver of larval movement. C. mystus larvae are mainly filter feeders that prey on small copepods and planktonic larvae, and both the North Branch mouth and the North–South Passage mouths are recognized high-abundance zones for zooplankton, which correspond closely to the dual-core nursery areas identified in this study [38,39]. Chlorophyll-a serves as a coarse proxy for phytoplankton biomass and secondary productivity, and the general spatial correspondence between high SSCHL and high larval density is consistent with the prey availability hypothesis. However, chlorophyll-a concentration does not directly measure zooplankton abundance, and the coupling between phytoplankton and zooplankton may vary spatially and temporally in the estuary. Further comparison shows that the relationships between larval density and SSS, SST and SSCHL are consistent with the response patterns of zooplankton to these three variables in the Yangtze Estuary, supporting the inference that zooplankton distribution underlies the spatial pattern of C. mystus larvae.
Salinity is another key factor structuring larval distribution. Previous work has reported that the upper salinity limit for suitable C. mystus larval habitat is approximately 19 [40], and our observations confirm that larvae aggregate mainly on the freshwater side of the estuarine salinity front. In May 2020, saltwater intrusion in the South Branch pushed the salinity front further upstream, and the spawning ground shifted accordingly, slowing the advection of eggs and early larvae toward the estuary mouth and altering the overall larval distribution pattern. Notably, larval habitat selection prioritizes salinity over temperature. In August 2020, for example, larvae maintained high densities in the North and South Passage mouths despite relatively high water temperatures, because salinity conditions in these areas remained within the optimal range. The atypical effects of depth and chlorophyll-a in the same month can also be explained by this hierarchy of salinity preference. In general, larvae tended to occupy relatively cool waters, consistent with the documented suitable temperature range of 20–25.2 °C [40].
The relationship between SSCHL and larval density was nonlinear. In May 2019, larval density generally increased with chlorophyll concentration, reflecting the bottom-up support of primary production for prey resources. At concentrations above 3 mg/m3, however, SSCHL was negatively correlated with larval density, a pattern that cannot be explained by food availability alone. High-chlorophyll zones in the Yangtze Estuary often coincide with elevated turbidity, land-sourced nutrient input and altered water quality [39]. Multiple co-occurring stressors in these nearshore zones may drive the negative association with larval density. Active larval avoidance is one possible explanation, but passive hydrodynamic sorting and differential survival rates cannot be ruled out. We emphasize that pollution status was not directly measured in this study, and chlorophyll-a alone cannot be used as a pollution indicator. Depth also significantly influenced larval distribution, with a generally positive relationship in most months, indicating that larvae prefer moderately deep waters consistent with the reported suitable depth range of 9–11 m.

4.3.2. Distribution Patterns and Formation Mechanism

Both field survey data and model predictions show that C. mystus larvae are widely distributed in the middle reaches and mouth areas of the Yangtze Estuary, forming a stable dual-core abundance structure. The northern core is located at the North Branch mouth and near Chongming East Beach, while the southern core lies in the North and South Passage areas. This pattern is consistent with multiple independent studies [5,40], and both core areas correspond closely to suitable larval habitat during both flood and ebb tides, indicating that the dual-core structure is a persistent feature of C. mystus nursery grounds rather than a sampling artifact.
The formation of this dual-core pattern results from the combined action of hydrodynamic transport and larval habitat selection. Physically, spawning grounds are concentrated around Chongming, Changxing and Hengsha Islands. Residual currents in the North Channel and Chongming East Beach rotate counterclockwise northward, while those in the South Channel flow seaward parallel to the shore. Coupled with the barrier effect of islands, eggs and early-stage larvae are advected by the bidirectional flow field into the North Branch mouth and the North–South Passage mouths, respectively, providing the physical template for the dual-core pattern. This hydrodynamic mechanism explains why the dual-core structure is stable across years, rather than being caused by a single seawater intrusion event. Ecologically, both mouth zones lie along the estuarine salinity front and support high zooplankton biomass, which provides sufficient food for larval survival. As larvae develop swimming ability, they actively remain in these favorable habitats and maintain high densities. The consistently higher larval abundance in the northern core is probably attributable to the larger contributing spawning area that supplies this zone via the North Channel.
Seasonally, larval abundance was highest from May to July during peak spawning and decreased in August toward the end of the spawning season. Given the limited survey years and inconsistent sampling months between 2018 and 2019–2020, we cannot conclude that the reproductive migration cycle has remained unchanged. Only longer time series can verify long-term phenological shifts. Interannually, larval abundance increased substantially from 2019 to 2020, consistent with the trend in egg abundance. As noted above, this trend coincides with fishery conservation measures but cannot be definitively attributed to them. Long-term monitoring is needed to assess population recovery. In summary, the nursery grounds of C. mystus in the Yangtze Estuary maintain a long-term dual-core structure shaped jointly by hydrodynamic transport and active larval habitat selection. Prey availability is the primary driver of larval movement; larvae favor deep, cool waters on the freshwater side of the salinity front, actively avoid potentially polluted high-chlorophyll waters, and prioritize suitable salinity over other environmental factors in habitat selection [39].

4.4. Evaluation of Research Hypotheses

Overall, both core ecological hypotheses proposed in this study are well supported by the empirical results. Spawning habitats are persistently concentrated in the middle reaches of the upstream South Branch, while nursery habitats form a stable dual-core aggregation structure at the North Branch mouth and the North/South Passages near the estuary mouth, which is consistent with the expected ecological process that eggs are spawned in upstream freshwater-influenced waters and larvae are gradually transported downstream by hydrodynamics to form growth aggregation zones. Salinity and temperature act as the dominant physical regulators of spawning habitat distribution, and chlorophyll-a is never retained in optimal egg models, indicating that food availability is not a primary limiting factor for adult spawning site selection; by contrast, chlorophyll-a is consistently selected as a key explanatory variable in almost all larval optimal models alongside salinity and temperature, confirming that food-related factors play an additional important role in structuring nursery habitat distribution and represent a core difference in environmental control mechanisms between the two habitats.

5. Conclusions

This study reveals clear differentiation in spatial distribution patterns and environmental correlates between spawning and nursery habitats of Coilia mystus in the Yangtze Estuary. Spawning habitats remain tightly clustered in the middle South Branch, regulated primarily by salinity in spring and water temperature in summer; nursery habitats form a persistent dual-core structure at the estuary mouth, shaped jointly by salinity, temperature and food availability. Egg and larval abundance increased from 2019 to 2020 for the same survey months. This trend coincides with the implementation of the Yangtze River Fishing Ban, but cannot be definitively linked to management effects. Long-term continuous monitoring is required to verify population recovery trajectories.
This study is limited by its correlative nature and does not quantify the relative contribution of hydrodynamic transport versus active habitat selection. Given the weak swimming capacity of eggs and early larvae, estuarine circulation likely plays a major role in forming the dual-core nursery pattern. Further work integrating hydrodynamic simulations and particle-tracking models is needed to clarify the underlying mechanisms, which will refine targeted habitat protection and fisheries management for this species.

Supplementary Materials

The following supporting information can be downloaded at: https://www.mdpi.com/article/10.3390/fishes11090499/s1, Table S1: Overview of previously published and original components in this study.

Author Contributions

Conceptualization, Z.L., R.W., T.L. and Y.G.; methodology, X.L.; writing—original draft preparation, D.W. and P.S.; writing—review and editing, P.S. All authors have read and agreed to the published version of the manuscript.

Funding

This study was supported by the Impacts of Representative Aquatic Pollutants on the Spatiotemporal Distribution of Ichthyoplankton in Hangzhou Bay (Grant No. 33000023013031803701316) and the Research Fund for the Doctoral Program (Grant No. 2025KYQDJJ016).

Institutional Review Board Statement

This study complies with the Specifications for Oceanographic Surveys Part 6: Marine Biological Surveys and the laws of China. The fish samples were collected with a large plankton net, and the samples were dead when they were obtained. Ethical approval was not required for this study.

Data Availability Statement

The original contributions presented in this study are included in the article. Further inquiries can be directed to the corresponding author.

Acknowledgments

We thank our colleagues for their contributions to data collection and laboratory experiments. Comments by anonymous reviewers on earlier versions helped improve the manuscript.

Conflicts of Interest

The authors declare no conflict of interest.

References

  1. Whitfield, A.K.; Houde, E.D.; Neira, F.J.; Potter, I.C. Importance of marine-estuarine-riverine connectivity to larvae and early juveniles of estuary-associated fish taxa. Environ. Biol. Fishes 2023, 106, 1023–1045. [Google Scholar] [CrossRef] [Scilit]
  2. Zhuang, P.; Wang, Y.H.; Li, S.F.; Deng, S.M.; Li, C.S.; Ni, Y. Fishes of the Yangtze Estuary; Shanghai Scientific and Technical Publishers: Shanghai, China, 2006. (In Chinese) [Google Scholar]
  3. Zhao, F.; Yang, Q.; Song, C.; Zhang, Z.; Zhuang, P. Research progress on biological characteristics and resource utilization of Coilia mystus in the Yangtze Estuary. Mar. Fish. 2020, 42, 110–119. (In Chinese) [Google Scholar]
  4. He, W.P. Study on Early Life History and Reproductive Biology of Coilia mystus in the Yangtze Estuary. Ph.D. thesis, Institute of Hydrobiology, Chinese Academy of Sciences, Wuhan, China, 2010. (In Chinese) [Google Scholar]
  5. Hu, L.J.; Song, C.; Geng, Z.; Zhao, F.; Jiang, J.; Liu, R.H.; Zhuang, P. Spatiotemporal distribution characteristics of Coilia mystus larvae and juveniles during main breeding season in the Yangtze Estuary. J. Fish. Sci. China 2021, 28, 1152–1161. (In Chinese) [Google Scholar]
  6. Wang, D. Study on Distribution Characteristics and Transport Mechanism of Early Resources of Coilia mystus in the Yangtze Estuary. Ph.D. thesis, Shanghai Ocean University, Shanghai, China, 2023. (In Chinese) [Google Scholar]
  7. Liu, K.; Zhang, M.Y.; Xu, D.P.; Shi, W. Resource variation and maximum sustainable yield of Coilia mystus in the Yangtze Estuary. J. Shanghai Fish. Univ. 2004, 13, 298–303. (In Chinese) [Google Scholar]
  8. Ni, Y. Fishery and resource conservation of Coilia mystus in the Yangtze Estuary. J. Fish. Sci. China 1999, 6, 75–77. (In Chinese) [Google Scholar]
  9. Ministry of Agriculture and Rural Affairs of the People’s Republic of China. The 10-Year Fishing Ban Plan on the Yangtze River. 2020. Available online: https://www.moa.gov.cn/govpublic/CJB/201912/t20191227_6334010.htm?eqid=b8b66b3b0001e1ec00000006649168d5#1 (accessed on 27 December 2021). (In Chinese)
  10. Fuiman, L.A.; Werner, R.G. Fishery Science: The Unique Contributions of Early Life Stages; Blackwell Science: Oxford, UK, 2008; pp. 64–87. [Google Scholar]
  11. Wan, R.J.; Jiang, Y.W. Ecological study on fish eggs and larvae in the Yangtze Estuary and adjacent waters. Oceanol. Limnol. Sin. 1998, 29, 601–607. (In Chinese) [Google Scholar]
  12. Planque, B.; Fromentin, J.M.; Cury, P.; Drinkwater, K.F.; Jennings, S.; Perry, R.I.; Kifani, S. How does fishing alter marine populations and ecosystems sensitivity to climate? J. Mar. Syst. 2003, 40–41, 93–107. [Google Scholar]
  13. Damalas, D.; Megalofonou, P.; Apostolopoulou, M. Environmental, spatial, temporal and operational effects on swordfish (Xiphias gladius) catch rates of eastern Mediterranean Sea longline fisheries. Fish. Res. 2010, 105, 233–246. [Google Scholar]
  14. Zhao, D.B.; Lu, T.Y.; Chen, J.H.; Wei, G.; Liu, Q.; Wang, X.; Zhong, J.; Lin, J. Distribution of eggs, larvae and juveniles of Coilia fishes and their relationships with environmental factors in the Yangtze Estuary. J. Shanghai Ocean Univ. 2025, 34, 1292–1307. (In Chinese) [Google Scholar]
  15. Brunsdon, C.; Fotheringham, A.S.; Charlton, M.E. Geographically weighted regression: A method for exploring spatial nonstationarity. Geogr. Anal. 1996, 28, 281–298. [Google Scholar] [CrossRef] [Scilit]
  16. Jian, Y.; Zhang, Y.L.; Song, Y.H.; Zhang, C.; Ji, M.; Ren, Y. Effects of environmental factors on fish distribution based on GAM and GWR models: A case study of Sillago sihama in Shandong coastal waters. Haiyang Xuebao 2022, 44, 103–111. (In Chinese) [Google Scholar]
  17. Cullen, D.W.; Guida, V. Use of geographically weighted regression to investigate spatial non-stationary environmental effects on the distributions of black sea bass (Centropristis striata) and scup (Stenotomus chrysops) in the Mid-Atlantic Bight, USA. Fish. Res. 2021, 234, 105795. [Google Scholar] [CrossRef] [Scilit]
  18. Wang, D.; Wan, R.; Li, Z.G.; Zhang, J.B.; Long, X.Y.; Song, P.B.; Zhai, L.; Zhang, S. The non-stationary environmental effects on spawning habitat of fish in estuaries: A case study of Coilia mystus in the Yangtze Estuary. Front. Mar. Sci. 2021, 8, 766616. [Google Scholar] [CrossRef] [Scilit]
  19. Thompson, B.M.; Riley, J.D. Egg and larval development studies in the North Sea cod (Gadus morhua L.). Rapp. Proces. Verbaux Des. Reun. 1981, 178, 553–559. [Google Scholar]
  20. Zhao, C.Y.; Zhang, R.Z.; Lu, S.F.; Chen, L.F. Fish Eggs and Larvae in Chinese Coastal Waters; Shanghai Scientific and Technical Publishers: Shanghai, China, 1985. (In Chinese) [Google Scholar]
  21. Wan, R.J.; Zhang, R.Z. Fish Eggs and Larvae in Chinese Coastal Waters and Adjacent Seas; Shanghai Scientific and Technical Publishers: Shanghai, China, 2016. (In Chinese) [Google Scholar]
  22. O’Brien, R.M. A Caution Regarding Rules of Thumb for Variance Inflation Factors. Qual. Quant. 2007, 41, 673–690. [Google Scholar] [CrossRef] [Scilit]
  23. Molinaro, A.M.; Simon, R.; Pfeiffer, R. Prediction error estimation: A comparison of resampling methods. Bioinformatics 2005, 21, 3301–3307. [Google Scholar] [CrossRef] [Scilit] [PubMed]
  24. Guirhem-Helican, G.L.; Moleo, J.R.N.; Palmos, I.M.M.; Monteclaro, H.M. Predicting the distribution of the invasive charru mussel (Mytella strigata) in estuarine environments. Estuar. Coast. Shelf Sci. 2026, 330, 109706. [Google Scholar] [CrossRef] [Scilit]
  25. Akter, S.; Abhilash, W.K.; Nama, S.; Angmo, S.; Deshmukhe, G.; Nayak, B.B.; Ramteke, K. Phytoplankton-environment dynamics in a tropical estuary of the northeastern Arabian Sea: A Generalized Additive Model (GAM) approach. Environ. Monit. Assess. 2025, 197, 201. [Google Scholar] [CrossRef] [Scilit] [PubMed]
  26. Windle, M.J.S.; Rose, G.A.; Devillers, R.; Fortin, M.-J. Exploring spatial non-stationarity of fisheries survey data using geographically weighted regression (GWR): An example from the Northwest Atlantic. ICES J. Mar. Sci. 2010, 67, 145–154. [Google Scholar] [CrossRef] [Scilit]
  27. Alexander, R.E. A comparison of GLM, GAM, and GWR modeling of fish distribution and abundance in Lake Ontario. Master’s Thesis, University of Southern California, Los Angeles, CA, USA, 2016. [Google Scholar]
  28. Bahri, A.; Khosravi, Y.; Tavakoli, A. Comparison of the Performance of Geographically Weighted Regression and Ordinary Least Squares for modeling of Sea surface temperature in Oman Sea. J. Geospat. Inf. Technol. 2019, 7, 159–172. [Google Scholar] [CrossRef] [Scilit]
  29. Jiang, M.; Shen, X.Q. Distribution characteristics of fish eggs and larvae in the Yangtze Estuary and adjacent waters in summer. Mar. Sci. 2006, 6, 92–97. (In Chinese) [Google Scholar]
  30. Jiang, M.; Shen, X.Q.; Chen, L.F. Relationship between distribution of fish eggs and larvae and environmental factors in the Yangtze Estuary and adjacent waters in spring. Mar. Environ. Sci. 2006, 25, 37–39. (In Chinese) [Google Scholar]
  31. Ding, Y.M. Spatial and Temporal Variation of Fish Recruitment Resources in the Yangtze Estuary. Master’s thesis, Graduate University of Chinese Academy of Sciences, Beijing, China, 2011. (In Chinese) [Google Scholar]
  32. Chen, J.; Zhu, J.R. Sources of saltwater intrusion in Qingcaosha Reservoir in the Yangtze Estuary. Acta Oceanol. Sin. 2014, 36, 131–141. (In Chinese) [Google Scholar]
  33. Jiao, W.J.; Zhang, P.; Chang, J.B.; Tao, J.; Liao, X.; Zhu, B. Variation in the suitability of Chinese sturgeon spawning habitat after construction of dams on the Yangtze River. J. Appl. Ichthyol. 2019, 35, 637–643. [Google Scholar] [CrossRef] [Scilit]
  34. Ni, J.F.; Guo, H.Y.; Tang, W.Q.; Zhang, Y.; Zhuan, X. Interannual variation of catch of Coilia mystus during flood season in the Yangtze Estuary. Mar. Fish. 2020, 42, 192–204. (In Chinese) [Google Scholar]
  35. Zhou, Y.D.; Jin, H.W.; Zhang, H.L.; Zhang, Y.; Pan, G. Distribution characteristics of eggs, larvae and juveniles of Coilia mystus along the northern coast of Zhejiang in spring and summer. J. Zhejiang Ocean Univ. (Nat. Sci.) 2011, 30, 307–312. (In Chinese) [Google Scholar]
  36. Miller, B.S.; Kendall, A.W. Early Life History of Marine Fishes; University of California Press: Berkeley, CA, USA, 2009. [Google Scholar]
  37. Liu, S.H.; Xu, Z.L.; Tian, F.G. Analysis of feeding habits of Coilia mystus in the Yangtze Estuary and adjacent waters. J. Shanghai Ocean Univ. 2012, 21, 9. (In Chinese) [Google Scholar]
  38. Guo, A.; Chen, F.; Zhu, W.B.; Wang, Z.M.; Jiang, R.J.; Zhou, Y.D. Dietary differences of Coilia mystus at different developmental stages in the East China Sea and Yellow Sea. J. Zhejiang Ocean Univ. (Nat. Sci.) 2016, 35, 7. (In Chinese) [Google Scholar]
  39. Yang, H.S.; Zhong, X.Y.; Han, J.D. Water quality pollution in the Yangtze Estuary and its impact on fisheries. J. Fish. Sci. China 1999, 6, 78–82. (In Chinese) [Google Scholar]
  40. Bi, X.J. Reproductive Biology and HSI Evaluation of Coilia mystus in the Yangtze Estuary. Master’s thesis, Shanghai Ocean University, Shanghai, China, 2016. (In Chinese) [Google Scholar]
Figure 1. Depth of Yangtze Estuary and distribution of sampling stations.
Fishes 11 00499 g001
Figure 2. Variance inflation factors of environmental variables (sea surface temperature (SST), sea surface salinity (SSS), sea surface chlorophyll a concentration (SSCHL), water depth (DEP) and distance to coast (DTC)).
Fishes 11 00499 g002
Figure 3. Distribution of environmental variables, including (a) sea surface temperature (SST), (b) sea surface salinity (SSS) and (c) sea surface chlorophyll a concentration (SSCHL).
Fishes 11 00499 g003
Figure 4. Distribution of eggs sampled and predicted. The green dots are survey density, the X marks indicate locations with zero data, and the colors represent predicted density.
Fishes 11 00499 g004
Figure 5. Distribution of larvae sampled and predicted. The green dots are survey density, the X marks indicate locations with zero data, and the colors represent predicted density.
Fishes 11 00499 g005
Figure 6. Distribution of independent variable coefficients estimated from GWR egg models. The blank image represents environmental variables not involved in the best fit model. The color scale represents the size and sign of the local regression coefficients.
Fishes 11 00499 g006
Figure 7. Distribution of independent variable coefficients estimated from GWR larva models. The blank image represents environmental variables not involved in the best fit model. The color scale represents the size and sign of the local regression coefficients.
Fishes 11 00499 g007
Table 1. Best fit models.
DateEgg ModelLarva Model
Jun. 2018SED ~ SST + SSS + DTC + DEPSLD ~ SST + SSS + SSCHL + DTC + DEP
Jul. 2018SED ~ SST + SSS + DEPSLD ~ SSS + DTC + DEP
May 2019SED ~ SSS + DTC + DEPSLD ~ SSS + SSCHL + DTC + DEP
Aug. 2019SED ~ SST + SSS + DTC + DEPSLD ~ SST + SSS + SSCHL + DTC + DEP
May 2020SED ~ SSS + DTCSLD ~ SST + SSS + SSCHL + DEP
Aug. 2020SED ~ SST + DTC + DEPSLD ~ SST + SSS +SSCHL + DTC + DEP
Note: SED = square root of egg density; SLD = square root of larval density, SST = sea surface temperature, SSS = sea surface salinity, SSCHL = sea surface chlorophyll a concentration, DEP = water depth and DTC = distance to coast.
Table 2. Results of model fitting.
DateModelBandwidth/StationsAICR2RMSEMoran’s I of Residuals
Jun. 2018Egg31/50−75.700.660.14−0.06
Jul. 2018Egg37/55−51.100.550.02−0.51
May 2019Egg32/57−810.690.13−0.06
Aug. 2019Egg40/55−182.130.550.05−0.14
May 2020Egg19/56−14.710.680.240.24
Aug. 2020Egg27/550.50.530.130.16
Jun. 2018Larva38/5019.070.330.06−0.06
Jul. 2018Larva21/55−24.090.790.06−0.16
May 2019Larva27/57220.550.13−0.2
Aug. 2019Larva42/55−32.740.380.002−0.46
May 2020Larva19/56135.460.790.320.03
Aug. 2020Larva35/55−85.050.710.02−0.20
Disclaimer/Publisher’s Note: The statements, opinions and data contained in all publications are solely those of the individual author(s) and contributor(s) and not of MDPI and/or the editor(s). MDPI and/or the editor(s) disclaim responsibility for any injury to people or property resulting from any ideas, methods, instructions or products referred to in the content.