Communication

Comparative Transcriptome Analysis of White and Orange Skin of Clownfish Identifying Differentially Expressed Genes (DEGs) Underlying Pigment Expression


1
Department of Bio-AI Convergence, Chungnam National University, Daejeon 34134, Republic of Korea
2
Department of Marine Life Sciences & Center for Genomic Selection in Korean Aquaculture, Jeju National University, Jeju 63243, Republic of Korea
3
Marine Life Research Institute, Jeju National University, Jeju 63333, Republic of Korea
4
Quantomic Research & Solution, Daejeon 34134, Republic of Korea
5
Jeju Fisheries Research Institute, National Institute Fisheries Science, Jeju 63068, Republic of Korea
6
Department of Animal Science, Chungnam National University, Daejeon 34134, Republic of Korea
7
Division of Animal & Dairy Science, Chungnam National University, Daejeon 34134, Republic of Korea
*
Authors to whom correspondence should be addressed.
Fishes 2026, 11(1), 56; https://doi.org/10.3390/fishes11010056
Submission received: 30 October 2025 / Revised: 27 December 2025 / Accepted: 9 January 2026 / Published: 16 January 2026
(This article belongs to the Section Genetics and Biotechnology)

Abstract

Although the clownfish, Amphiprion ocellaris (A. ocellaris), is a popular ornamental marine fish worldwide, the mechanisms underlying color pattern variation remain unclear. Given that the Platinum-type clownfish, nearly entirely white, has high economic value, understanding the biological mechanism that accounts for the difference between orange and white colors in A. ocellaris is crucial. To investigate these coloration differences, we performed RNA sequencing analysis and identified differentially expressed genes (DEGs) by comparing white and orange skin samples from three A. ocellaris individuals. A total of 76 DEGs were detected, including 56 downregulated and 20 upregulated genes. DEG sequences were annotated using Danio rerio and Stegastus partitus as reference species, selecting the best hit based on the lowest E-value. A protein–protein interaction (PPI) network and Gene Ontology biological process terms were additionally analyzed. Several DEGs previously reported to be associated with pigmentation, including hpdb, cldn11b, sfrp5, slc2a9, slc2a11b, si:ch211-256m1.8, fhl2, rab38, and ttc39b were identified. Based on the functions of these DEGs, it is inferred that leucophores and xanthophores contribute to both white and orange coloration by modulating related genes, including slc2a11b and slc2a9. Additionally, sfrp5, sost, and sp7 genes were identified to interact with each other in the PPI analysis, with sfrp5 and sost being associated with the Wnt signaling pathway, which contributes to melanocyte specification and osteoblast differentiation. Based on these findings, we propose sost and sp7 as candidate genes that might provide insights relevant to extreme white pigmentation phenotypes, such as those observed in Platinum-type clownfish. For a clearer understanding, further studies integrating quantitative genetics and functional analyses are required.
Key Contribution: The transcriptome analysis of clownfish skin samples provides candidate genes potentially underlying pigmentation pattern expression and the associated biological mechanisms.

1. Introduction

The ocellaris clownfish, Amphiprion ocellaris (A. ocellaris) within the Percula complex, is one of 30 clownfish species in the Pomacentridae family, which exhibits a relatively simple color pattern with several white stripes [1,2]. These fish live symbiotically with sea anemones in Indo-Pacific waters, forming groups composed of a monogamous pair and several nonreproductive individuals [3]. The monogamous pair is determined by rank according to a size-based dominance hierarchy [1]. Reportedly, A. ocellaris has been raised as a captive-bred ornamental fish since the 1970s. As one of the few successfully captive-bred ornamental species, while over 90% of ornamental species are caught wild, it has become a commercially popular tropical ornamental marine fish worldwide [4,5].
The popularity of ornamental fish is largely driven by their diverse and aesthetical color patterns. Unlike mammals, which exhibit monotonous color patterns, fish display diverse color patterns determined by chromatophores, including iridophores (white), leucophores (white), xanthophores (yellow/orange), erythrophores (red), and melanophores (black) [6,7,8,9]. These chromatophore-based patterns serve roles in camouflage, sexual selection, thermoregulation, and social communication [10,11,12]. Although the functions of clownfish stripes remain unclear, they are hypothesized to aid in predator defense, foraging, habitat use, and species recognition [1].
In addition to ecological and behavioral studies highlighting the significance of color patterns, the popularity of color patterns has driven the ornamental fish industry to develop lines exhibiting rare coloration patterns [13]. In clownfish, several mutant lines have also been identified in the ornamental fish trade [14,15]. These mutant lines are thought to arise from alterations in chromatophore arrangement and differentiation [16]. Among these, the Platinum clownfish, nearly entirely white except for the fins, is particularly rare and carries a high market value [17]. In this sense, understanding the genetic basis of white coloration could enable breeders to develop high-value ornamental lines, maximizing economic benefits through targeted selective breeding.
Regarding pigmentation, studies utilizing zebrafish have demonstrated that ion channel mutations, gap junctions, and tight junctions influence color patterns [18,19,20]. Additionally, several genes directly influencing pigment expression, including fhl2a, fhl2b, apoD1a, Saiyan, and gpnmb were identified using clownfish [21]. However, while these candidate genes have been reported, their functional roles remain insufficiently characterized, particularly in the context of protein–protein interaction (PPI) networks and Gene Ontology (GO) pathways. Comparative transcriptomic analysis has been widely used to identify genes associated with key phenotypic traits, providing insights into the molecular mechanisms underlying phenotypic variation [21,22]. Building on this framework, our study incorporates PPI and GO analyses using distinct pigmentation regions of A. ocellaris, providing a network-level perspective that may reveal pathways specifically associated with white stripe formation.
In this sense, the aim of this study was to identify candidate genes associated with pigmentation specifically in A. ocellaris, with a particular focus on integrating PPI networks and GO analyses. To elucidate the mechanisms underlying color stripe formation, we conducted RNA sequencing (RNA-Seq) analyses to identify differentially expressed genes (DEGs) between white and orange skin samples of wild-type individuals. Based on this comparative transcriptomic analysis, this study proposes distinct transcriptional patterns between pigmentation regions and identifies key candidate genes and biological pathways potentially involved in white stripe formation, for understanding pigmentation patterning and for future selective breeding of high-value ornamental clownfish.

2. Materials and Methods

2.1. Animal Source, Husbandry, and Housing Conditions

A total of three non-breeding male A. ocellaris were used in this study. The body weights and body lengths of individuals were measured as 10 ± 1 g and 9 ± 1 cm, respectively. Those individuals were approximately two-year-old adults produced through in-house crosses of A. ocellaris × A. ocellaris at the Subtropical Fisheries Research Institute, National Institute of Fisheries Science (6 Yeondaemaeul-gil, Oedo-dong, Jeju-si, Republic of Korea). These individuals were maintained in a recirculating seawater aquarium system. Natural seawater (filtered) was used, and water quality was managed to maintain stable and species-appropriate conditions. Salinity was maintained as 30–33 ppt following local natural seawater standards, and the temperature was 25–28 °C using an aquarium temperature control system. This husbandry environment was designed to mimic natural habitat conditions of A. ocellaris and was kept consistent throughout the entire experimental period.

2.2. Stress Management

Any potential pain or stress during handling or experimental procedures was minimized through sedation or anesthesia. Tricaine methanesulfonate (MS-222) was used as the anesthetic agent at a working concentration of 100 ppm and was administered via immersion. Euthanasia was conducted in accordance with institutional standard protocols, using an overdose of MS-222 to induce deep anesthesia prior to humane termination.

2.3. RNA Sequencing

For RNA-Seq analysis, skin tissues were collected from the white regions and the orange regions of the three A. ocellaris individuals. Libraries were prepared using the Illumina TruSeq Nano DNA Kit. Adapter dimers were removed by digital PCR and TaqMan probe treatment, and DNA fragment concentrations were accurately quantified prior to sequencing. RNA sequencing was performed on an Illumina NovaSeq 6000 platform. The quality of raw reads was assessed using FastQC v0.11.8 [23].

2.4. Mapping and Quantification of Sequences

Reads were aligned to the A. ocellaris reference genome (Ensembl release 104) using STAR v2.7.0f [24]. Raw read counts were generated using the GenomicAlignments v1.30.0 R package (parameters: mode = “IntersectionStrict”, singleEnd = FALSE, ignore.strand = TRUE, fragments = TRUE). Global expression differences among samples were examined via principal component analysis (PCA) using eigenvectors and eigenvalues computed with PLINK v1.90b5.2 [25].

2.5. Differential Expression Analysis

Genes with zero counts in any sample were removed prior to analysis. DEGs were identified using DESeq2 [26] with thresholds of |log2FC >1| and an adjusted p-value < 0.05 (Benjamini–Hochberg; BH). Normalization was performed using DESeq2 size factors. Individual effects were included in the design formula to test for color-associated differences.

2.6. Annotation of DEGs

BLAST v2.12.0 [27] was used to annotate DEG sequences, with Danio rerio (D. rerio) and Stegastus partitus (S. partitus) chosen as references due to their extensive genomic resources and phylogenetic proximity to A. ocellaris and A. percula [28,29,30]. Matches were retained using bit scores ≥ 50 and E-values < 10−5. For each DEG, the hit with the lowest E-value was selected as the most reliable annotation. NCBI gene IDs retrieved from BLAST results were converted to official gene symbols using the Ensembl BioMart v104 [31].

2.7. Protein–Protein Interaction and Functional Enrichment Analyses

A PPI network was analyzed using STRING v11 [32], with D. rerio selected as the reference species and a minimum interaction confidence score set to 0.4. Functional enrichment analysis was conducted using the Database for Annotation, Visualization, and Integrated Discovery (DAVID v6.8) [33]. The GO biological process terms were considered significant when adjusted p-values were <0.3 (BH) and gene counts were ≥2.

3. Results

3.1. Mapping Quality Check

The proportion of raw sequence reads successfully mapped to the reference genome ranged from 88.01% to 92.57% across samples (Table S1). All raw data exhibited high-quality Phred scores and minimal adapter contamination, indicating overall excellent mappability (Figure S1).

3.2. Principal Component Analysis

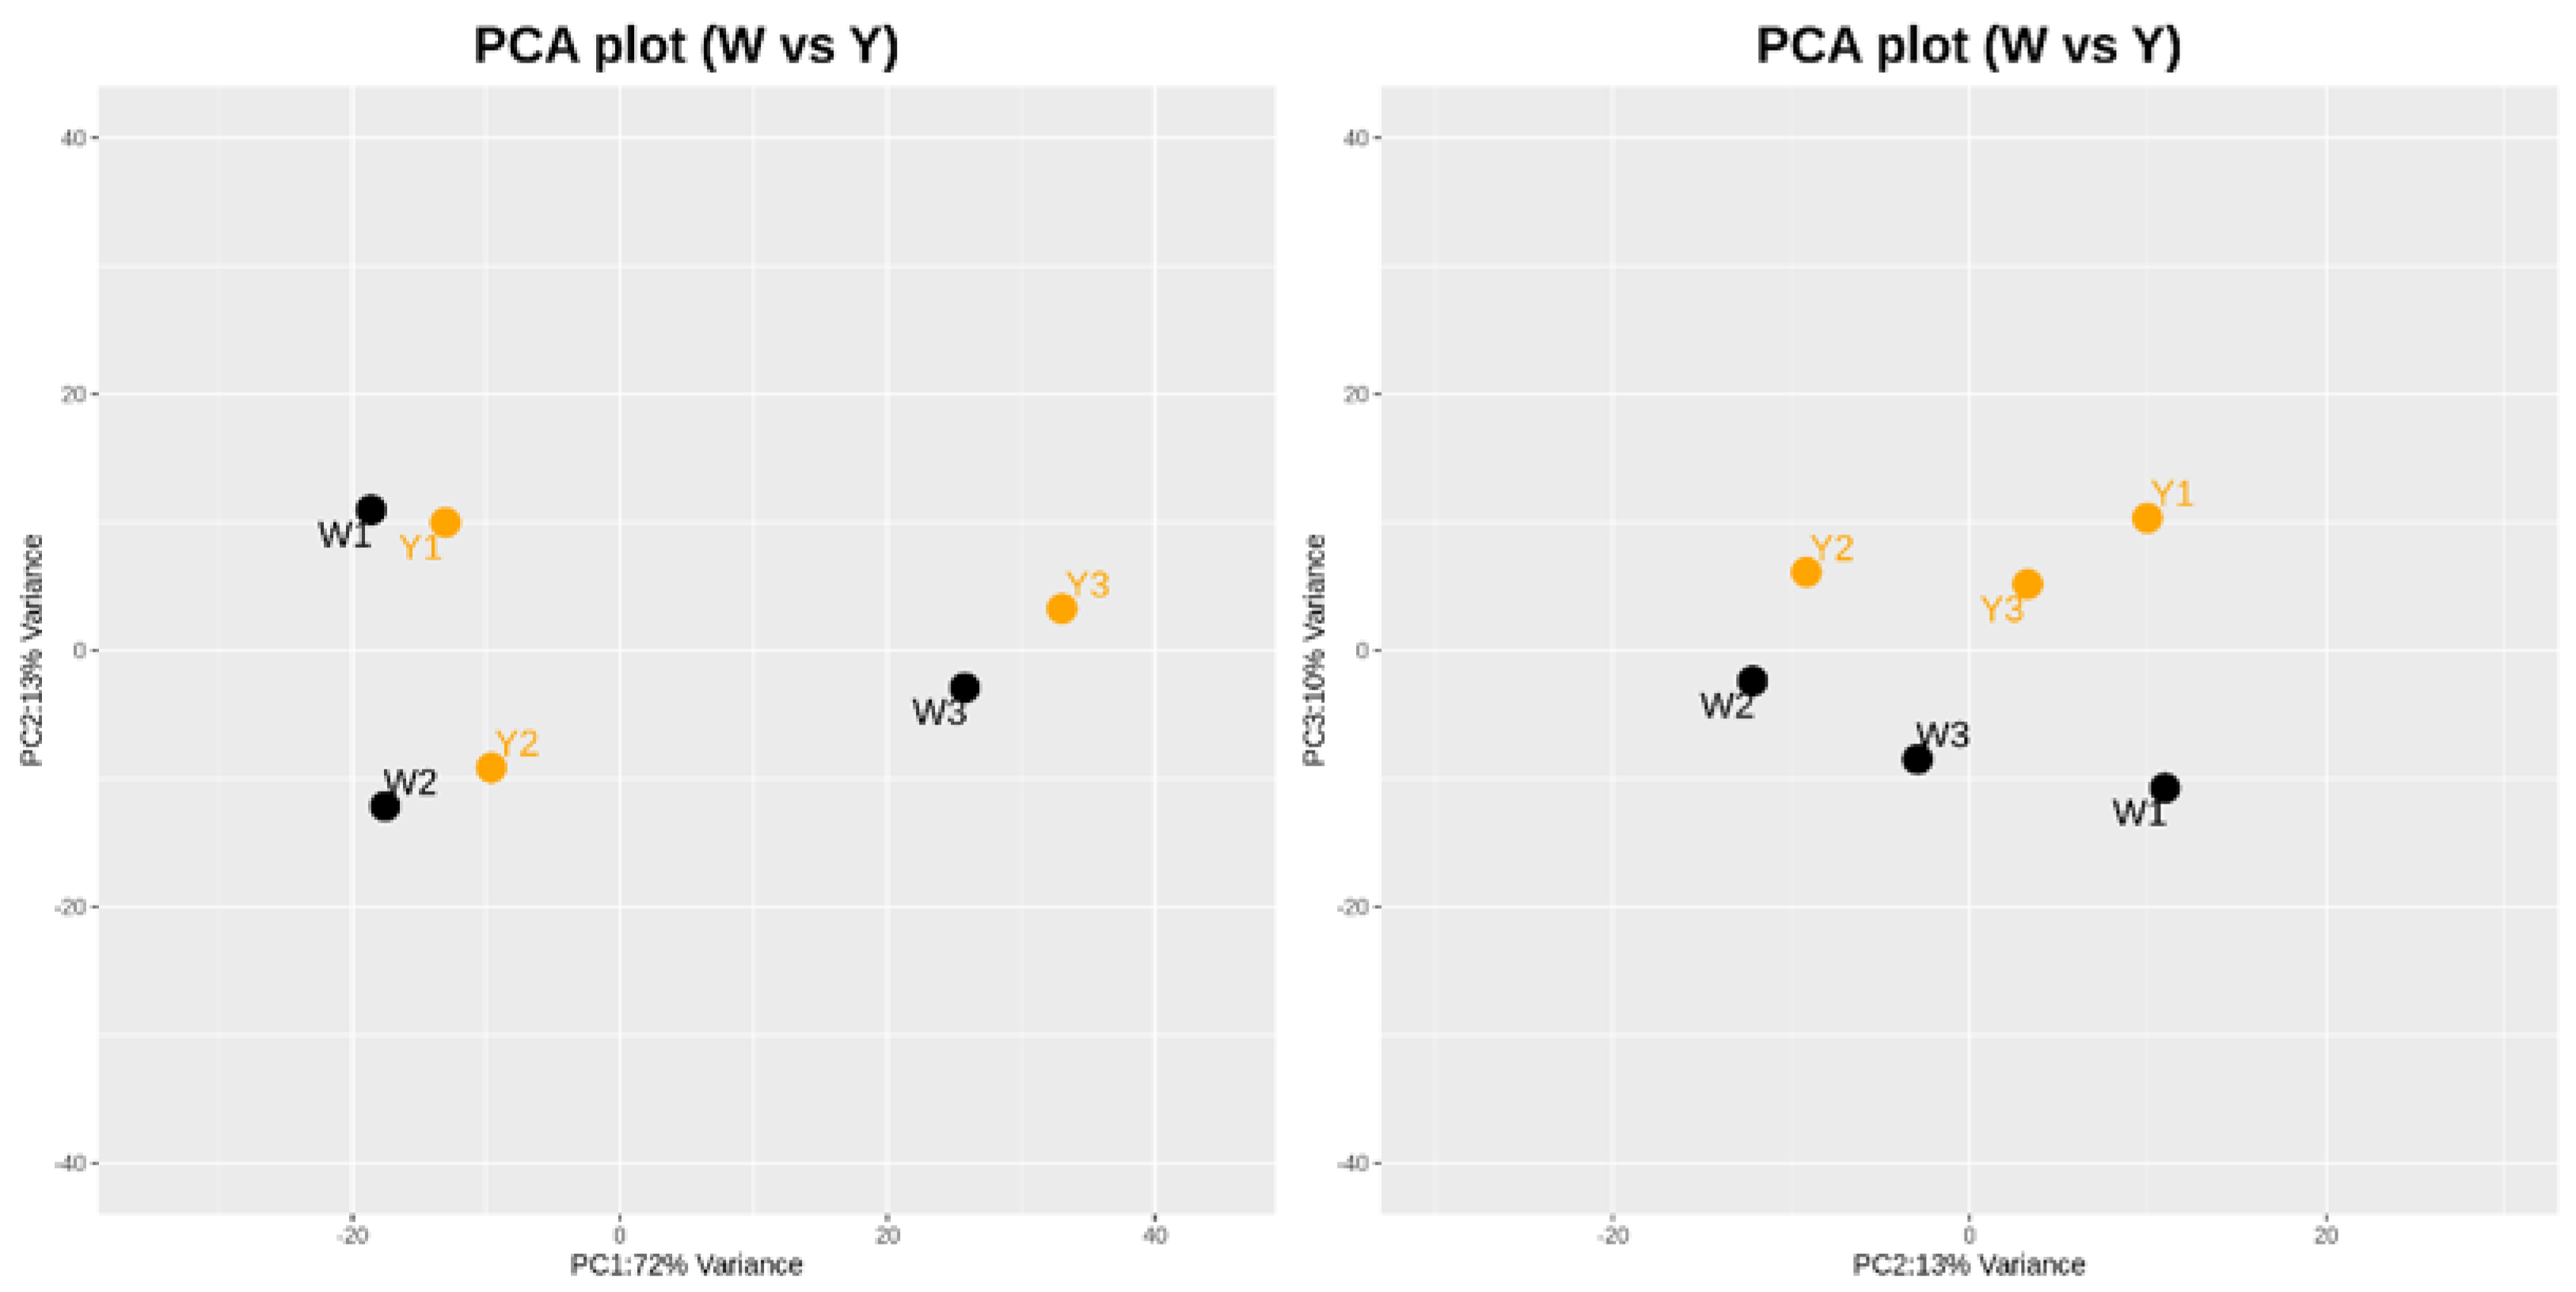
The PCA using principal components 1 and 2, which explained 72% and 13% of the variance, respectively, revealed sample separation according to individual characteristics (Figure 1). In contrast, PCA using principal components 2 and 3, explaining 13% and 10% of the variance, respectively, demonstrated separation primarily based on color expression.

3.3. Extracted DEGs and Assignment of Official Gene Symbols

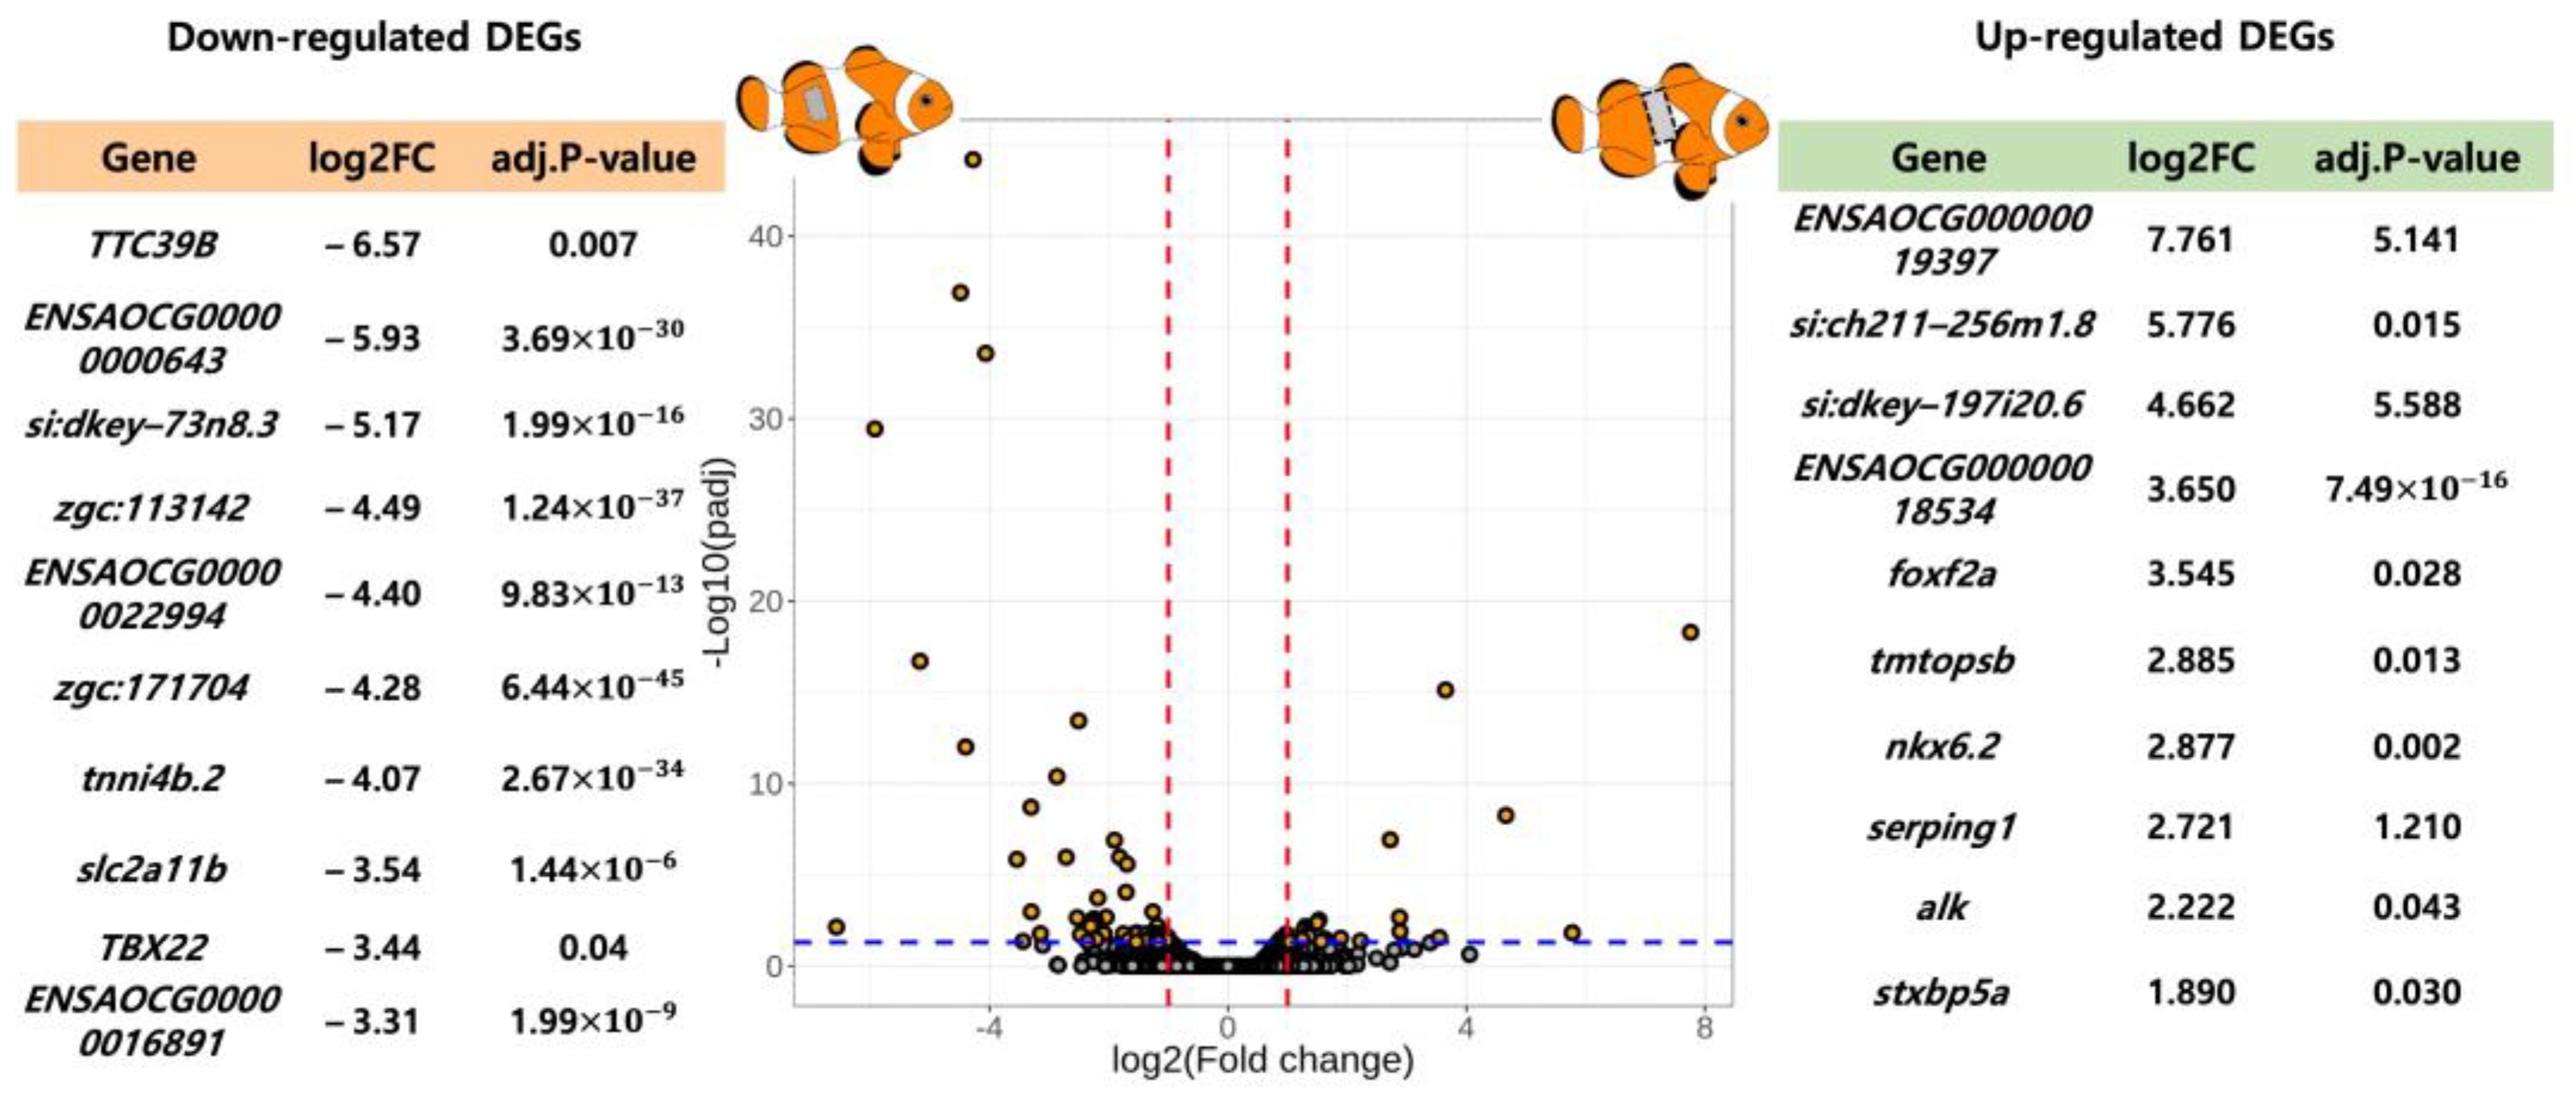
A total of 76 DEGs were identified using thresholds of |log2FC >1| and adjusted p-value < 0.05 (BH) (Table S2). Among these DEGs, 56 genes were downregulated, and 20 were upregulated. Twenty-four DEGs were annotated as novel genes, and three were duplicated alignments corresponding to cyp8b1. To increase the accuracy of functional interpretation and improve the detection of pigmentation-related genes, BLASTn analysis was performed using the DEG sequences as queries. This process resulted in the identification of one additional official gene symbol (uba1), yielding a total of 53 genes with assigned gene symbols.
We further examined the top 10 DEGs ranked by absolute log2FC values (Figure 2), as these genes are most likely to contribute meaningfully to pigmentation differences.
Among the top 10 downregulated genes, seven had official gene annotations (ttc39b, si:dkey-73n8.3, zgc:113142, zgc:171704, tnni4b.2, slc2a11b, tbx22). For the top 10 upregulated genes, eight had official annotations (si:ch211-256m1.8, si:dkey-197i20.6, foxf2a, tmtopsb, nkx6.2, serping1, alk, stxbp5a).
Across all DEGs, several genes previously reported to participate in pigmentation processes were identified, including hpdb, cldn11b, sfrp5, slc2a9, slc2a11b, si:ch211-256m1.8, fhl2, rab38, and ttc39b. Notably, slc2a9, fhl2, si:ch211-256m1.8 were upregulated, with si:211-256m1.8 ranked among the top 10 upregulated DEGs. In contrast, ttc39b, slc2a11b, rab38, sfrp5, hpdb, and cldn11b were downregulated, with ttc39b and slc2a11b appearing in the top 10 downregulated genes.

3.4. Protein–Protein Interaction and Functional Analysis

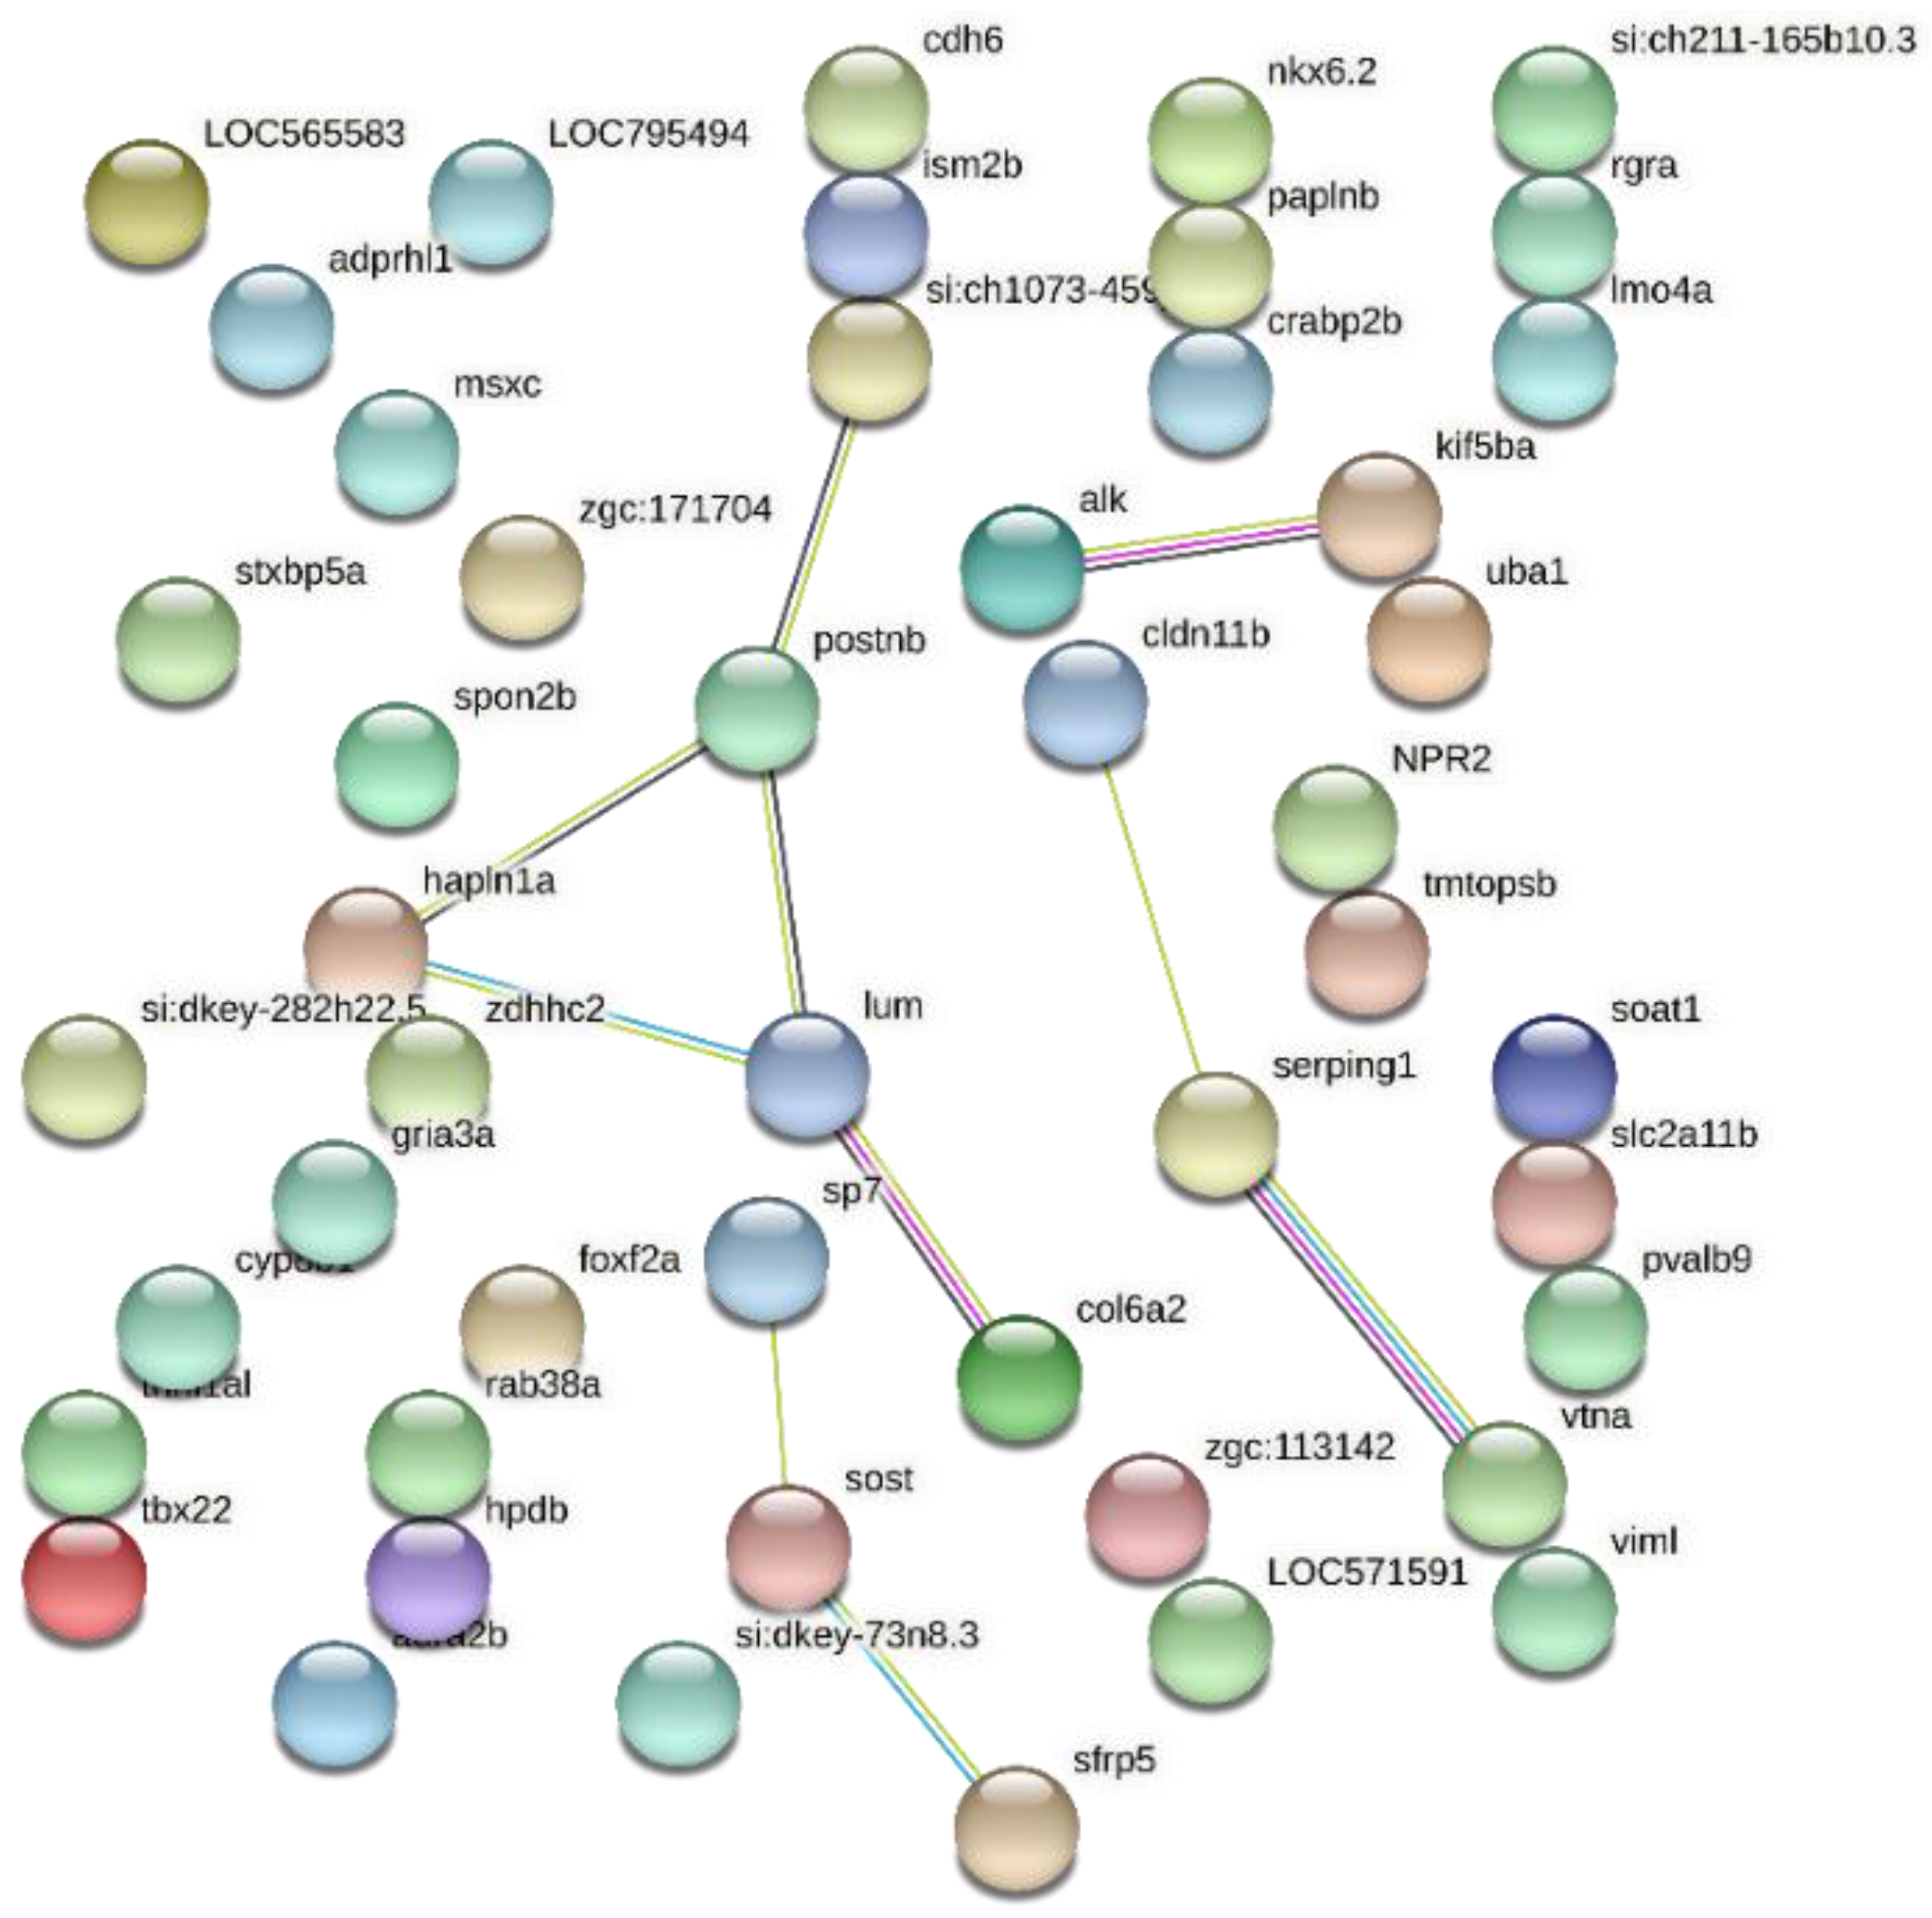
A PPI network comprised 48 nodes and 10 edges, with an average node degree of 0.417 and a local clustering coefficient of 0.201 (Figure 3). Network analysis identified four highly interconnected modules. Among these, the largest module, centered on postnb, included si:ch1073-459-postnb-hapln1a-lum-col6a2. Smaller clusters of peripheral nodes, such as alk-kif5ba, cldn11b-serping1-vtna, and sp7-sost-sfrp5, were connected via fewer edges.
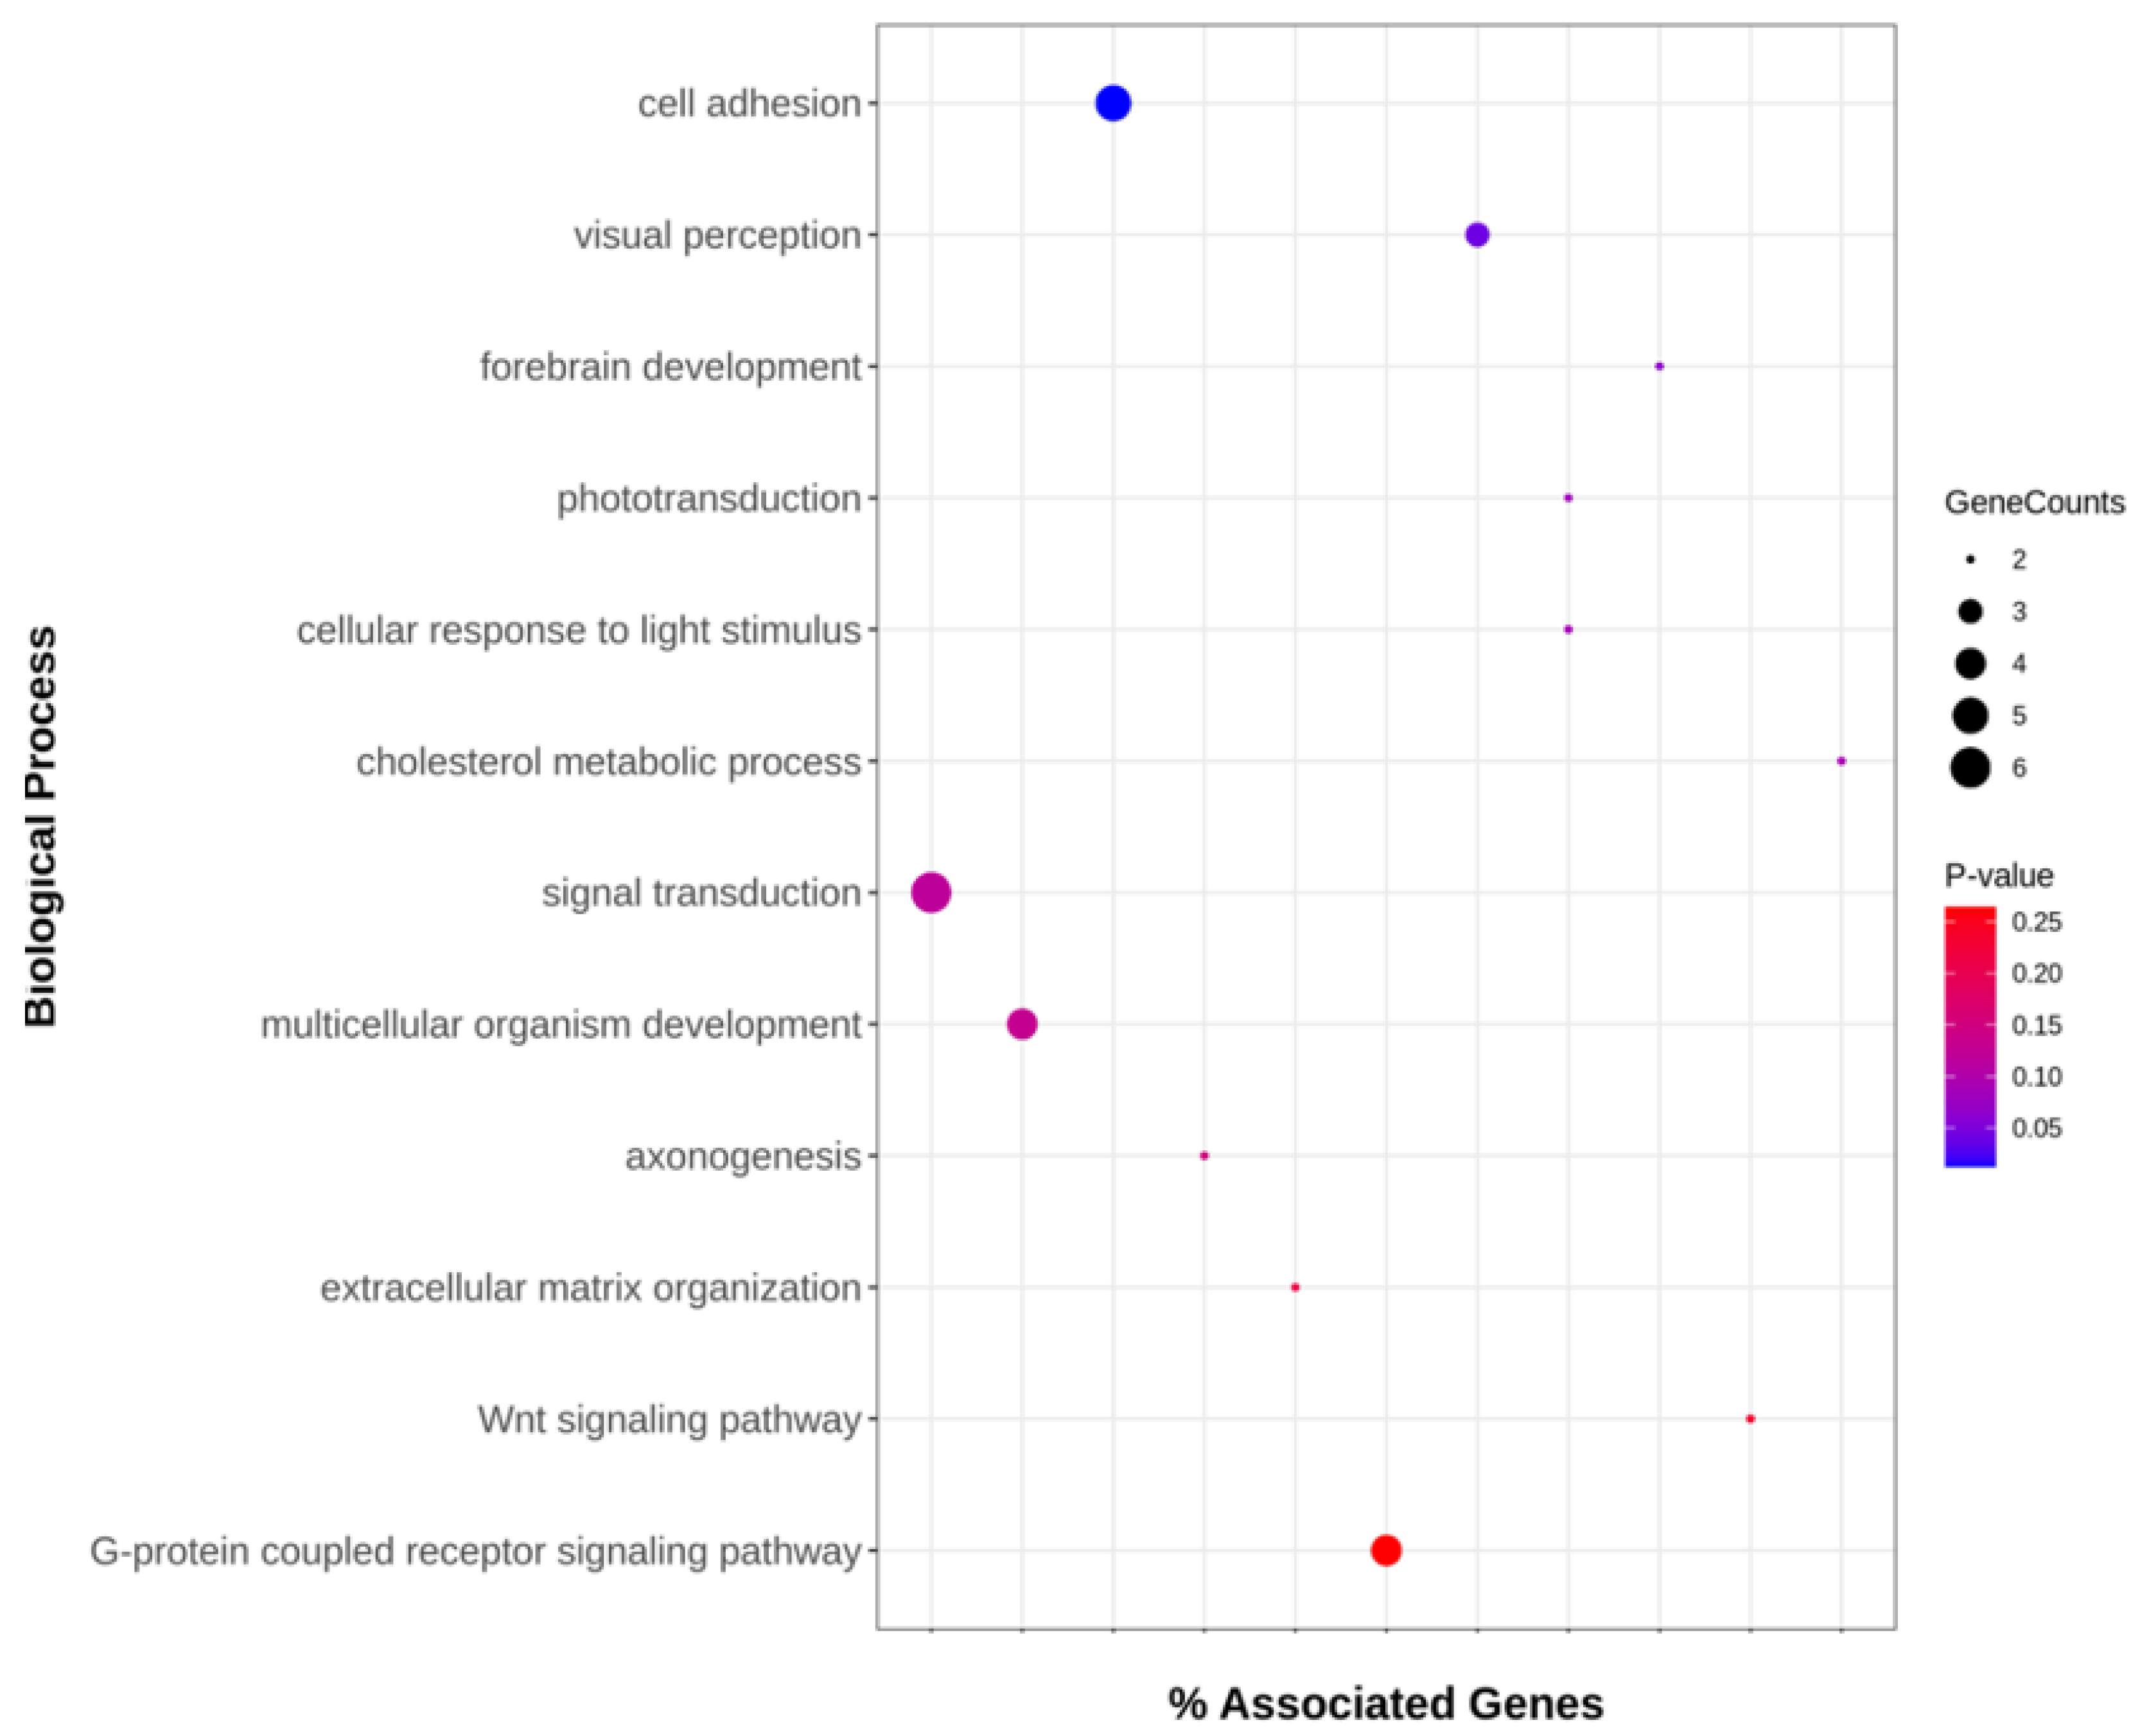
Functional enrichment analysis was performed using DAVID, applying thresholds of adjusted p-value < 0.3 (BH) and gene count ≥2. Twelve GO biological process terms were enriched (Figure 4). Among the 53 DEGs with gene symbols, 29 were associated with processes including all adhesion, visual perception, forebrain development, phototransduction, cellular response to light stimulus, cholesterol metabolic process, signal transduction, multicellular organism development, axonogenesis, extracellular matrix organization, Wnt signaling pathway, and G-protein coupled receptor signaling. Six genes were associated with signal transduction, which had the lowest p-value among the enriched terms. The cholesterol metabolic process, comprising two genes, displayed the most significant enrichment. Notably, none of the top 10 most strongly up- or downregulated genes were assigned to enriched GO terms, likely due to limited functional annotation or the small gene set used for enrichment analysis.

4. Discussion

The causes of color expression are multiplex and multifactorial [34]. Although clownfish exhibit various morphs and several mutant lines have been isolated due to their popularity in the ornamental fish industry [15], the precise genetic factors underlying their color patterns remain largely unclear. Our findings highlight several candidate genes that warrant further investigation to elucidate pigmentation mechanisms in A. ocellaris.
In the present study, the pigmentation expression was largely captured by principal components 2 and 3, which explained 13% and 10% of the total variance, respectively. Although overall transcriptomic variation was influenced by individual-specific characteristics, pigmentation-associated differences were consistently captured by DEGs identified between white and orange skin regions. In other words, the specifically identified DEGs captured the differences in pigmentation expression.
Among the 76 identified DEGs, 56 were downregulated genes and 20 were upregulated genes. Among the top 10 downregulated genes, ttc39b and slc2a11b are known to be associated with carotenoid concentration, and leucophores and xanthophores differentiation, respectively [35,36]. From the study using the cichlid pair, ttc39b was expressed significantly higher in the red compared to the yellow skin [35], and slc2a11b was identified to be exclusively expressed in leucophores and xanthophores [37]. Carotenoids have been reported as natural pigments that are distributed in red, yellow, and orange coloration, which is generally known to be obtained from food or modified through animals’ metabolic mechanisms [38]. Leucophores are chromatophores that contribute color expression through structural reflection and as cells whose development is genetically regulated [39,40]. In this study, slc2a11b [36], the gene related to leucophores and xanthophores, was significantly downregulated, suggesting that alterations may influence the visibility or intensity of orange pigmentation in A. ocellaris.
Among the top 10 upregulated genes, si:ch211-256m1.8 was previously identified as a DEG linked to iridophore, which influences white color development in clownfish [21]. Silencing of sfrp5 has been reported to enhance melanin synthesis via activation of the Wnt signaling pathway, a central pathway in melanocyte biology mediated by wnt1 and wnt3a, which promote the differentiation of neural crest cells into pigment cells [41,42]. Additionally, slc2a9 has been implicated in serum uric acid metabolism, a major component of leucophore white particles [37]. It is suggested that leucophores and xanthophores may contribute to both orange and white coloration by modulating the expression of slc2a11b, as this gene was identified as a downregulated gene, whereas slc2a9 was identified in the upregulated gene set. In addition, rab38 participates in melanosomal transfer and docking, whereas fhl2a and fhl2b are involved in iridophore expression [43]. As these iridophore-related genes were predominantly expressed in white skin, it can be inferred that the white coloration in clownfish is primarily associated with iridophores, whereas leucophores may contribute to both orange and white pigmentation. Additionally, hpdb has been suggested as a gene that might influence pigmentation by promoting the formation of homogentisic acid (HGA), a precursor that can subsequently generate melatonin [44]. CLDN11 has been implicated in melanocyte regulation, being silenced and hypermethylated in human malignant melanoma [45].
From the top 10 DEG lists, we identified several genes previously reported to be relevant to pigmentation. However, these genes serve as indicators of pigmentation expression rather than directly elucidating the underlying biological mechanisms. In the PPI and GO analyses, the absence of GO enrichment among the top DEGs likely reflects limited annotation coverage rather than a lack of biological relevance. Instead, sost and sfrp5 were consistently identified from both analyses. Notably, sp7, sost, and sfrp5 formed an interaction cluster, with sost and sfrp5 being involved in the Wnt signaling pathway. Loss-of-function mutations in sost have been reported to enhance Wnt signaling [46]. The role of Wnt signaling has been reported as melanocyte specification from neural crest across vertebrates [47]. The other gene, sp7, which was only identified in the PPI results, has been reported to be a zinc finger transcription factor that plays a critical role in osteoblast differentiation and bone formation [48]. Since Wnt signaling is required for osteoblast differentiation, it is referred that sost and sfrp5 were differentially expressed both accounting for osteoblast differentiation and melanocyte specification. This might address the relatively indirect association of sp7 with pigmentation-related pathways compared to sost and sfrp5.
From this study, we identified candidate genes that might be potentially relevant to address pigmentation differences in extreme white color phenotypes. However, for a clearer understanding of pigmentation expression at the population level, further studies using quantitative genetics approaches, such as genome-wide association study, along with functional analyses to investigate protein function, will be required.

5. Conclusions

Our analysis aimed to identify genes contributing to pigmentation pattern formation in A. ocellaris. From this study, we identified several DEGs previously reported to be associated with pigment cell biology in our dataset. Based on these DEGs, we inferred that leucophores might influence both orange and white coloration through modulation of slc2a11b and slc2a9 expression, whereas iridophore-related genes predominantly drive white pigmentation in A. ocellaris. Notably, through protein–protein interaction and Gene Ontology enrichment analyses, sfrp5 and sost were suggested to be genes modulating Wnt signaling pathway and central regulators of pigment cell differentiation. Based on these results, further quantitative genetics studies and functional analyses focusing on these candidate genes are required to ascertain their mechanistic roles in stripe formation in A. ocellaris.

Supplementary Materials

The following supporting information can be downloaded at: https://www.mdpi.com/article/10.3390/fishes11010056/s1, Table S1: Summary of the mappability of clownfish’s RNA-Seq reads; Table S2: Summary of 76 differentially expressed genes (DEGs); Figure S1: Summary of FastQC results for quality reads and adapter contents.

Author Contributions

Conceptualization, H.L., S.H.L., T.J. and J.L.; methodology, H.L., S.J. and J.C.; software, H.L. and Y.K.; validation, H.L., M.-m.J. and S.K.; formal analysis, H.L. and H.O.; investigation, H.L. and J.K.; resources, J.C. and M.-m.J.; data curation, H.L. and Y.K.; writing—original draft preparation, H.L.; writing—review and editing, H.L., S.H.L., T.J. and J.L.; visualization, H.L.; supervision, J.L. and S.H.L.; project administration, J.L. and S.H.L.; funding acquisition, J.L. and S.H.L. All authors have read and agreed to the published version of the manuscript.

Funding

This research was funded by the National Institute of Fisheries Science of Korea (R2025036). This research was supported by Korea Institute of Marine Science & Technology Promotion (KIMST) funded by the Ministry of Oceans and Fisheries (RS-2022-KS221670).

Institutional Review Board Statement

The animal study protocol was reviewed and approved by the Institutional Animal Care and Use Committee (IACUC) of Jeju National University (approval code: 2021-0031; date of approval: 17 May 2021). All procedures involving animals were conducted in strict accordance with the guidelines and regulations of the Jeju National University IACUC.

Data Availability Statement

The data presented in this study are available on request from the corresponding authors.

Acknowledgments

This research was supported by Korea Institute of Marine Science & Technology Promotion (KIMST) funded by the Ministry of Oceans and Fisheries (RS-2022-KS221670).

Conflicts of Interest

Author Yeongkuk Kim was employed by the company Quantomic research & Solution. The remaining authors declare that the research was conducted in the absence of any commercial or financial relationships that could be construed as a potential conflict of interest.

References

  1. Salis, P.; Roux, N.; Soulat, O.; Lecchini, D.; Laudet, V.; Frederich, B. Ontogenetic and phylogenetic simplification during white stripe evolution in clownfishes. BMC Biol. 2018, 16, 90. [Google Scholar] [CrossRef] [Scilit]
  2. Thongtam Na Ayudhaya, P.; Areesirisuk, P.; Singchat, W.; Sillapaprayoon, S.; Muangmai, N.; Peyachoknagul, S.; Srikulnath, K. Complete mitochondrial genome of 10 anemonefishes belonging to Amphiprion and Premnas. Mitochondrial DNA Part B 2019, 4, 222–224. [Google Scholar] [CrossRef] [Scilit]
  3. Iwata, E.; Nagai, Y.; Hyoudou, M.; Sasaki, H. Social environment and sex differentiation in the false clown anemonefish, Amphiprion ocellaris. Zool. Sci. 2008, 25, 123–128. [Google Scholar] [CrossRef] [Scilit] [PubMed]
  4. Madduppa, H.H.; Timm, J.; Kochzius, M. Interspecific, Spatial and Temporal Variability of Self-Recruitment in Anemonefishes. PLoS ONE 2014, 9, e90648. [Google Scholar] [CrossRef] [Scilit] [PubMed]
  5. King, T.A. Wild caught ornamental fish: A perspective from the UK ornamental aquatic industry on the sustainability of aquatic organisms and livelihoods. J. Fish. Biol. 2019, 94, 925–936. [Google Scholar] [PubMed]
  6. Mills, M.G.; Patterson, L.B. Not just black and white: Pigment pattern development and evolution in vertebrates. Semin. Cell Dev. Biol. 2009, 20, 72–81. [Google Scholar] [CrossRef] [Scilit]
  7. Burton, D. The physiology of flatfish chromatophores. Microsc. Res. Tech. 2002, 58, 481–487. [Google Scholar] [CrossRef] [Scilit]
  8. Caro, T.; Mallarino, R. Coloration in Mammals. Trends. Ecol. Evol. 2020, 35, 357–366. [Google Scholar]
  9. Das, A.P. Carotenoids and Pigmentation in Ornamental Fish. J. Aquac. Mar. Biol. 2016, 4, 00093. [Google Scholar] [CrossRef] [Scilit]
  10. Hubbard, J.K.; Uy, J.A.; Hauber, M.E.; Hoekstra, H.E.; Safran, R.J. Vertebrate pigmentation: From underlying genes to adaptive function. Trends Genet. 2010, 26, 231–239. [Google Scholar] [CrossRef] [Scilit]
  11. Backström, T.; Heynen, M.; Brännäs, E.; Nilsson, J.; Winberg, S.; Magnhagen, C. Social stress effects on pigmentation and monoamines in Arctic charr. Behav. Brain Res. 2015, 291, 103–107. [Google Scholar] [CrossRef] [Scilit]
  12. Vitt, S.; Bakowski, C.E.; Thünken, T. Sex-specific effects of inbreeding on body colouration and physiological colour change in the cichlid fish Pelvicachromis taeniatus. BMC Ecol. Evol. 2022, 22, 124. [Google Scholar] [CrossRef] [Scilit]
  13. Lau, C.C.; Mohd Nor, S.A.; Tan, M.P.; Yeong, Y.S.; Wong, L.L.; Van de Peer, Y.; Sorgeloos, P.; Danish-Daniel, M. Pigmentation enhancement techniques during ornamental fish production. Rev. Fish Biol. Fish. 2023, 33, 1027–1048. [Google Scholar] [CrossRef] [Scilit]
  14. Yashwanth, B.S.; Goswami, M.; Kooloth Valappil, R.; Thakuria, D.; Chaudhari, A. Characterization of a new cell line from ornamental fish Amphiprion ocellaris (Cuvier, 1830) and its susceptibility to nervous necrosis virus. Sci. Rep. 2020, 10, 20051. [Google Scholar] [CrossRef] [Scilit]
  15. Klann, M.; Mercader, M.; Carlu, L.; Hayashi, K.; Reimer, J.D.; Laudet, V. Variation on a theme: Pigmentation variants and mutants of anemonefish. Evodevo 2021, 12, 8. [Google Scholar] [CrossRef] [Scilit] [PubMed]
  16. Frohnhofer, H.G.; Krauss, J.; Maischein, H.M.; Nusslein-Volhard, C. Iridophores and their interactions with other chromatophores are required for stripe formation in zebrafish. Development 2013, 140, 2997–3007. [Google Scholar] [CrossRef] [Scilit]
  17. Anikuttan, K.K.; Rameshkumar, P.; Nazar, A.K.; Jayakumar, R.; Tamilmani, G.; Sakthivel, M.; Sankar, M.; Bavithra, R.; Johnson, B.; Krishnaveni, N.; et al. Designer clown fishes: Unraveling the ambiguities. Front. Mar. Sci. 2022, 9–2022. [Google Scholar] [CrossRef] [Scilit]
  18. Watanabe, M.; Iwashita, M.; Ishii, M.; Kurachi, Y.; Kawakami, A.; Kondo, S.; Okada, N. Spot pattern of leopard Danio is caused by mutation in the zebrafish connexin41.8 gene. EMBO Rep. 2006, 7, 893–897. [Google Scholar] [CrossRef] [Scilit] [PubMed]
  19. Iwashita, M.; Watanabe, M.; Ishii, M.; Chen, T.; Johnson, S.L.; Kurachi, Y.; Okada, N.; Kondo, S. Pigment pattern in jaguar/obelix zebrafish is caused by a Kir7.1 mutation: Implications for the regulation of melanosome movement. PLoS Genet. 2006, 2, e197. [Google Scholar] [CrossRef] [Scilit]
  20. Fadeev, A.; Krauss, J.; Frohnhofer, H.G.; Irion, U.; Nusslein-Volhard, C. Tight Junction Protein 1a regulates pigment cell organisation during zebrafish colour patterning. eLife 2015, 4, e06545. [Google Scholar] [CrossRef] [Scilit]
  21. Salis, P.; Lorin, T.; Lewis, V.; Rey, C.; Marcionetti, A.; Escande, M.L.; Roux, N.; Besseau, L.; Salamin, N.; Semon, M.; et al. Developmental and comparative transcriptomic identification of iridophore contribution to white barring in clownfish. Pigment. Cell Melanoma Res. 2019, 32, 391–402. [Google Scholar] [CrossRef] [Scilit]
  22. Wang, B.; Bu, Y.; Zhang, G.; Liu, N.; Feng, Z.; Gong, Y. Comparative transcriptome analysis of vegetable soybean grain discloses genes essential for grain quality. BMC Plant Biol. 2024, 24, 491. [Google Scholar] [CrossRef] [Scilit]
  23. FastQC: A Quality Control Tool for High Throughput Sequence Data. Available online: http://www.bioinformatics.babraham.ac.uk/projects/fastqc/ (accessed on 1 August 2020).
  24. Dobin, A.; Davis, C.A.; Schlesinger, F.; Drenkow, J.; Zaleski, C.; Jha, S.; Batut, P.; Chaisson, M.; Gingeras, T.R. STAR: Ultrafast universal RNA-seq aligner. Bioinformatics 2013, 29, 15–21. [Google Scholar] [CrossRef] [Scilit] [PubMed]
  25. Purcell, S.; Neale, B.; Todd-Brown, K.; Thomas, L.; Ferreira, M.A.; Bender, D.; Maller, J.; Sklar, P.; de Bakker, P.I.; Daly, M.J.; et al. PLINK: A tool set for whole-genome association and population-based linkage analyses. Am. J. Hum. Genet. 2007, 81, 559–575. [Google Scholar] [CrossRef] [Scilit]
  26. Love, M.I.; Huber, W.; Anders, S. Moderated estimation of fold change and dispersion for RNA-seq data with DESeq2. Genome Biol. 2014, 15, 550. [Google Scholar] [CrossRef] [Scilit] [PubMed]
  27. Ye, J.; McGinnis, S.; Madden, T.L. BLAST: Improvements for better sequence analysis. Nucleic Acids Res. 2006, 34, W6–W9. [Google Scholar] [CrossRef] [Scilit] [PubMed]
  28. Booth, D.J.; Hixon, M.A. Food ration and condition affect early survival of the coral reef damselfish, Stegastes partitus. Oecologia 1999, 121, 364–368. [Google Scholar] [CrossRef] [Scilit]
  29. Lehmann, R.; Lightfoot, D.J.; Schunter, C.; Michell, C.T.; Ohyanagi, H.; Mineta, K.; Foret, S.; Berumen, M.L.; Miller, D.J.; Aranda, M.; et al. Finding Nemo’s Genes: A chromosome-scale reference assembly of the genome of the orange clownfish Amphiprion percula. Mol. Ecol. Resour. 2019, 19, 570–585. [Google Scholar] [CrossRef] [Scilit]
  30. Ruzicka, L.; Bradford, Y.M.; Frazer, K.; Howe, D.G.; Paddock, H.; Ramachandran, S.; Singer, A.; Toro, S.; Van Slyke, C.E.; Eagle, A.E.; et al. ZFIN, The zebrafish model organism database: Updates and new directions. Genesis 2015, 53, 498–509. [Google Scholar] [CrossRef] [Scilit]
  31. Durinck, S.; Moreau, Y.; Kasprzyk, A.; Davis, S.; De Moor, B.; Brazma, A.; Huber, W. BioMart and Bioconductor: A powerful link between biological databases and microarray data analysis. Bioinformatics 2005, 21, 3439–3440. [Google Scholar] [CrossRef] [Scilit]
  32. Szklarczyk, D.; Gable, A.L.; Lyon, D.; Junge, A.; Wyder, S.; Huerta-Cepas, J.; Simonovic, M.; Doncheva, N.T.; Morris, J.H.; Bork, P.; et al. STRING v11: protein-protein association networks with increased coverage, supporting functional discovery in genome-wide experimental datasets. Nucleic Acids Res. 2019, 47, D607–D613. [Google Scholar] [CrossRef] [Scilit]
  33. Dennis, G.; Sherman, B.T.; Hosack, D.A.; Yang, J.; Gao, W.; Lane, H.C.; Lempicki, R.A. DAVID: Database for Annotation, Visualization, and Integrated Discovery. Genome Biol. 2003, 4, R60. [Google Scholar] [CrossRef] [Scilit]
  34. Cuthill, I.C.; Allen, W.L.; Arbuckle, K.; Caspers, B.; Chaplin, G.; Hauber, M.E.; Hill, G.E.; Jablonski, N.G.; Jiggins, C.D.; Kelber, A.; et al. The biology of color. Science 2017, 357. [Google Scholar] [CrossRef] [Scilit] [PubMed]
  35. Ahi, E.P.; Lecaudey, L.A.; Ziegelbecker, A.; Steiner, O.; Goessler, W.; Sefc, K.M. Expression levels of the tetratricopeptide repeat protein gene ttc39b covary with carotenoid-based skin colour in cichlid fish. Biol. Lett. 2020, 16, 20200629. [Google Scholar] [CrossRef] [Scilit]
  36. Si, S.; Xu, X.; Zhuang, Y.; Gao, X.; Zhang, H.; Zou, Z.; Luo, S.-J. The genetics and evolution of eye color in domestic pigeons (Columba livia). PLoS Genet. 2021, 17, e1009770. [Google Scholar] [CrossRef] [Scilit] [PubMed]
  37. Kimura, T.; Nagao, Y.; Hashimoto, H.; Yamamoto-Shiraishi, Y.; Yamamoto, S.; Yabe, T.; Takada, S.; Kinoshita, M.; Kuroiwa, A.; Naruse, K. Leucophores are similar to xanthophores in their specification and differentiation processes in medaka. Proc. Natl. Acad. Sci. USA 2014, 111, 7343–7348. [Google Scholar] [CrossRef] [Scilit] [PubMed]
  38. Tan, K.; Zhang, H.; Zheng, H. Carotenoid content and composition: A special focus on commercially important fish and shellfish. Crit. Rev. Food Sci. Nutr. 2024, 64, 544–561. [Google Scholar] [CrossRef] [Scilit]
  39. Hanlon, R.T.; Mäthger, L.M.; Bell, G.R.R.; Kuzirian, A.M.; Senft, S.L. White reflection from cuttlefish skin leucophores. Bioinspir. Biomim. 2018, 13, 035002. [Google Scholar] [CrossRef] [Scilit]
  40. Mäthger, L.M.; Denton, E.J.; Marshall, N.J.; Hanlon, R.T. Mechanisms and behavioural functions of structural coloration in cephalopods. J. R. Soc. Interface 2009, 6, S149–S163. [Google Scholar] [CrossRef] [Scilit]
  41. Zou, D.P.; Chen, Y.M.; Zhang, L.Z.; Yuan, X.H.; Zhang, Y.J.; Inggawati, A.; Kieu Nguyet, P.T.; Gao, T.W.; Chen, J. SFRP5 inhibits melanin synthesis of melanocytes in vitiligo by suppressing the Wnt/beta-catenin signaling. Genes. Dis. 2021, 8, 677–688. [Google Scholar] [CrossRef] [Scilit]
  42. D’Mello, S.A.; Finlay, G.J.; Baguley, B.C.; Askarian-Amiri, M.E. Signaling Pathways in Melanogenesis. Int. J. Mol. Sci. 2016, 17, 1144. [Google Scholar] [CrossRef] [Scilit] [PubMed]
  43. Santos, M.E.; Braasch, I.; Boileau, N.; Meyer, B.S.; Sauteur, L.; Bohne, A.; Belting, H.G.; Affolter, M.; Salzburger, W. The evolution of cichlid fish egg-spots is linked with a cis-regulatory change. Nat. Commun. 2014, 5, 5149. [Google Scholar] [CrossRef] [Scilit]
  44. Jiang, B.; Wang, L.; Luo, M.; Fu, J.; Zhu, W.; Liu, W.; Dong, Z. Transcriptome analysis of skin color variation during and after overwintering of Malaysian red tilapia. Fish Physiol. Biochem. 2022, 48, 669–682. [Google Scholar] [CrossRef] [Scilit]
  45. Walesch, S.K.; Richter, A.M.; Helmbold, P.; Dammann, R.H. Claudin11 Promoter Hypermethylation Is Frequent in Malignant Melanoma of the Skin, but Uncommon in Nevus Cell Nevi. Cancers 2015, 7, 1233–1243. [Google Scholar] [CrossRef] [Scilit]
  46. Chen, D.; Li, Y.; Zhou, Z.; Wu, C.; Xing, Y.; Zou, X.; Tian, W.; Zhang, C. HIF-1alpha inhibits Wnt signaling pathway by activating Sost expression in osteoblasts. PLoS ONE 2013, 8, e65940. [Google Scholar] [CrossRef] [Scilit]
  47. Vibert, L.; Aquino, G.; Gehring, I.; Subkankulova, T.; Schilling, T.F.; Rocco, A.; Kelsh, R.N. An ongoing role for Wnt signaling in differentiating melanocytes in vivo. Pigment Cell Melanoma Res. 2017, 30, 219–232. [Google Scholar] [CrossRef] [Scilit] [PubMed]
  48. Lang, J.; Morya, V.K.; Kwak, M.K.; Park, S.H.; Noh, K.C. Molecular crosstalk in SP7-mediated osteogenesis: Regulatory mechanisms and therapeutic potential. Osteoporos. Sarcopenia 2025, 11, 31–37. [Google Scholar] [CrossRef] [Scilit]
Figure 1. Principal component analysis (PCA) of gene expression profiles in white and orange skin samples. (Left panel): PC1 (72% of variance) plotted against PC2 (13% of variance). (Right panel): PC2 (13% of variance) plotted against PC3 (10% of variance), highlighting separation based on pigmentation differences.
Fishes 11 00056 g001
Figure 2. Volcano plot illustrating differential gene expression between white and orange skin samples. DEGs are shown as orange dots, while non-DEGs are gray. The blue dashed line marks the adjusted p-value cutoff, and the red dashed line indicates the |log2 fold change| threshold used to identify significant genes.
Fishes 11 00056 g002
Figure 3. Protein–protein interaction network of 48 nodes derived from 51 official gene symbols.
Fishes 11 00056 g003
Figure 4. GO enrichment analysis of biological processes associated with DEGs identified in white and orange skin samples, highlighting pathways potentially involved in pigmentation.
Fishes 11 00056 g004
Disclaimer/Publisher’s Note: The statements, opinions and data contained in all publications are solely those of the individual author(s) and contributor(s) and not of MDPI and/or the editor(s). MDPI and/or the editor(s) disclaim responsibility for any injury to people or property resulting from any ideas, methods, instructions or products referred to in the content.