Article

Growth, Physiological Response, and Gill Health of Spotted Rose Snapper (Lutjanus guttatus) Reared at Different Salinities

by
Jonathan Chacón-Guzmán
1,2,3,*,
Ricardo Jiménez-Montealegre
1,
Neil Duncan
4,
Elman Calvo-Elizondo
1,3,
Silvia Valverde-Chavarría
1,
Junior Pastor Pérez-Molina
1,5,
Adriana Rodríguez-Forero
6,
Javier Segura-Badilla
3,
Enoc Soto-Alvarado
3,
Tifanny Corrales
3,
Catalina Víquez
7,
Marcela Suárez-Esquivel
7,
Laura Castro-Ramírez
7,
Yanis Cruz-Quintana
4,8 and
Enric Gisbert
4,*
1
Escuela de Ciencias Biológicas, Universidad Nacional (UNA), Heredia 40101, Costa Rica
2
Doctorado en Ciencias Naturales para el Desarrollo (DOCINADE), Instituto Tecnológico de Costa Rica, Universidad Nacional, Universidad Estatal a Distancia, Cartago P.O. Box 159-7050, Costa Rica
3
Marine Aquaculture and Biotechnology Program, Parque Marino del Pacífico, Paseo de los Turistas, Puntarenas 60101, Costa Rica
4
IRTA La Rápita, Aquaculture Program, Carretera de Poble Nou, km 5.5, E-43540 La Rápita, Spain
5
Escuela de Biología, Universidad de Costa Rica, San Pedro, San José 11501-2060, Costa Rica
6
Aquaculture Laboratory, Group of Research and Development Technology in Aquaculture, Fisheries Engineering Program, Universidad del Magdalena, Cra 29 No 22-01, Santa Marta D.T.C.H. 470004, Colombia
7
Escuela de Medicina Veterinaria, Universidad Nacional (UNA), Heredia 40101, Costa Rica
8
Grupo de Investigación en Sanidad Acuícola, Inocuidad y Salud Ambiental (SAISA), Departamento de Acuicultura, Pesca y Recursos Naturales Renovables, Facultad de Acuicultura y Ciencias del Mar, Universidad Técnica de Manabí, Calle Gonzalo Loor Velasco s/n, Ciudadela Universitaria, Bahía de Caráquez 131101, Ecuador
*
Authors to whom correspondence should be addressed.
Fishes 2025, 10(9), 472; https://doi.org/10.3390/fishes10090472
Submission received: 29 July 2025 / Revised: 3 September 2025 / Accepted: 19 September 2025 / Published: 22 September 2025
(This article belongs to the Special Issue Adaptation and Response of Fish to Environmental Changes)

Abstract

The physiological and gill health responses of juvenile spotted rose snapper (Lutjanus guttatus) were evaluated at four salinities—8, 16, 24, and 32‰—over a 70-day period. Fish reared at 8‰ exhibited the highest final body weight (126.8 ± 2.6 g), which was significantly higher than their congeners kept at 24‰ (116.0 ± 2.3 g) and 32‰ (116.0 ± 2.3 g). This superior growth at 8‰ coincides with the complete absence of parasitic monogenean infestations. In contrast, parasite prevalence increased with salinity, reaching 87.5% at 24‰, and was associated with gill pathologies like hyperplasia. Plasma osmolality and chloride levels decreased at lower salinities, while sodium and potassium levels showed a compensatory increase. Plasma cortisol and glucose levels remained stable across all treatments, indicating an absence of chronic stress. These findings suggest that the optimal rearing salinity for juvenile L. guttatus is near 8‰. The enhanced growth at this salinity appears to be the result of a net energy gain, stemming from a trade-off between the minor cost of osmoregulation in a hypo-osmotic environment and the major energetic benefit of avoiding parasitic disease.
Key Contribution: This study identifies the optimal rearing salinity for juvenile L. guttatus near 8‰. The key contribution is the finding that this optimum is not solely due to osmoregulatory energy savings but is strongly linked to improved gill health via the complete avoidance of monogenean parasites. This highlights the potential of using low salinity as a dual-purpose tool for enhancing both growth and health management in snapper aquaculture.

1. Introduction

A key premise in aquaculture is to diversify production with new species and/or methodologies that enable adapting production to different culture environments [1,2], including adapting marine fish to farming in low-salinity conditions. Adapting marine fish to farming in low-salinity conditions is a key goal in aquaculture diversification, offering the potential for inland production, reducing reliance on coastal areas, and potentially lowering operational costs associated with water management. Salinity is a critical parameter in the marine environment that can alter the osmotic balance of organisms by affecting their metabolism and biological rhythms, as it directly influences osmotic regulation and hormone and enzyme levels [3,4]. Euryhaline fish can maintain a stable internal osmotic balance by regulating osmotic pressure across the gills, kidneys, and intestines. However, abrupt changes in salinity can alter this mechanism, affecting the internal environment and energy distribution [5,6,7].
The energetic cost of osmoregulation for marine teleosts is not negligeable, and it is generally accepted that minimizing the osmotic gradient by rearing fish in lower salinities allows for the reallocation of energy towards growth [8,9]. In this study, we selected a range of salinities from 8‰ to 32‰ to evaluate the physiological response of L. guttatus from a strongly hypoosmotic condition up to full-strength seawater, aiming to define its tolerance range and identify an optimal level for aquaculture in estuarine environments. This capacity would open up new aquaculture possibilities in estuarine areas and even in freshwater environments.
To determine the effects of salinity on marine fish kept in captivity, it is common to use biochemical blood analyses that allow the determination of how the concentration of salts in the water affects the concentration of serum or plasma electrolytes (Na+, Cl, K+) [3,10], cortisol levels [11,12], osmolality [3,10,11,13], and glycemia [3,8,12]. The effects of salinity on the tissues and cells of the gills and the intestine have also been analyzed [3,8,10]. The goliath grouper (Epinephelus itajara) can gradually adapt and survive in waters of low salinity (30‰ to <1‰) [6], and even in freshwater. Suárez-Bautista and Rodríguez-Forero [14] found that swordspine snook (Centropomus ensiferus) is a species with great ion regulation capacity, where ion concentrations in the internal environment are not affected by salinity in the external environment (0‰, 10‰, and 20‰). Watson et al. [15] demonstrated that the red drum (Sciaenops ocellatus) effectively regulates Na+ balance upon exposure to freshwater while also regulating ion excretion mechanisms, which has enabled a physiological adaptation for the culture of this species in freshwater. In other species, such as the shi drum (Umbrina cirrosa), the osmoregulatory tolerance limit towards low salinity is lower, as studies have shown that this species does not experience any osmoregulatory imbalance until it reaches isosmotic salinity (10‰). In contrast, specimens raised in hypoosmotic water (4‰) showed osmoregulatory deterioration and low growth performance [10]. This capacity to adapt to a wide variety of conditions in fish implies that correctly establishing osmoregulatory tolerance limits can not only open the possibility of culturing them in low salinity but also allows for determining the range of salinity where growth can be optimal. This information can be used to identify the optimal areas for the sustainable culture of marine fish, thereby achieving adequate Marine Spatial Planning in areas where other activities co-occur [16]. In addition, marine fish culture in brackish waters brings cultures closer to land areas, thereby reducing production costs (such as transportation and security) and the risk of frequent adverse environmental conditions in the open sea. Additionally, greater control over wastewater discharge can be achieved, for example, through the use of Recirculating Aquaculture Systems (RAS) [17].
The L. guttatus is considered a promising candidate for the development of commercial marine fish farming on the tropical and subtropical Pacific coast of Latin America in the species range that extends from the Gulf of California to Peru [18] and has an attractive export market in the U.S. [19]. This species has been extensively studied in Mexico and Costa Rica, achieving significant advances in all culture phases (reproduction, larval culture, and fattening) [16,19,20,21]. Importantly, juveniles of this species are frequently found in estuarine and mangrove areas, indicating a natural tolerance to variable and lower salinities during this life stage [22]. Previous studies on this species found a tendency to improve growth at salinities lower than 30‰, with acceptable performance down to 15‰ [23,24]. However, its physiological responses and performance limits at salinities below this level remained unknown. Furthermore, snapper species in aquaculture are often susceptible to ectoparasitic monogenean infections, which can impair health and growth [25]. As the viability of many monogenean species is salinity-dependent, investigating the effects of low-salinity rearing on both fish performance and parasite load is of significant practical importance.
Therefore, the objective of this research was to determine the physiological response of spotted rose snapper at different environmental salinities (8–32‰) to establish the optimal growth range and culture potential of this species.

2. Materials and Methods

Juveniles of L. guttatus were selected from a population of 1500 specimens that were kept in a 10,000 L tank (salinity = 32‰) and were produced from captive broodstock at the Aquaculture and Biotechnology Laboratory of the Pacific Marine Park, Puntarenas, Costa Rica (9°58′36.23′′ N; 84°49′42.21′′ W).

2.1. Experimental Design

As an initial reference, 8 juvenile subjects were randomly selected from population to determine their weight, total length (TL), hepato-somatic index (HSI%), viscero-somatic index (VSI%), and blood biochemistry (Figure 1). In the experimental phase, the physiological response of juvenile L. guttatus (46.0 ± 7.6 g, 14.00 ± 0.8 cm: mean ± standard deviation) to different seawater salinities (8‰, 16‰, 24‰, 32‰) was determined in an experimental random block system of four treatments with four replicates each, for a 70-day period (Figure 1).
A total of 480 juvenile L. guttatus, were randomly distributed in 16 (1300 L) circular fiberglass tanks (1.5 m diameter; 0.75 m water depth). Treatments (T) were as follows: salinity 8‰ (T1), 16‰ (T2), 24‰ (T3), and 32‰ (T4), with 120 fish per treatment, four replicates ach (30 fish/tank, density 23 fish/m3). Each treatment utilized an RAS unit comprising a centrifugal pump, a mechanical filter with a glass filter media, a biological filter, a foam fractionator, and an ultraviolet sterilizer. Each tank received a daily water renewal equivalent to 44% of its volume (575 L day−1). Four 10 m3 tanks were used to mix water and adjust the salinity levels of each treatment. This was achieved by mixing filtered natural seawater (32‰) sourced directly from the adjacent bay with municipal tap water that was previously dechlorinated and aerated for 48 h. The new water was replaced by using a submersible pump (300 L tank−1 = 23%). The continuous water exchange in the RAS was 12 L min−1 in each tank. Each tank was equipped with two diffuser stones to ensure airflow between 7–11 L min−1 and a surface foam fractionator to collect and extract food debris and fat.
Dissolved oxygen fluctuated as expected due to changes in temperature and salinity over time (5.2–7.4 mg O2 L−1). The temperature was the natural temperature of the adjacent unregulated seawater (27.4–30.1 °C). The photoperiod in Costa Rica was characteristic of the tropics, with approximately 12 h of light (L) and 12 h of darkness (D). The pH in the tanks remained relatively constant at 8.0, with occasional small fluctuations between 7.8 and 8.2. Salinity was adjusted daily for one week until the final salinity level of the treatments (8‰, 16‰, 24‰, and 32‰) was reached. Finally, the total ammonium and NH3-N concentrations remained constant at near-zero mg L−1 throughout the experimental phase. In all phases of this study, the physicochemical variables monitored, except for salinity, were in the normal range reported for the species [19].
Fish were acclimatized to the conditions of the culture tanks 15 days before changing salinity. The target salinities of each treatment were met proportionally 9 days after the experiment began. Feeding was adjusted to achieve satiety, which was determined by providing a pre-weighed amount of feed and removing and weighing any uneaten pellets 30 min after feeding. The ration was then adjusted daily to ensure minimal waste, indicating that fish were fed to apparent satiation. Rations ranged from 1.4% to 2.6% of average body weight per day. Food was provided twice a day (8:00 and 16:00). Their diet consisted of 50% protein and 9.3% lipids, supplemented with a 4.5 mm caliber “FaryAqua Peces Marinos” FARYVET, manufactured in Costa Rica.
Fish were anesthetized with clove essential oil [2-methoxy-4-2-(2-propenyl)-phenol] at 40 ppm for blood sampling. Subsequently, each subject was weighed (g) and measured Lt (cm) using an OHAUS PX323 SERIES analytical balance (SD ± 0.001) (OHAUS Corporation, Parsippany, NJ, USA) and a 100 cm Wildco #118 ichthyometer (Wildco Wildlife Supply Company, Yulee, FL, USA), respectively. Fish were then euthanized with an overdose of the same anesthetic for collection of liver, visceral fat, gill and anterior intestine.

2.2. Sampling and Analysis

2.2.1. Growth and Survival Rates and Condition and Feed Conversion Ratios

Five fish from each replica were sampled on the days 14, 28, 42, 56, 70. Primary data obtained from the samples was entered into the Excel® 2016 software, and subsequently, the following indices were determined:
  • Absolute growth rate [26]: A G R   d a y 1 = ( F W I W ) T
  • Specific growth rate [27]: S G R ( B W % )   d a y 1 = ( L n   F W L n   I W ) T     100
  • Feed conversion ratio [28]: F C R = F G   ( g ) W G   ( g )
  • Survival rate [29]: S R   ( % ) = final   #   of   subjects initial   #   of   subjects 100
  • Length-to-weight relationship [30]: T W = a T L ^b
  • Fulton Condition Factor [31]: K = B W T L ^ 3 100
Where FW = final average total weight (g), IW = initial average weight (g), T = number of days of the period, BW = Body weight (g), Ln = natural logarithm, FG = feed given (g), WG = weight gain (g), TW = total weight of fish (g), a = regression constant, TL = total length (cm), b = regression growth coefficient
Survival and food consumption were determined daily per tank by calculating the difference in the weight of food delivered and the weight of food not eaten.

2.2.2. Hepatosomatic Index (HSI) and Viscero-Somatic Index (VSI)

To obtain the baseline value of the initial population N in the natural conditions of the adjacent seawater, the first sampling was conducted on juveniles (n = 8: 49.57 ± 5.0 g) on day one of the experimental phase. During the experimental phase, the first sampling was conducted on day 38 (n = 4/treatment: 82.7 ± 9.7 g) and the second on day 70 (n = 8/treatment: 109.5 ± 31.9 g).
Juveniles were dissected to remove the liver and visceral fat. Whole fish, the liver and fat, were weighed on the analytical balance. Primary data obtained from the samples was entered into the Excel® 2016 software, and subsequently, the following indices were determined:
  • Hepatosomatic index [32]: H S I = L W B W 100
  • Viscero-somatic index [33]: V S I = V W B W 100
Where LW is the liver weight (g), BW is the body weight (g) and VW is the viscera weight (g).

2.2.3. Blood Biochemical Tests

Blood samples were taken from the initial population N (n = 8; BW = 64.8 ± 3.7 g) on day one of the experimental phase to determine the composition of electrolytes (Na+, Cl, K+), cortisol, and osmolality. Tests were taken from fish from the experimental phase on day 38 (n = 4/treatment: 94.7 ± 6.6 g) and 70 (n = 8/treatment; BW = 121.6 ± 28.4 g).
Blood was obtained directly from the fish heart using a hypodermic needle attached to a 1–3 mL syringe and placed in a tube with EDTA and Vacuette® coagulation activator (Greiner Bio-One, Kremsmünster, Austria). To minimize handling stress, each fish was individually netted, and blood was sampled within 3 min of capture. Serum from samples placed in tubes without anticoagulant was separated in a Centurion Scientific Pro-Vet centrifuge at 4500 revolutions m−1, for 5 m. Electrolytes (Na+, Cl, K+) were determined with an automated clinical chemistry spectrophotometer (Spin 200 E; Spinreact, S.A.U., Sant Esteve de Bas, Spain). Sodium was determined enzymatically via sodium-dependent β-galactosidase activity with O-nitrophenyl-β-D-galactopyranoside (ONPG) as the substrate [34]. Potassium was determined using a kinetic coupling assay system that utilizes potassium-dependent pyruvate kinase [31]. Chloride ions were determined by chlorimetry [35]. Cortisol levels were determined using an AIA-360® Automated Immunoassay Analyzer (Tosoh Corporation, Tokyo, Japan), via a competitive fluorescent enzyme immunoassay [36,37]. Osmolality was measured in plasma and tank water using a freezing point depression osmometer (Osmo1®, Advanced Instruments, accuracy ≤ 2 mOsm kg); the freezing point depression method was used for all osmolality measurements [38,39]. Glucose was determined by drawing blood from the fish tail vein and placing it directly on TRUEtest test strips. Glucose levels were measured using a NIPRO DIAGNOSTICS TRUE METRIXTM glucose meter (Trividia Health, Inc., Fort Lauderdale, FL, USA).

2.2.4. Histological Analysis

Gill and intestine samples were taken on day 70 (n = 8/treatment; BW = 111.4 ± 30.0 g) for subsequent histological analysis. The anterior intestine and second-gill arch were removed from each selected fish. Samples were fixed in 10% buffered formalin for 48 h; subsequently, the fixative was replaced by 70% ethanol. Samples were dehydrated using increasing concentrations of ethanol, cleared with xylol, and embedded in paraffin using a Myr Automated Tissue Processor (Especialidades Médicas Myr, Tarragona, Spain) and a Leica Histocore Arcadia Embedding Center (Leica Biosystems, Nussloch, Baden-Württemberg, Germany). Serial sections (4 µm) were obtained using a Leica RM2125 RTS semi-automated microtome and stained with Hematoxylin & Eosin (H&E) staining. The slides were examined under a light microscope (Leica DM LB, Leica Microsystems, Wetzlar, Hesse Germany) and images were captured using an Olympus DP70 digital camera (Olympus Europa, Hamburg, Germany) and processed with Analysis software (Olympus Soft Imaging Solutions, Hamburg, Germany) to observe the effect of salinity on tissue morphology. The general appearance of the tissue was described. The number and size of ionocytes and goblet cells in the gills, as well as fold height, enterocyte height, and the number of goblet cells in the anterior intestine, were recorded (n= 120 data points per treatment).
Cell counts in gill and intestinal tissues were performed within a standardized square area of 1000 µm × 1000 µm (1 mm2) located in the middle portion of the gill filaments and the intestinal folds (n = 15 measurements per fish), using ImageJ v. 1.54p software (National Institutes of Health, Bethesda, MD, USA). The same program, with its calibrated line tool, was also used to obtain measurements of individual cells in the gills and intestine, as well as of the intestinal folds. The percentage of aneurysm, hyperplasia, and parasitized fish was calculated as the number of fish exhibiting each lesion relative to the total number of fish analyzed per treatment. Monogeneans were counted on one slide per fish analyzed.

2.3. Statistical Analysis

All blood osmolality and growth parameters were evaluated with a one- or two-way Analysis of Variance (ANOVA), using growth time and salinity concentration as factors. Means were compared using Tukey’s Honest Significant Difference test (Tukey’s HSD test, p < 0.05) for a statistically significant analysis of variance (ANOVA) (p < 0.05). All statistical assumptions were verified a priori. All statistical analyses were conducted with a significance level of α = 0.05 in the R programming language [40]. The number and size of ionocytes and goblet cells in the gills, as well as fold height, enterocyte height, and the number of goblet cells in the anterior intestine, were compared among salinities using one-way Analysis of Variance (ANOVA) tests. Means were compared using Tukey’s Honest Significant Difference test (Tukey’s HSD test, p < 0.05) for a statistically significant analysis of variance (ANOVA) (p < 0.05).

3. Results

During all phases of the trial, water quality parameters remained stable and within the recommended ranges for the species. Mean (± SD) values recorded across all treatments were: temperature 28.5 ± 1.2 °C; dissolved oxygen 6.1 ± 0.8 mg L−1; pH 8.0 ± 0.2; and total ammonia nitrogen < 0.1 mg L−1. Fish adapted well to all four tested salinities, resulting in 100% survival throughout the research period (Table 1).
Regarding somatic growth, at the end of the trial, spotted rose snapper reared in 8‰ showed the best growth performance with significantly higher final body weight, body weight gain and final body length compared to fish reared in 24‰ and 32‰ (p < 0.05; Table 1). Fish reared in 16‰ were intermediate, with no significant difference compared to other treatments. No significant differences in terms of AGR and SGR were found among groups (p > 0.05; Table 1), even though their numerical values followed the same trend observed for final body weight and weight gain. This apparent discrepancy can be attributed to the nature of these metrics; final body weight is a cumulative measure reflecting total growth over the entire 70-day trial, whereas AGR and SGR represent average daily growth rates. Small, consistent daily growth advantages in the low-salinity group, while insufficient to be statistically significant on an average daily basis, accumulated over the experimental period to result in a significantly higher final body weight. The same numerical trend was found with regard to FCR values (p > 0.05). Regarding body condition indexes, no statistically significant differences were found in HSI, VSI and K (p > 0.05; Table 1).
Regarding the evolution of fish growth during the trial, a constant linear growth pattern in weight and length of the spotted rose snapper was observed during the 70-day experiment for all tested water salinity concentrations (Figure 2), with statistically significant differences noted at days 56 and 70. In both sampling points, the weight of fish reared in 8‰ salinity was statistically higher than that of fish in 24‰ and 32‰, and values from the 16‰ group were intermediate (Figure 2A; p < 0.05). However, fish length exhibited similar differences, only on day 70 when the length of fish reared in 8‰ salinity was statistically higher than fish in 24‰ and 32‰, and values from the 16‰ group were intermediate (Figure 2B). Fish length at 56 days evidenced no statistically significant difference at salinities of 8‰ and 16‰ or between 8‰ and 24‰, while fish length was greater in 16‰ than at 24‰ and 32‰.
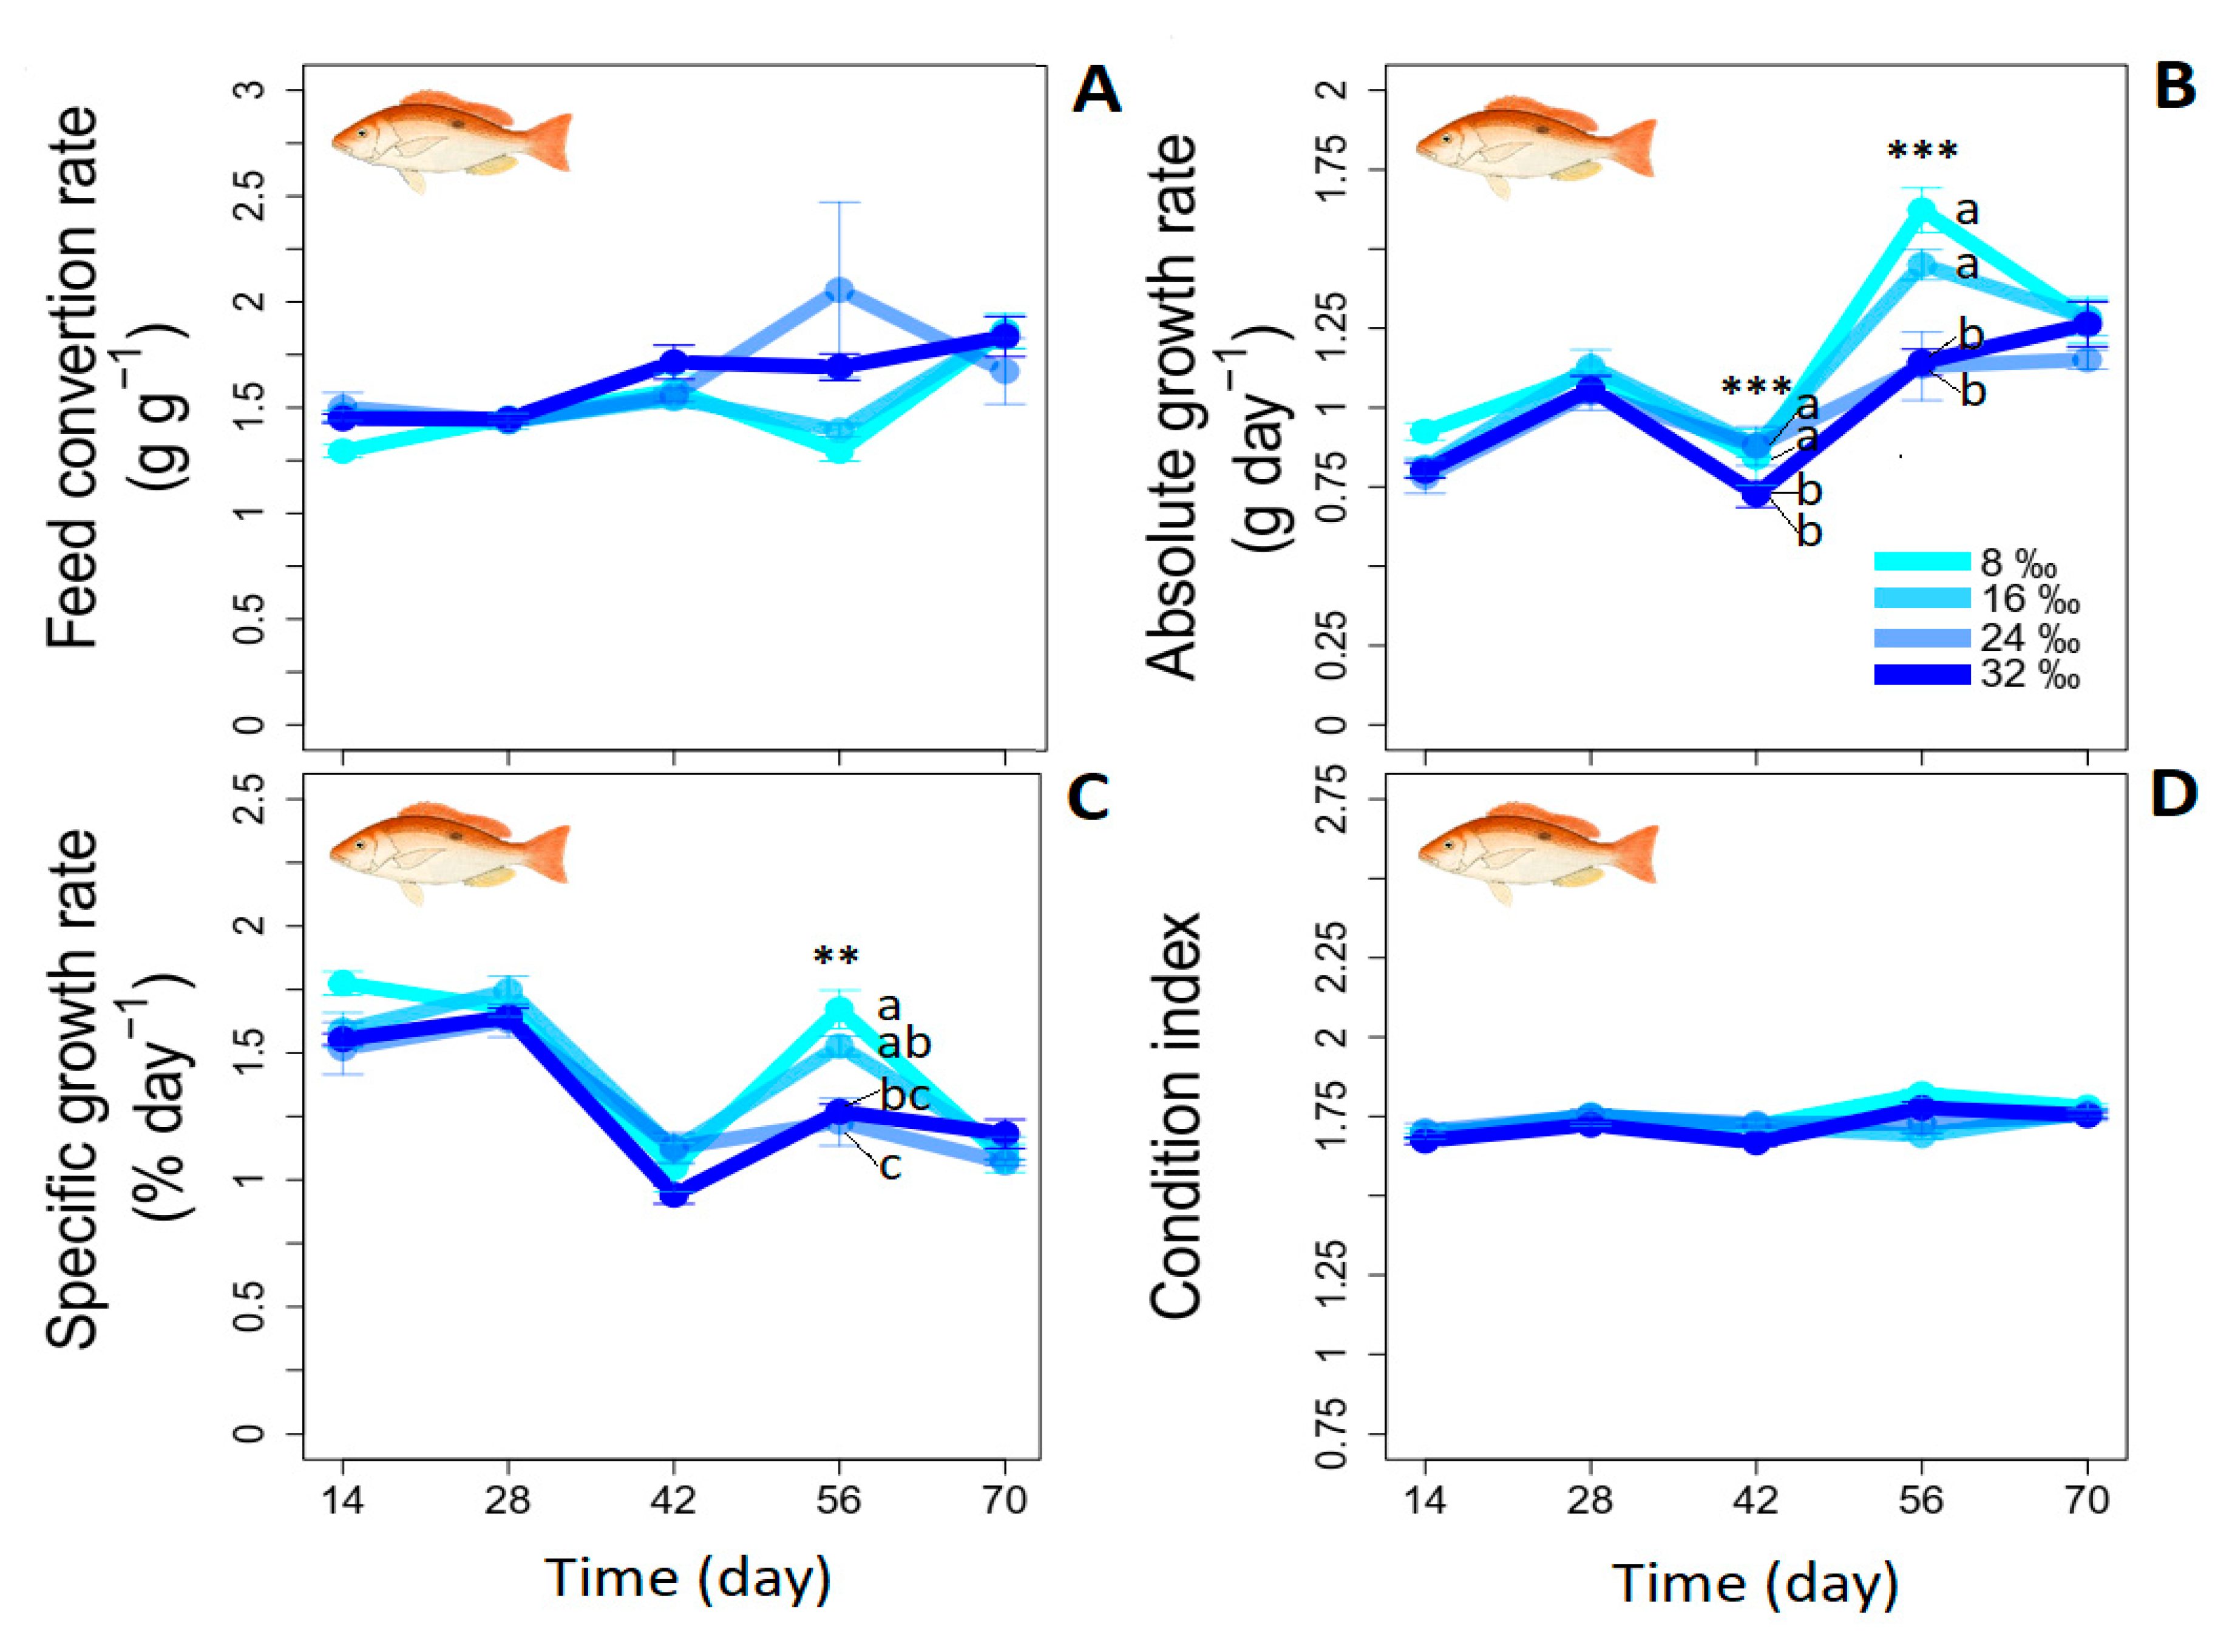
The feed conversion ratio (FCR) showed significant changes with slight increases over time, but at no point during sampling did it show significant differences between salinity concentrations (Figure 3A; p > 0.05). However, AGR and SGR showed significant differences between salinity concentrations at some sampling dates (Figure 3B,C; p < 0.05). AGR values in spotted rose snapper kept at 8‰ and 16‰ salinity were significantly higher than 24‰ and 32‰ at sampling times of days 42 and 56 (p < 0.05). SGR values at 8‰ salinity were significantly higher than at 32‰ salinity. However, the SGR of fish reared in 16‰ and 24‰ salinity were intermediate between 8‰ and 32‰ groups. The fish reared in 16‰ had similar SGR as fish in 8‰ and 24‰ and were significantly higher than fish in group 32‰ (p < 0.05). The fish reared in 24‰ had similar SGR as fish in 16‰ and 32‰ and were significantly lower than fish in group 8‰ (p < 0.05). Finally, K values remained constant between sampling dates and showed no significant changes between salinity concentrations (Figure 3D).
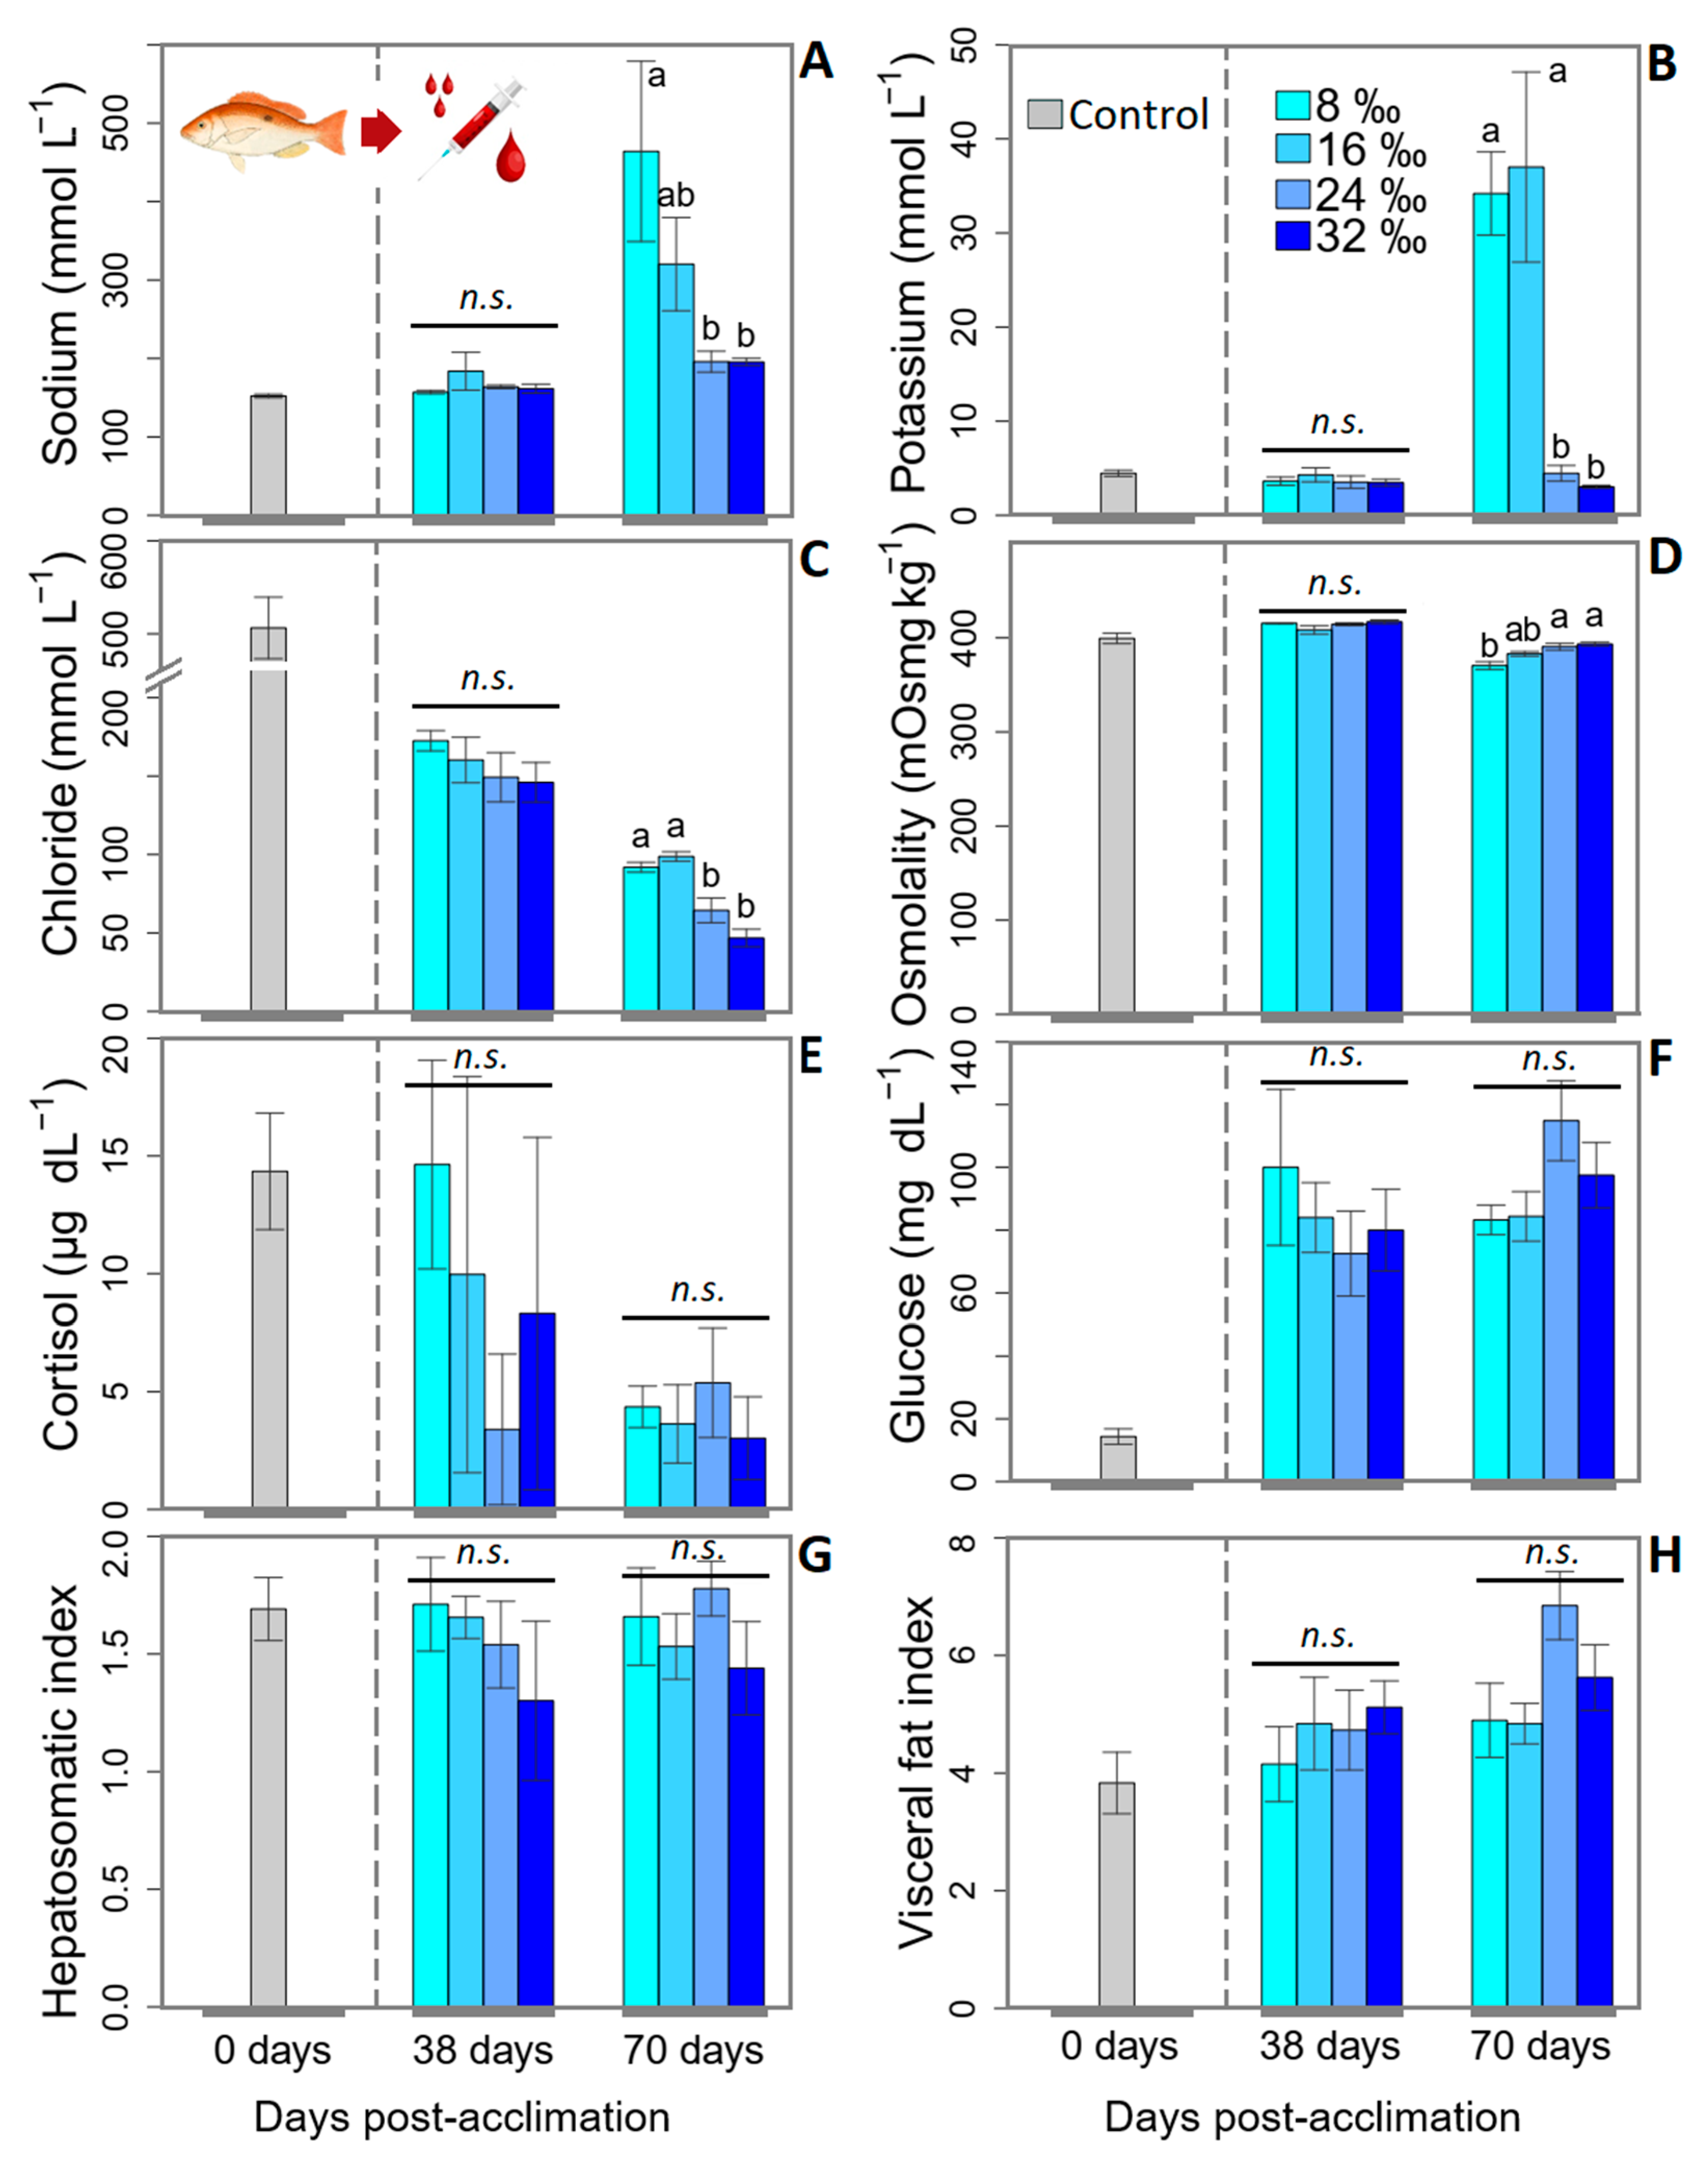
Regarding blood biochemistry, Na+ and K+ levels increased significantly between sampling dates (Figure 4A,B; p < 0.05). In contrast, the Cl levels and serum osmolality decreased between sampling dates (Figure 4C,D; p < 0.05). Finally, Na+, K+, Cl, and serum osmolality only showed statistically significant differences between salinity concentrations at 70-day sampling. In particular, Na+ values at 8‰ salinity were greater than at 24‰ and 32‰, whereas at 16‰ values were intermediate (p < 0.05). The parameters, K+ and Cl showed the same pattern, displaying greater levels at 8‰ and 16‰ than at 24‰ and 32‰ (p < 0.05). On the contrary, No significant differences in serum osmolality were observed among treatments, although values at 8‰ and 16‰ were numerically lower than those in fish kept at 24‰ and 32‰ (p > 0.05). No statistically significant differences were found in terms of serum cortisol and glucose among salinity groups regardless of the sampling point considered (Figure 4E,F, p > 0.05). Regarding body condition indexes like the HSI and VSI, groups did not differ amongst salinity treatments or sampling point (Figure 4G,H, p > 0.05).
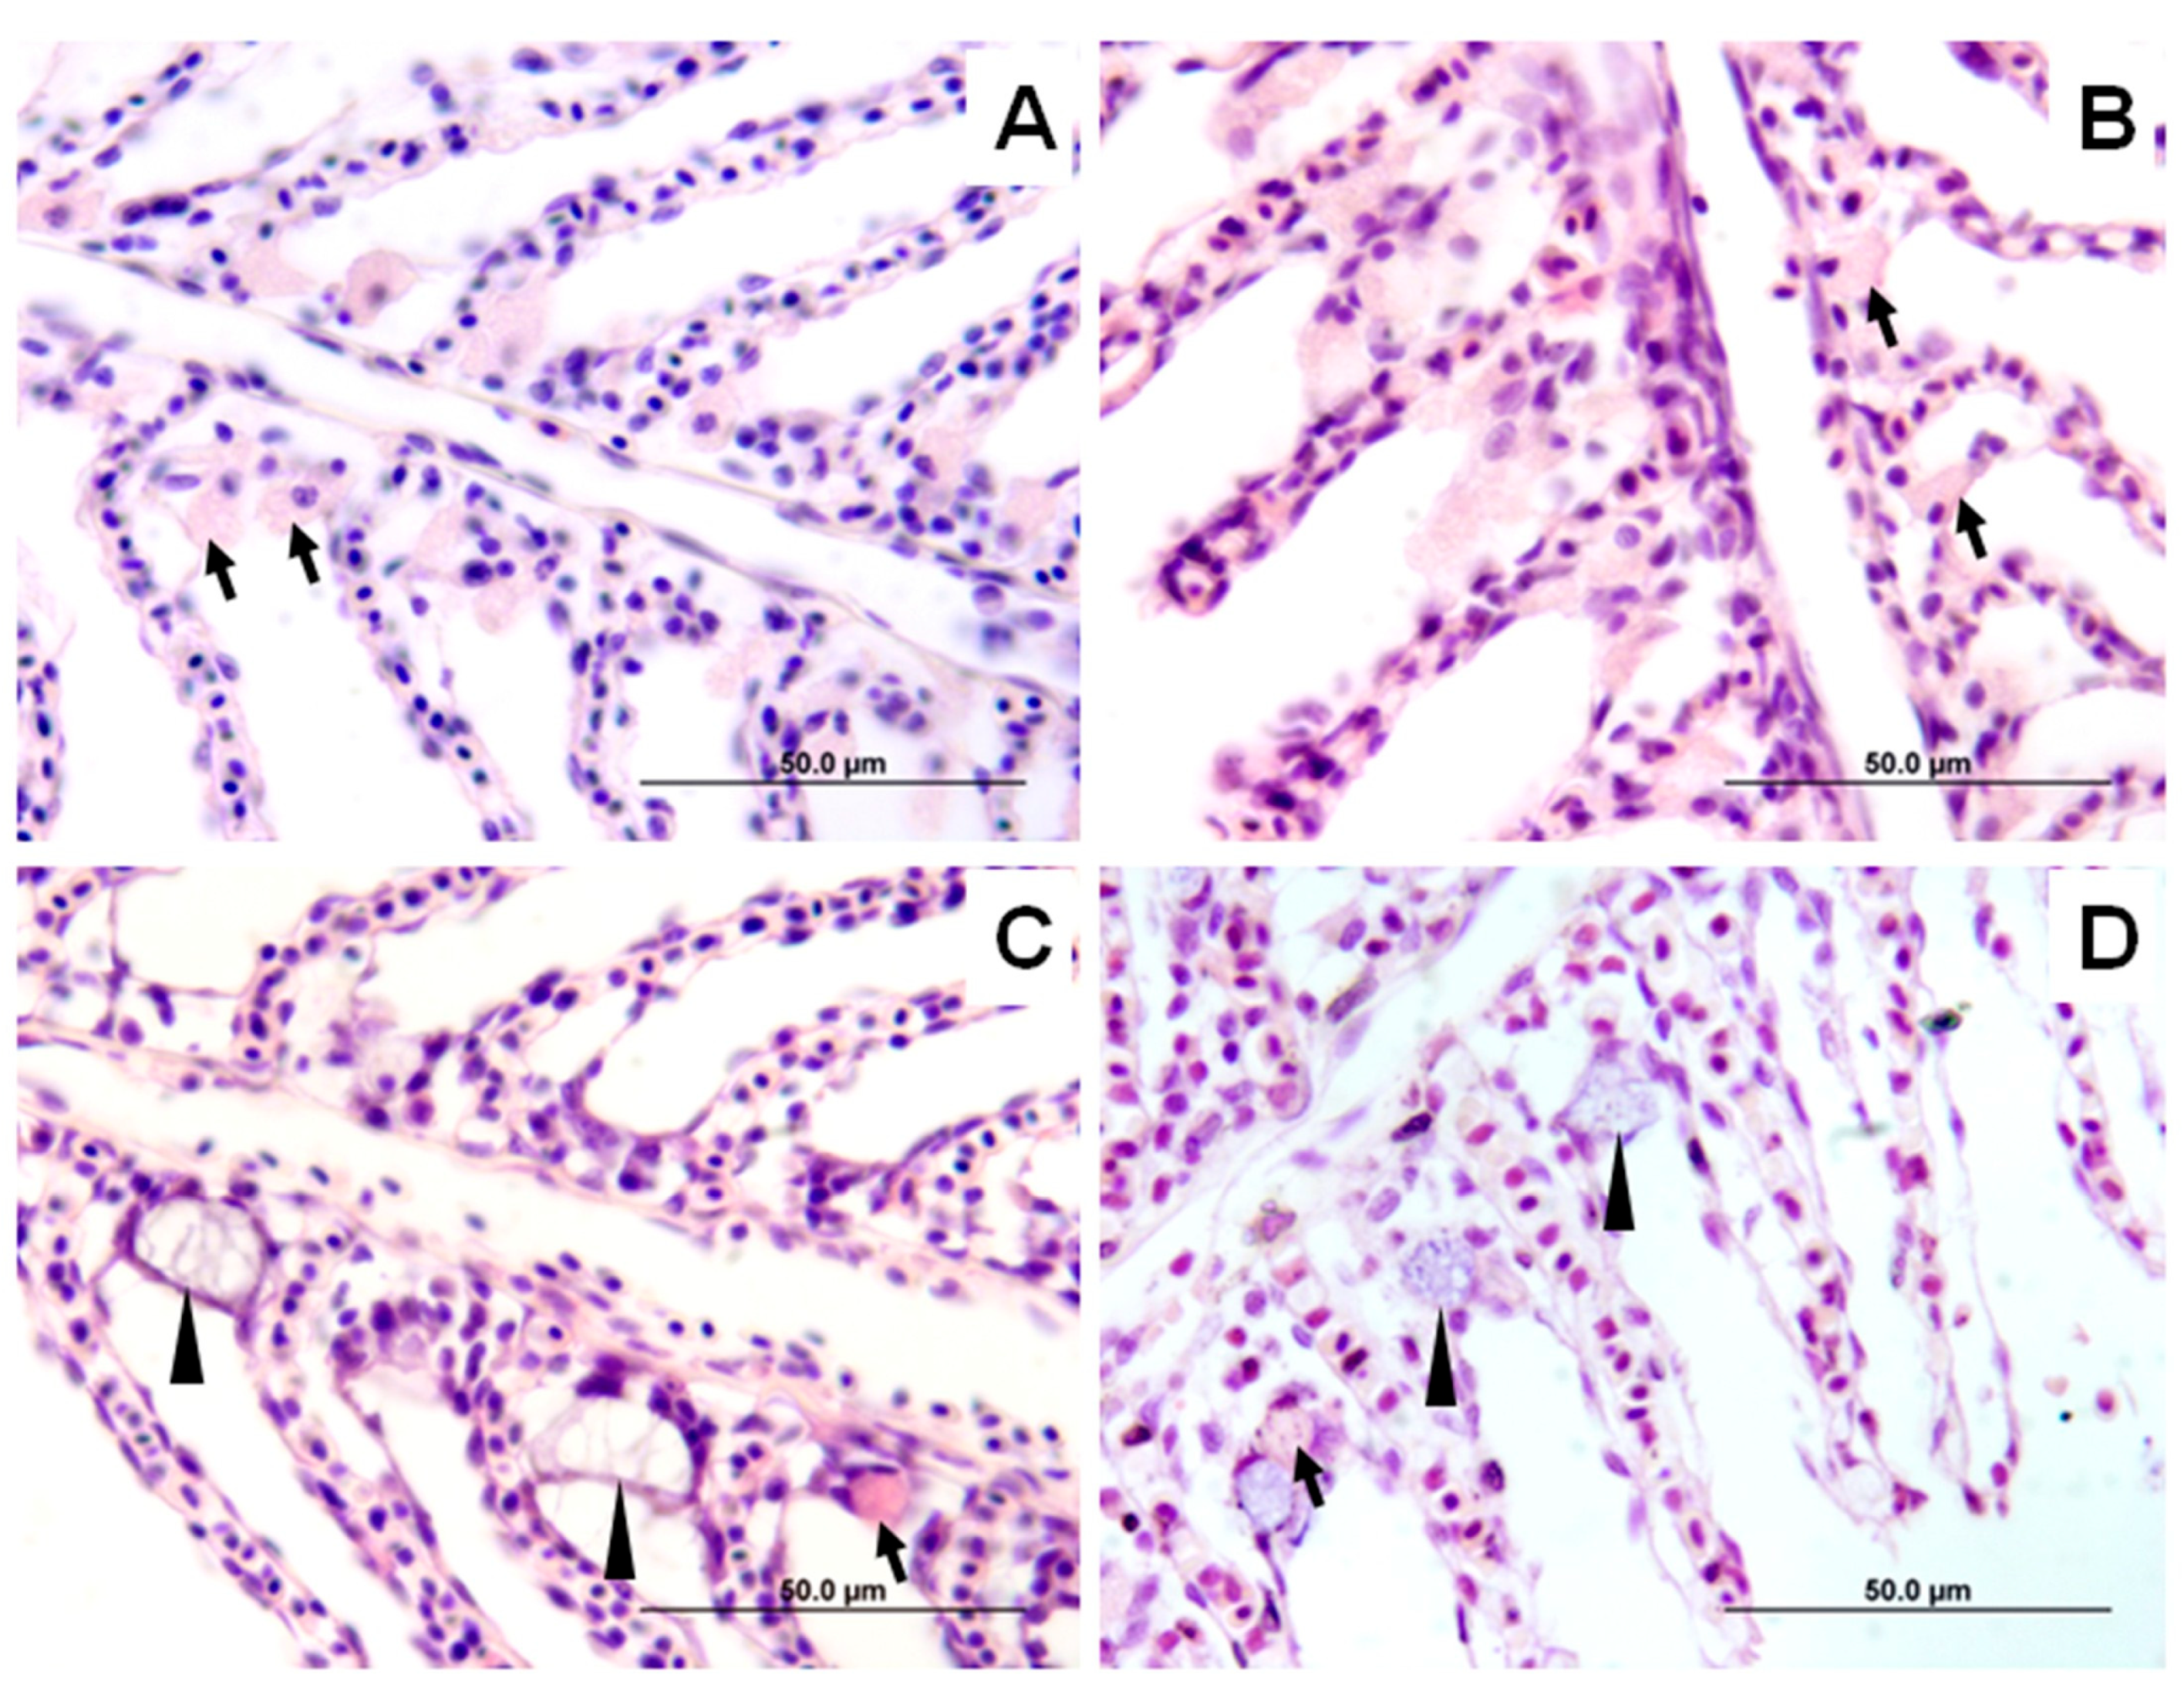
Histological analysis of the gills (Figure 5) revealed that ionocytes, responsible for ion transport, were more abundant and prominent in the low-salinity treatments (8‰ and 16‰) than in the higher salinity treatments (24‰ and 32‰) (Table 2). In low-salinity conditions, these ionocytes exhibited a triangular shape and paler staining (Figure 5A,B), whereas in fish exposed to higher salinities, they appeared rounded and more intensely stained (Figure 5C,D). Additionally, in fish exposed to low salinity, ionocytes were observed not only at the basal part of the lamellae, as in the high-salinity treatments, but also along both sides of the proximal third of the lamellae (Figure 6A). Conversely, a greater number of goblet cells—responsible for mucus secretion—was observed in the higher salinity treatments (24‰ and 32‰) compared to the lower salinities (8‰ and 16‰). These mucous cells were not only more numerous with increasing salinity but also larger in size (Table 2).
Fish exposed to 8‰ salinity showed focal edema at the base of the lamellae (Figure 6A). Lamellae with aneurysms were also observed in fish exposed to 8‰ (Figure 6B), 16‰, and 24‰, but not in those exposed to 32‰ (Table 2). The opposite was observed regarding hyperplasia, which were more prevalent and showed higher intensity at high salinities (24‰ and 32‰) compared to low salinities (8‰ and 16‰). Although the study was not designed to evaluate pathogen presence in relation to salinity, unidentified monogenean parasites were detected in fish exposed to 16‰, 24‰, and 32‰, but not in those exposed to 8‰. The prevalence and number of these monogeneans increased with salinity (Table 2), causing focal necrosis and inflammation with lamellar fusion (Figure 6C), hyperplasia, and lamellar thickening (Figure 6D) in infected fish.
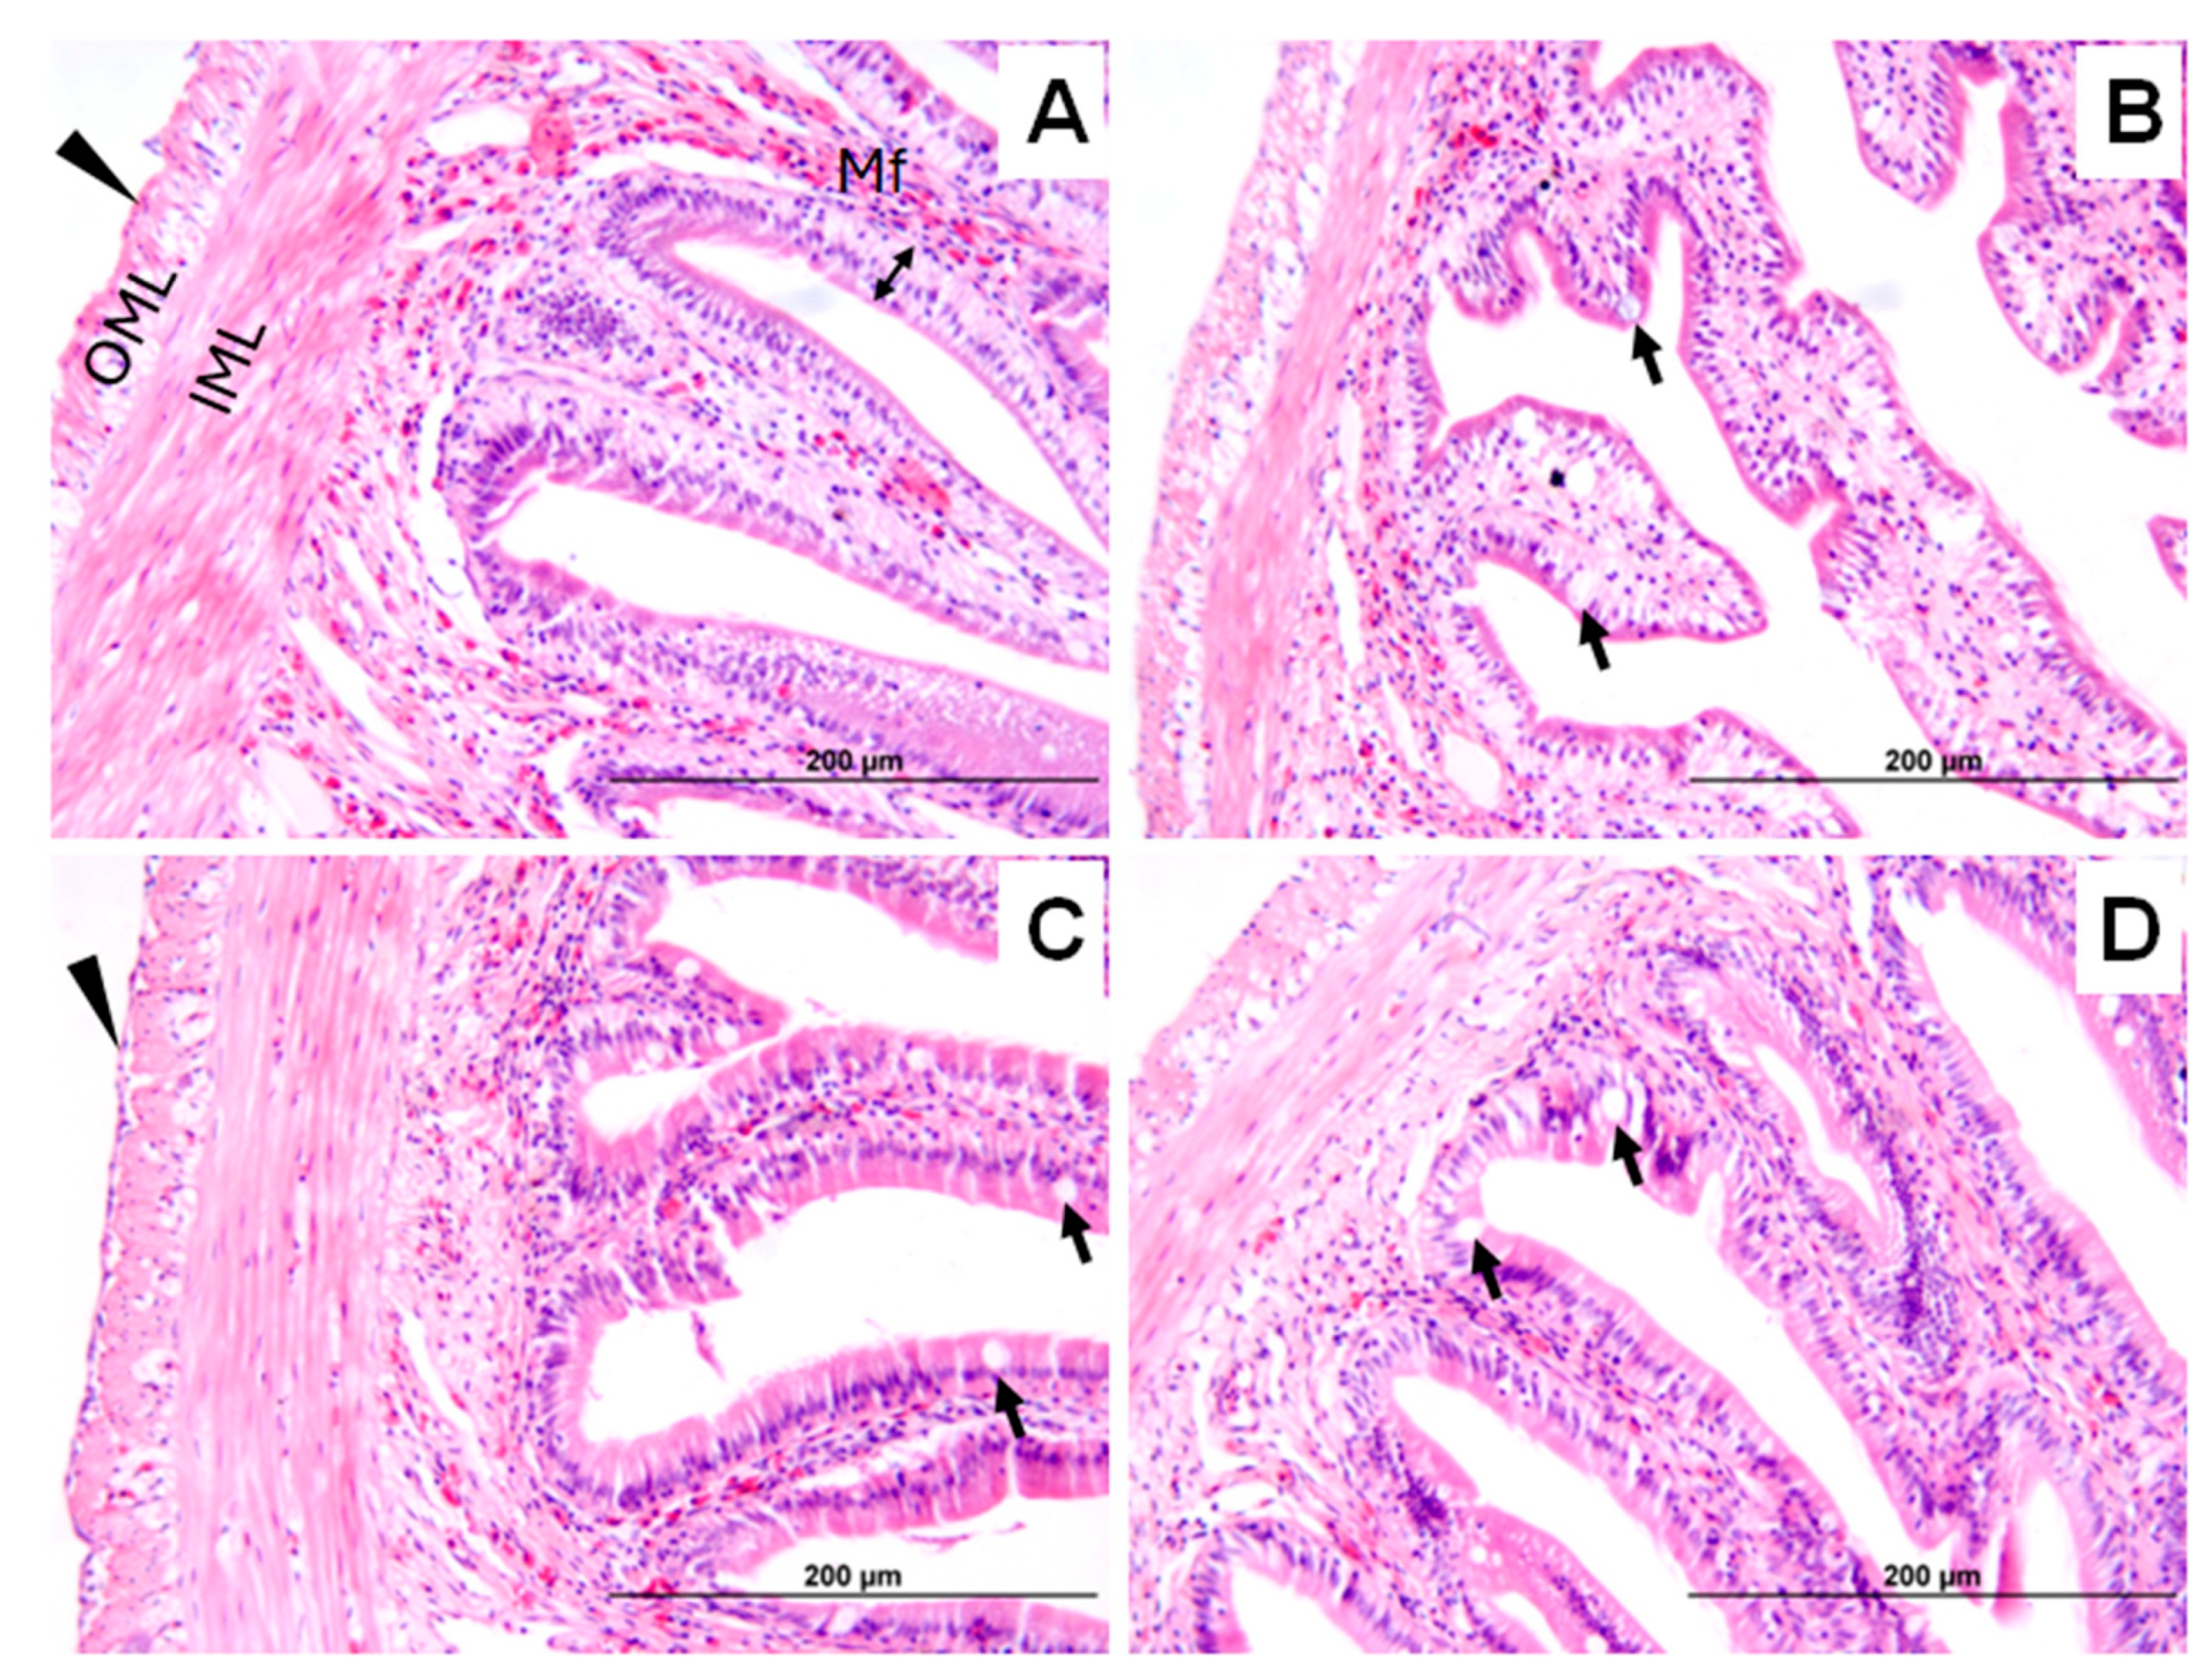
The histological analysis of the anterior intestine at the end of the experiment showed no tissue alterations in any of the treatments (Figure 7). Overall, the intestinal epithelium exhibited good structure, integrity, and an abundance of goblet cells. The submucosa showed no signs of alteration, inflammatory infiltrate, or edema in any of the treatments analyzed. No significant differences (p > 0.05) in fold height, enterocyte height, or goblet cell number were observed between treatments (Figure 8).

4. Discussion

This study demonstrates that juvenile L. guttatus, a euryhaline marine species, exhibits significantly better growth performance when reared at a low salinity of 8‰ compared to higher salinities. Crucially, this improved growth was strongly associated with a complete absence of parasitic monogenean infestations at 8‰, whereas parasite prevalence and associated gill pathologies increased markedly at higher salinities. This suggests that the optimal rearing condition for this species in aquaculture is the result of a net energetic benefit, where the minor physiological cost of osmoregulation in a hypoosmotic environment is far outweighed by the major advantage of avoiding the energetic burden of parasitic disease. These findings confirm the species’ potential for culture in low-salinity estuarine environments and highlight the role of salinity as a tool for health management.
Salinity is considered one of the most influential abiotic factors in the growth of many coastal euryhaline fish [41]. Previous studies have shown that marine species respond directly to variations in their environment because maintaining an adequate osmotic balance is essential for their survival and growth [9]. The effects of salinity on the growth and survival of L. guttatus exposed to four levels of salinity (15‰, 25‰, 35‰, and 45‰) have been previously reported [23,24]. Given that the species’ growth improved at salinities lower than 30‰, with acceptable performance down to 15‰, it was concluded that this species had the potential for culture in lagoon-estuarine environments. However, this study has shown that this species has a broader culture range of salinities towards lower salinity values (8‰). This result may benefit culture in estuarine waters and even in land culture systems such as ponds and RAS.
Other marine species, such as yellowtail kingfish (Seriola lalandi), have shown similar results, with the highest growth obtained at lower salinities of 14‰, 18‰, and 22‰, compared to the higher salinities like 26‰ and 30‰ [8]. Similarly, juvenile Plata pompano (Trachinotus marginatus) exposed to low salinities (3‰ and 6‰) showed greater growth (body length and weight) than those raised at 32‰ for 28 days [3]. Juvenile Florida pompano (Trachinotus carolinus), commonly found in saltwater, similarly showed improved growth performance when grown at low salinity (5‰) for 110 days [42]. This performance is also observed in other teleost fish, such as cobia (Rachycentron canadum) and gilthead sea bream (Sparus aurata), which have much lower optimal salinities for growth than those found in oceanic waters [3]. Some species do not adapt well to low-salinity waters, such as the meagre (Argyrosomus regius), as they have low survival rates (58.3%) when exposed to 8‰ salinity compared to 24‰ or 32‰ [43].
During the experimental phase of this research, the best results were obtained at a salinity of 8‰. The average absolute growth rate (AGR) obtained, 1.2 ± 0.0 g day−1, is considered normal within the range reported in other culture studies of this species and slightly higher than other studies. For instance, Gil and Sinisterra [44] obtained an AGR of 0.7 g day−1 in L. guttatus juveniles grown in floating cages and fed with formulated feed (35% protein and 7% fat) at an average temperature of 29 °C and 12.9‰ salinity. Castillo-Vargasmachuca et al. [45] reported an AGR of 0.93 g day−1 in the culture of juveniles in floating cages from 24.5 g to 155.2 g at a temperature of 25.6 to 32.3 °C, fed with formulated feed (protein 35%, lipids 7%). SGR equivalent to 1.45 ± 0.0 BW day−1 was lower than that reported by Gil and Sinisterra [44] (1.59), but higher than that reported by Castillo-Vargasmachuca et al. [45] (1.2% BW day−1). The FCR of 1.9 ± 0.0 was better than the one obtained by Gil and Sinisterra [44] (2.5 and 2.9) and by Castillo-Vargasmachuca et al. [45] (2.0), which indicated an improvement in diet formulation for this species.
Growth results coincide with the statement that, at higher salinity, there is greater use of energy for osmoregulation, and that at low salinity, there is an opposite effect that contributes to higher somatic growth since more energy may be diverted to growth rather than osmoregulation [46]. Several studies estimate that the percentage of metabolic energy required for adequate osmoregulation ranges between 10% and 50%, depending on the conditions and the species [47,48]. Therefore, a higher energy need for osmoregulation implies a lower percentage of energy available for tissue and muscle formation in fish. In this balance of energy metabolism, plasma glucose serves as a key indicator of the organism’s energy status, as it is the primary source of energy for metabolic processes. Since there were no statistically significant differences in glycemia between treatments and over time, the present study suggests that the energy availability of spotted rose snappers was not affected by changes in salinity. Although a decrease in glycemia was evident by day 70 in 8‰ and 16‰ salinities, which is an expected physiological response, energy demand to meet the requirements of osmoregulation in these salinities was lower [8].
While the optimal growth at 8‰ suggests significant energy savings, this result appears to challenge the general principle that maximum energy savings occur at a fish’s isosmotic point, typically 10–14‰ for marine teleosts. Based on the plasma osmolality values recorded in this study (370–395 mOsm kg−1), the estimated isosmotic point for L. guttatus is approximately 12–14‰, a range consistent with values reported for other snapper species such as L. campechanus [49]. The higher growth observed at 8‰, a salinity clearly below this isosmotic range, suggests that this species handles hypo-osmotic conditions exceptionally well. However, osmoregulatory cost is not the only factor influencing the energy budget. Our histological findings provide a critical insight: fish at 8‰ were completely free of monogenean parasites, whereas parasite prevalence and associated pathologies, such as hyperplasia, increased significantly at higher salinities (Table 2). The energetic cost of mounting an immune response and repairing gill tissue damage caused by these ectoparasites can be substantial, often leading to reduced growth as energy is diverted from somatic processes [50]. Therefore, we propose that the optimal growth at 8‰ is not solely a function of osmoregulatory efficiency, but rather the result of a trade-off. The minor energetic cost of osmoregulation in a hypo-osmotic environment is likely far outweighed by the significant energy savings from the absence of a parasitic burden, leading to a net positive energy balance available for somatic growth.
A key finding of this study is that the optimal growth performance was observed at the lowest salinity tested, 8‰. This naturally raises the question of whether L. guttatus could exhibit even better growth at salinities below this level. Physiologically, growth performance in euryhaline fish is often maximized at or near their isosmotic point, where the energetic cost of osmoregulation is minimized [10]. While it is plausible that the true optimum for this species lies slightly below 8‰, further decreases in salinity would eventually lead to significant hypo-osmotic stress, increasing the energetic demands for ion uptake and water excretion, which would in turn impair growth. Therefore, further research is warranted to pinpoint the precise optimal salinity for L. guttatus and to determine its lower physiological tolerance limit. Such studies would be invaluable for optimizing culture protocols for this species in low-salinity environments.
These results align with previous studies in teleost fish, which suggest that these organisms have lower energy requirements for osmoregulation when grown at salinities close to or equal to the isosmotic point of plasma, which in euryhaline fish is within a relatively narrow range of salinities (10–14‰) [8,51,52,53].
In addition to glucose metabolism, the stability of the hepatosomatic (HSI) and viscerosomatic (VSI) indices across treatments further reflects the species’ efficient energy management. Unlike in some stenohaline species where HSI often increases at suboptimal salinities [54,55], the stable HSI in L. guttatus suggests no undue metabolic stress, a finding consistent with studies on other euryhaline species like juvenile cobia (Rachycentron canadum), which also showed no significant differences in HSI when reared at different salinities [56]. Similarly, while VSI increased over time with somatic growth, it showed no significant differences among salinities. Notably, the numerically lower VSI at 8‰ and 16‰ suggests less accumulation of visceral fat, which is often associated with a better metabolic condition and is consistent with the superior growth performance observed in these groups [57].
In relation to the physiological stress generated by exposure to extreme salinities in marine fish, it has been determined that high salinity levels can induce osmotic stress, negatively affecting appetite and feed conversion efficiency [58]. In this context, cortisol is the hormone that intervenes in the metabolic and osmoregulatory processes [59]. Therefore, fluctuations in its plasma concentration are an indicator of the degree of stress in marine fish. In this research, the fact that the concentration of cortisol did not present statistically significant differences between treatments and remained stable throughout the experimental phase with a clear tendency to decrease at the end of the period suggests that snappers were able to cope and regulate their physiological and endocrine response to environmental conditions and adapt to the different salinities without experiencing chronic or severe stress, a common condition in species with a good osmoregulatory capacity. In this sense, Ruiz-Jarabo et al. [60] indicate that, in order to acclimate to variations in salinity, fish go through a period of adaptation that modifies their osmoregulatory system, reallocates energy resources, and then achieves chronic regulation and homeostasis [11].
It is also important to address the marked differences observed between the initial measurements at day 0 and the final measurements at day 70, particularly for cortisol and chloride levels, even within the 32‰ control group. The elevated cortisol levels at day 0 are indicative of acute handling stress, a common response in fish subjected to selection, measurement, and transfer to a new experimental system [61]. The significant decrease in cortisol across all treatments by day 70 demonstrates that the fish successfully acclimated to the culture conditions and that the initial stress had dissipated, reaching a stable physiological baseline. Similarly, the shift in chloride concentrations between day 0 and day 70 in the 32‰ group suggests a homeostatic adjustment to the stable environment of the recirculating aquaculture system. Therefore, the values recorded at day 70 should be interpreted as the true, long-term physiological response to the different salinity treatments, whereas the day 0 values represent a transient state influenced by the initial experimental procedures.
The overall good condition, health, and absence of chronic stress in the fish is supported by multiple indicators. The assertion that lower salinities resulted in a more favorable energy balance is supported by the feed conversion ratio (FCR) trends. Although not statistically significant, FCR values were numerically lower in the 8‰ and 16‰ groups (Table 1), indicating a more efficient conversion of feed into biomass and suggesting that less net energy was expended on basal maintenance. Furthermore, the Fulton’s condition index (K) remained high and stable across all treatments, showing that osmotic stress did not compromise the overall condition of the fish. The K values obtained in this research (1.76–1.78) were higher than those previously reported for L. guttatus at various salinities [23]. regius) [43]. While direct comparisons of K between species should be interpreted with caution [62], these results collectively suggest that the fish were able to efficiently control osmotic challenges and adapt successfully to all tested salinities.
The physiological adaptation of L. guttatus to different salinities is clearly reflected in its plasma ion exchange and osmolality. As expected for a euryhaline species [63,64], the transfer to different salinities induced changes in plasma parameters. At day 70, a notable finding emerged: fish in lower salinities (8‰ and 16‰) exhibited significantly higher plasma concentrations of Na+, K+, and Cl, yet lower total plasma osmolality compared to fish in higher salinities. This apparent paradox can be explained by the interplay between inorganic ions and organic osmolytes [13,65]. Plasma osmolality in marine teleosts is also maintained by neutral organic osmolytes (e.g., free amino acids, urea), which are typically reduced in hypoosmotic conditions to prevent cell swelling [66]. unmeasured compounds. In parallel, the elevated inorganic ion levels demonstrate a successful compensatory response. To maintain homeostasis in a hypoosmotic environment, L. guttatus actively absorbed more Na+, K+, and Cl through the gills and retained them via the kidneys [67,68,69,70]. This strong compensatory uptake, also seen in other euryhaline species like the shi drum (Umbrina cirrosa) [10], confirms that by day 70 the fish had successfully adjusted to the low-salinity conditions, supporting their robust osmoregulatory capacity [71].
Takei and Hwang [63] indicated that fish could maintain the homeostasis of body fluids in response to osmotic stress. In this case, the spotted rose snapper has proven to be no exception. In addition, Maetz [64] explained that, in the euryhaline fish, the transfer between waters of different salinity levels induces changes in plasma osmotic parameters and the consequent activation of the osmoregulatory system to try to recover the original values. Therefore, from an osmoregulatory perspective, the results in this study indicate that the spotted rose snapper (L. guttatus) is a euryhaline osmoregulatory fish.
Although this study did not monitor the activity of ion transporters in gill cells, such as Na+/K+-ATPase that pumps sodium into the blood to prevent excessive loss, or Na+/Cl cotransporters, which recover sodium and chlorine from the aquatic environment, histological analyses in gills show that, as a physiological response, the fish organism attempted to compensate for the passive loss of sodium, potassium, and chloride with greater reabsorption and retention. This is reflected in the morphological changes found in this tissue.
The histological alterations observed in the gills provide compelling evidence of physiological adaptation to varying salinity conditions in this euryhaline snapper species. The increased abundance and prominence of ionocytes in fish reared at low salinities (8‰ and 16‰) are consistent with their essential role in ion uptake under hypoosmotic environments, where active transport is required to maintain ionic balance [72,73]. The triangular shape and paler staining of these ionocytes at low salinities are characteristic of cells specialized for ion absorption, in contrast to the rounder, darker-staining ionocytes seen at higher salinities, which are typically involved in ion secretion [74]. Furthermore, the broader distribution of ionocytes along the lamellae in the low-salinity treatments suggests an upregulation of osmoregulatory capacity, a well-documented response in euryhaline teleosts acclimated to dilute environments [58]. In contrast, the increased number and size of goblet cells observed at higher salinities (24‰ and 32‰) likely reflect elevated mucus production as a defensive response to osmotic stress and potential epithelial damage. Mucus not only serves as a physical barrier against environmental irritants and pathogens, but also contributes to the regulation of ion permeability across the gill epithelium [75,76]. Together, these patterns highlight the snapper’s robust osmoregulatory plasticity and suggest that low-salinity rearing conditions are physiologically tolerable and do not compromise gill function or health [66,77].
Gill histopathology further supports the suitability of low-salinity aquaculture not only in physiological terms but also in reducing parasite-associated damage. While minor, non-degenerative lesions such as focal edema and occasional lamellar aneurysms were observed in fish at 8‰ and 16‰, more severe alterations—including hyperplasia and lamellar fusion—were markedly more frequent and intense at higher salinities (24‰ and 32‰). These lesions coincided with the presence of monogenean parasites, which were detected only in fish exposed to salinities ≥16‰ and showed increased prevalence and intensity with rising salinity. Infected fish exhibited characteristic pathological changes such as necrosis, inflammation, hyperplasia, and lamellar thickening. Monogeneans are well-known ectoparasites of marine fish and are particularly problematic in snapper species such as Lutjanus campechanus and L. guttatus, where species like Neobenedenia melleni, Euryhaliotrema tubocirrus, E. perezponcei and Haliotrema guttati have been reported [25,78,79]. These parasites attach to the gills or skin and feed on epithelial tissues and mucus, triggering chronic lesions, respiratory impairment, secondary infections, and in severe cases, mortality [80,81]. The gill damages observed in the present study—including epithelial lifting, fusion, and inflammation—are consistent with those described in monogenean infections. Interestingly, no monogeneans were found in fish reared at 8‰, supporting prior evidence that many monogenean species are highly sensitive to hyposaline conditions. Lowering salinity has been shown to suppress monogenean reproduction, attachment, and survival [82,83], providing a natural and effective tool for parasite control. Thus, low-salinity rearing not only aligns with the snapper’s physiological tolerances but also reduces parasite risk and improves fish welfare by potentially decreasing the need for antiparasitic treatments.
Complementing the gill observations, the anterior intestine showed no histological alterations under any of the tested salinities, further indicating the species’ resilience to hyposaline environments. Across all treatments, the intestinal epithelium displayed intact morphology, normal enterocyte height, and abundant goblet cells. The submucosa remained free of edema, inflammation, or structural disruption, suggesting that digestive and osmoregulatory functions were not impaired. This is particularly important given the intestine’s role in water and ion absorption in teleosts [84,85]. Although hypoosmotic stress can sometimes lead to mucosal damage or altered mucus production [86] no such signs were evident, even at the lowest salinity (8‰). The stable number of goblet cells across treatments indicates consistent mucosal protection and homeostasis [87]. These findings align with previous studies showing that euryhaline fish can regulate intestinal ion and water transport effectively under salinity shifts [88]. In summary, the combination of preserved gill and intestinal integrity, reduced parasite burden, and maintained epithelial function under low-salinity conditions underscores the biological feasibility of snapper culture in hyposaline environments. These findings provide robust support for the development of low-salinity aquaculture systems as a sustainable and health-promoting strategy for this euryhaline species.
An important aspect to note is that, following the completion of the experimental phase of the study, two additional phases of validation for the results obtained in the first phase were developed (unpublished data). In the second phase, from day 71 to 156, 30 fish from each treatment were maintained in four 10,000 L tanks. With 100% survival in all tanks, it was determined that the values of weight and length gained, AGR, SGR, K, FCR, HSI, and VSI tended to equalize between the fish maintained at 8‰ and 16‰ salinities, although significant differences persisted at 24‰ and 32‰ salinities. In the third phase, 25 fish from the initial treatment at 8‰ salinity were maintained in a 10,000 L tank until they surpassed the commercial size (484.5 ± 81.5 g) after a 278-day culture, with 100% survival. With these additional phases of result validation, it was determined that the spotted rose snapper grows adequately without health problems at a low salinity (8‰), up to commercial size. In addition, blood electrolyte analyses were conducted at 278 days of culture. Electrolyte averages obtained then showed lower values than those obtained at day 70 (Na+ = 241.3 mmol L−1, K+ = 5.9 mmol L−1, and Cl = 247.3 mmol L−1). Values at day 278 shared greater similarity to those found at the beginning of the experiment, which indicates that, after an initial period of crisis (70 days), spotted rose snappers tend to achieve ionic homeostasis that allows them to survive and maintain adequate health conditions up to commercial size, and to be able to stabilize their ionic osmoregulation, similar to what was described by He et al. [13]. The former authors demonstrated that the acclimatization of the Chinese sturgeon (Acipenser sinensis) involved physiological periods of crisis and subsequent stabilization [13].

5. Conclusions

In conclusion, juvenile spotted rose snapper (L. guttatus) can be successfully reared in salinities ranging from 8‰ to 32‰, but optimal growth and health are achieved at lower salinities of 8–16‰. The superior performance at 8‰ is not simply a function of reduced osmoregulatory costs but is strongly linked to the complete absence of parasitic monogeneans at this salinity. The species demonstrated a robust capacity to manage the physiological demands of a hypoosmotic environment, maintaining homeostasis without signs of chronic stress. Therefore, low-salinity rearing (near 8‰) represents a highly promising strategy for the aquaculture of this species, as it simultaneously enhances growth performance and serves as an effective, non-chemical method for parasite control.

Author Contributions

Conceptualization, J.C.-G., R.J.-M., N.D., S.V.-C., Y.C.-Q. and E.G.; methodology J.C.-G., R.J.-M., N.D., A.R.-F., S.V.-C., Y.C.-Q. and E.G.; validation, J.C.-G., R.J.-M., N.D. and E.G.; formal analysis, J.C.-G., J.P.P.-M., T.C. and Y.C.-Q.; investigation, J.C.-G., E.C.-E., S.V.-C., J.S.-B., E.S.-A., T.C., C.V., M.S.-E., L.C.-R. and Y.C.-Q.; resources, J.C.-G., E.C.-E., S.V.-C. and E.G.; data curation, J.C.-G., J.P.P.-M., T.C. and Y.C.-Q.; writing—original draft preparation, J.C.-G.; writing—review and editing, J.C.-G., R.J.-M., N.D., A.R.-F., E.C.-E., S.V.-C., J.P.P.-M., J.S.-B., E.S.-A., T.C., C.V., M.S.-E., L.C.-R., Y.C.-Q. and E.G.; visualization, J.C.-G., J.P.P.-M. and T.C.; supervision, J.C.-G.; project administration, J.C.-G.; funding acquisition, J.C.-G. All authors have read and agreed to the published version of the manuscript.

Funding

Financial support of this work by the Vice-Rector for Research at the National University (UNA) of Costa Rica.

Institutional Review Board Statement

The study was approved by the National Commission for Biodiversity Management in Costa Rica (CONAGEBIO)(R-CM-UNA-033-2022-OT-CONAGEBIO; Approval Date: 7 August 2024).

Informed Consent Statement

Not applicable.

Data Availability Statement

The original contributions presented in this study are included in the article. Further inquiries can be directed to the corresponding author.

Acknowledgments

We want to thank the CYTED LARVAplus network “Strategies for the development and improvement of fish larvae production in Ibero-America” (117RT0521); the Institute of Agri-Food Research and Technology (IRTA), Tarragona, Spain; Universidad Católica del Norte, Chile; Vice-Rectorate for Research of Universidad Nacional; the School of Biological Sciences of the National University; and the Pacific Marine Park of Costa Rica; as well as CONAGEBIO for endorsing the research through resolution R-CM-UNA-033-2022-OT-CONAGEBIO. Funding entities were not involved in the study design, data collection, analysis, and interpretation of data; drafting of this article; or the decision to submit it for publication.

Conflicts of Interest

The authors declare no conflicts of interest.

References

  1. Oboh, A. Diversification of farmed fish species: A means to increase aquaculture production in Nigeria. Rev. Aquac. 2022, 14, 2089–2098. [Google Scholar] [CrossRef]
  2. Yue, G.H.; Tay, Y.X.; Wong, J.; Shen, Y.; Xia, J. Aquaculture species diversification in China. Aquac. Fish. 2023; early access. [Google Scholar] [CrossRef]
  3. Abou Anni, I.S.; Bianchini, A.; Barcarolli, I.F.; Junior, A.S.V.; Robaldo, R.B.; Tesser, M.B.; Sampaio, L.A. Salinity influence on growth, osmoregulation and energy turnover in juvenile pompano Trachinotus marginatus Cuvier 1832. Aquaculture 2016, 455, 63–72. [Google Scholar] [CrossRef]
  4. Wang, M.J.; Chu, T.Q.; Liu, F.; Zhan, W.; Lou, B.; Xu, W.T. Effects of salinity stress on antioxidant enzymes, non-specific immune enzymes and Na⁺/K⁺ ATPase activities of small yellow croaker (Larimichthys polyactis). Acta Oceanol. Sin. 2021, 43, 59–66. [Google Scholar]
  5. Zhang, C.X.; Zhou, L.; Ye, J.D.; Wang, L.; Huang, K.K.; Zhai, L.Q. Effects of acute salinity stress on the serum osmolality, serum ion concentrations, and ATPase activity in gill filaments of Japanese seabass (Lateolabrax japonicus) Fed with Diets Containing Different Magnesium Levels. J. Fish. China 2012, 36, 1425. [Google Scholar] [CrossRef]
  6. Chapman, F.A.; García, L.N.; Atencio, V.J.; Muñoz, R.J.; Silva, A.; Flores, H. Low-Salinity Acclimation of juvenile marine goliath grouper Epinephelus itajara. J. Appl. Aquac. 2014, 26, 179–186. [Google Scholar] [CrossRef]
  7. Wen, Z.Y.; Li, Y.; Bian, C.; Shi, Q.; Li, Y.Y. Characterization of two kcnk3 genes in rabbitfish (Siganus canaliculatus): Molecular cloning, distribution patterns and their potential roles in fatty acids metabolism and osmoregulation. Gen. Comp. Endocrinol. 2020, 296, 113546. [Google Scholar] [CrossRef]
  8. Blanco García, A.; Partridge, G.J.; Flik, G.; Roques, J.A.; Abbink, W. Ambient salinity and osmoregulation, energy metabolism and growth in juvenile yellowtail kingfish (Seriola lalandi Valenciennes 1833) in a recirculating aquaculture system. Aquac. Res. 2015, 46, 2789–2797. [Google Scholar] [CrossRef]
  9. Boeuf, G.; Payan, P. How should salinity influence fish growth? Comp. Biochem. Physiol. C Toxicol. Pharmacol. 2001, 130, 411–423. [Google Scholar] [CrossRef]
  10. Mylonas, C.C.; Pavlidis, M.; Papandroulakis, N.; Zaiss, M.M.; Tsafarakis, D.; Papadakis, I.E.; Varsamos, S. Growth performance and osmoregulation in the shi drum (Umbrina cirrosa) adapted to different environmental salinities. Aquaculture 2009, 287, 203–210. [Google Scholar] [CrossRef]
  11. Arjona, F.J.; Vargas-Chacoff, L.; Ruiz-Jarabo, I.; del Río, M.P.M.; Mancera, J.M. Osmoregulatory response of Senegalese sole (Solea senegalensis) to changes in environmental salinity. Comp. Biochem. Physiol. A 2007, 148, 413–421. [Google Scholar] [CrossRef]
  12. Ruiz-Jarabo, I.; Márquez, P.; Vargas-Chacoff, L.; Martos-Sitcha, J.A.; Cárdenas, S.; Mancera, J.M. Narrowing the range of environmental salinities where juvenile meagre (Argyrosomus regius) can be cultured based on an osmoregulatory pilot study. Fishes 2018, 3, 48. [Google Scholar] [CrossRef]
  13. He, X.; Zhuang, P.; Zhang, L.; Xie, C. Osmoregulation in juvenile Chinese sturgeon (Acipenser sinensis Gray) during brackish water adaptation. Fish Physiol. Biochem. 2009, 35, 223–230. [Google Scholar] [CrossRef] [PubMed]
  14. Suárez-Bautista, J.; Rodríguez-Forero, A. Ionregulation in juvenile swordspine snook (Centropomus ensiferus, Poey, 1860) in relation to environmental salinity. J. Appl. Ichthyol. 2015, 31, 900–904. [Google Scholar] [CrossRef]
  15. Watson, C.J.; Nordi, W.M.; Esbaugh, A.J. Osmoregulation and branchial plasticity after acute freshwater transfer in red drum, Sciaenops ocellatus. Comp. Biochem. Physiol. A Mol. Integr. Physiol. 2014, 178, 82–89. [Google Scholar] [CrossRef]
  16. Calleja, F.; Guzmán, J.C.; Chavarría, H.A. Marine aquaculture in the Pacific coast of Costa Rica: Identifying the optimum areas for a sustainable development. Ocean Coast. Manag. 2022, 219, 106033. [Google Scholar] [CrossRef]
  17. Santos, G.; Ortiz-Gándara, I.; Del Castillo, A.; Arruti, A.; Gómez, P.; Ibáñez, R.; Ortiz, I. Intensified fish farming. Performance of electrochemical remediation of marine RAS waters. Sci. Total Environ. 2022, 847, 157368. [Google Scholar] [CrossRef]
  18. Fischer, W.; Krupp, F.; Schneider, W.; Sommer, C.; Carpenter, K.; Niem, V. Guía FAO para la Identificación de Especies para los Fines de la Pesca, Pacífico Centro-Oriental; Volume III, Vertebrates-Part 2; FAO: Rome, Italy, 1995; Available online: https://www.fao.org/4/v6250s/v6250s00.htm (accessed on 14 March 2025).
  19. Chacón-Guzmán, J.; Carvajal-Oses, M.; Herrera-Ulloa, Á. Optimization of larval culture for the production of juvenile spotted snapper Lutjanus guttatus in Costa Rica. Uniciencia 2021, 35, 10–26. [Google Scholar] [CrossRef]
  20. Abdo-de la Parra, M.I.; Rodríguez-Ibarra, L.E.; Rodríguez-Montes de Oca, G.; Velasco-Blanco, G.; Ibarra-Casto, L. Estado actual del cultivo de larvas del pargo flamenco (Lutjanus guttatus). Lat. Am. J. Aquat. Res. 2015, 43, 415–423. [Google Scholar] [CrossRef]
  21. Ibarra-Castro, L.; Ochoa-Bojórquez, M.O.; Sánchez-Téllez, J.L.; Rojo-Cebreros, A.H.; Álvarez-Lajonchère, L. A new efficient method for the mass production of juvenile spotted rose snapper Lutjanus guttatus. Aquac. Rep. 2020, 18, 100550. [Google Scholar] [CrossRef]
  22. Correa-Herrera, T.; Jiménez-Segura, L.F. Reproductive biology of Lutjanus guttatus (Perciformes: Lutjanidae) in Utría National Park, Colombian Pacific. Rev. Biol. Trop. 2013, 61, 829–840. [Google Scholar] [CrossRef][Green Version]
  23. Alcalá-Carrillo, M.; Castillo-Vargasmachuca, S.G.; Ponce-Palafox, J.T. Efectos de la temperatura y salinidad sobre el crecimiento y supervivencia de juveniles de pargo Lutjanus guttatus. Lat. Am. J. Aquat. Res. 2016, 44, 159–164. [Google Scholar] [CrossRef]
  24. Castillo-Vargasmachuca, S.; Ponce-Palafox, J.; Arambul-Muñoz, E.; López-Gómez, C.; Arredondo-Figueroa, J.L.; Spanopoulos-Hernández, M. The combined effects of salinity and temperature on the proximate composition and energetic value of spotted rose snapper Lutjanus guttatus (Steindachner, 1869). Lat. Am. J. Aquat. Res. 2017, 45, 1054–1058. [Google Scholar] [CrossRef]
  25. Bullard, S.A.; Benz, G.W.; Overstreet, R.M.; Williams, E.H.; Hemdal, J. Six new host records and an updated list of wild hosts for Neobenedenia melleni (MacCallum) (Monogenea: Capsalidae). Comp. Parasitol. 2000, 67, 190–196. [Google Scholar]
  26. Hopkins, K.D. Reporting fish growth: C. J. World Aquac. Soc. 1992, 23, 173–179. [Google Scholar] [CrossRef]
  27. Ricker, W.E. Growth rates and models. In Fish Physiology; Hoar, W.S., Randall, D.J., Eds.; Academic Press: New York, NY, USA, 1979; Volume 8, pp. 677–743. [Google Scholar]
  28. Tacon, A.G.J. Standard Methods for the Nutrition and Feeding of Farmed Fish and Shrimp; FAO: Rome, Italy, 1990. [Google Scholar]
  29. Zar, J.H. Biostatistical Analysis; Pearson Education India: Delhi, India, 1999. [Google Scholar]
  30. Ricker, W.E. Linear regressions in fishery research. J. Fish. Res. Board Can. 1973, 30, 409–434. [Google Scholar] [CrossRef]
  31. Fulton, T.W. The rate of growth of fishes. Twenty-Second Annu. Rep. 1904, 22, 141–241. [Google Scholar]
  32. Jan, M.; Jan, N. Studies on the fecundity (F), gonadosomatic index (GSI) and hepatosomatic index (HSI) of Salmo trutta fario (Brown trout) at Kokernag trout fish farm, Anantnag, Jammu and Kashmir. Int. J. Fish. Aquat. Stud. 2017, 5, 170–173. [Google Scholar]
  33. Bell, J.G.; Pratoomyot, J.; Strachan, F.; Henderson, R.J.; Fontanillas, R.; Hebard, A.; Tocher, D.R. Growth, flesh adiposity and fatty acid composition of Atlantic salmon (Salmo salar) families with contrasting flesh adiposity: Effects of replacement of dietary fish oil with vegetable oils. Aquaculture 2010, 306, 225–232. [Google Scholar] [CrossRef]
  34. Tietz, N.W. Clinical Guide to Laboratory Tests, 3rd ed.; W.B. Saunders Company: Philadelphia, PA, USA, 1995. [Google Scholar]
  35. Skeggs, L.T.; Hochstrasser, H. Colorimetric determination of chloride with mercuric thiocyanate. Clin. Chem. 1964, 10, 918–926. [Google Scholar] [CrossRef]
  36. Higgs, P.; Costa, M.; Freke, A.; Papasouliotis, K. Measurement of thyroxine and cortisol in canine and feline blood samples using two immunoassay analysers. J. Small Anim. Pract. 2014, 55, 153–159. [Google Scholar] [CrossRef]
  37. Herra-Vargas, S.; Brenes-Mora, E.; Baldi, M.; Bouza-Mora, L.; Huertas-Segura, R.M.; Castro-Ramírez, L.; Suárez-Esquivel, M. Parámetros sanguíneos y perfil de hormonas reproductivas de hembras de Choloepus hoffmanni en cautiverio. Rev. Biol. Trop. 2018, 66, 280–292. [Google Scholar] [CrossRef]
  38. Wutich, A.; Rosinger, A.Y.; Stoler, J.; Jepson, W.; Brewis, A. Measuring human water needs. Am. J. Hum. Biol. 2020, 32, e23350. [Google Scholar] [CrossRef] [PubMed]
  39. Ng, K.M.; Pannu, S.; Liu, S.; Burckhardt, J.C.; Hughes, T.; Van Treuren, W.; Tropini, C. Single-strain behavior predicts responses to environmental pH and osmolality in the gut microbiota. MBio 2023, 14, e00753-23. [Google Scholar] [CrossRef] [PubMed]
  40. R Core Team. R: A Language and Environment for Statistical Computing; R Foundation for Statistical Computing: Vienna, Austria, 2022; Available online: https://www.R-project.org (accessed on 12 July 2024).
  41. Glover, D.C.; DeVries, D.R.; Wright, R.A. Effects of temperature, salinity and body size on routine metabolism of coastal largemouth bass Micropterus salmoides. J. Fish Biol. 2012, 81, 1463–1478. [Google Scholar] [CrossRef] [PubMed]
  42. Weirich, C.R.; Wills, P.S.; Baptiste, R.M.; Woodward, P.N.; Riche, M.A. Production characteristics and body composition of Florida pompano reared to market size at two different densities in low-salinity recirculating aquaculture systems. N. Am. J. Aquacult. 2009, 71, 165–173. [Google Scholar] [CrossRef]
  43. Abdel-Rahim, M.M.; Lotfy, A.M.; Toutou, M.M.; Aly, H.A.; Sallam, G.R.; Abdelaty, B.S.; Helal, A.M. Effects of salinity level on the survival, growth, feed utilization, carcass composition, haematological and serum biochemical changes of juvenile meagre (Argyrosomus regius) (Asso, 1801) grown in ground saltwater. Aquac. Res. 2020, 51, 1038–1050. [Google Scholar] [CrossRef]
  44. Gil, E.A.B.; Sinisterra, J.A.A. Crecimiento en jaulas del pargo lunarejo Lutjanus guttatus (Steindachner, 1869) con dos tipos de dieta en Bahía Málaga, municipio de Buenaventura, Colombia. Entramado 2010, 6, 12–23. [Google Scholar]
  45. Castillo-Vargasmachuca, S.; Ponce-Palafox, J.T.; Ortíz, E.C.; Arredondo-Figueroa, J.L. Effect of the initial stocking body weight on growth of spotted rose snapper Lutjanus guttatus (Steindachner, 1869) in marine floating cages. Rev. Biol. Mar. Oceanogr. 2007, 42, 261–267. [Google Scholar] [CrossRef]
  46. Wootton, R.J. Ecology of Teleost Fishes; Fish and Fisheries Series 1; Chapman and Hall: London, UK, 1990. Available online: https://trove.nla.gov.au/work/16614123 (accessed on 8 January 2025).
  47. Furspan, P.; Prange, H.D.; Greenwald, L. Energetics and osmoregulation in the catfish Ictalurus nebulosus and I. punctatus. Comp. Biochem. Physiol. A 1984, 77, 773–778. [Google Scholar] [CrossRef]
  48. Morgan, J.D.; Iwama, G.K. Energy cost of NaCl transport in isolated gills of cutthroat trout. Am. J. Physiol. Regul. Integr. Comp. Physiol. 1999, 277, R631–R639. [Google Scholar] [CrossRef][Green Version]
  49. Galkanda-Arachchige, H.S.C.; Davis, R.P.; Nazeer, S.; Ibarra-Castro, L.; Davis, D.A. Effect of salinity on growth, survival, and serum osmolality of red snapper, Lutjanus campechanus. Fish Physiol. Biochem. 2021, 47, 1687–1696. [Google Scholar] [CrossRef]
  50. Marcogliese, D.J. The impact of climate change on the parasites and infectious diseases of aquatic animals. Rev. Sci. Tech. 2008, 27, 467–484. [Google Scholar] [CrossRef]
  51. Altinok, I.; Grizzle, J.M. Effects of salinity on Yersinia ruckeri infection of rainbow trout and brown trout. J. Aquat. Anim. Health 2001, 13, 334–339. [Google Scholar] [CrossRef]
  52. Ziegeweid, J.R.; Black, M.C. Hematocrit and plasma osmolality values of young-of-year shortnose sturgeon following acute exposures to combinations of salinity and temperature. Fish Physiol. Biochem. 2010, 36, 963–968. [Google Scholar] [CrossRef] [PubMed]
  53. Lisboa, V.; Barcarolli, I.F.; Sampaio, L.A.; Bianchini, A. Effect of salinity on survival, growth and biochemical parameters in juvenile Lebranch mullet Mugil liza (Perciformes: Mugilidae). Neotrop. Ichthyol. 2015, 13, 447–452. [Google Scholar] [CrossRef]
  54. Liu, B.; Guo, H.Y.; Zhu, K.C.; Guo, L.; Liu, B.S.; Zhang, N.; Zhang, D.C. Growth, physiological, and molecular responses of golden pompano Trachinotus ovatus (Linnaeus, 1758) reared at different salinities. Fish Physiol. Biochem. 2019, 45, 1879–1893. [Google Scholar] [CrossRef]
  55. Mozanzadeh, M.T.; Safari, O.; Oosooli, R.; Mehrjooyan, S.; Najafabadi, M.Z.; Hoseini, S.J.; Monem, J. The effect of salinity on growth performance, digestive and antioxidant enzymes, humoral immunity and stress indices in two euryhaline fish species: Yellowfin seabream (Acanthopagrus latus) and Asian seabass (Lates calcarifer). Aquaculture 2021, 534, 736329. [Google Scholar] [CrossRef]
  56. Resley, M.J.; Webb, K.A., Jr.; Holt, G.J. Growth and survival of juvenile cobia, Rachycentron canadum, at different salinities in a recirculating aquaculture system. Aquaculture 2006, 253, 398–407. [Google Scholar] [CrossRef]
  57. Katsika, L.; Huesca Flores, M.; Kotzamanis, Y.; Estevez, A.; Chatzifotis, S. Understanding the interaction effects between dietary lipid content and rearing temperature on growth performance, feed utilization, and fat deposition of sea bass (Dicentrarchus labrax). Animals 2021, 1, 392. [Google Scholar] [CrossRef]
  58. Varsamos, S.; Nebel, C.; Charmantier, G. Ontogeny of osmoregulation in postembryonic fish: A review. Comp. Biochem. Physiol. A Mol. Integr. Physiol. 2005, 141, 401–429. [Google Scholar] [CrossRef]
  59. McCormick, S.D. Endocrine control of osmoregulation in teleost fish. Am. Zool. 2001, 41, 781–794. [Google Scholar] [CrossRef]
  60. Ruiz-Jarabo, I.; Tinoco, A.B.; Vargas-Chacoff, L.; Martos-Sitcha, J.A.; Rodríguez-Rúa, A.; Cárdenas, S.; Mancera, J.M. Environmental salinity affects growth and metabolism in fingerling meagre (Argyrosomus regius). Fishes 2019, 4, 6. [Google Scholar] [CrossRef]
  61. Barton, B.A. Stress in fishes: A diversity of responses with particular reference to changes in circulating corticosteroids. Integr. Comp. Biol. 2002, 42, 517–525. [Google Scholar] [CrossRef] [PubMed]
  62. Nash, R.D.; Valencia, A.H.; Geffen, A.J. The origin of Fulton’s condition factor—Setting the record straight. Fisheries 2006, 31, 236–238. [Google Scholar]
  63. Takei, Y.; Hwang, P.P. Homeostatic responses to osmotic stress. In Fish Physiology; Academic Press: San Diego, CA, USA, 2016; Volume 35, pp. 207–249. [Google Scholar] [CrossRef]
  64. Maetz, J. Aspects of adaptation to hypo-osmotic and hyperosmotic environments. In Biochemical and Biophysical Perspectives in Marine Biology; Malins, D.C., Sargent, J.R., Eds.; Academic Press: London, UK, 1974; pp. 1–167. [Google Scholar]
  65. Evans, D.H.; Claiborne, J.B. Osmotic and ionic regulation in fishes. In Osmotic and Ionic Regulation; CRC Press: Boca Raton, FL, USA, 2008; pp. 295–366. [Google Scholar]
  66. Kültz, D. Physiological mechanisms used by fish to cope with salinity stress. J. Exp. Biol. 2015, 218, 1907–1914. [Google Scholar] [CrossRef]
  67. Sangiao-Alvarellos, S.; Laiz-Carrion, R.; Guzmán, J.M.; Martín del Río, M.P.; Míguez, J.M.; Mancera, J.M.; Soengas, J.L. Acclimation of S. aurata to various salinities alters energy metabolism of osmoregulatory and nonosmoregulatory organs. Am. J. Physiol.-Regul. Integr. Comp. Physiol. 2003, 285, R897–R907. [Google Scholar] [CrossRef]
  68. Tang, C.H.; Lai, D.Y.; Lee, T.H. Effects of salinity acclimation on Na⁺/K⁺–ATPase responses and FXYD11 expression in the gills and kidneys of the Japanese eel (Anguilla japonica). Comp. Biochem. Physiol. A Mol. Integr. Physiol. 2012, 163, 302–310. [Google Scholar] [CrossRef]
  69. Marshall, W.S. Osmoregulation in estuarine and intertidal fishes. In Fish Physiology; Academic Press: London, UK, 2012; Volume 32, pp. 395–434. [Google Scholar] [CrossRef]
  70. Takvam, M.; Wood, C.M.; Kryvi, H.; Nilsen, T.O. Ion transporters and osmoregulation in the kidney of teleost fishes as a function of salinity. Front. Physiol. 2021, 12, 664588. [Google Scholar] [CrossRef]
  71. Takei, Y.; Balment, R.J. The neuroendocrine regulation of fluid intake and fluid balance. In Fish Physiology; Academic Press: London, UK, 2009; Volume 28, pp. 365–419. [Google Scholar] [CrossRef]
  72. Evans, D.H.; Piermarini, P.M.; Choe, K.P. The multifunctional fish gill: Dominant site of gas exchange, osmoregulation, acid-base regulation, and excretion of nitrogenous waste. Physiol Rev. 2005, 85, 97–177. [Google Scholar] [CrossRef]
  73. Hiroi, J.; McCormick, S.D. Variation in salinity tolerance, gill Na+/K+-ATPase, Na+/K+/2Cl cotransporter and mitochondria-rich cell distribution in three salmonids Salvelinus namaycush, Salvelinus fontinalis and Salmo salar. J. Exp. Biol. 2007, 210, 1015–1024. [Google Scholar] [CrossRef]
  74. Marshall, W.S. Na+, Cl, Ca2+ and Zn2+ transport by fish gills: Retrospective review and prospective synthesis. J. Exp. Zool. 2002, 293, 264–283. [Google Scholar] [CrossRef]
  75. Shephard, K.L. Functions for fish mucus. Rev. Fish Biol. Fisher. 1994, 4, 401–429. [Google Scholar] [CrossRef]
  76. Roberts, S.; Powell, M.D. Comparative ionic flux and gill mucous cell histochemistry: Effects of salinity and disease status in Atlantic salmon (Salmo salar L.). Comp. Biochem. Physiol. A Mol. Integr. Physiol. 2003, 134, 525–537. [Google Scholar] [CrossRef] [PubMed]
  77. Li, X.; Shen, Y.; Bao, Y.; Wu, Z.; Yang, B.; Jiao, L.; Zhang, C.; Tocher, D.R.; Zhou, Q.; Jin, M. Physiological responses and adaptive strategies to acute low-salinity environmental stress of the euryhaline marine fish black seabream (Acanthopagrus schlegelii). Aquat. Toxicol. 2022, 554, 738117. [Google Scholar] [CrossRef]
  78. García-Vargas, F.; Fajer-Ávila, E.J.; Lamothe-Argumedo, M.R. Two new species of Dactylogyridae (Monogenoidea) on rose spotted snapper, Lutjanus guttatus (Osteichthyes: Lutjanidae), from the coasts of Nayarit and Sinaloa, Mexico. Zootaxa 2008, 1729, 61–68. [Google Scholar] [CrossRef]
  79. Montoya-Mendoza, J.; Jiménez-Badillo, L.; Salgado-Maldonado, G.; Mendoza-Franco, E.F. Helminth Parasites of the Red Snapper, Lutjanus campechanus (Perciformes: Lutjanidae) from the Reef Santiaguillo, Veracruz, Mexico. J. Parasitol. 2014, 100, 868–872. [Google Scholar] [CrossRef]
  80. Buchmann, K.; Bresciani, J. Parasitic infections in pond-reared rainbow trout (Oncorhynchus mykiss) in Denmark. Dis. Aquat. Organ. 1997, 28, 125–138. [Google Scholar] [CrossRef]
  81. Chong, R. Monogenean Infections. In Aquaculture Pathophysiology; Kibenge, F., Baldisserotto, B., Chong, R., Eds.; Academic Press: Cambridge, MA, USA, 2022; pp. 517–526. [Google Scholar]
  82. Ogawa, K.; Yokoyama, H. Parasitic diseases of cultured marine fish in Japan. Fish Pathol. 1998, 33, 303–309. [Google Scholar] [CrossRef]
  83. Grano-Maldonado, M.I.; Aguirre-Villaseñor, H.; Betancourt-Lozano, M.; Fajer-Avila, E.J. In vitro effect of low salinity on egg hatching and larval survival of Heterobothrium ecuadori (Monogenea) infecting bullseye puffer fish Sphoeroides annulatus. Aquac. Res. 2015, 46, 1522–1526. [Google Scholar] [CrossRef]
  84. Grosell, M.; Wood, C.M.; Wilson, R.W.; Bury, N.R.; Hogstrand, C.; Rankin, J.C.; Jensen, F.B. Bicarbonate secretion plays a role in chloride and water absorption of the European flounder intestine. Am. J. Physiol. Regul. Integr. Comp. Physiol. 2005, 288, R936–R946. [Google Scholar] [CrossRef]
  85. Wilson, R.W.; Grosell, M. Intestinal bicarbonate secretion in marine teleost fish—Source of bicarbonate, pH sensitivity, and consequences for whole animal acid–base and calcium homeostasis. Biochim. Biophys. Acta BBA-Biomembr. 2003, 1618, 163–174. [Google Scholar] [CrossRef]
  86. Lin, G.; Li, S.; Huang, J.; Gao, D.; Lu, J. Hypoosmotic stress induced functional alternations of intestinal barrierintegrity, inflammatory reactions, and neurotransmission along gut-brain axisin the yellowfin seabream (Acanthopagrus latus). Fish Physiol. Biochem. 2021, 47, 1725–1738. [Google Scholar] [CrossRef]
  87. Huo, X.; Zhang, Q.; Chang, J.; Yang, G.; He, S.; Yang, C.; Liang, X.; Zhang, Y.; Su, J. Nanopeptide C-I20 as a novel feed additive effectively alleviates detrimental impacts of soybean meal on mandarin fish by improving the intestinal mucosal barrier. Front. Immunol. 2023, 14, 1197767. [Google Scholar] [CrossRef]
  88. Brijs, J.; Hennig, G.W.; Gräns, A.; Dekens, E.; Axelsson, M.; Olsson, C. Exposure to seawater increases intestinal motility in euryhaline rainbow trout (Oncorhynchus mykiss). J. Exp. Biol. 2017, 220, 2397–2408. [Google Scholar] [CrossRef]
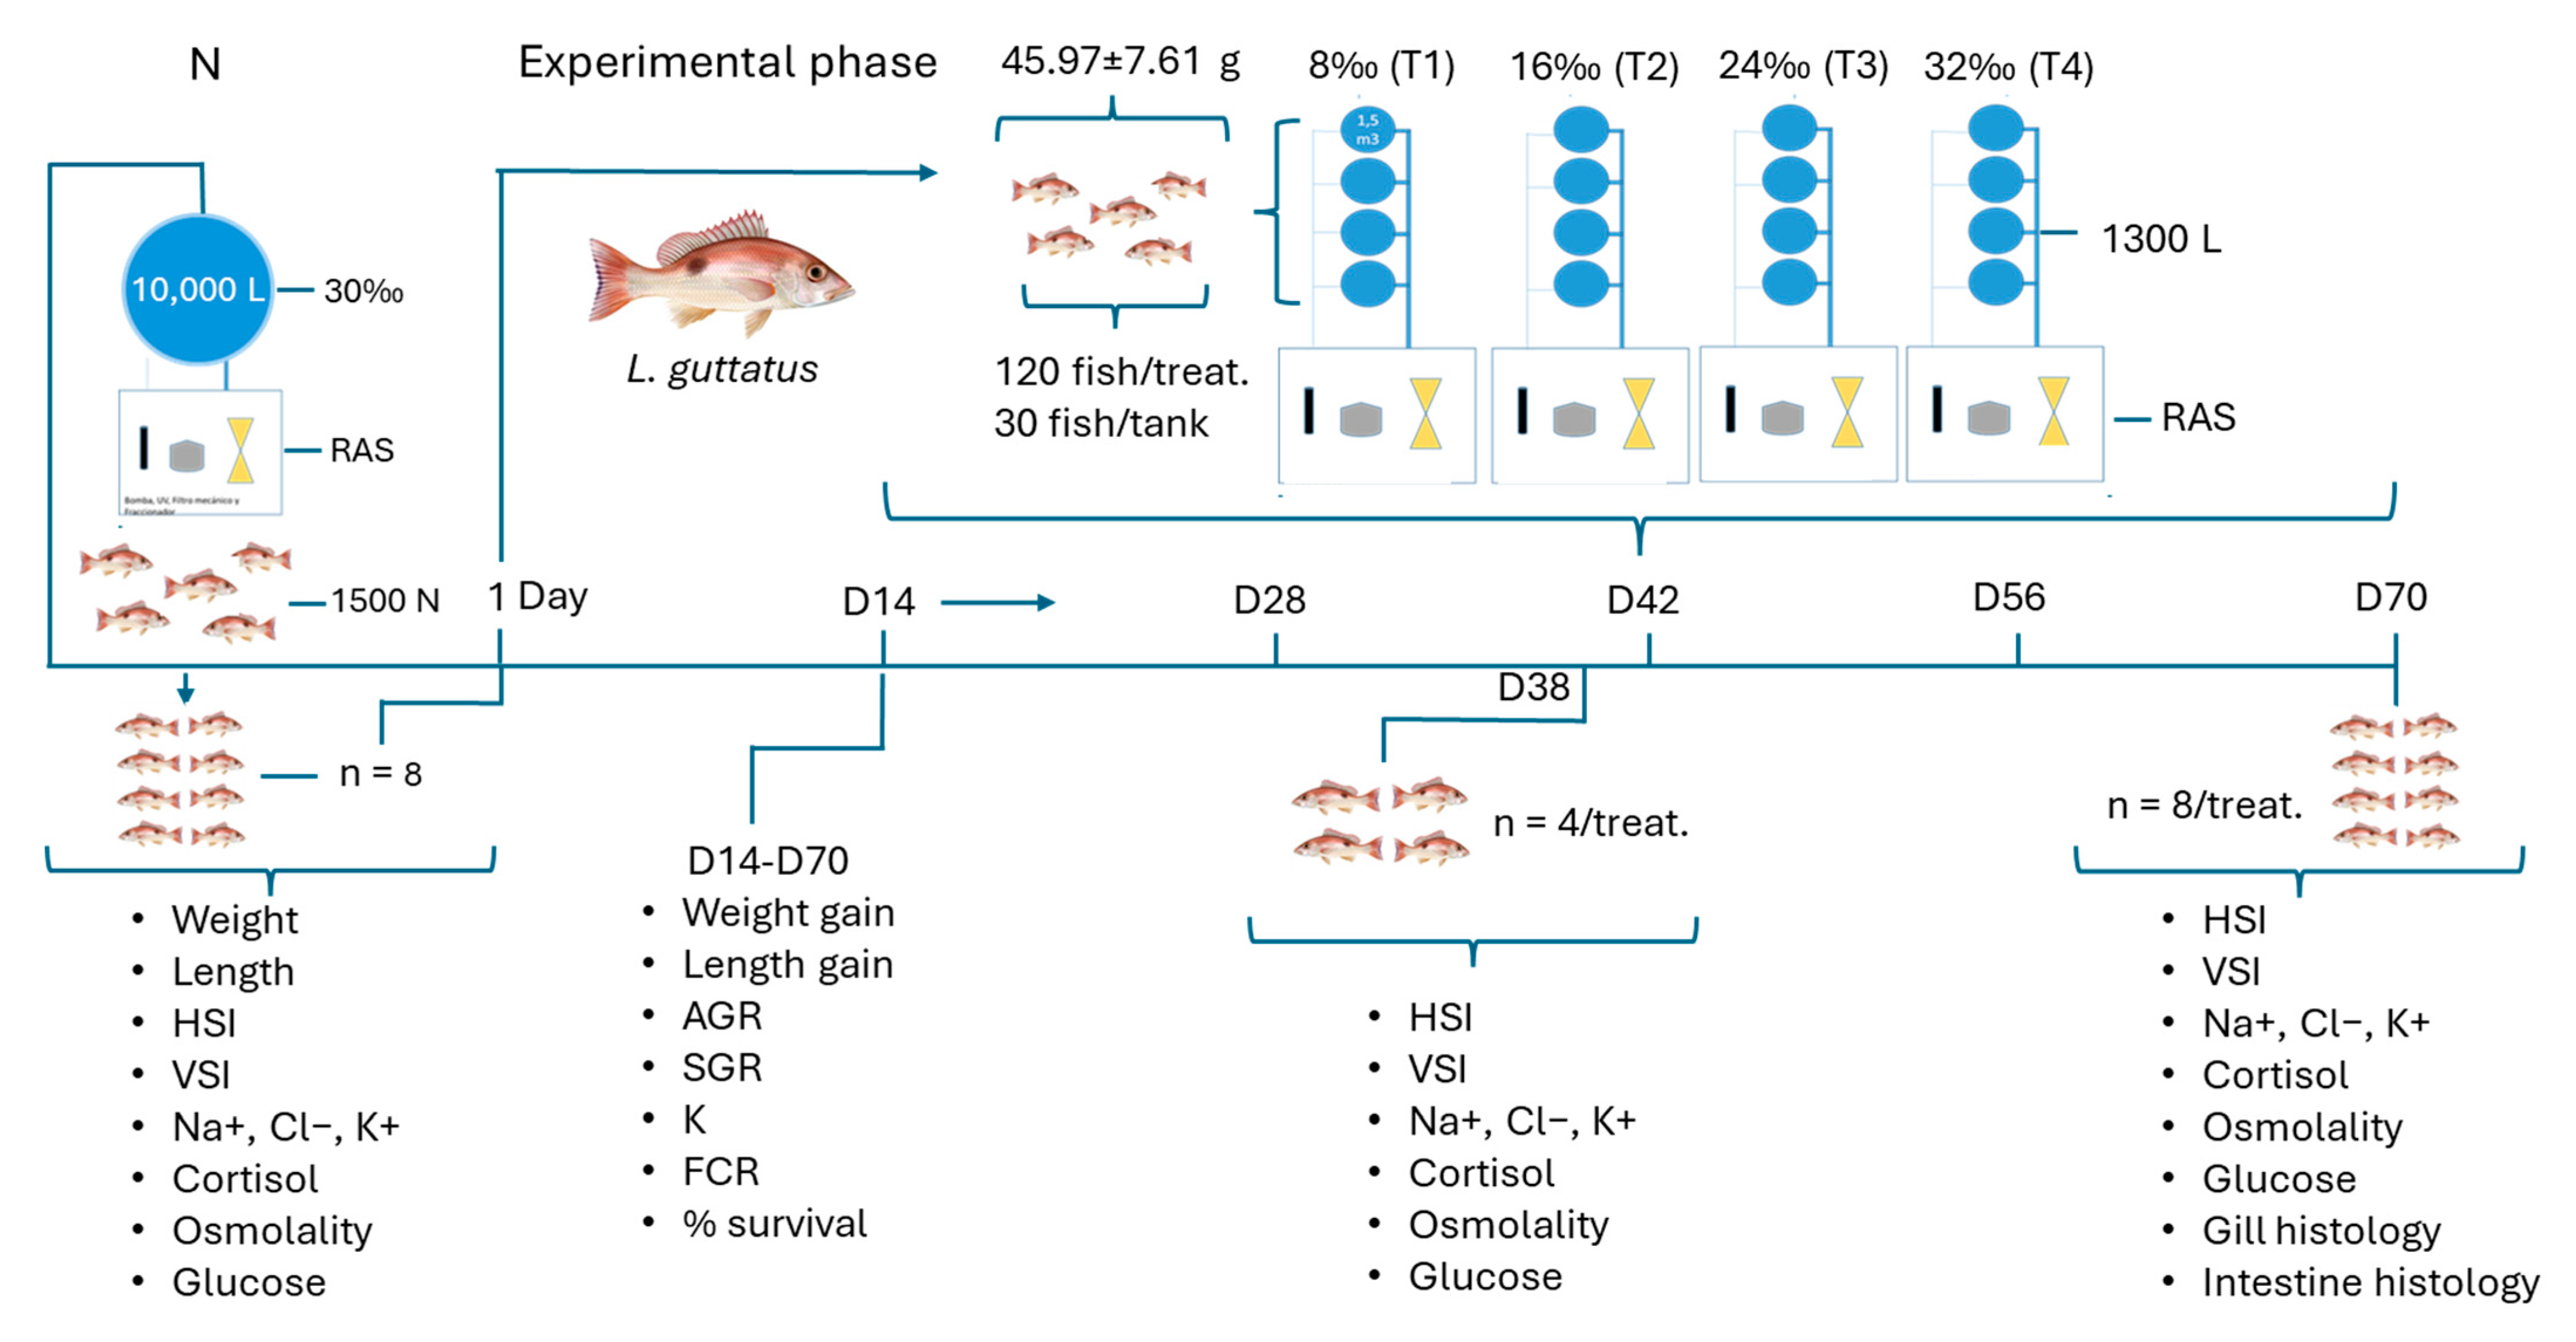
Figure 1. Schematic of the experimental design to determine the physiological response of spotted rose snapper (L. guttatus) exposed to different rearing salinities. Sampling measurements at 14 days (D14) were repeated in all subsequent samplings.
Fishes 10 00472 g001
Figure 2. Weight (A) and length (B) gain of spotted rose snapper (L. guttatus) over time in different salinity concentrations. A two-way ANOVA (salinity and time) was used to determine the statistical significance of the factors. Asterisks highlight statistically significant differences in salinity concentrations between samples: *: p < 0.05, **: p < 0.01, and ***: p < 0.001. Bar graphs highlight mean comparisons between salinity concentrations at days 56 and 70. The same letters indicate that there are no statistically significant differences between salinity concentrations (Tukey’s HSD test, p > 0.05). Mean ± standard error of the mean.
Fishes 10 00472 g002
Figure 3. Growth parameters of spotted rose snapper (L. guttatus) over time for different salinity concentrations: (A) Feed conversion rate; (B) Absolute growth rate; (C) Specific growth rate; and (D) Condition index. A two-way ANOVA (salinity and time) was used to determine the statistical significance of the factors. Asterisks highlight the statistically significant differences between the salinity concentrations in each sample: **: p < 0.01 and ***: p < 0.001. The same letters indicate that there are no statistically significant differences between salinity concentrations (Tukey’s HSD test, p > 0.05). Mean + standard error of the mean.
Fishes 10 00472 g003
Figure 4. Blood osmoregulation parameters and somatic indexes of spotted rose snapper (L. guttatus) over time for different salinity concentrations. Panels correspond to: (A) Sodium; (B) Potassium; (C) Chloride; (D) Osmolality; (E) Cortisol; (F) Glucose; (G) Hepatosomatic index; and (H) Visceral fat index. A two-way ANOVA was used to determine the statistical significance of the factors. Factors: Time (blood osmoregulation parameters: 38 and 70 days) and salinity concentration (8‰, 16‰, 24‰, and 32‰). The same letters indicate that there were no statistically significant differences amongst fish reared in different salinity concentrations (Tukey HSD, p > 0.05; n.s.: not significant) or at different sample times. Mean + standard error.
Fishes 10 00472 g004
Figure 5. Histological sections of the gills of spotted rose snapper (L. guttatus) exposed to salinities of 8‰, 16‰, 24‰, and 32‰. (A) Gill of a fish exposed to 8‰ showing abundant large ionocytes (arrows) with granular cytoplasm and a pale appearance. (B) Gill of a fish exposed to 16‰, where the ionocytes (arrows) are also clearly visible. (C) Gill of a fish exposed to 24‰ showing abundant large goblet cells (arrowheads) and a few rounded ionocytes (arrow) with intense pink staining. (D) Gill of a fish exposed to 32‰. Note that the ionocytes (arrows) are barely visible, while the goblet cells (arrowheads) are abundant. H&E Staining.
Fishes 10 00472 g005
Figure 6. Histological sections of the gills of spotted rose snapper (L. guttatus) exposed to salinities of 8‰, 16‰, 24‰, and 32‰. (A) Gill of a fish exposed to 8‰ salinity showing ionocytes on both sides of the first third of the lamella (arrows) and focal edemas at the basal and lateral parts of the lamellae (arrowheads). (B) Gill of a fish exposed to 8‰ salinity exhibiting aneurysms (arrowhead). (C) Monogenean parasite in the gill of a fish exposed to 16‰ salinity. Note the inflammatory reaction (*) and lamellar fusion around the monogenean hooks (arrowheads). (D) Gill of a fish exposed to 32‰ salinity showing areas of hyperplasia (arrowhead) and marked thickening of the filaments (arrows). H&E Staining.
Fishes 10 00472 g006
Figure 7. Histological sections of the anterior intestine of spotted rose snapper (L. guttatus) exposed to salinities of 8‰, 16‰, 24‰, and 32‰. (A) Intestine of a fish exposed to 8‰. (B) Intestine of a fish exposed to 16‰. (C) Intestine of a fish exposed to 24‰. (D) Intestine of a fish exposed to 32‰. Outer muscle layer (OML); inner muscle layer (IML); mucosal fold (Mf); serosa (arrowhead); goblet cells (arrow); enterocyte height (double arrow). H&E Staining.
Fishes 10 00472 g007
Figure 8. Box-plot graph of fold height (A), enterocyte height (B), and goblet cells number (C) in the anterior intestine of spotted rose snapper (L. guttatus) exposed to salinities of 8‰, 16‰, 24‰, and 32‰. The same letters indicate that there are no statistically significant differences (p > 0.05). Mean line within the boxplot indicates the average value of the series; * = outlier points of the series.
Fishes 10 00472 g008
Table 1. Biological indices of spotted rose snapper (L. guttatus) in tanks with different salinity concentrations (8‰, 16‰, 24‰, and 32‰) during the first 70 days of research. (AGR, Absolute Growth Rate; SGR, Specific Growth Rate; FCR, Feed Conversion Ratio; HSI, Hepatosomatic Index; VSI, Viscerosomatic Index; K, Fulton’s Condition Factor).
Salinity Treatments (‰)
8162432p Model
Initial weight (g)45.9 ± 0.745.7 ± 0.746.2 ± 0.746.1 ± 0.7n.s.
Final weight (g)126.8 a ± 2.6123.4 ab ± 2.4116.0 b ± 2.3116.0 b ± 2.3**
Initial total length (mm)140.5 ± 0.7139.0 ± 0.7140.0 ± 0.7140.4 ± 0.8n.s.
Final total length (mm)192.4 a ± 1.2191.3 ab ± 1.2187.6 b ± 1.2187.7 b ± 1.2**
Weight gain (%)176.2 a ± 0.0170.4 ab ± 0.0151.1 b ± 0.1151.6 b ± 0.0*
AGR (g day−1)1.2 ± 0.01.1 ± 0.01.0 ± 0.61.0 ± 0.0n.s.
SGR (% BW day−1)1.5 ± 0.01.4 ± 0.01.3 ± 0.11.3 ± 0.0n.s.
Survival (%)100 ± 0.0100 ± 0.0100 ± 0.0100 ± 0.0n.s.
FCR1.9 ± 0.02.00 ± 0.02.1 ± 0.12.1± 0.1n.s.
HSI1.7 ± 0.21.5 ± 0.11.8 ± 0.11.5 ± 0.2n.s.
VSI4.9 ± 0.64.8 ± 0.36.9 ± 0.65.6 ± 0.6n.s.
K1.8 ± 0.01.8 ± 0.01.8 ± 0.01.8 ± 0.0n.s.
Values are means of 4 replicates ± standard error of the mean. Means within a row sharing a common superscript letter are not significantly different (Tukey’s HSD, p > 0.05). A one-way ANOVA was used to determine the statistical significance of the factors. p model: represents the statistical significance value for the overall effect of salinity treatments from the one-way ANOVA. Asterisks highlight statistically significant differences between treatments: *: p < 0.05 and **: p < 0.01. n.s.: not significant.
Table 2. Histological variables and pathologies measured in the gills of spotted rose snapper (L. guttatus) juveniles reared at different salinities for 70 days.
Salinity
Gill Variables8162432p Model
Ionocyte count123.3 ± 4.8 c122.4 ± 4.9 c82.6 ± 4.2 a90.4 ± 4.4 b***
Ionocyte Size8.0 ± 0.7 d7.4 ± 0.7 c4.9 ± 0.4 a5.2 ± 0.4 b***
Goblet Cell Count92.3 ± 12.3 b71.4 ± 12.5 a153.9 ± 7.9 c154.9 ± 7.9 c***
Goblet Cell Size5.6 ± 0.4 b5.4 ± 0.4 a9.0 ± 0.6 c9.0 ± 0.6 c***
Aneurysms (%)25.0 ab62.5 b62.5 b0 a*
Hyperplasia (%)0 a62.5 b100 b100 b***
Parasitized fish (%/No. Monogenean)0 a (0)37.5 ab (8)87.5 b (22)50 ab (18)**
Mean values ± standard deviation are presented. Different superscript letters within a row indicate statistically significant differences among salinity groups (Tukey HSD; p < 0.05). Ionocyte and goblet cell metrics are based on n = 120 data points per treatment. Histological alterations (Aneurysms, Hyperplasia, and Parasitized fish) were quantified on day 70 from n = 8 fish per treatment. Cell counts were performed within a standardized square area of 1000 µm × 1000 µm (1 mm2). The values for these alterations are presented as the prevalence (percentage of affected fish). The number in parentheses for “Parasitized fish” indicates the total count of monogeneans found across all infected fish within that treatment group. Statistical significance between treatments is denoted by asterisks derived from one-way ANOVA (for cell metrics) or a chi-square test (for pathologies): * p < 0.05, ** p < 0.01, *** p < 0.001.
Disclaimer/Publisher’s Note: The statements, opinions and data contained in all publications are solely those of the individual author(s) and contributor(s) and not of MDPI and/or the editor(s). MDPI and/or the editor(s) disclaim responsibility for any injury to people or property resulting from any ideas, methods, instructions or products referred to in the content.