Article

Fish Alone Are Not Enough: Zoobenthos Improves Water Quality Assessment in Impacted Rivers

by
Ionuț Stoica
1,
Karina P. Battes
2,3,*,
Anca-Mihaela Șuteu Ciorca
2,3 and
Mirela Cîmpean
2,3
1
Department of Biology, Faculty of Sciences, Vasile Alecsandri University, 600115 Bacău, Romania
2
Department of Taxonomy and Ecology, Faculty of Biology and Geology, Babeş-Bolyai University, 400006 Cluj-Napoca, Romania
3
Centre for Systems Biology, Biodiversity and Bioresources “3B”, Advanced Hydrobiology and Biomonitoring Laboratory (LabHAB), Faculty of Biology and Geology, Babeş-Bolyai University, 400006 Cluj-Napoca, Romania
*
Author to whom correspondence should be addressed.
Fishes 2025, 10(9), 467; https://doi.org/10.3390/fishes10090467
Submission received: 18 August 2025 / Revised: 14 September 2025 / Accepted: 18 September 2025 / Published: 19 September 2025
(This article belongs to the Special Issue Toxicology of Anthropogenic Pollutants on Fish)

Abstract

This study examines fish communities in the heavily impacted Bistrița River, located in the Eastern Carpathians of Romania, where diffuse pollution from mining, domestic wastewater, agricultural and forestry activities emerged as the most severe pressures. Fish sampling was conducted at twenty sites across two Natura 2000 protected areas. Results showed that species richness and diversity were higher downstream (Z1–Z5), indicating improved ecological conditions compared to the upstream section (B1–B15). The fish-based Index of Biological Integrity (IBI) suggested overall good biological integrity, with excellent conditions (class I) recorded in 70% of sites. Redundancy analysis (RDA) further revealed that elevation and conductivity significantly shaped community structure, while the site-specific impact score had only marginal effects. To assess water quality and biotic integrity based on different communities, as required by the Water Framework Directive (WFD), five sites were selected for parallel sampling of diatoms and benthic invertebrates. Among these, zoobenthos proved the most sensitive to water quality degradation, with biotic indices indicating classes I to III. These findings demonstrate that assessments based solely on fish may underestimate ecological impacts, underscoring the need for complementary approaches that account for multiple biotic communities when monitoring riverine ecosystem health.
Key Contribution: Water quality assessment in highly impacted rivers could be overly lenient if based solely on the fish community. The findings of the present study are relevant for future water quality monitoring efforts, given that certain anthropogenic pressures may have more pronounced effects on specific biotic communities.

Graphical Abstract

1. Introduction

Accurate assessment of water quality and river ecosystem integrity is essential, given the multiple challenges currently confronting freshwater systems, including pollution, habitat alteration, resource exploitation and longitudinal fragmentation—factors that rank among the most significant stressors affecting running waters [1,2,3]. Biological communities, like ichthyofaunal assemblages, are considered to be key elements in assessing ecosystem health [4]. However, relying solely on fish communities can lead to overly lenient evaluations of ecological integrity in some cases, so complementary information provided by other biotic assemblages is necessary to obtain a more accurate picture of water quality.
Biotic communities represent key elements in monitoring ecological status of aquatic ecosystems because they reflect its overall health, showing changes in species composition and diversity over time, which chemical analyses may not fully capture [5,6]. The Water Framework Directive (WFD) 2000/60/EC, the most significant regulation within the European Union water policy, places greater emphasis on biological elements over chemical measurements for evaluating water quality [7].
The WFD has established standardized methods for assessing the ecological status of water bodies across the 27 Member States, relying on biological indicators, with fish, zoobenthos, and phytobenthos being the most widely applied [8,9]. Monitored aquatic ecosystems are classified into five quality classes (High, Good, Moderate, Poor, and Bad) and, to harmonize the heterogeneous results derived from using different biotic communities, the “one-out, all-out” principle is employed [7,10].
Freshwater fish represent a diverse taxonomic group, characterized by heterogeneous functional traits in terms of diet, body size, mobility, and behavior, among others. Fish communities play a central role in aquatic ecosystems, regulating trophic networks, controlling nutrient cycling, and even acting as ecosystem engineers [11]. The central position occupied by fish is supported by studies showing that ecosystem functioning increases with the number of fish species present within the river catchment area [12].
Fish are widely recognized as effective bioindicators in riverine ecosystems for several reasons: (1) most species are relatively easy to identify in the field; (2) as consumers from various trophic levels, they reflect the trophic conditions of water bodies; (3) they have complex habitat requirements and respond to a wide range of abiotic factors; and (4) their relatively long life cycles make them suitable for detecting the cumulative effects of environmental stressors [13].
Numerous fish-based methods for assessing the ecological status of rivers have been developed worldwide over time. These methods typically involve defining reference conditions and selecting biological variables that both characterize fish communities and highlight the pressures influencing them [14]. The fish-based Index of Biological Integrity (IBI) [15,16] has been applied to monitor the ecological status of lotic ecosystems across Europe and globally, either in its original form or in adapted versions that account for regional ecological characteristics (extensive reviews in [14,17,18,19]). The IBI incorporates characteristics of fish communities from the individual to the ecosystem level and is based on the summation of scores for structural and functional parameters of the ichthyofauna, ultimately providing an overall assessment of the biological integrity of the studied area [20].
Benthic macroinvertebrates constitute an essential component of lotic food webs, functioning as a critical link between primary producers and top consumers [21]. They possess a suite of functional traits that make them reliable bioindicators of lotic systems: low mobility, relatively short life cycles, habitation at the sediment–water interface, and high taxonomic diversity, encompassing both pollutant-tolerant and environmentally sensitive groups [22].
Zoobenthos-based methods for water quality assessment are widely applied across the European Union, in 26 of the 27 member states [23], as well as globally [24,25]. A wide variety of indices based on benthic macroinvertebrates exist, most of which consider the presence and/or abundance of indicator families. For each taxon, a score is assigned that reflects the likelihood of its occurrence under undisturbed conditions. The final score, obtained by summing these values, is then translated into one of the five quality classes stipulated by the WFD [23].
Benthic diatoms are the dominant group of phytobenthos in temperate rivers [26], forming the trophic base for numerous lotic consumer species. They are also reliable indicators of environmental quality, as they live attached to substrates and respond rapidly to environmental pressures, particularly eutrophication, organic pollution, and acidification [27]. A wide range of diatom-based indices exists, focusing on the presence and/or abundance of indicator species of saprobity, sensitive to changes in environmental parameters, or tolerant to pollution [27,28,29]. Similar to other biotic indices, the final score in diatom-based assessments is classified into one of the five WFD quality classes [30].
The present study aims to identify the key drivers shaping biotic community structure in two stretches of the Bistrița River and to test two hypotheses regarding the assessment of the ecological status of lotic habitats:
(1)
The regulating ecosystem service related to maintaining water quality is expected to be more pronounced in headwater streams (low-order rivers) compared to larger, higher-order rivers [31]. Accordingly, we anticipated a gradual decline in water quality and ecological integrity downstream, with higher quality classes in the upstream reaches of the Bistrița River.
(2)
Given their sensitivity to pollutants and complex ecological roles, fish serve as valuable indicators of environmental health, functioning as keystone ecological indicators [13]. Because they respond to environmental changes over larger spatial and temporal scales than invertebrates or algae, we expected ichthyofauna to provide an accurate representation of ecosystem integrity within the study area.
The novelty of this research lies in its comparative approach, evaluating key riverine biotic communities and the multiple impacts they experience. The practical relevance of the study relates to the conservation and management of freshwater aquatic habitats, particularly in Natura 2000 protected areas.

2. Materials and Methods

2.1. Study Area

The upper course of the Bistrița River has been the subject of previous research, addressing either abiotic environmental conditions [32,33], or biotic communities of benthic invertebrates [34] and fish [35,36]. However, a complex approach, involving several biodiversity compartments, was never recorded.
The sampling sites were located in the Bistrița River Basin (Eastern Carpathians), the most important right tributary of the Siret River. From headwaters to mouth, the Bistrița River has an absolute length of 283 km; an average elevation of 919 m; and an average slope of 5‰ [37]. The source of the river is located in the Rodna Mountains (Eastern Carpathians) and its catchment area exceeds 7000 km2. The upper course of the river is called “Bistrița Aurie” (meaning the Golden Bistrița) [37].
Twenty sampling sites were considered for fish fauna analyses (Figure 1, Table S1), located in two NATURA 2000 protected areas [38]: ROSAC0010 Bistrița Aurie (346.9 ha), including the upstream sites B1–B15; and ROSAC0196 Pietrosul Broștenilor—Cheile Zugrenilor (456 ha), with downstream stations Z1–Z5, encompassing an elevation difference of approximately 300 m between them. For ease of interpretation, the two sampling regions were named “Bistrița Aurie” and “Zugreni” in the subsequent analyses. Additional benthic invertebrate and diatom samples were collected in five sampling sites (B2, B3, B15, Z3 and Z5, Table S1), for comparative analyses. The sites sampled for all three biotic elements were characterized by heterogenous impact scores, and they were chosen based on their location and main characteristics.

2.2. Abiotic Parameters and Impact Assessment

Several abiotic parameters were recorded at each sampling site: elevation (m a. s. l.), maximum width (m); maximum depth (m); water conductivity (µS/cm); water temperature (°C); dissolved oxygen (mg/L) and oxygen saturation (%), using portable instruments: GPS receiver Garmin Geko 301 (Garmin, Olathe, KS, USA), YSI-52 oximeter (YSI, Yellow Springs, OH, United States) and Oxi 330/set no. 200232 multimeter (OXI Electronics, Berlin, Germany) (Table S1). Other ordinal parameters were assessed on site using direct measurements: bank vegetation, water turbidity, river geomorphology, and existing floodplain (Table S1). Dominant river sediments grouped the sites into riffle (≥70% boulders, pebbles), pool (≥70% sand and silt), and riffle/pool (intermediate proportions of bottom materials), according to [40].
For impact assessment, an adaptation of the trade-off analysis [41] was used. Nine pressure categories were identified, as follows: barriers across the waterway (BAR); barriers: embankment (EMB); diffuse pollution due to agriculture or forestry, including pisciculture (PAF); diffuse pollution due to domestic waste waters (PDW); diffuse pollution due to mining activities (PMA); poaching (POA); resource exploitation—forest (REF); resource exploitation—sediments (RES); uncontrolled waste disposal (UWD). An importance value was awarded for each pressure category, ranging from 0 (not important) to 1 (very important). These values were added in order to calculate the impact score for each sampling site, and the final values were normalized, on a scale between 0 and 1 (Table S1).

2.3. Sampling and Processing of Biotic Communities

Biotic analyses in this study focused on ichthyofauna, with benthic invertebrates and diatoms included for comparative purposes, as these three groups are among the most commonly used in ecosystem quality assessment programs [8].
Fish samples were collected from the 20 sampling sites (Table S1) by electrofishing, using an EFKO FEG1500 portable equipment (Elektrofischfanggeräte GmbH, Leutkirch im Allgäu, Germany), series 970205, 1.5 KW, 150–300/300–600 V, with a SACHS Stamo ST76 engine (Sachs, Friedrichshafen, Germany). Fished area was recorded for each site, and all individuals were released back into the river after identification and measurement of total length and wet body weight. Fish species identification followed [42,43] (Table S2).
Benthic invertebrates were sampled using a 250 µm mesh size net, while benthic diatoms were sampled by scraping the hard substratum. Benthic samples were preserved in the field with 4% formaldehyde [44]. In the laboratory, they were sorted and counted under Nikon SMZ 645 and 800 stereomicroscopes and Nikon YS100 microscopes (Nikon, Tokyo, Japan). Identifications were made to the species level in case of algae, and to different taxonomical levels in case of zoobenthos: families for all groups except Nematoda and Oligochaeta, genera for Hirudinea, Gastropoda, Copepoda, Hydrachnidia, Ephemeroptera and Plecoptera. Standard keys were followed for identification and taxonomic classification (e.g., [45,46] for algae and [47,48] for invertebrates) (Table S2).

2.4. Statistical Analyses and Calculation of Biotic Indices

Basic ecological indices were computed from raw data: density for fish, abundance for zoobenthos and diatoms. Diversity indices were analyzed for all biotic communities included in the present study: the species richness for fish and diatoms, number of families for zoobenthos, together with the Shannon-Wiener diversity and the equitability (Table S3).
Multivariate analyses were considered for the visualization and interpretation of datasets, with species parameters as response variables and environmental factors as explanatory ones. Principal Coordinates Analysis (PCoA), an unconstrained ordination method that allows the positioning of objects in a reduced-dimensional space, while preserving, as much as possible, their relative distances [49], was employed to analyze the similarities between the sampling sites. Constrained ordination analysis, both linear (Redundancy Analysis RDA) and unimodal (Canonical Correspondence Analysis CCA) were used to explore the relationship between the response and explanatory variables, with the connections between them determined through regression methods. The selection of key environmental predictors that best explained fish community composition was performed using RDA forward selection, based on the Monte Carlo permutation test (n = 999) and the simple term effects, i.e., each selected variable was considered to be independent. All multivariate analyses were explored using Canoco 5, version 5.15 [50].
Correlation between biotic communities and abiotic factors were performed using R [51] and the PerformanceAnalytics package [52].
The biotic indices selected for the present study are widely used methods for assessing water quality and ecosystem integrity. The fish-based Index of Biological Integrity (IBI) [15,16] uses ichthyofaunal metrics from three categories in order to assess the biological quality of running waters: (1) species richness and composition, (2) trophic composition, and (3) fish abundance and condition. The final IBI score ranges from <23 to 60, describing five levels of river health: very poor (<23), poor (24–35), fair (36–44), good (45–52) and excellent (53–60). The IBI score calculated for the present study followed the adaptation to the specific conditions of the Romanian rivers made by [35] (Table S3).
For zoobenthos, the Modified New Walley Hawkes MNWH [40] was selected to illustrate the potential of benthic invertebrates to assess water quality, due to its revised calculation method and high sensitivity (Table S3). The index uses specific scores assigned to zoobenthic families with indicative values (while Oligochaeta is considered as a group). These values are based on the presence of the taxon in the sample (Present-Only, PO), or on four abundance classes (Abundance-Related, AR: 1–9; 10–99; 100–999; and >1000 individuals). The final index score divides the water quality of the sampling point into 5 classes: bad (0–10), poor (11–40), moderate (41–70), good (71–100) and high (>100) [40].
For the algal communities sampled from the same five sites as the zoobenthos, the Diatom Biological Index DBI [53] was chosen, given its widespread application in biotic monitoring programs across Europe and globally [54]. The DBI considers only diatom species with indicator value that exceed a certain abundance threshold in the analyzed sample, and the final score is subsequently converted into five water quality classes: bad (1–4.99), poor (5–8.99), moderate (9–12.99), good (13–16.99) and high (17–10) [53] (Table S3). Other indices were calculated, but not considered for discussions [55,56] (Table S3).

3. Results

3.1. Assessment of Pressures and Impacts

Nine types of pressures were identified in the study area, each exerting varying effects on the analyzed biotic communities (Table 1). For each pressure type, an importance value was assigned on a scale from 0 to 1, with 0 indicating negligible importance and 1 indicating high importance.

3.2. Abiotic Parameters

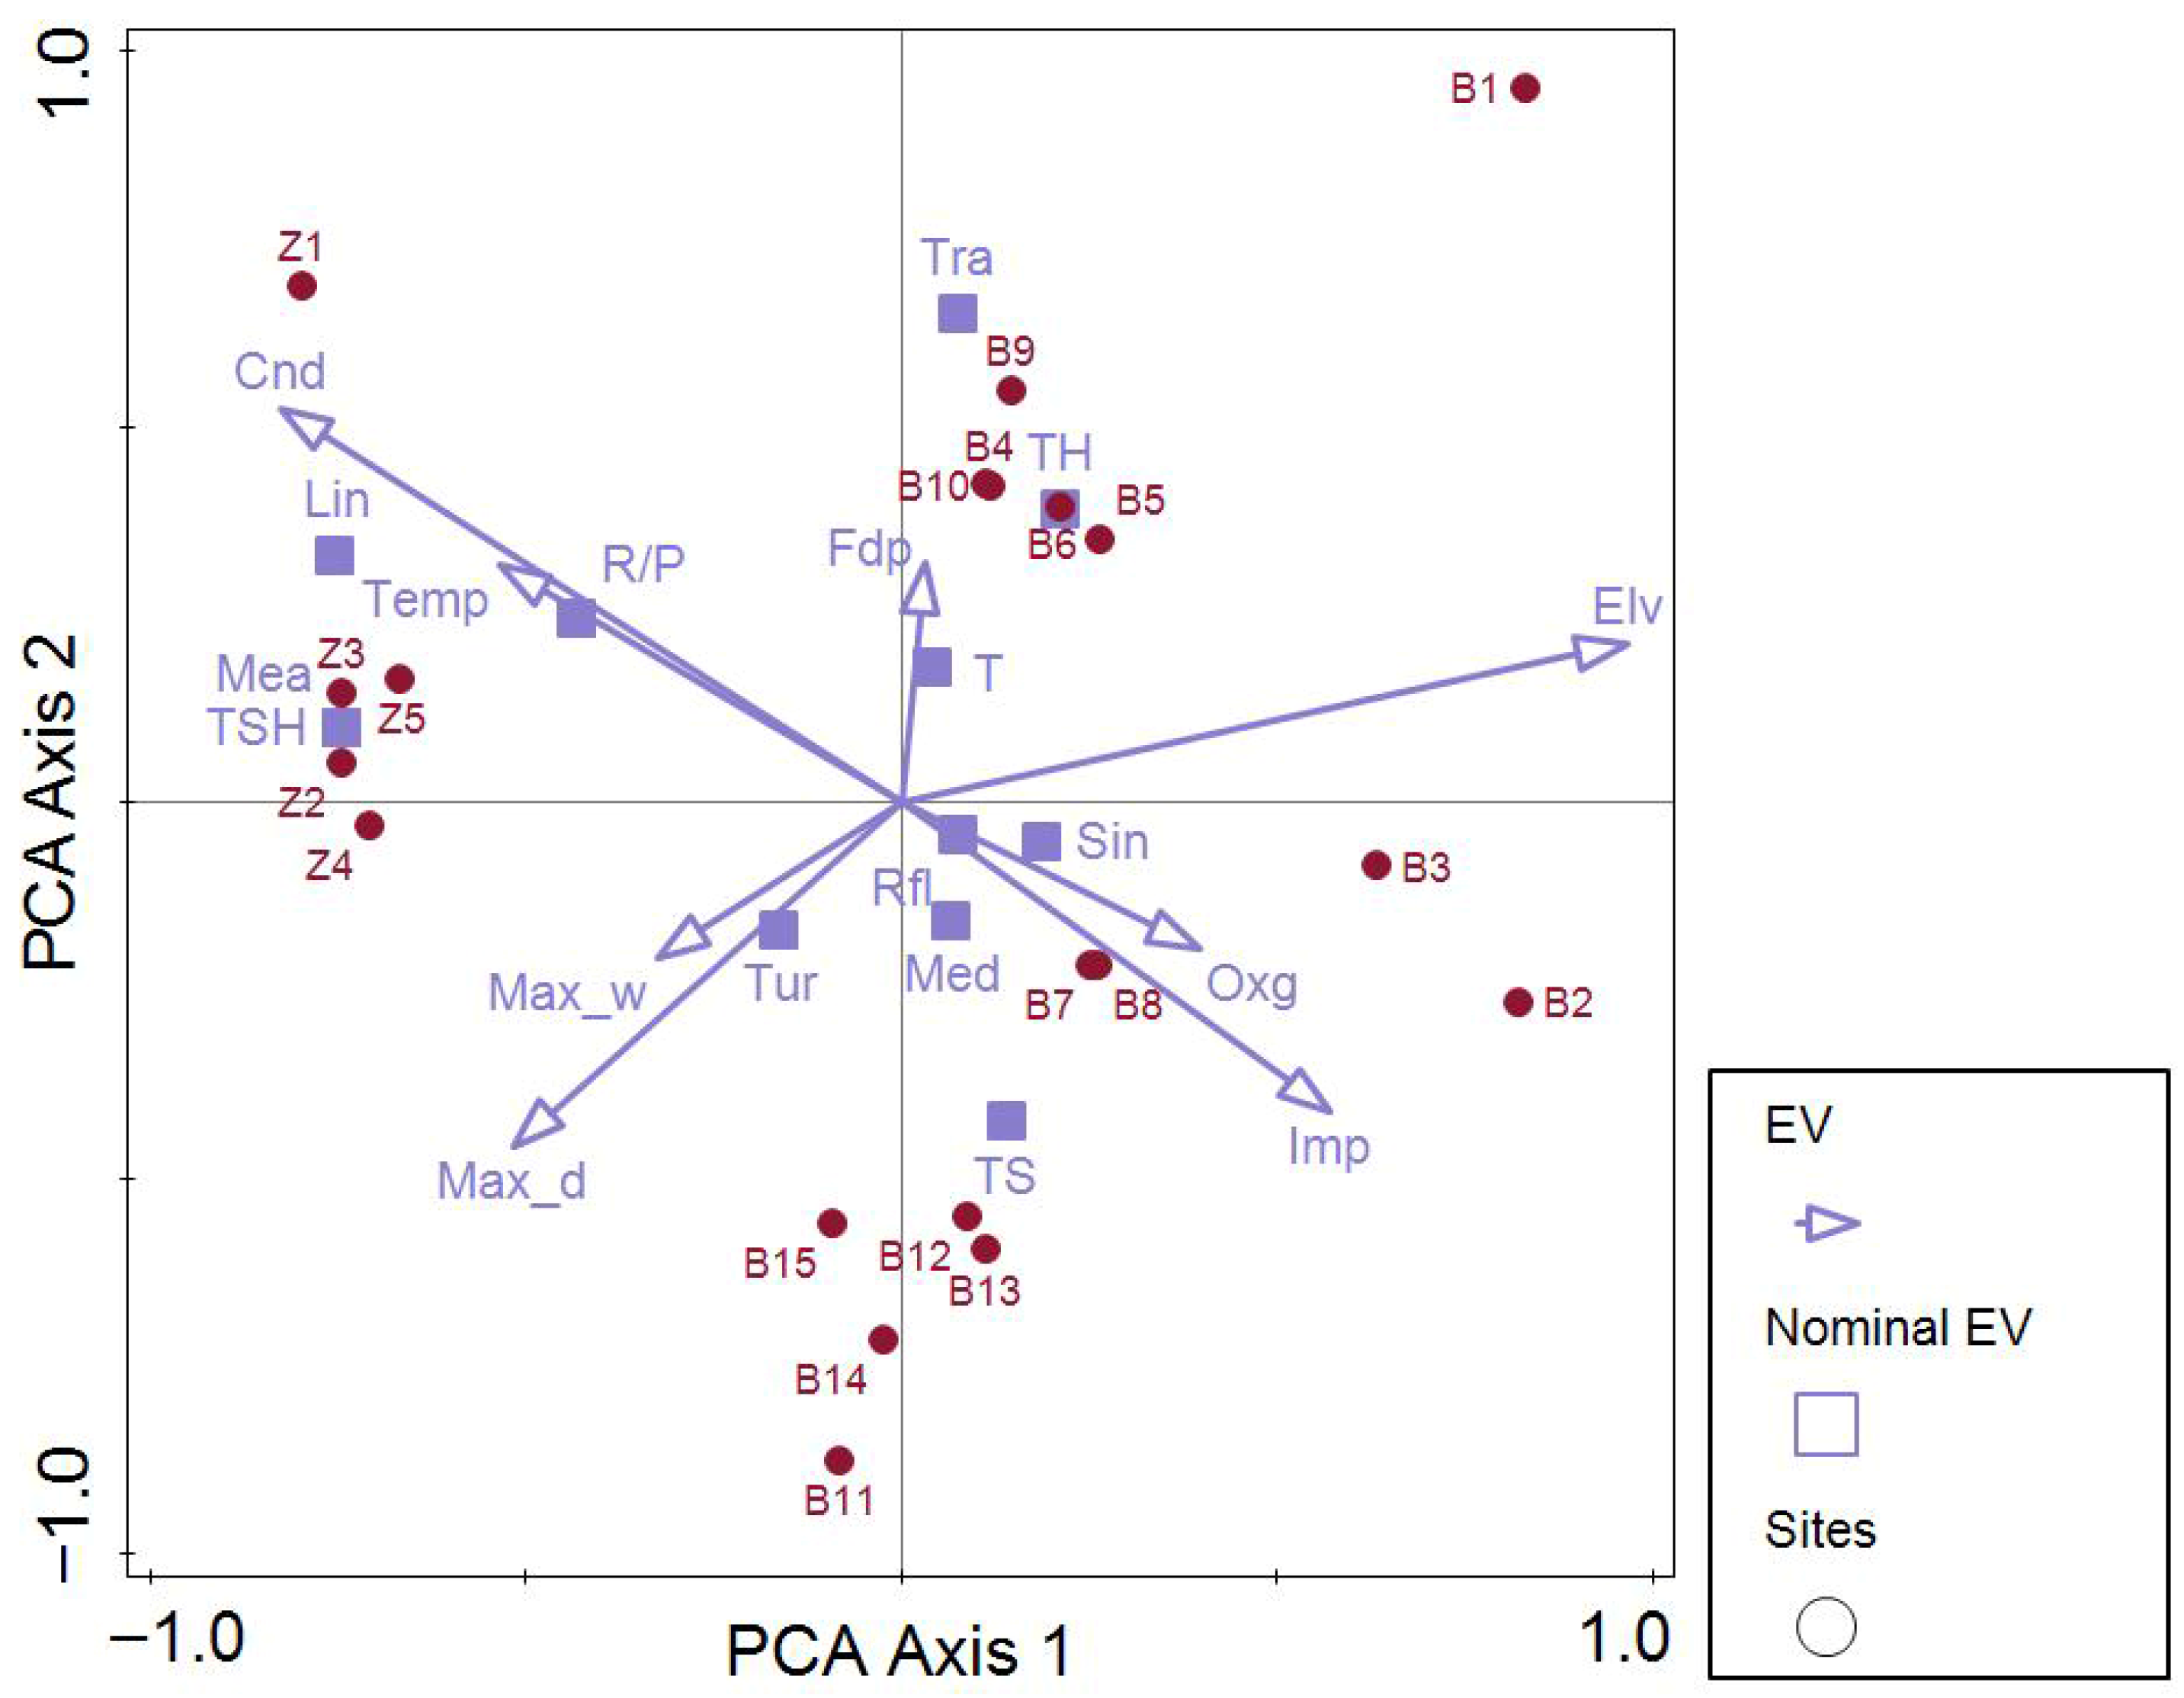
Based on the analysis of environmental factors, a clear difference between the sites located upstream (B1–B15) and downstream (Z1–Z5) was observed, since objects ordinated closer to one another in the PCoA biplot are more similar than those positioned further apart (Figure 2). Stations Z1–Z5 aggregated due to higher temperature and conductivity values, as well as a lower impact score (reflecting a more pristine area). A more particular situation concerns the positive correlation between elevation and impact score, resulting from the influence of mining activities upstream (B1–B15).

3.3. Fish Communities

A total number of 1600 fish individuals were processed during the study, belonging to 12 species and 9 families (Petromyzontidae, Cyprinidae, Leuciscidae, Gobionidae, Cobitidae, Cottidae, Nemacheilidae, Salmonidae, Thymallidae (Table S2). The fish-based IBI generally indicated excellent ecological integrity (class I) at most sampling sites, with a declining trend observed along the Bistrița Aurie, where four downstream stations were characterized by class II integrity and two by class III. In Zugreni, all stations returned to class I integrity (Table S3).
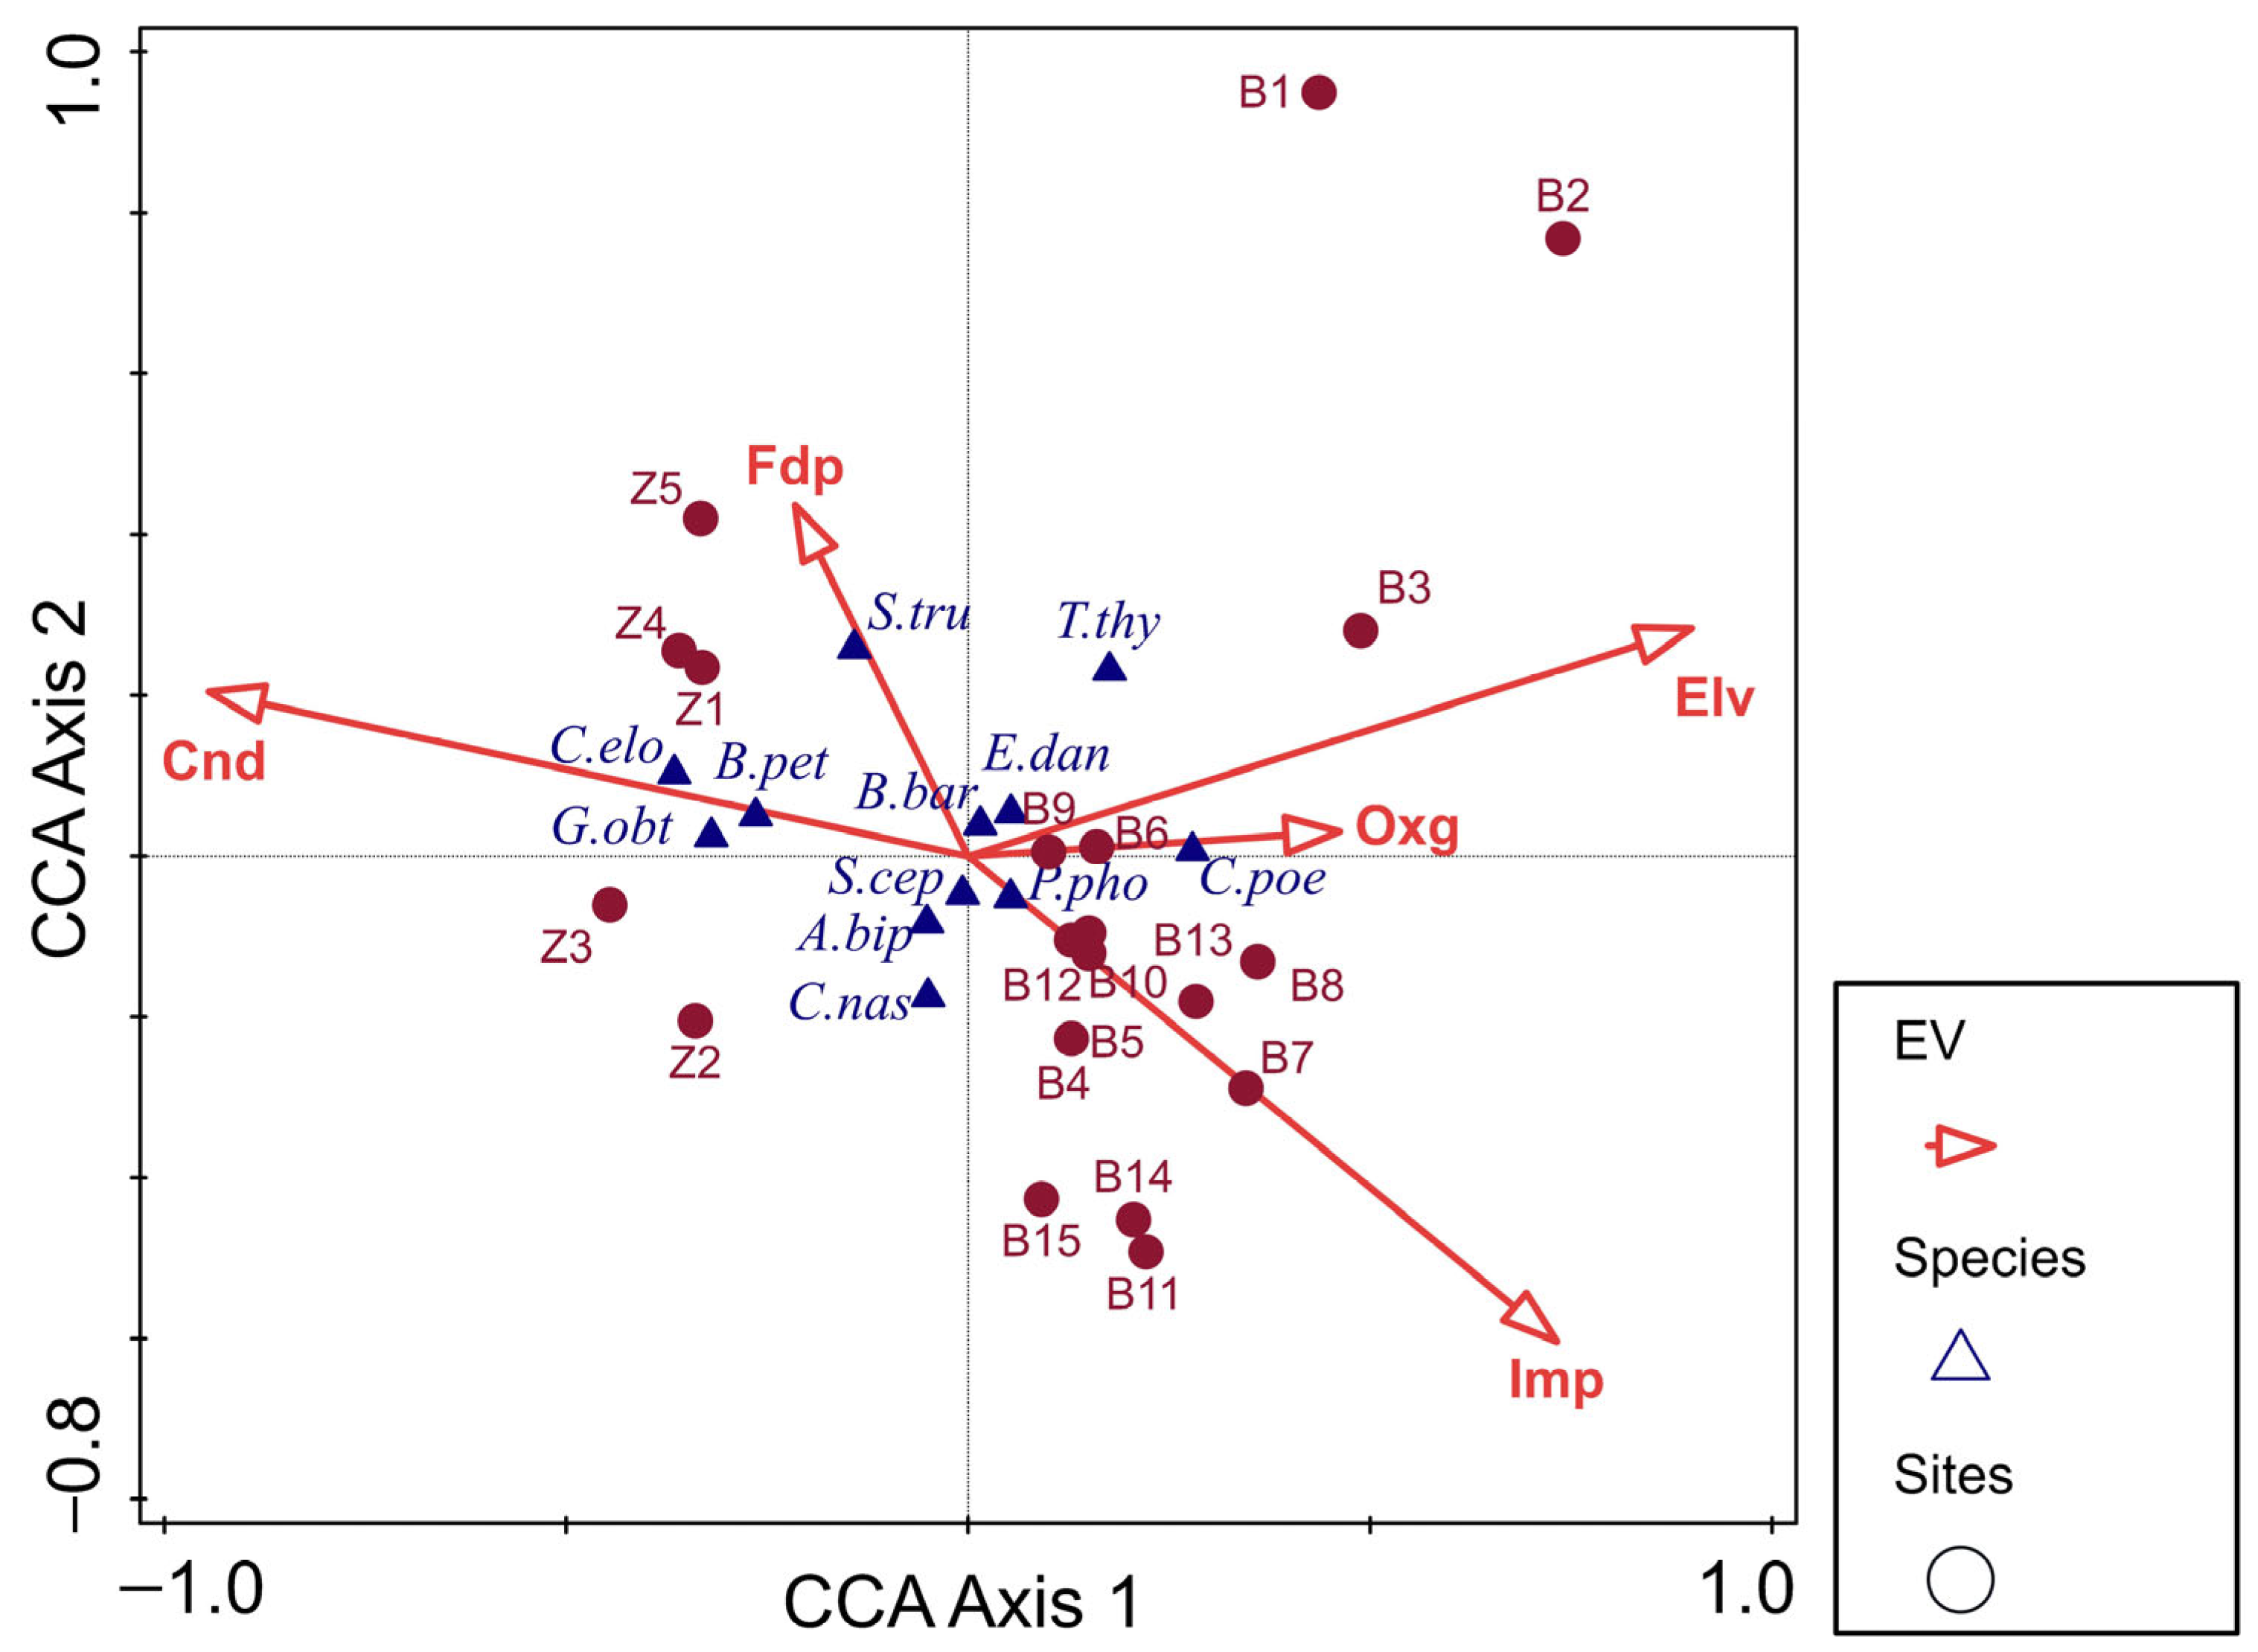
Constrained ordination analyses were used to explain the best environmental predictors for fish species composition: CCA (adjusted explained variation: 17.77%, Monte Carlo permutation test results on all axes: pseudo-F = 1.8, p = 0.026) (Figure 3) and RDA (adjusted explained variation: 23.11%, Monte Carlo permutation test results on all axes: pseudo-F = 2.1, p = 0.017). As depicted by the CCA, Salmo trutta and Thymallus thymallus were mostly found in unimpacted stations. Cobitis elongatoides, Gobio obtusirostris, and Barbus petenyi preferred waters with higher conductivity, whereas Cottus poecilopus favored well-oxygenated waters at higher altitudes (similar to T. thymallus). Chondrostoma nasus was the most tolerant species to elevated anthropogenic impact (although still at intermediate, not maximum, levels) (Figure 3). The RDA forward selection performed on these data showed that the most important explanatory variables for fish species composition were, in decreasing order of importance and significance: (1) elevation (explained 25%, pseudo-F = 6, p = 0.003, p adjusted for false discovery rate = 0.01), (2) water conductivity (explained 23.6%, pseudo-F = 5.6, p = 0.004, p adjusted for false discovery rate = 0.01), and (3) the impact score, marginally significant (explained 12.8%, pseudo-F = 2.6, p = 0.049, p adjusted for false discovery rate = 0.08167).
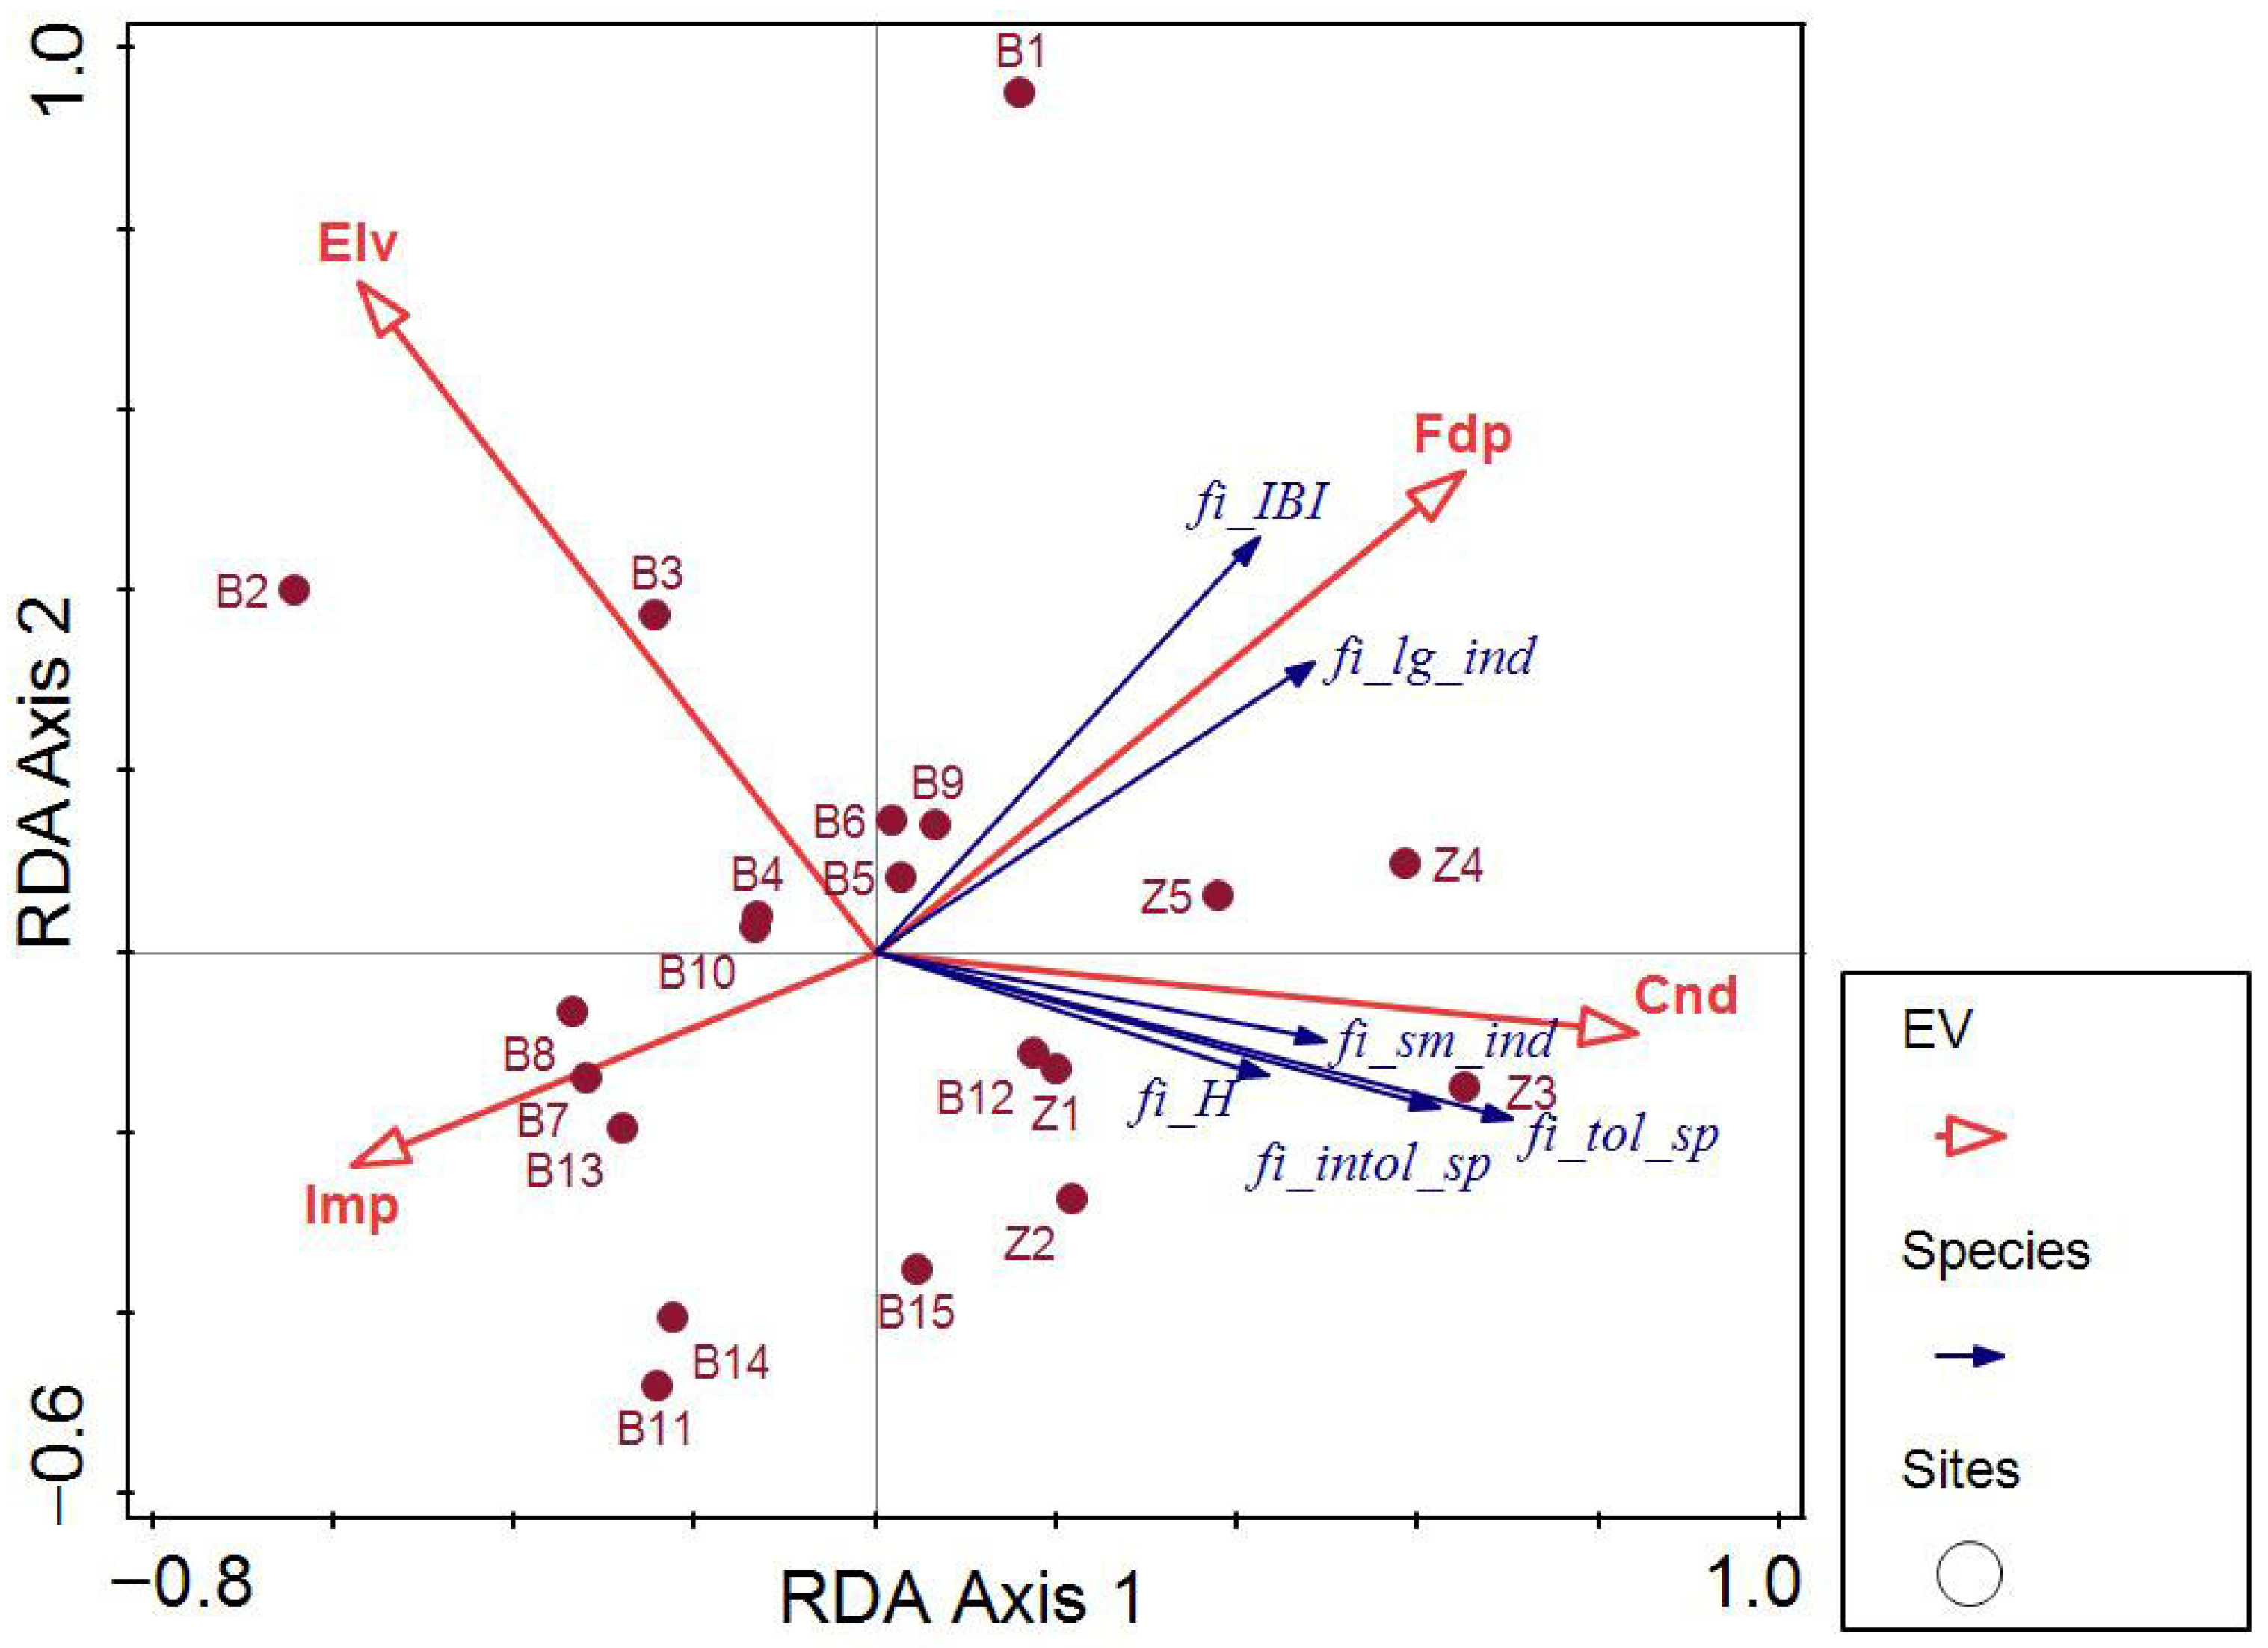
To understand the relationships between fish communities and the assessment of biological integrity and habitat health, several parameters were estimated: the fish-based IBI, the Shannon–Wiener diversity index, the number of large versus small individuals (using a 15 cm threshold), and the number of tolerant versus intolerant species (according to [58]). As depicted in Figure 4, all these parameters, strongly positively correlated with each other, are negatively correlated with the anthropogenic impact score. All fish community parameters increased downstream, at the Z1–Z5 sampling sites. Furthermore, the IBI score was positively correlated with the number of large individuals and with the percentage of remaining floodplain area.

3.4. Zoobenthos and Diatom Communities

Eleven benthic invertebrate taxa were identified in the five sampling sites chosen for comparative analyses (B2, B3, B15, Z3, Z5): Nematoda, Oligochaeta, Hirudinea: Ord. Rhynchobdellida, Gastropoda: Superord. Hygrophila, Copepoda: Ord. Harpacticoida, Hydrachnidia: Ord. Trombidiformes, Insecta: Ord. Coleoptera, Ord. Diptera, Ord. Ephemeroptera, Ord. Plecoptera, Ord. Trichoptera). A total of 1285 individuals were counted in the samples, belonging to 33 families (Oligochaeta and Nematoda were included as groups) (Table S2). Dipterans represented the most abundant group (38% from all individuals, with Family Chironomidae exceeding 85% of all dipteran individuals), followed by caddis flies (22%), oligochaetes (18%) and mayflies (16%). Only families Chironomidae and Baetidae (Ephemeroptera) were present in all five sites. The ratio between intolerant zoobenthic groups (EPT, Ephemeroptera, Plecoptera, Trichoptera) and tolerant taxa (OCH, Oligochaeta and Chironomidae) decreased abruptly on going downstreams, from 3.02 in B2, to 0.32 in B3, 0.05 in B15, 0.56 in Z3 and 0.40 in Z5, showing decreases in water quality.
A total of 3889 diatom individuals were counted at the five sampling sites discussed above, belonging to 65 species and 19 families (Table S2). The most abundant families were Encyonemataceae (16% from all diatoms identified), Tabellariaceae (15%), Fragilariaceae (15%), Achnanthidiaceae (14%) and Gomphonemataceae (12%). Dominant species included Achnanthidium minutissimum and Encyonema minutum, each representing >10% of all diatom individuals counted.
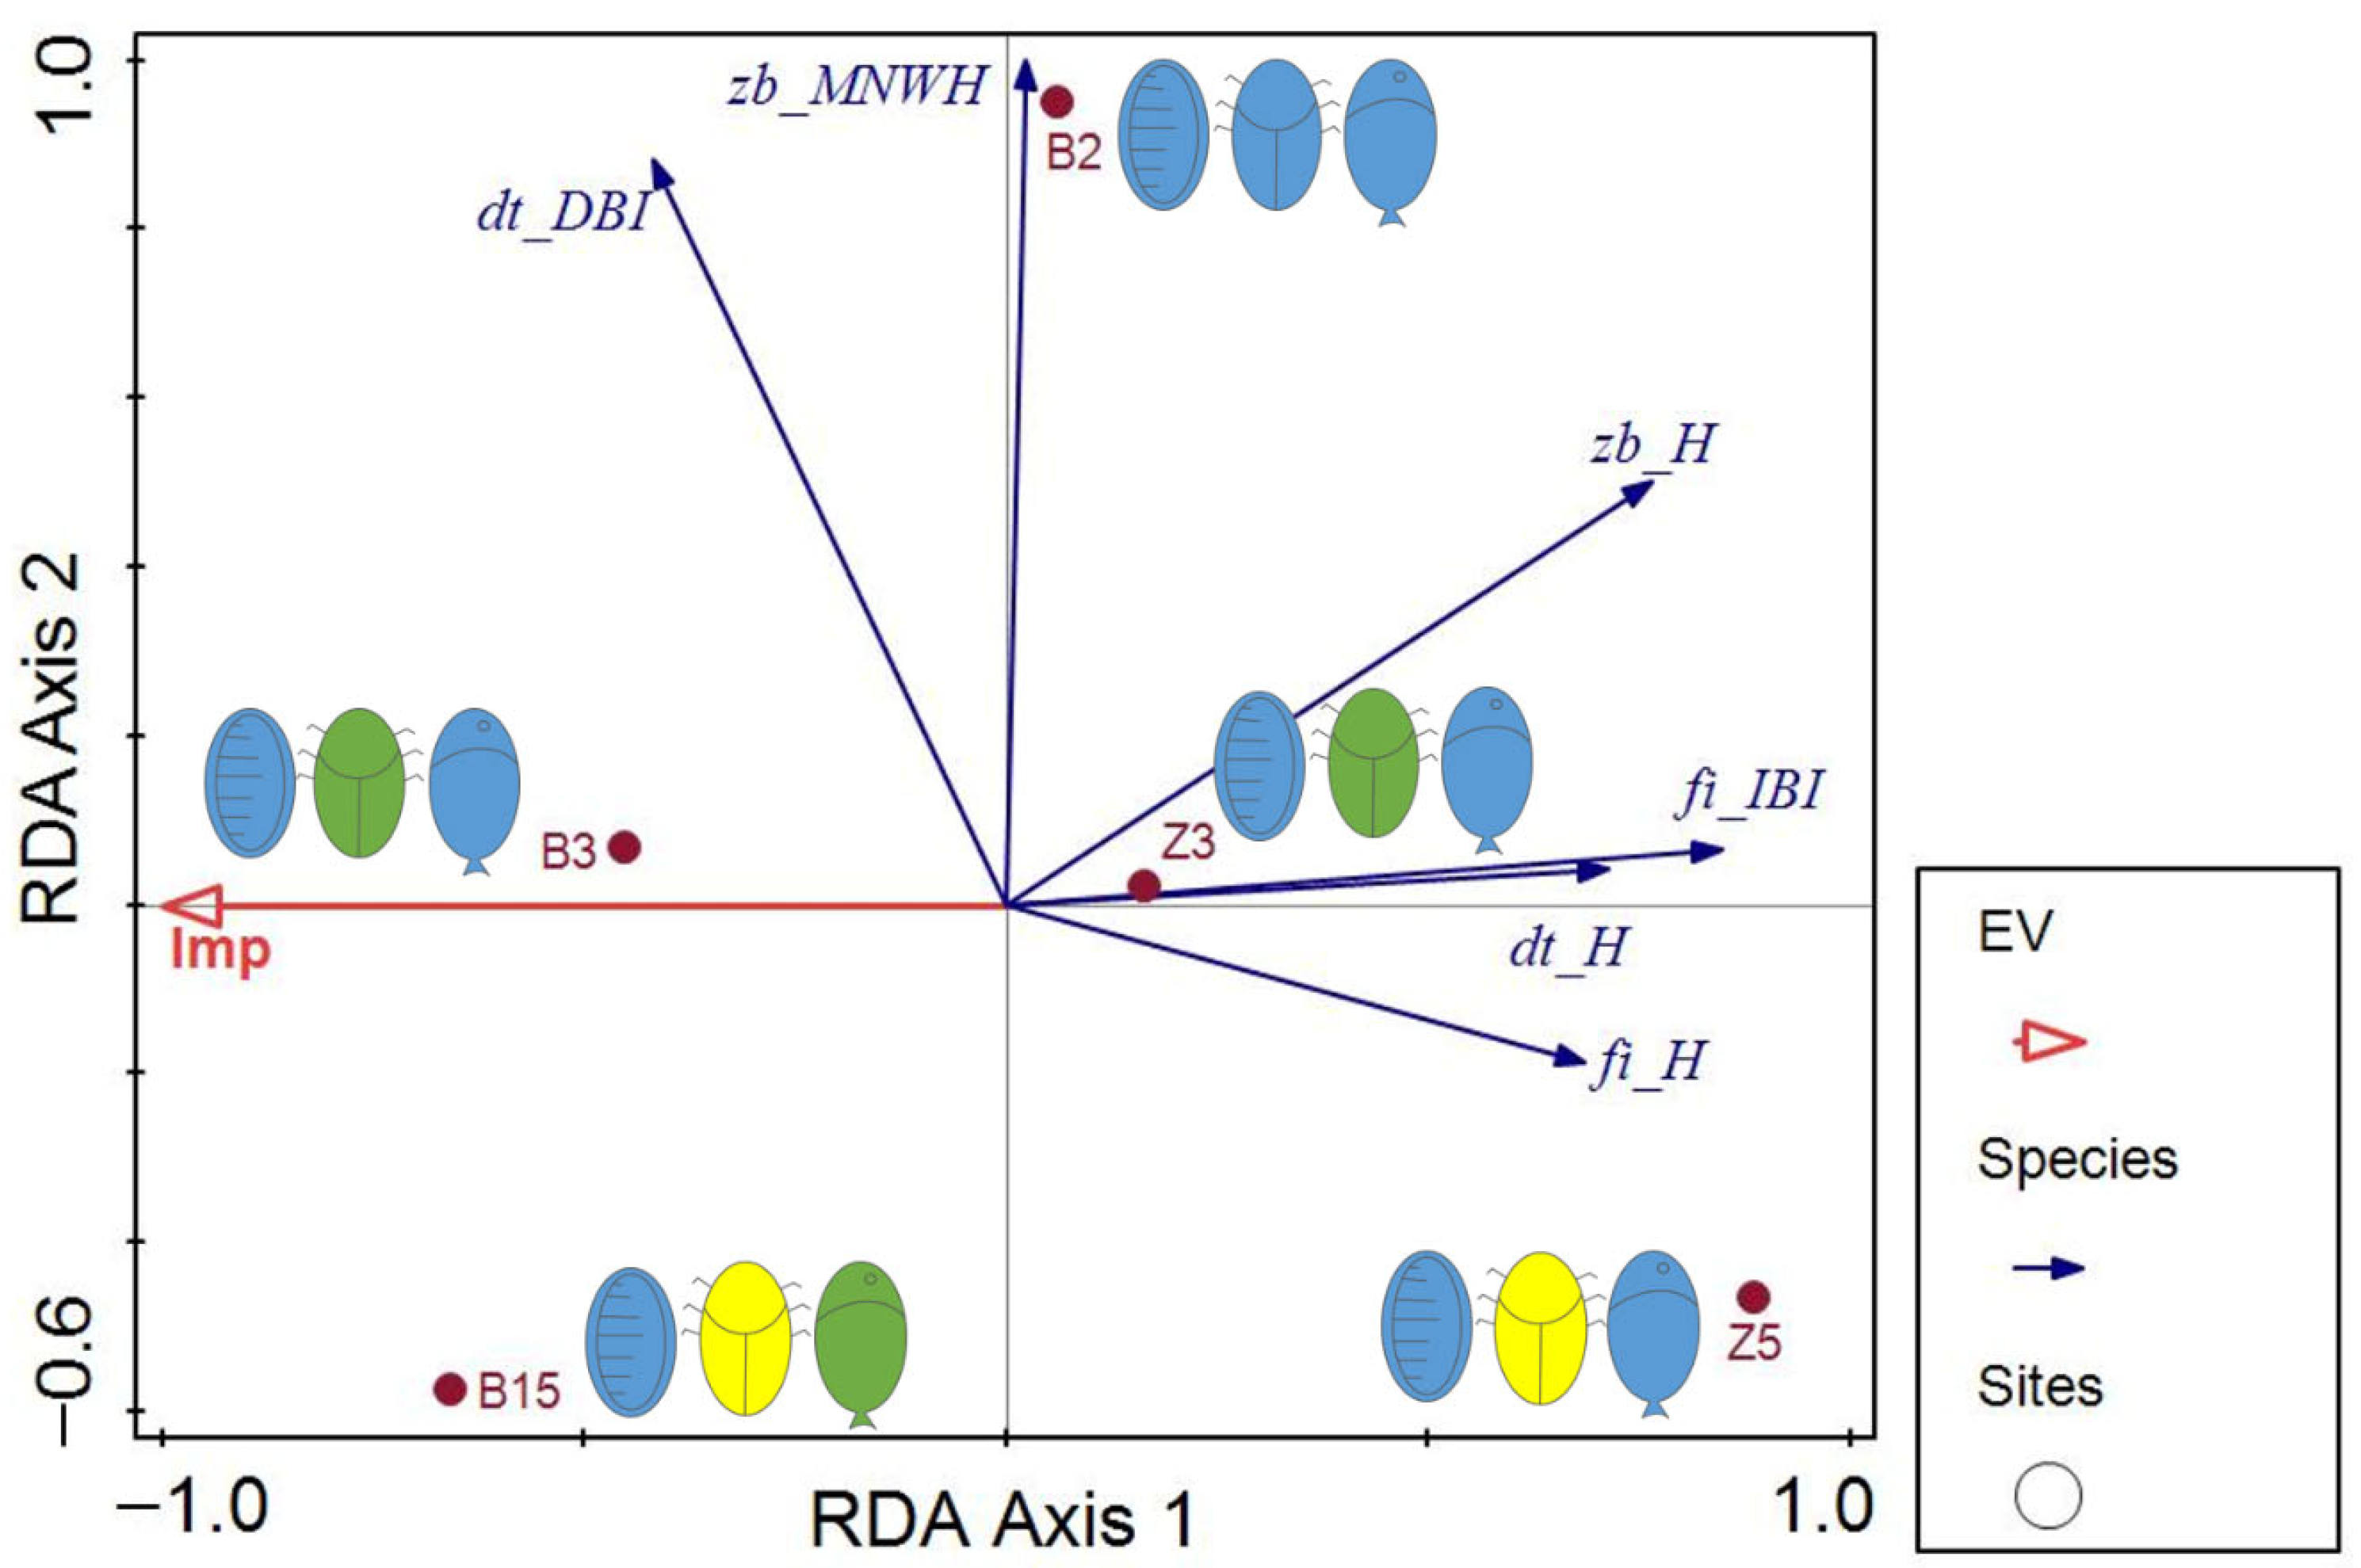
Several parameters characterizing the biotic communities were calculated, in order to assess the water quality and ecosystem integrity at the five sampling sites chosen for comparative analyses (Table S3). Most biotic community parameters were positively correlated with each other, with diversity showing the strongest associations (Figure 5). Sites B3 and B15 were strongly influenced by the anthropogenic impact score, whereas diversity and the values of biotic indices based on invertebrates and fish increased at the downstream sites (Z3, Z5) and at B2, located furthest upstream. The calculation of the Spearman coefficient revealed negative correlations between the fish-based IBI and the impact score (p < 0.05). The biotic indices based on diatoms and zoobenthos (DBI and MNWH.PO, respectively) were positively correlated with the dissolved oxygen (p < 0.05) and negatively correlated with conductivity values (p < 0.01 for DBI).
The diatom index DBI indicated a high water quality class (I, blue in Figure 5) in all cases. Similarly, the fish-based IBI depicted excellent integrity status (class I) in all five sites, except for B15, where good state was indicated (class II, green in Figure 5). The zoobenthic MNWH-PO was the most sensitive index out of the three biotic indices considered, showing water quality classes ranging from I at B2, to II at B3 and Z3, and to III (moderate) at B15 and Z15 (yellow in Figure 5).

4. Discussion

4.1. Pressure and Impact Assessment in the Study Area

Freshwater areas protected under the Natura 2000 Network are specifically intended to conserve the biodiversity of these essential ecosystems [59]. However, the two Natura 2000 protected areas considered in the present study—ROSAC0010 Bistrița Aurie and ROSAC0196 Pietrosul Broștenilor–Cheile Zugrenilor—fail to provide an environment free from anthropogenic pressures for the biotic communities within their boundaries, a challenge also reported in other parts of the European Union [60].
Eight major categories of pressures were identified in the two river stretches investigated. The most severe stressors were diffuse pollution from domestic wastewater, mining activities, and agriculture and forestry [32,57] consistent with literature identifying pollution (including eutrophication) as the predominant anthropogenic stressor in freshwater ecosystems [2,3,10]. Mining-related metal contamination was particularly severe due to its bioaccumulative effects on aquatic organisms [61]. Hydrological alterations had a lower overall importance, with localized impacts only in the downstream Zugreni area. Additional pressures of lower severity were also noted, such as the presence of litter in the riverbed and poaching, while the occurrence of invasive fish species (identified by [62] as a main stressor on freshwater ecosystems) was not detected in the study area.
Sampling sites were grouped into three categories: (1) uppermost Bistrița Aurie stations (B1–B3), affected by relatively low pressures; (2) mid-course stations (B4–B15), strongly impacted by metal runoff from nearby mining areas [32] and domestic wastewater inputs [57] originating from inhabited zones; and (3) downstream stations (Zugreni Z1–Z5), where impact scores were lower. This improvement in downstream environmental quality likely reflected the distance from upstream mining zones and the dilution of metal concentrations through the inflow of tributaries into the Bistrița River (most notably the Dorna River), as well as the decrease in resident human population density, that reached over 5000 inhabitants in the Bistrița Aurie region compared to 2800 upstream of Zugreni (according to the National Institute of Statistics censuses, https://insse.ro, accessed on 11 August 2025).

4.2. Fish Communities

The structure and functional attributes of the fish communities assessed in the present study reflected, in most cases, habitats of high biological integrity (Class I), with only a few stations in the lower Bistrița Aurie exhibiting Class II or III integrity. The IBI score was positively correlated with the proportion of remaining floodplain, indicating a direct relationship between aquatic ecosystem integrity, fish community structure, and the extent of intact riparian areas, a relationship well documented in the literature [63,64].
Compared to historical data [36], the general structure of the ichthyofauna in the area has been largely maintained, although four species: Salvelinus fontinalis (Mitchill, 1814), Hucho hucho (Linnaeus, 1758), Barbus barbus (Linnaeus, 1758) and Lota lota (Linnaeus, 1758) were no longer recorded. The most notable case is that of the huchen (H. hucho), which has disappeared from much of its original range, due to pollution and habitat degradation [65,66,67].
The influence of anthropogenic pressures on the structure of riverine fish communities is well documented. Danet et al. [68] for instance, reported structural changes of approximately 30% per decade in freshwater fish assemblages, accompanied by substantial shifts in dominant species and an increasing prevalence of non-native taxa. In the present study, however, the anthropogenic impact score emerged only as a marginally significant factor, while altitude and water conductivity were identified as the primary drivers of fish community composition. These results are consistent with previous research highlighting altitude (alongside latitude) as a key environmental factor shaping freshwater fish assemblages [69].

4.3. Comparative Analyses Involving Fish, Zoobenthos and Diatoms

In the five sites selected for comparative analyses of water quality and biological integrity, the zoobenthos-based index provided the most accurate depiction of ecological decline in both the Bistrița Aurie and Zugreni regions. The specific traits of benthic macroinvertebrates (limited mobility, short generation times, and ease of sampling [8] make them particularly suitable for detecting pressures such as hydromorphological alterations [70,71] and pollution from mining activities [22,72], a pattern consistent with the present study. By contrast, although diatom communities have proven effective for identifying impacts of eutrophication [70], toxic elements [71] and heavy metal gradients [73], the diatom index DBI in our case failed to distinguish between sites, assigning high-quality status in all cases.
Similarly, the fish-based IBI did not discriminate effectively among the five sites, indicating excellent ecosystem integrity at all Zugreni locations. Previous research suggests that metrics based on zoobenthos and diatoms tend to respond stronger and quicker to environmental pressures than those based on fish [61,74], particularly in mountain rivers where fish metrics often show low sensitivity [70]. Nonetheless, some studies have reported the opposite pattern, with fish communities providing more consistent responses than zoobenthos [75]. These findings reinforce the need to select biotic communities suited to the pressures under investigation [74] and to define spatial and temporal scales with precision [61], to ensure robust results.
The principle described in the present study has also been discussed and applied in other works: the combined use of zoobenthos and fish communities has been recommended both in specific contexts, such as rivers influenced by agricultural activities [76] or Mediterranean rivers [77], as well as across large spatial scales [78], since the two biotic communities respond differently to distinct groups of variables.

5. Conclusions

The findings of the present study revealed not only that, in the particular case of the Bistrița River, water quality does not follow the expected gradient of decline from upstream to downstream (with biotic parameters indicating a recovery of the riverine ecological status in the downstream Zugreni area), but also that freshwater ecosystem integrity assessments based exclusively on fish may provide a distorted, less severe picture of the impacts experienced by these systems.
Thus, in impacted rivers such as the Bistrița, it is essential to avoid relying on a single method for assessing water quality or ecosystem integrity, and instead to acknowledge that multiple pressures should be detected through the examination of several biodiversity components specific to the river.
The limitations of the present study lie in the fact that it describes a case-specific situation typical for an impacted river, and therefore cannot be generalized to other catchments characterized by different environmental factors and pressures. Moreover, the number of sites with comparative analyses between diatom, zoobenthos and fish was low, making generalization even more problematic. Nevertheless, the results may be used in the management of freshwater protected areas and in the selection of methods for assessing river water quality.

Supplementary Materials

The following supporting information can be downloaded at: https://www.mdpi.com/article/10.3390/fishes10090467/s1, Table S1: Main characteristics of the sampling sites considered for the present study, physico-chemical parameters and other abiotic factors; Table S2: List of fish, zoobenthos and diatom taxa identified in the sampling sites considered for the present study (B1–B15, Z1–Z5; site abbreviations as in Table S1) (1—present; 0—absent; NA—Not Applicable); Table S3: Community parameters and biotic indices calculated for the sampling sites included in the present study (B1–B15; Z1–Z15, site abbreviations as in Table S1) (values in bold represent indices included in the analyses; integrity levels are: I: excellent; II: good; III: fair; IV: poor; V: very poor; classes of water quality are: I: high; II: good; III: moderate; IV: poor; V: bad).

Author Contributions

Conceptualization, K.P.B., I.S. and M.C.; data acquisition, K.P.B., I.S. and M.C.; laboratory analyses, A.-M.Ș.C., M.C.; writing—original draft preparation, K.P.B.; writing—review and editing, K.P.B., I.S., M.C., A.-M.Ș.C. All authors have read and agreed to the published version of the manuscript.

Funding

Project SMIS CSNR 36219: “Conservation of Species and Habitats of Community Interest in Five Protected Areas of Suceava County,” funded through the Sectoral Operational Programme for Environment—Priority Axis 4, 2013–2014.

Institutional Review Board Statement

This study was approved by the Romanian Ministry of Environment and Climate Change, National Agency for Fisheries and Aquaculture, Scientific Fishing Permit No. 2/19.02.2014.

Informed Consent Statement

Not applicable.

Data Availability Statement

The original contributions presented in this study are included in the article/Supplementary Material. Further inquiries can be directed to the corresponding author.

Acknowledgments

The authors wish to acknowledge the Association for the Conservation of Wildlife for their support during the sampling campaigns and for granting permission to data publication. The authors also wish to pay tribute to Klaus Werner Battes, and Laura Momeu, whose guidance and dedication greatly influenced this work. During the preparation of this manuscript, the authors used ChatGPT (OpenAI), GPT-5 model, accessed via ChatGPT Plus in August 2025 for refinement of text translation. The authors have reviewed and edited the output and take full responsibility for the content of this publication. The authors are also grateful to the anonymous reviewers for their valuable contributions to improving the manuscript.

Conflicts of Interest

The authors declare no conflicts of interest. The funders had no role in the design of the study; in the collection, analyses, or interpretation of data; in the writing of the manuscript; or in the decision to publish the results.

References

  1. Yates, A.G.; Brua, R.B.; Culp, J.M.; Aguiar, F.C.; Ajayan, A.P.; Aspin, T.; Bundschuh, M.; Calderón, M.R.; Csabai, Z.; Dallas, H.; et al. Charting a Course for Freshwater Biomonitoring: The Grand Challenges Identified by the Global Scientific Community. Ecol. Indic. 2025, 176, 113646. [Google Scholar] [CrossRef]
  2. Keck, F.; Peller, T.; Alther, R.; Barouillet, C.; Blackman, R.; Capo, E.; Chonova, T.; Couton, M.; Fehlinger, L.; Kirschner, D.; et al. The Global Human Impact on Biodiversity. Nature 2025, 641, 395–400. [Google Scholar] [CrossRef]
  3. Cantonati, M.; Poikane, S.; Pringle, C.M.; Stevens, L.E.; Turak, E.; Heino, J.; Richardson, J.S.; Bolpagni, R.; Borrini, A.; Cid, N.; et al. Characteristics, Main Impacts, and Stewardship of Natural and Artificial Freshwater Environments: Consequences for Biodiversity Conservation. Water 2020, 12, 260. [Google Scholar] [CrossRef]
  4. Simon, T.P. Introduction: Biological Integrity and Use of Ecological Health Concepts for Application to Water Resource Characterization. In Assessing the Sustainability and Biological Integrity of Water Resources Using Fish Communities; Simon, T.P., Ed.; CRC Press: Boca Raton, FL, USA, 2020; pp. 3–16. [Google Scholar] [CrossRef]
  5. Holt, E.A.; Miller, S.W. Bioindicators: Using Organisms to Measure Environmental Impacts. Nature 2011, 3, 8–13. [Google Scholar]
  6. Chapman, D. Water Quality Assessments: A Guide to the Use of Biota, Sediments and Water in Environmental Monitoring, 2nd ed.; CRC Press: London, UK, 2021. [Google Scholar] [CrossRef]
  7. Zacharias, I.; Liakou, P.; Biliani, I. A Review of the Status of Surface European Waters Twenty Years after WFD Introduction. Environ. Process. 2020, 7, 1023–1039. [Google Scholar] [CrossRef]
  8. Resh, V.H. Which Group Is Best? Attributes of Different Biological Assemblages Used in Freshwater Biomonitoring Programs. Environ. Monit. Assess. 2008, 138, 131–138. [Google Scholar] [CrossRef]
  9. Dedić, A.; Gerhardt, A.; Kelly, M.G.; Stanić-Koštroman, S.; Šiljeg, M.; Kalamujić Stroil, B.; Kamberović, J.; Mateljak, Z.; Pešić, V.; Vucković, I.; et al. Innovative Methods and Approaches for WFD: Ideas to Fill Knowledge Gaps in Science and Policy. Water Solut. 2020, 3, 30–42. [Google Scholar]
  10. Feio, M.J.; Hughes, R.M.; Callisto, M.; Nichols, S.J.; Odume, O.N.; Quintella, B.R.; Kuemmerlen, M.; Aguiar, F.C.; Almeida, S.F.P.; Alonso-EguíaLis, P.; et al. The Biological Assessment and Rehabilitation of the World’s Rivers: An Overview. Water 2021, 13, 371. [Google Scholar] [CrossRef]
  11. Villéger, S.; Brosse, S.; Mouchet, M.; Mouillot, D.; Vanni, M.J. Functional Ecology of Fish: Current Approaches and Future Challenges. Aquat. Sci. 2017, 79, 783–801. [Google Scholar] [CrossRef]
  12. Granado-Lorencio, C.; Guisande, C.; Pelayo-Villamil, P.; Manjarrés-Hernández, A.; García-Roselló, E.; Heine, J.; Pérez-Costas, E.; González-Vilas, L.; González-Dacosta, J.; Lobo, J.M. Diversity Dimensions of Freshwater Fish Species around the World. J. Geogr. Inf. Syst. 2021, 13, 1–18. [Google Scholar] [CrossRef]
  13. Chovanec, A.; Hofer, R.; Schiemer, F. Chapter 18 Fish as Bioindicators. In Trace Metals and other Contaminants in the Environment; Elsevier: Amsterdam, The Netherlands, 2003; Volume 6, pp. 639–676. [Google Scholar] [CrossRef]
  14. Roset, N.; Grenouillet, G.; Goffaux, D.; Pont, D.; Kestemont, P. A Review of Existing Fish Assemblage Indicators and Methodologies. Fish. Manag. Ecol. 2007, 14, 393–405. [Google Scholar] [CrossRef]
  15. Karr, J.R. Assessment of Biotic Integrity Using Fish Communities. Fisheries 1981, 6, 21–27. [Google Scholar] [CrossRef]
  16. Karr, J.R.; Fausch, K.D.; Angermeier, P.L.; Yant, P.R.; Schlosser, I.J. Assessing Biological Integrity in Running Waters. A Method and Its Rationale; Illinois Natural History Survey, Champaign, Special Publication: Champaign, IL, USA, 1986; Volume 5, pp. 1–28. [Google Scholar]
  17. Ruaro, R.; Gubiani, É.A. A Scientometric Assessment of 30 Years of the Index of Biotic Integrity in Aquatic Ecosystems: Applications and Main Flaws. Ecol. Indic. 2013, 29, 105–110. [Google Scholar] [CrossRef]
  18. Vadas, R.L.; Hughes, R.M.; Bae, Y.J.; Baek, M.J.; Gonzáles, O.C.B.; Callisto, M.; Carvalho, D.R.D.; Chen, K.; Ferreira, M.T.; Fierro, P.; et al. Assemblage-Based Biomonitoring of Freshwater Ecosystem Health via Multimetric Indices: A Critical Review and Suggestions for Improving Their Applicability. Water Biol. Secur. 2022, 1, 100054. [Google Scholar] [CrossRef]
  19. Karr, J.R.; Larson, E.R.; Chu, E.W. Ecological Integrity Is Both Real and Valuable. Conservat. Sci. Pract. 2022, 4, e583. [Google Scholar] [CrossRef]
  20. Simon, T.P.; Evans, N.T. Environmental Quality Assessment Using Stream Fishes. In Ecosystem Function; Hauer, F.R., Lamberti, G.A., Eds.; Methods in stream ecology; Elsevier: London, UK; Academic Press: San Diego, CA, USA, 2017; pp. 319–334. [Google Scholar]
  21. Allan, J.D.; Castillo, M.M.; Capps, K.A. Trophic Relationships. In Stream Ecology: Structure and Function of Running Waters; Springer: Cham, Switzerland, 2021; pp. 247–284. [Google Scholar]
  22. Rico-Sánchez, A.E.; Rodríguez-Romero, A.J.; Sedeño-Díaz, J.E.; López-López, E.; Sundermann, A. Aquatic Macroinvertebrate Assemblages in Rivers Influenced by Mining Activities. Sci. Rep. 2022, 12, 3209. [Google Scholar] [CrossRef]
  23. Vitecek, S.; Johnson, R.; Poikane, S. Assessing the Ecological Status of European Rivers and Lakes Using Benthic Invertebrate Communities: A Practical Catalogue of Metrics and Methods. Water 2021, 13, 346. [Google Scholar] [CrossRef]
  24. Sama, A.H.; Yuzir, M.A.; Azman, S. Water Quality Assessment Using Selected Macroinvertebrate Based Indices and Water Quality Index of Sungai Air Hitam Selangor. Trop. Aqua. Soil Pollut. 2024, 4, 143–156. [Google Scholar] [CrossRef]
  25. Munfarida, I.; Munir, M. Comparative Assessment of River Water Quality Based on Macro-Invertebrate Community Structures as Biological Indicators in Three Rivers of East Java; Bogor, Indonesia. AIP Conf. Proc. 2023, 2913, 040001. [Google Scholar] [CrossRef]
  26. Allan, J.D.; Castillo, M.M.; Capps, K.A. Primary Producers. In Stream Ecology: Structure and Function of Running Waters; Springer: Cham, Switzerland, 2021; pp. 141–176. [Google Scholar]
  27. Masouras, A.; Karaouzas, I.; Dimitriou, E.; Tsirtsis, G.; Smeti, E. Benthic Diatoms in River Biomonitoring—Present and Future Perspectives within the Water Framework Directive. Water 2021, 13, 478. [Google Scholar] [CrossRef]
  28. Madhankumar, M.; Venkatachalapathy, R.A. Biological Diatom Indices Based Preliminary Assessment of Water Quality of Thamirabarani River, Southern India. Int. J. Environ. Anal. Chem. 2024, 104, 9370–9382. [Google Scholar] [CrossRef]
  29. Yan, G.; Yin, X.; Wang, X.; Huang, M. Can Relative Abundance of Diatoms (RAD) Serve as an Indicator for the Water Quality Assessment in River-Connected Lakes? A Case Study at Dongting Lake. Environ. Sci. Eur. 2024, 36, 106. [Google Scholar] [CrossRef]
  30. Lobo, E.A.; Heinrich, C.G.; Schuch, M.; Wetzel, C.E.; Ector, L. Diatoms as Bioindicators in Rivers. In River Algae; Necchi, O., Jr., Ed.; Springer International Publishing: Cham, Switzerland, 2016; pp. 245–271. [Google Scholar] [CrossRef]
  31. Yeakley, A.J.; Ervin, D.; Chang, H.; Granek, E.F.; Dujon, V.; Shandas, V.; Brown, D. Ecosystem Services of Streams and Rivers. In River Science; Gilvear, D.J., Greenwood, M.T., Thoms, M.C., Wood, P.J., Eds.; Wiley: Hoboken, NJ, USA, 2016; pp. 335–352. [Google Scholar] [CrossRef]
  32. Maftei, A.E.; Iancu, O.G.; Buzgar, N. Assessment of Minor Elements Contamination in Bistriţa River Sediments (Upstream of Izvorul Muntelui Lake, Romania) with the Implication of Mining Activity. J. Geochem. Explor. 2014, 145, 25–34. [Google Scholar] [CrossRef]
  33. Maftei, A.E.; Dill, H.G.; Buzatu, A.; Iancu, O.G.; Buzgar, N.; Andráš, P. Chemical and Mineralogical Composition of Fluvial Sediments (Bistriţa River, Romania): Geogenic vs. Anthropogenic Input into Rivers on Its Way through Mining Areas. Geochemistry 2018, 78, 385–395. [Google Scholar] [CrossRef]
  34. Gheţeu, D.; Neagu, A.; Miron, I.; Erhan, M. Functional Communities of Benthic Macroinvertebrates from the Superior Catchment Area of the Bistriţa River. Sci. Ann. UAIC 2006, LII, 59–66. [Google Scholar]
  35. Battes, K.W. Influence of the Hydrotechnical Development and of Bistriţa River’s Pollution on the Natural Fish Population. SSRB 1999, 4, 283–294. [Google Scholar]
  36. Stoica, I.; Battes, K.W.; Pricope, F.; Prisecaru, M. Research on the Status of the Fish Communities of the Upper Course of Bistriţa River. SSRB 2013, 22, 66–73. [Google Scholar]
  37. Romanescu, G.; Bounegru, O. Ice Dams and Backwaters as Hydrological Risk Phenomena—Case Study: The Bistriţa River; Upstream of the Izvorul Muntelui Lake (Romania); WIT Transactions on Ecology and the Environment: Dubrovnik, Croatia, 2012; pp. 167–178. [Google Scholar] [CrossRef]
  38. NATURA 2000 Expert Viewer. 2025. Available online: https://natura2000.eea.europa.eu/ (accessed on 23 July 2025).
  39. QGIS Development Team QGIS Geographic Information System. Open Source Geospatial Foundation Project. 2024. Available online: http://qgis.org (accessed on 14 September 2025).
  40. Paisley, M.F.; Trigg, D.J.; Walley, W.J. Revision of the Biological Monitoring Working Party (BMWP) Score System: Derivation of Present-only and Abundance-related Scores from Field Data. River Res. Appl. 2014, 30, 887–904. [Google Scholar] [CrossRef]
  41. Gibson, R.B.; Fonseca, A. Trade-Offs in Impact Assessment Design and Implementation. In Handbook of Environmental Impact Assessment; Research handbooks on impact assessment series; Edward Elgar Publishing: Cheltenham, UK; Northampton, MA, USA, 2022; pp. 233–257. [Google Scholar] [CrossRef]
  42. Kottelat, M.; Freyhof, J. Handbook of European Freshwater Fishes; Publications Kottelat, Cornol and Freyhof, Berlin: Cornol, Switerland, 2007; pp. 1–646. [Google Scholar]
  43. Iftime, A.; Oţel, V. An Annotated Systematical Checklist of the Romanian Ichthyofauna. Zootaxa 2025, 5654, 1–64. [Google Scholar] [CrossRef]
  44. Begić, V.; Sertić Perić, M.; Hančić, S.; Marchiotti, I.; Gabud, T.; Šestak Panižić, I.; Radanović, I.; Korać, P. Effectiveness of Five Different Solutions for Preserving Aquatic Insects Commonly Used in Morphological and Stream Ecology Studies. Biologia 2022, 78, 1011–1026. [Google Scholar] [CrossRef]
  45. Blanco, S. Diatom Taxonomy and Identification Keys. In Modern Trends in Diatom Identification: Fundamentals and Applications; Cristóbal, G., Blanco, S., Bueno, G., Eds.; Springer International Publishing: Cham, Switerland, 2020; pp. 25–38. [Google Scholar] [CrossRef]
  46. Guiry, M.D.; Guiry, G.M.; AlgaeBase. World-Wide Electronic Publication, University of Galway. 2025. Available online: https://www.algaebase.org (accessed on 7 August 2025).
  47. Kriska, G. Freshwater Invertebrates in Central Europe: A Field Guide; Springer International Publishing: Cham, Switerland, 2022; pp. 1–527. [Google Scholar] [CrossRef]
  48. GBIF Secretariat. Backbone Taxonomy. Checklist Dataset. 2023. Available online: https://doi.org/10.15468/39omei (accessed on 8 June 2025).
  49. Šmilauer, P.; Lepš, J. Multivariate Analysis of Ecological Data Using Canoco 5, 2nd ed.; Cambridge University Press: Cambridge, UK; New York, NY, USA, 2014; pp. 1–362. [Google Scholar]
  50. ter Braak, C.J.F.; Šmilauer, P. Canoco Reference Manual and User’s Guide: Software for Ordination, Version 5.0; Microcomputer Power: Ithaca, NY, USA, 2012. [Google Scholar]
  51. R Core Team. R: A Language and Environment for Statistical Computing; R Foundation for Statistical Computing: Vienna, Austria, 2025; Available online: https://www.R-project.org (accessed on 21 July 2025).
  52. Peterson, B.G.; Carl, P. PerformanceAnalytics: Econometric Tools for Performance and Risk Analysis. 2024. Available online: https://CRAN.R-project.org/package=PerformanceAnalytics (accessed on 21 July 2025).
  53. Coste, M.; Boutry, S.; Tison-Rosebery, J.; Delmas, F. Improvements of the Biological Diatom Index (BDI): Description and Efficiency of the New Version (BDI-2006). Ecol. Indic. 2009, 9, 621–650. [Google Scholar] [CrossRef]
  54. Maraşlıoğlu, F.; Bektaş, S.; Özen, A. Comparative Performance of Physicochemical-Based and Diatom-Based Metrics in Assessing the Water Quality of Mert Stream, Turkey. J. Ecol. Eng. 2020, 21, 18–31. [Google Scholar] [CrossRef]
  55. Ghetti, P.F. Manuale Di Applicazione Indice Biotico Esteso (IBE). I Macroinvertebrati Nel Controllo Della Qualità Degli Ambienti di Acque Correnti; Provincia Autonoma di Trento, Agenzia provinciale per la protezione dell’ambiente: Trento, Italy, 1997; pp. 1–22. (In Italian) [Google Scholar]
  56. Kelly, M.G.; Adams, C.; Graves, A.C.; Jamieson, J.; Krokowski, J.; Lycett, E.; Murray-Bligh, J.; Pritchard, S.; Wilkins, C. The Trophic Diatom Index: A User’s Manual; Environmental Agency: Bristol, UK, 2001; pp. 1–135. [Google Scholar]
  57. Gheţeu, D.; Aoncioaie, C.; Neagu, A.; Miron, I. Aspects of the Anthropic Impact and Pollution from the Superior Catchment Area of Bistriţa River. Sci. Ann. UAIC 2007, LIII, 251–256. [Google Scholar]
  58. Logez, M.; Bady, P.; Melcher, A.; Pont, D. A Continental-scale Analysis of Fish Assemblage Functional Structure in European Rivers. Ecography 2013, 36, 80–91. [Google Scholar] [CrossRef]
  59. Acreman, M.; Hughes, K.A.; Arthington, A.H.; Tickner, D.; Dueñas, M. Protected Areas and Freshwater Biodiversity: A Novel Systematic Review Distils Eight Lessons for Effective Conservation. Conserv. Lett. 2020, 13, e12684. [Google Scholar] [CrossRef]
  60. Stefanidis, K.; Oikonomou, A.; Stoumboudi, M.; Dimitriou, E.; Skoulikidis, N. Do Water Bodies Show Better Ecological Status in Natura 2000 Protected Areas Than Non-Protected Ones?—The Case of Greece. Water 2021, 13, 3007. [Google Scholar] [CrossRef]
  61. De Mello, K.; Taniwaki, R.H.; Macedo, D.R.; Leal, C.G.; Randhir, T.O. Biomonitoring for Watershed Protection from a Multiscale Land-Use Perspective. Diversity 2023, 15, 636. [Google Scholar] [CrossRef]
  62. Bănăduc, D.; Curtean-Bănăduc, A.; Barinova, S.; Lozano, V.; Afanasyev, S.; Leite, T.; Branco, P.; Gomez Isaza, D.; Geist, J.; Tegos, A.; et al. Multi-Interacting Natural and Anthropogenic Stressors on Freshwater Ecosystems: Their Current Status and Future Prospects for 21st Century. Water 2024, 16, 1483. [Google Scholar] [CrossRef]
  63. Stoffels, R.J.; Rehwinkel, R.A.; Price, A.E.; Fagan, W.F. Dynamics of Fish Dispersal during River-Floodplain Connectivity and Its Implications for Community Assembly. Aquat. Sci. 2016, 78, 355–365. [Google Scholar] [CrossRef]
  64. Williams, J.E.; Gregory, S.; Wildman, R. Fish Assemblage Structure and Habitat Relationships of a Large Floodplain River in Western North America. River Res. Apps. 2024, 40, 809–820. [Google Scholar] [CrossRef]
  65. Ihuț, A.; Zitek, A.; Weiss, S.J.; Ratschan, C.; Holzer, G.; Kaufmann, T.; Cocan, D.; Constantinescu, R.; Mireșan, V. Danube Salmon (Hucho hucho) in Central and South Eastern Europe: A review for the development of an international program for the rehabilitation and conservation of Danube Salmon populations. Bul. Univ. Agric. Sci. Vet. Med. Cluj-Napoca Anim. Sci. Biotechnol. 2014, 71, 86–101. [Google Scholar] [CrossRef]
  66. Curtean-Bănăduc, A.; Marić, S.; Gábor, G.; Didenko, A.; Rey Planellas, S.; Bănăduc, D. Hucho Hucho (Linnaeus, 1758): Last Natural Viable Population in the Eastern Carpathians—Conservation Elements. Turk. J. Zool. 2019, 43, 215–223. [Google Scholar] [CrossRef]
  67. Cocan, D.; Mireşan, V.; Constantinescu, R.; Popescu, F.; Uiuiu, P.; Ihuţ, A.; Nicula, A.S.; Laţiu, C. Ichthyofaunal Diversity of Ruscova River—A Danube Salmon (Hucho hucho, Linnaeus 1758) Spawning Tributary; Proceedings on the Multidisciplinary Conference on Sustainable Development; Filodiritto Editore: Bologna, Italy, 2020; pp. 251–260. [Google Scholar]
  68. Danet, A.; Giam, X.; Olden, J.D.; Comte, L. Past and Recent Anthropogenic Pressures Drive Rapid Changes in Riverine Fish Communities. Nat. Ecol. Evol. 2024, 8, 442–453. [Google Scholar] [CrossRef]
  69. Kirk, M.A.; Rahel, F.J.; Laughlin, D.C. Environmental Filters of Freshwater Fish Community Assembly along Elevation and Latitudinal Gradients. Global Ecol. Biogeogr. 2022, 31, 470–485. [Google Scholar] [CrossRef]
  70. Hering, D.; Johnson, R.K.; Kramm, S.; Schmutz, S.; Szoszkiewicz, K.; Verdonschot, P.F.M. Assessment of European Streams with Diatoms, Macrophytes, Macroinvertebrates and Fish: A Comparative Metric-based Analysis of Organism Response to Stress. Freshw. Biol. 2006, 51, 1757–1785. [Google Scholar] [CrossRef]
  71. De Castro-Català, N.; Dolédec, S.; Kalogianni, E.; Skoulikidis, N.T.; Paunovic, M.; Vasiljević, B.; Sabater, S.; Tornés, E.; Muñoz, I. Unravelling the Effects of Multiple Stressors on Diatom and Macroinvertebrate Communities in European River Basins Using Structural and Functional Approaches. Sci. Total Environ. 2020, 742, 140543. [Google Scholar] [CrossRef]
  72. Wright, I.A.; Ryan, M.M. Impact of Mining and Industrial Pollution on Stream Macroinvertebrates: Importance of Taxonomic Resolution, Water Geochemistry and EPT Indices for Impact Detection. Hydrobiologia 2016, 772, 103–115. [Google Scholar] [CrossRef]
  73. De Jonge, M.; Vandevijver, B.; Blust, R.; Bervoets, L. Responses of Aquatic Organisms to Metal Pollution in a Lowland River in Flanders: A Comparison of Diatoms and Macroinvertebrates. Sci. Total Environ. 2008, 407, 615–629. [Google Scholar] [CrossRef]
  74. Markert, N.; Guhl, B.; Feld, C.K. Water Quality Deterioration Remains a Major Stressor for Macroinvertebrate, Diatom and Fish Communities in German Rivers. Sci. Total Environ. 2024, 907, 167994. [Google Scholar] [CrossRef]
  75. Wu, J.; Mao, R.; Li, M.; Xia, J.; Song, J.; Cheng, D.; Sun, H. Assessment of Aquatic Ecological Health Based on Determination of Biological Community Variability of Fish and Macroinvertebrates in the Weihe River Basin, China. J. Environ. Manag. 2020, 267, 110651. [Google Scholar] [CrossRef]
  76. Fierro, P.; Valdovinos, C.; Vargas-Chacoff, L.; Bertrán, C.; Arismendi, I. Macroinvertebrates and Fishes as Bioindicators of Stream Water Pollution. In Water Quality; Tutu, H., Ed.; InTech: London, UK, 2017. [Google Scholar] [CrossRef]
  77. Cheimonopoulou, M.T.; Bobori, D.C.; Theocharopoulos, I.; Lazaridou, M. Assessing Ecological Water Quality with Macroinvertebrates and Fish: A Case Study from a Small Mediterranean River. Environ. Manag. 2011, 47, 279–290. [Google Scholar] [CrossRef] [PubMed]
  78. Herlihy, A.T.; Sifneos, J.C.; Hughes, R.M.; Peck, D.V.; Mitchell, R.M. The Relation of Lotic Fish and Benthic Macroinvertebrate Condition Indices to Environmental Factors across the Conterminous USA. Ecol. Indic. 2020, 112, 105958. [Google Scholar] [CrossRef] [PubMed]
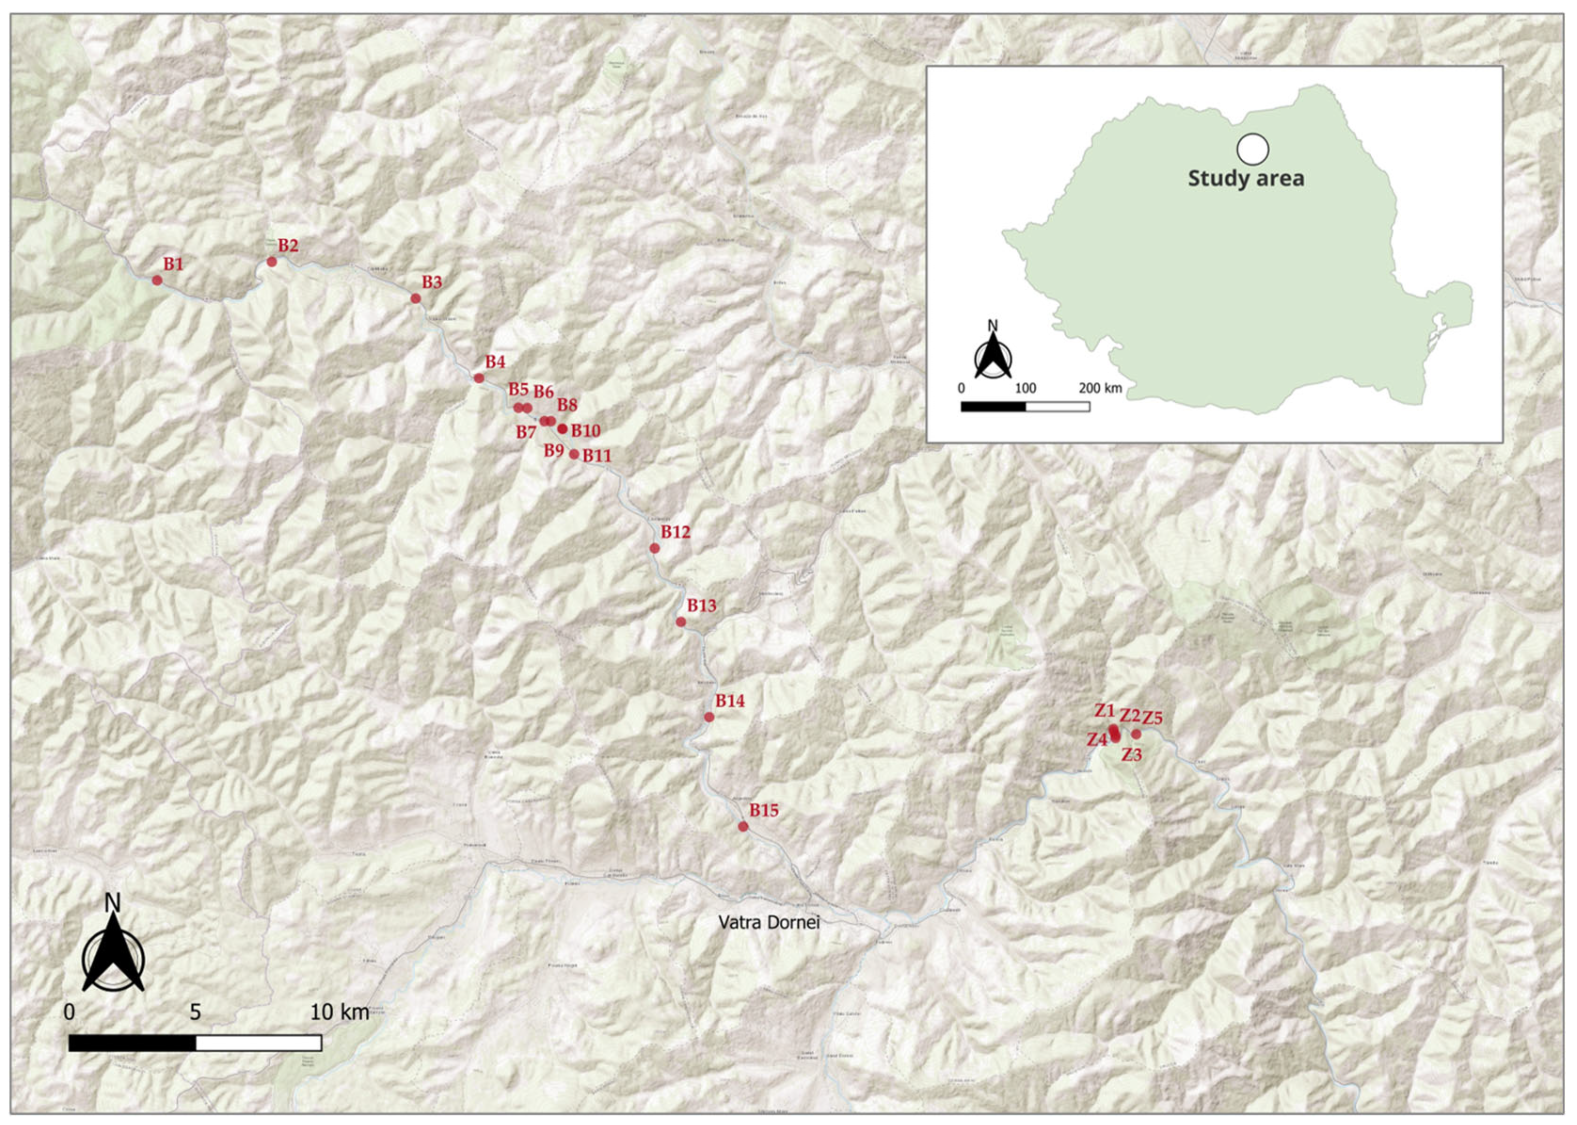
Figure 1. Location of the 20 sampling sites in ROSAC0010 Bistrița Aurie (B1–B15) and ROSAC0196 Pietrosul Broștenilor—Cheile Zugrenilor (Z1–Z5) (map source: QGIS Development Team [39] (site abbreviations as in Table S1).
Fishes 10 00467 g001
Figure 2. Principal Coordinate Analysis (PCoA) plot showing the ordination of the sampling sites (B1–B15; Z1–Z5) based on abiotic parameters (Max_w—maximum width (m); Max_d—maximum depth (m); Temp—water temperature (°C); Cnd—water conductivity (µS/cm), Oxg—dissolved oxygen (mg/L); Fdp—existing floodplain (from 0 none to 1 small, 2 medium, 3 large), Elv—elevation (m a.s.l.), Imp—impact score (on a normalized scale, ranging from 0 to 1); bank vegetation: T—trees, S—shrubs, H—herbs; water turbidity: Tra—transparent, Med—medium, Tur—turbid; river geomorphology: Sin—sinuous, Lin—linear, Mea—meandered; sediments: Rif—riffle, R/P—riffle/pool); explained variation (cumulative, axis 1 & 2): 85.34; adjusted explained variation: 92.04%; the Bray–Curtis distance was used (site abbreviations as in Table S1).
Fishes 10 00467 g002
Figure 3. Canonical Correspondence Analysis CCA ordination diagram with fish species as response variables (E.dan: Eudontomyzon danfordi, A.bip: Alburnoides bipunctatus, B.pet: Barbus petenyi, C.nas: Chondrostoma nasus, G.obt: Gobio obtusirostris, P.pho: Phoxinus phoxinus, S.cep: Squalius cephalus, C.elo: Cobitis elongatoides, C.poe: Cottus poecilopus, B.bar: Barbatula barbatula, S.tru: Salmo trutta, T.thy: Thymallus thymallus, and environmental parameters as explanatory variables (Cnd—water conductivity (µS/cm), Fdp—existing floodplain (from 0 none to 1 small, 2 medium, 3 large), Elv—elevation (m a.s.l.), Imp—impact score, Oxg—dissolved oxygen (mg/L)) (site abbreviations B1–B15, Z1–Z5 as in Table S1) (adjusted explained variation is 17.77%, Monte Carlo permutation test results on all axes: pseudo-F = 1.8, p = 0.026).
Fishes 10 00467 g003
Figure 4. Redundancy Analysis RDA biplot with fish community parameters as response variables (fi_IBI: fish-based IBI score; fi_H: Shannon-Wiener diversity of fish communities; fi_tol_sp: number of tolerant species; fi_intol_sp: number of intolerant species; fi_sm_ind: number of small individuals (<15 cm total length); fi_lg_ind: number of large individuals (>15 cm total length)) and environmental explanatory variables (Cnd—water conductivity (µS/cm), Fdp—existing floodplain (from 0 none to 1 small, 2 medium, 3 large), Elv—elevation (m a.s.l.), Imp—impact score) (site abbreviations B1–B15, Z1–Z5 as in Table S1) (adjusted explained variation is 23.70%, Monte Carlo permutation test results on all axes: pseudo-F = 2.5, p = 0.009).
Fishes 10 00467 g004
Figure 5. Redundancy Analysis RDA ordination diagram with biotic community parameters as response variables (fi_IBI: fish-based IBI score; fi_H: Shannon-Wiener diversity of fish communities; zb_MNWH: zoobenthos MNWH-PO score; zb_H: Shannon-Wiener diversity of zoobenthos families; dt_DBI: diatom-based DBI score; dt_H: Shannon-Wiener diversity of diatom communities) and the impact score (Imp) as explanatory variable in the five sampling sites used for comparative analyses: B2, B3, B15, Z3 and Z5 (site abbreviations as in Table S1); icons depicting water quality based on the biotic indices selected for the present study: left—diatoms; middle—zoobenthos; right—fish; the colors correspond to water quality/biological integrity classes (blue: high/excellent; green: good; yellow: moderate/fair; orange: poor; red: bad/very poor) (adjusted explained variation is 21.30%, Monte Carlo permutation test results on all axes: pseudo-F = 2.1, p = 0.049).
Fishes 10 00467 g005
Table 1. Description of the main pressures identified in the study area, the impacts they caused, and their importance value, used to calculate the impact score for each sampling site (ranging on a scale from 0: not important, to 1: very important) (site abbreviations as in Table S1).
PressuresCodeImpact(s) CausedDetailsLocationImportance
Barriers across the waterwayBARNo longitudinal connectivity along the river, isolation of fish populationsZugreni weir.Z2, Z3, Z40.2
Barriers: EmbankmentEMBNo lateral connectivity between the river and the riparian zone. Impacts in the riparian zone, like decreased food resources, lack of riparian vegetation, lack of suitable hiding places for wildlife. Most embankments along the Bistrița Aurie River were gabions. Concrete embankments in Ciocănești locality (47°28′58.14″ N, 25°16′34.68″ E).B5, B7, B11, B14, B15, Z40.2
Diffuse pollution due to agriculture and forestry, including pisciculturePAFDiffuse leaks of possible toxic elements in the hyporheic zone. The toxic elements that might find their way into the river include pesticides used in agriculture, biocides used in fighting the attacks of Hylobius abietis (Insecta, Curculionidae), different substances coming from the local fish farms. B1–B15 0.3
Diffuse pollution due to domestic waste watersPDWDiffuse leaks of possible toxic elements in the hyporheic zone. Caused by undersized/no sewage in human settlements near the Bistrița Aurie River in ROSAC0010, together with industrial or waste deposits located in the river proximity. In ROSAC0196, only the sites located downstream of the touristic chalet Zugreni might be affected. Organic pollution was also described by [57] B1–B15, Z2–Z30.5
Diffuse pollution due to mining activitiesPMAInput of heavy metals into the river (Fe, Mn, Cu, Cr, Zn), even if the mines themselves are closedThe manganese exploitation from Dadu, Oiţa and Tolovanu, the iron and manganese exploitation from Arșița-Iacobeni, or the manganese and polimetalic sulphures exploration from Gândacu -Suhărzelul Mare, now closed, were all located between Cârlibaba and Iacobeni [32,33] B3–B150.5
PoachingPOADeclining fish population. Habitat destruction.Large species like Hucho hucho were affectedB1–B15, Z1–Z50.1
Resource exploitation—forestREFIndirect impacts on river communities, siltationDecreased vegetation buffer in the catchment area leads to higher sediment input in the river, affecting the spawning grounds and food resources of fishes. Log processing techniques can affect water quality by increasing turbidity (e.g., the transport of logs, known as “corhănit” in the area) or by accumulation of by-products from the sawmills located near the river (e.g., Valea Stânei) B1–B15, Z1–Z50.1
Resource exploitation—sedimentsRESSediment removal. Habitat destruction.Not a common activity in the area. Z10.1
Uncontrolled waste disposalUWDIndirect impacts on river communities, possible toxic leaks.Accumulation of microplastics, non-biodegradable wastes and possible toxic effects of harmful substances from the discarded bottles. Aesthetic issues. B1–B15, Z1–Z50.1
Disclaimer/Publisher’s Note: The statements, opinions and data contained in all publications are solely those of the individual author(s) and contributor(s) and not of MDPI and/or the editor(s). MDPI and/or the editor(s) disclaim responsibility for any injury to people or property resulting from any ideas, methods, instructions or products referred to in the content.