Article

Preliminary Assessment of Age and Growth of the Red Swamp Crayfish Procambarus clarkii [Girard, 1852] in the River Nile in Egypt by Direct and Indirect Methods

1
Department of Zoology, Faculty of Science, Ain Shams University, Abbassia, Cairo 11566, Egypt
2
Department of Biological Sciences, University of New Brunswick (Saint John), Saint John, NB E2L 4L5, Canada
3
Otoliths-Lada Canada, Halifax, NS B3S 1E5, Canada
4
National Institute of Oceanography and Fisheries (NIOF), Suez 43511, Egypt
*
Author to whom correspondence should be addressed.
Fishes 2025, 10(9), 453; https://doi.org/10.3390/fishes10090453
Submission received: 10 July 2025 / Revised: 19 August 2025 / Accepted: 25 August 2025 / Published: 5 September 2025
(This article belongs to the Special Issue Age Determination of Aquatic Animals)

Abstract

The red swamp crayfish (Procambarus clarkii) is an exceptionally invasive species introduced into the Egyptian freshwater ecosystems in the 1980s for aquaculture purposes. Despite its ecological and economic significance, the age distribution of this species has not been assessed properly using an accurate method. This study is the first to validate the use of growth band counts in the mesocardiac ossicles as a direct technique for age determination in P. clarkii using 166 known-age individuals reared under various temperature regimes. The findings confirm that band counts represent age rather than number of molts. Field comparisons between northern (Giza) and southern (Aswan) Nile populations revealed maximum longevities of six and seven years, respectively, using direct methods, while indirect size–frequency analysis underestimated age at three years. Growth rates were higher at 25 °C compared to 32 °C, both in the lab and in situ. Males matured at larger sizes than females, though age at sexual maturity averaged one year in both regions. This study demonstrates the superiority of direct aging over traditional indirect aging methods, offering critical insights for managing crayfish populations and ensuring sustainable fisheries in the River Nile in Egypt.
Key Contribution: This study provides the first validated estimate of the age and growth of Procambarus clarkii using a direct method. It confirms the accuracy of gastric mill growth bands as annual age markers through controlled lab rearing. The findings offer key understandings of the species’ longevity and maturity, supporting their fishery management in the River Nile, Egypt.

1. Introduction

The red swamp freshwater crayfish (Procambarus clarkii), hereafter referred to as “red swamp crayfish”, is one of the most invasive and prevalent crayfish in the world [1]. It has received significant interest from fisheries biologists, decision makers, and the general public [2]. The red swamp crayfish can be found in the southern and central regions of the United States, occupying diverse aquatic environments including rice fields, permanent lakes, rivers, irrigation systems, and seasonal swamps [3]. Owing to its exceptional acclimatization in the wild, its populations have proliferated substantially and achieved dominance in various ecosystems [4]. It has been introduced to all continents excluding Antarctica and Australia [5,6]. It has been dispersed from South America [7,8] to Europe [9,10], Asia [11,12], and Africa [13,14].
The great ability of red swamp crayfish to invade new habitats has been attributed to their rapid growth, high rate of reproduction, and adaptable feeding strategy [15]. In addition, individual crayfish species have also been observed to emerge from streams and traverse land, surviving terrestrial environments [16,17]. Their presence also affects aquatic ecosystems in various manners, such as through competition, predation, and the transmission of pathogens and diseases [18]. Their burrowing behavior also poses socio-economic issues, as it can lead to soil nutrient mobilization, erosion of riverbanks [19], and sediment discharge into drainage ditches and canals [20].
The red swamp crayfish were introduced into Egyptian streams in the early 1980s for aquaculture. They have invaded all freshwater ecosystems of the River Nile [21,22]. Several surveys were conducted in Egypt to investigate the distribution of the species in the River Nile and its main branches. These surveys revealed that the species established sustainable populations in various locations along the Nile Delta [23,24,25]. In their new habitats in Egypt, red swamp crayfish were found to cause damage both to the fisheries by destroying the nets of fishers and consuming eggs and fry of Nile Tilapia and to the ecosystem, by digging burrows that caused severe damage to riverbanks [26]. The biology and ecology of this invasive species in Egypt’s aquatic environment has been comprehensively studied [27]; however, the age and growth of the species have yet to be investigated.
The assessment of various significant life traits of fish, such as lifespan, growth rate, mortality, and age at sexual maturity, relies on age data. Furthermore, it is essential for the stock assessment of economically and environmentally important species. Growth bands deposited on hard structures are frequently used to measure the age of aquatic species. These include the shells of bivalves [28] and the skeleton, vertebrae, scales, and otoliths of fish [29,30]. In crustaceans, their rigid exoskeleton prevents continuous growth. Instead, these arthropods undergo a process known as molting (ecdysis), and each two consecutive molts are separated by an intermolt period [31]. During ecdysis, the animals regularly shed their old integument and develop a new, larger one to promote growth [31,32]. Throughout the intermolt period, the crustacean’s exoskeleton remains stiff, thereby limiting further growth until the next molt. It undergoes shedding at each molt, followed by a brief phase of rapid and significant growth before the integument hardens [31].
Because it is known that all calcified structures are lost during each molt, the frequent shedding of the hard integument limited research on age determination in crustaceans. Accordingly, research on crustacean aging has been restricted to indirect approaches, such as size–frequency analysis [33], and the utilization of brain pigmentation (lipofuscin) accumulation as an age biomarker [34].
Employing band counts deposited on the gastric mill ossicles that line the stomach to determine the age of crustaceans is a novel direct age determination method that has created considerable discussion in the past decade [35]. It has been proposed that examining the growth lines in the ossicles of the gastric mill in various crustaceans may help determine their age [35,36,37,38,39]. When cross-sectioned, the four primary calcified ossicles that make up the stomach mill, a gizzard-like organ, exhibit distinct dark and translucent bands in the endocuticle, which may serve as indicators of age [35,36,37,38,39,40]. When this technique was applied to more than 10 crustacean species, the number of bands was found to proportionally increase with body size, and it was confirmed that these bands do not correspond to the animal’s molting events [35,41,42]. For example, two independent investigations using specimens of known age have produced results supporting the use of these bands as direct measure to the absolute age of several crustacean animals, including the American lobster (Homarus americanus) [43] and Caribbean spiny lobster (Panulirus argus) [37].
Due to the absence of any explanation for band formation and the complete replacement of ossicles after each molt, the use of these bands as proper indicators of age remains a subject of debate [44,45,46]. Alternatively, the bands were previously suggested to be artifacts of the sectioning procedure [47] or considered as a link between cuticle thickness and body size, rather than as indicators of absolute age [45]. Also, the exact mechanism of gastric mill band formation remains unknown and requires further investigations.
Few studies have been conducted to investigate the change in growth of different crayfish species at different temperatures. For example, in China, the change in size of the red swamp crayfish was followed over 30 days in a lab at different temperatures [48]. Also, the growth of the same species in the fall and winter was compared in Louisiana, USA, using size frequency analysis [49]. In addition to this species, the effect of temperature on the ringed crayfish (Faxonius neglectus neglectus) was investigated in Oklahoma, USA [42]. Moreover, the growth of the white tubercled crayfish (Procambarus spiculifer) was assessed using a capture and recapture experiment in Georgia, USA [50]. The aim of this study is to fill in the knowledge gap regarding the growth and age of red swamp crayfish using direct and indirect age determination methods in vitro and in situ. Accordingly, the objectives of this study were to (1) validate the band counts in gastric mills as indicators of age using known-age individuals raised in a lab under different temperature treatments, (2) compare the age–at–size obtained from band counts in the gastric mill band counts (direct method) and size–frequency (indirect method) for crayfish collected from two thermally different locations, and (3) assess the age– and size–at– sexual maturity in the species across the two regions.

2. Materials and Methods

2.1. Laboratory Experiment

In early November of 2018, during the fall reproductive season [13], 20 ovigerous females were collected from Giza city (approximately 40 km south of Cairo, Figure 1). The females were carefully transferred in aerated plastic tanks to the Aquatic Ecology Laboratory at Ain shams University in Cairo. Upon arrival, they were individually housed in plastic containers (30 cm × 30 cm × 18 cm). Each box was filled with dechlorinated tap water equipped with aeration pumps and artificial 15 cm × 15 cm PVC pipe shelters. The mean water temperature inside the containers was 25 °C (±1 SD), with pH levels ranging from 7 to 7.7 (7.3 ± 0.1 SD) and dissolved oxygen values between 5.0 and 7.0 mg/L (6.2 ± 0.3 SD). The attached eggs on all females successfully hatched in mid-November 2018. The hatchlings remained with their mother for the first two weeks.
Prior to the experiment, the juveniles were separated from their mothers and underwent an acclimation period for about one month, in line with previous observations [51,52]. During acclimation, they were fed small, boiled cubes of carrots and zucchini twice daily, once in the early morning and again in the late afternoon. Uneaten food was removed one hour after feeding [53]. Following the acclimation period, the strongest and healthiest juveniles (i.e., crayfishes with unbroken appendages, uniform sizes, active mobility, and with a high appetite) were selected for long-term rearing in the experimental work.
The experimental treatments began in early February 2019 with 192 juvenile red swamp crayfish; each was approximately 2.5 months old. A few hours after adding 48 animals to each temperature treatment, a few individuals died, and the experiment started as follows: (i) ambient temperature between 12 and 25 °C (39 juveniles); (ii) 25 °C (43 juveniles); (iii) 28 °C (48 juveniles); and (iv) 32 °C (36 juveniles). Each juvenile was housed in a separate 10 cm × 10 cm × 10 cm tank. To ensure proper water circulation and aeration, the containers possessed two circular windows on opposite sides, covered with 1 mm mesh plastic screens. To facilitate a semi-communal environment, groups of eight small tanks were placed inside larger 50 cm × 35 cm × 40 cm plastic containers. The larger containers were equipped with an aeration pump.
Ambient lab temperature (air temperature) fluctuates significantly between winter and summer, from 12 °C to 40 °C. Therefore, air conditioning was used during the summer months to prevent overheating and to keep the maximum air temperature in the lab at 25 °C. During the winter months, the air conditioning was not used, resulting in a drop in the lab ambient temperature to 12 °C. To assess the effect of temperature on the growth of the animals, experiments were performed for four different temperature treatments. The first treatment was the lab ambient temperature (12–25 °C) and the second, third, and fourth temperature treatments were 25 °C, 28 °C, and 32 °C, respectively, and these experiments were performed using a stainless-steel electric water heater set at the desired temperature. Additionally, the water in the containers always maintained dissolved oxygen contents varying from 5.0 to 7.0 mg/L (mean = 6.2 ± 0.3); pH levels ranging from 7 to 7.7 (mean = 7.3 ± 0.1 SD); and a 12:12 h light–dark cycle sustained throughout the period of the experiment to mimic the natural photoperiod cycle [54].
To ensure that the juveniles of red swamp crayfish received a nutritionally balanced diet that supported optimal health and growth throughout the experiment, they were fed high-quality 2 mm shrimp pellets (produced by Skritting Egypt fish feed factory®, Sharkia, Egypt) once every 24 h. This feed formulation comprised essential nutrients, including a minimum of 38% crude protein, a minimum of 8% fat, a maximum of 5.9% fiber, and a minimum of 1.2% phosphorus, along with a mixture of vitamins and minerals. The protein and fat content in these pellets were sufficient to fulfill the nutritional needs of the species [55,56,57]. To maintain cleanliness, uneaten feed and feces were siphoned off every three days.
Each red swamp crayfish individual was marked using a distinct color tag applied to the dorsal surface of the cephalothorax with permanent markers in blue, green, or yellow. Daily checks were conducted to verify the tag visibility, and in cases of molting, the individual was promptly retagged after the exoskeleton had fully hardened. The number of molts for each specimen was precisely recorded, and the exuviae were removed after each molt. The molt frequency of each individual was compared with the number of growth bands in their gastric mill ossicles to assess whether band counts are an indicator of molt frequency.

2.1.1. Carapace Length Frequency Analysis

To evaluate growth rates, the carapace length (CL; mm) of each individual was measured 2 days post-molt. This 2-day interval ensured that the soft post-molt exoskeleton had adequately hardened, thereby minimizing the risk of mortality during the handling and measurement processes. Any individuals that died during the experiment were also measured at the time of death. CL defines the length from the apex of the rostrum to the posterior margin of the carapace along the mid-dorsal axis of the body (Figure S1) and was recorded to the nearest millimeter. After approximately one year of the experiment, all individuals were larger than 25 mm in carapace length and were transferred to larger 20 cm × 15 cm × 10 cm containers. At this stage, each larger communal container held four individual containers to provide sufficient space for continued growth.
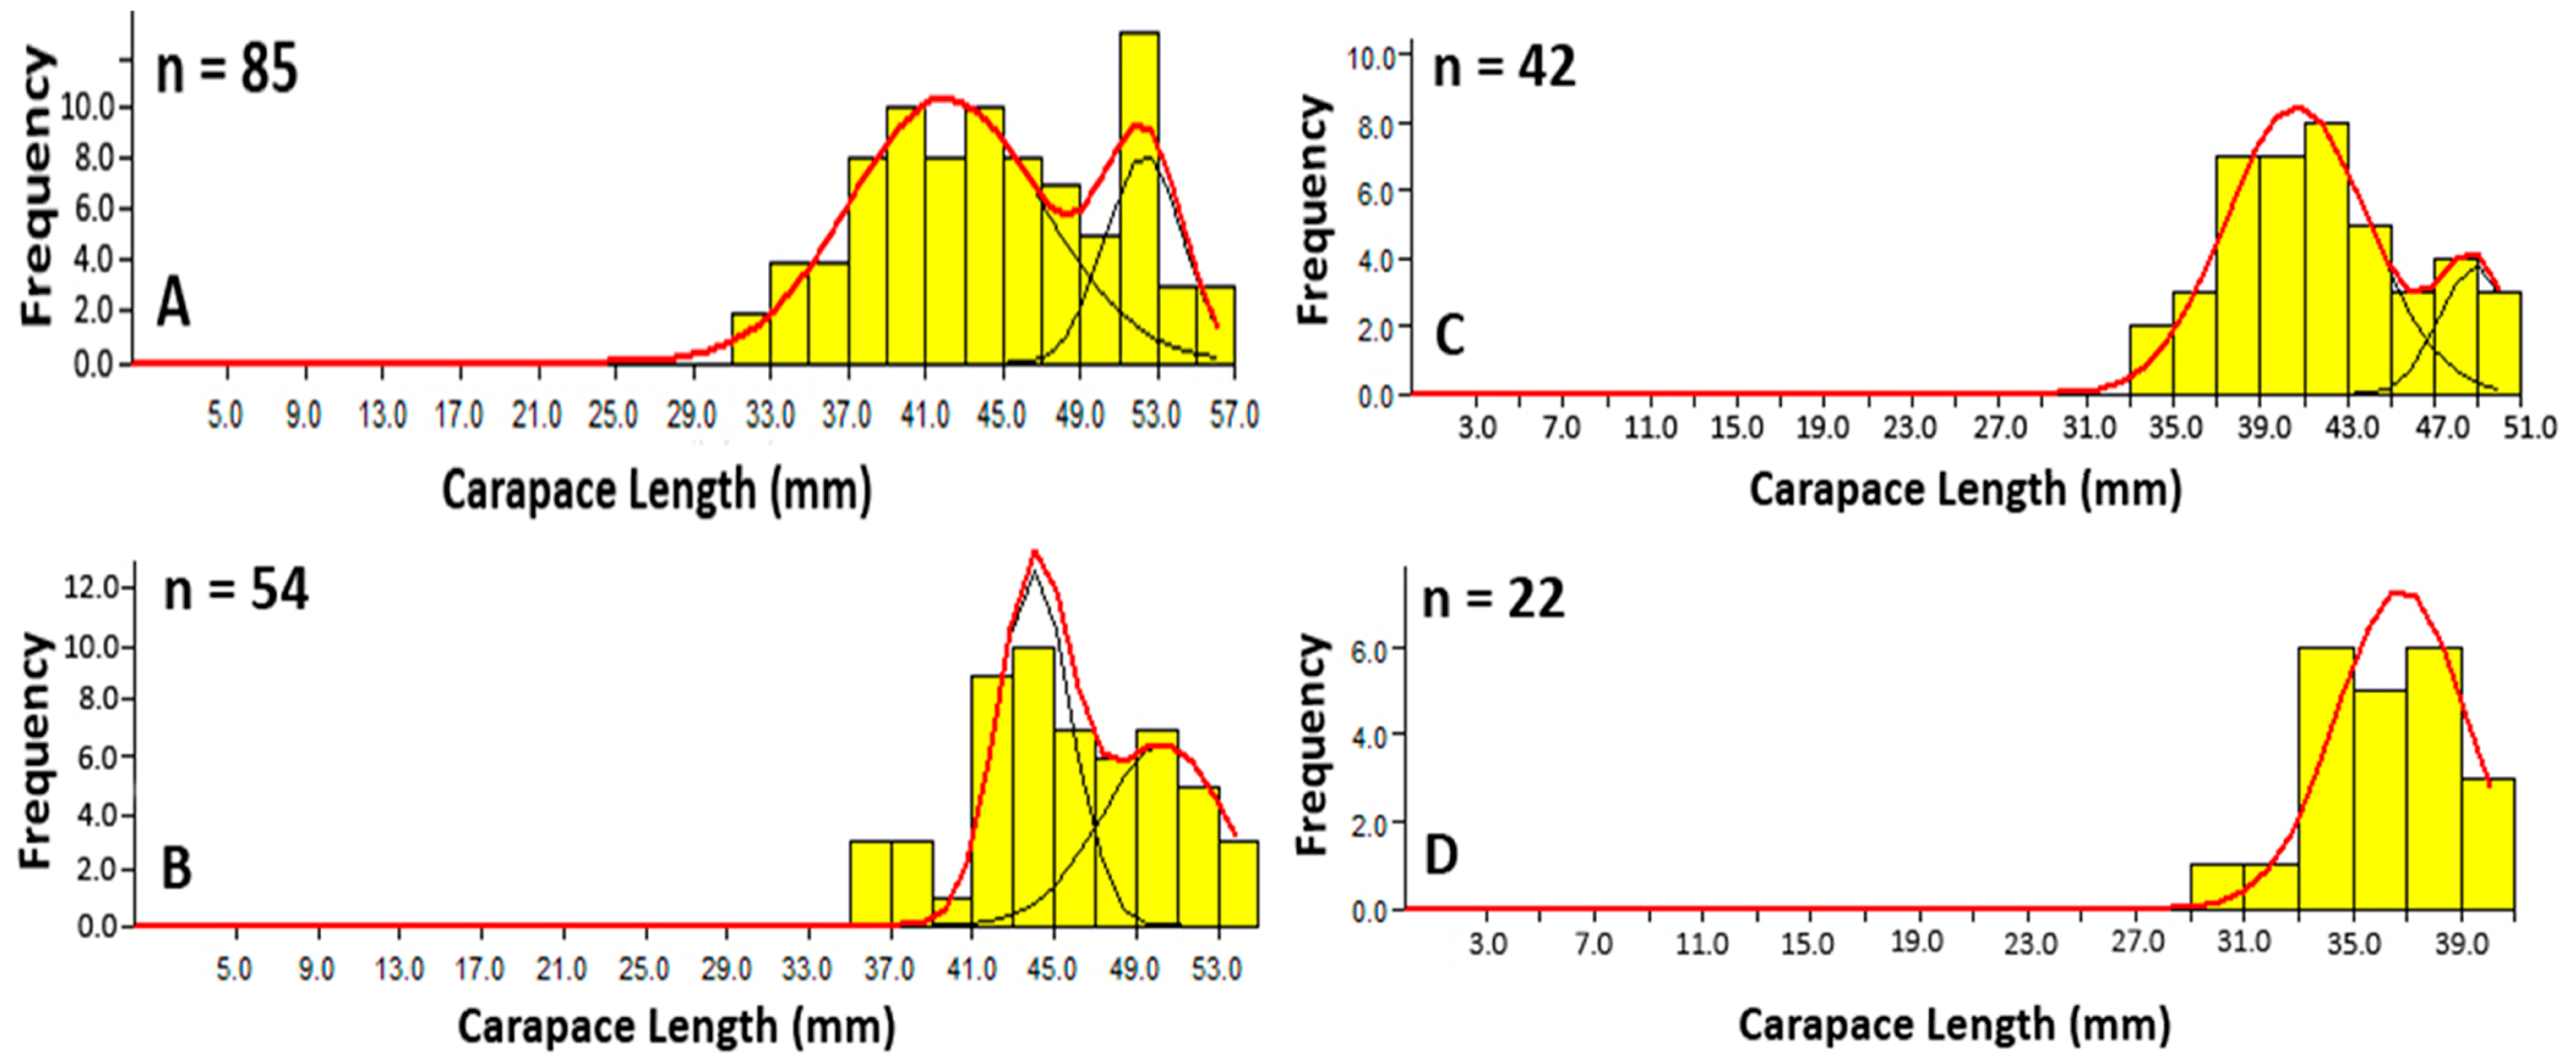
The lab experiment was concluded in April 2021, after 2.5 years. Final measurements were recorded, and all specimens were euthanized via rapid cold exposure. Each individual was then dissected to retrieve the gastric mill for age determination (see Section 2.1.2). At the end of the experiment, there were 206 CL measurements from all treatments: 85 measurements from the ambient temperature treatment, 54 from the 25 °C treatment, 42 from the 28 °C, and 25 from the 32 °C. The CL data collected throughout the experiment were used in CL–frequency analysis in each treatment. This analysis was conducted using the Bhattacharya method, included in the FiSAT II software Version 1.2.2, FAO. This technique converts carapace length frequency distributions, grouped in 2 mm intervals, to differentiate age cohorts based on modal progression. Following this, the NormSep (Normal Separation) procedure was applied to determine the mean (±1 SD) of each identified modal group. This combined approach allowed for the interpretation of carapace length data in terms of distinct age classes within each thermal treatment.

2.1.2. Age Determination via Gastric Mill Ossicles Processing

For age determination, the stomach of individuals that had died, either throughout or at the end of the experiment, was removed via dissection, after they were euthanized via rapid cold exposure. Each stomach was preserved in a stock solution formed from mixture of glycerol/ethanol/water, 4:26:70 by volume [35]. The stomachs were preserved for a minimum of 24 h [35] prior the dissection to extract the gastric mill, which was separated into its three main ossicles: the mesocardiac, zygocardiac, and pterocardiac. The ossicles were air dried and embedded in transparent Kemapoxy commercial epoxy using silicon molds with dimensions of 30 mm (length) × 20 mm (width) × 6 mm (depth).
To identify which ossicle provided the clearest and most countable growth bands, a preliminary trial was conducted on ten non-experimental specimens of varying sizes. The three types of ossicles were extracted from the stomach of each individual and sectioned at various thicknesses. These thin sections were examined under different microscope light settings, i.e., transmitted vs. reflected light. Based on these observations, the mesocardiac ossicle consistently exhibited clearer and more distinguishable growth bands when sectioned at 100 μm and viewed under transmitted light at 10× magnification. Consequently, all subsequent band counting was conducted exclusively on mesocardiac ossicles under these optimized conditions.
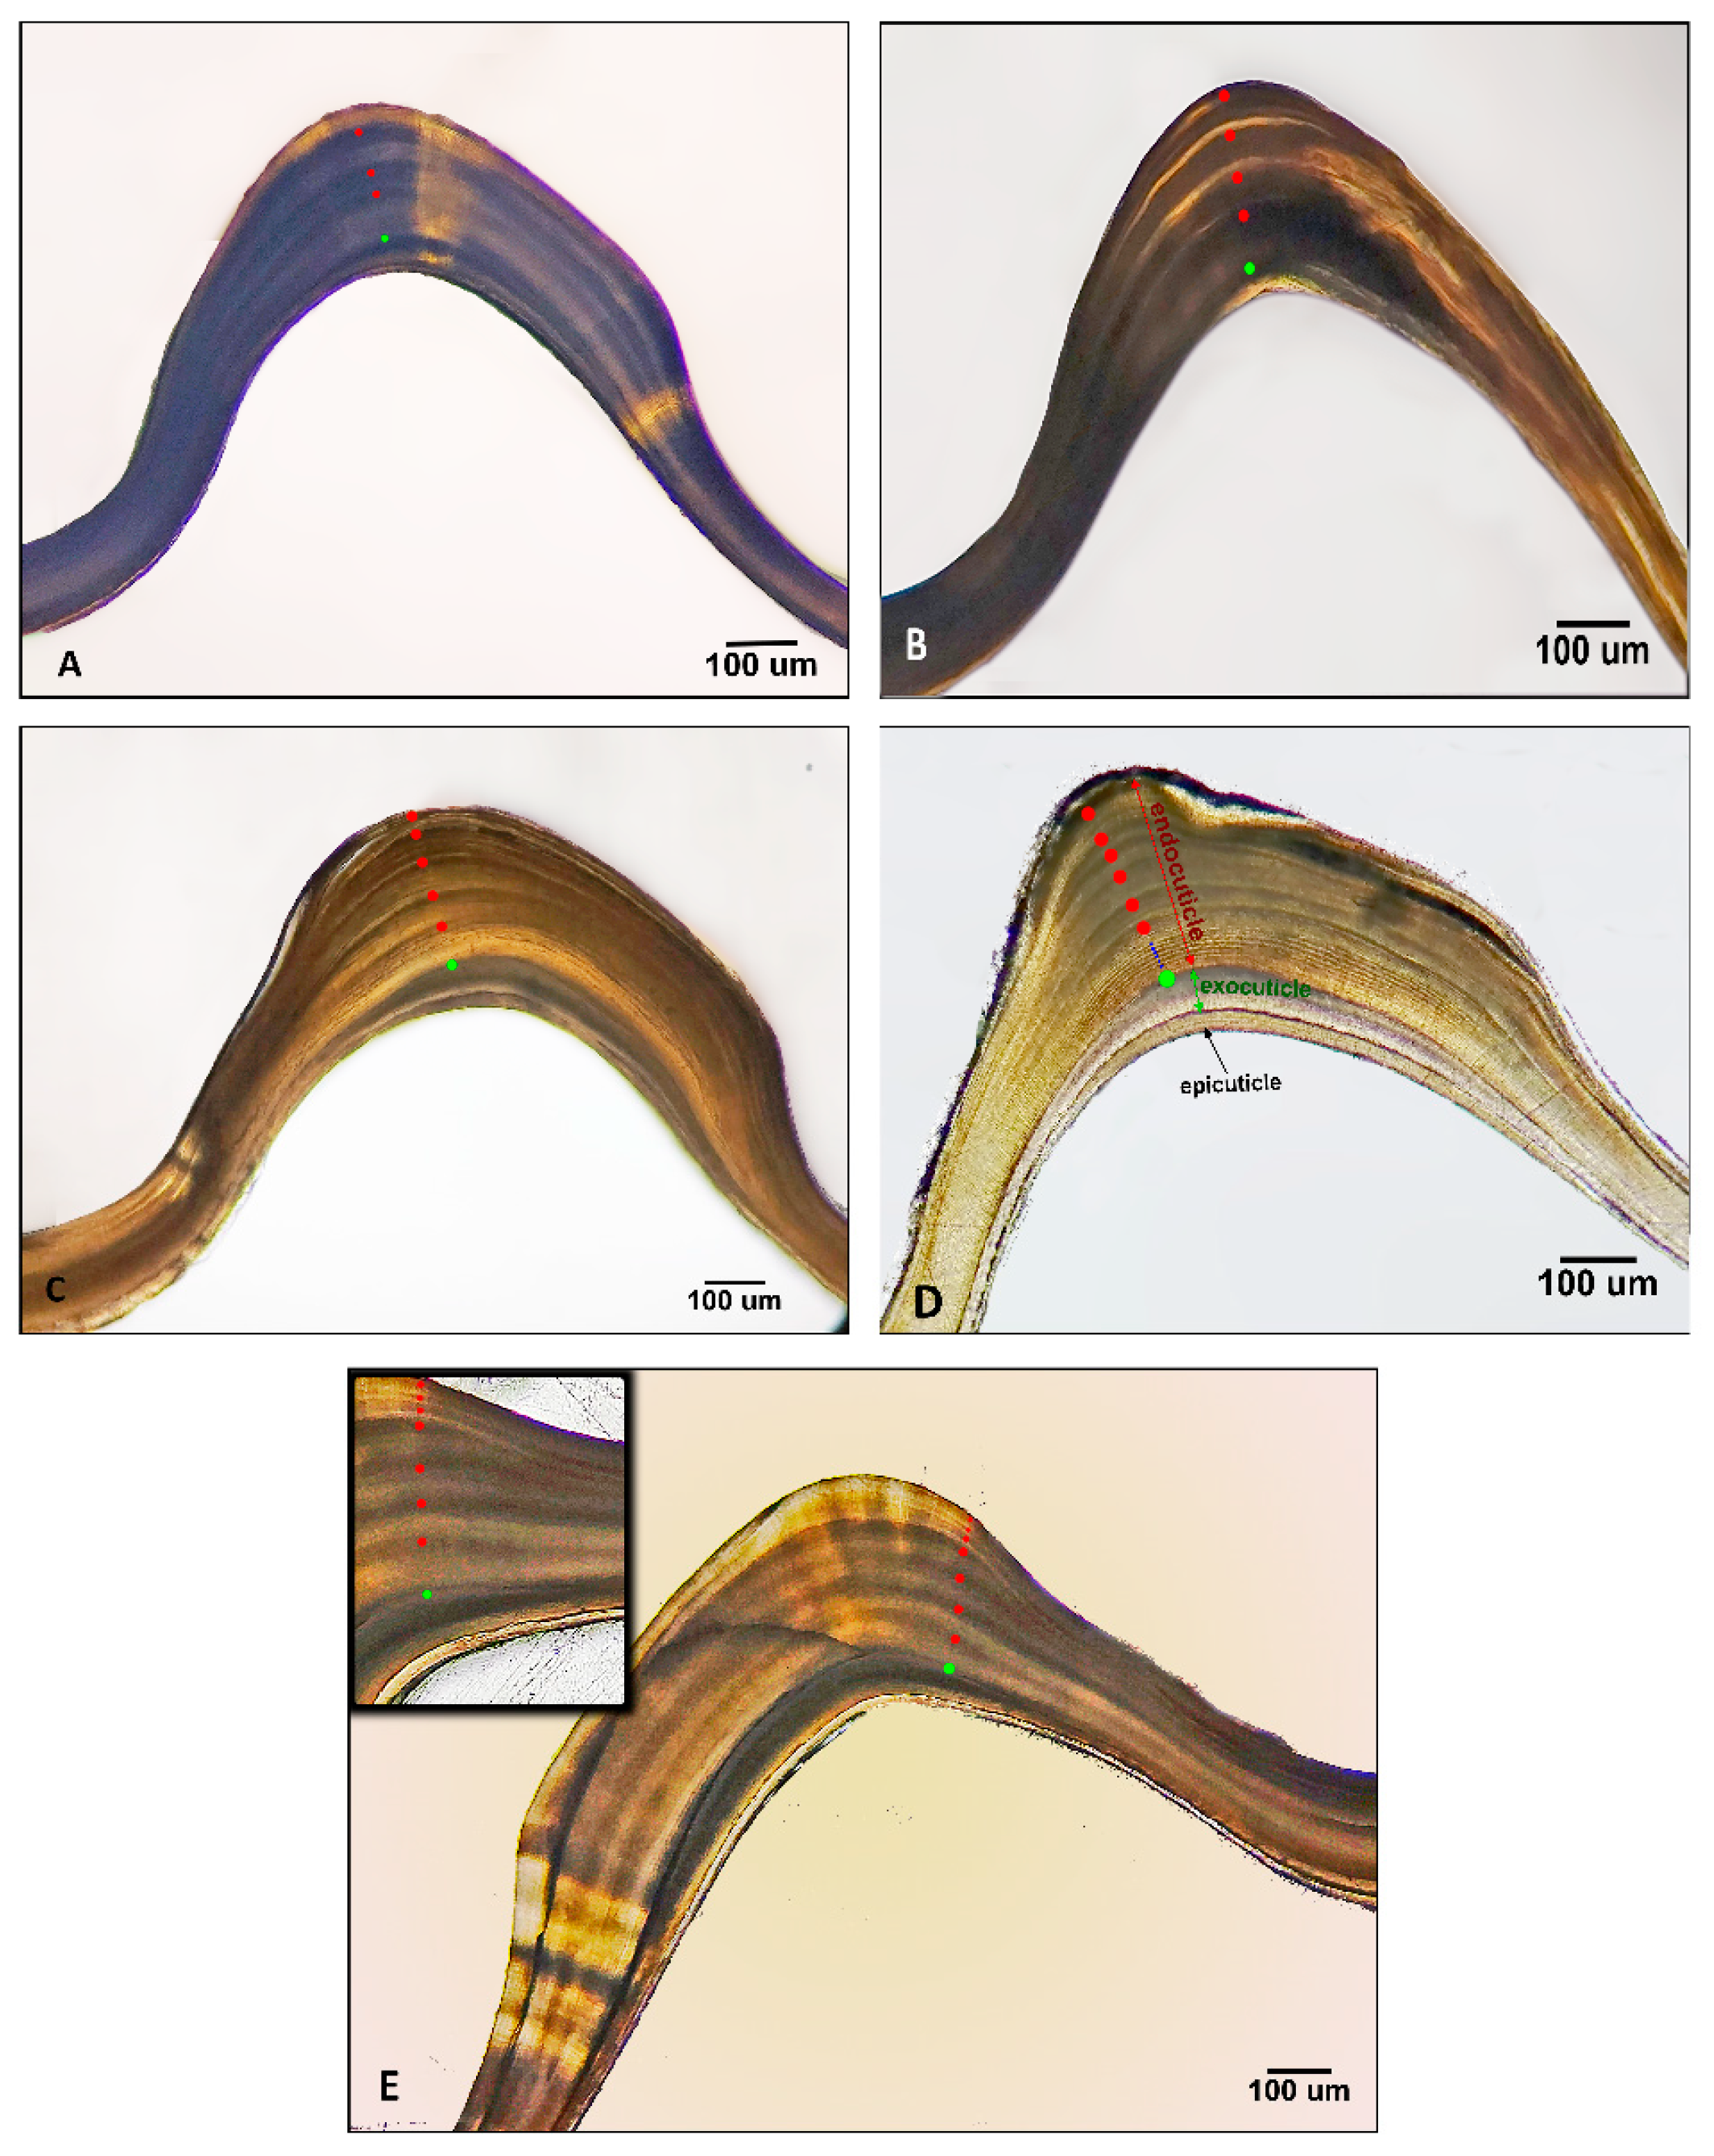
The cutting axis of the mesocardiac ossicle was aligned along its midline. An Isomet low-speed saw (Buehler®, Uzwil, Switzerland) with a diamond blade was employed for cutting longitudinal sections (100 μm thick). All sections were polished by 800-grit abrasive paper to enhance the visibility of the growth rings. Images of the sections were captured under 10× magnification using a microscope (Olympus®, Tokyo, Japan) coupled with an Olympus D74 (Olympus®, Tokyo, Japan) digital camera. The photos were further enhanced using Adobe Photoshop version 20.0.1. Each growth band consisted of a pair of layers: a broad light layer succeeded by a narrower dark zone. These growth bands (5–20 μm wide) were readily distinguishable from finer microlamellae (1–4 μm wide), as described by Kilada et al. [35]. Sections that were fractured or too thick for imaging were excluded after examination to eliminate inadequate band clarity. Prior to counting separate opaque zone to the outer border of the ossicle, the endocuticle–exocuticle boundary was identified and used as a reference point to ensure consistency in band interpretation. Notably, the size, sex, and collection site of specimens were unknown to readers at the time of band counting to reduce potential bias. To guarantee reliability of the band counts, a practice program was employed on test sections not included in the final analysis. This exercise allowed two independent readers to develop and confirm their ability to interpret band counts consistently. This protocol is operated for band counts in fish otolith and adopted in prior studies on different species of crustacea [35,37,38,39,41,42,43,58,59,60,61].

2.1.3. Accuracy (Age Validation) and Precision

To validate age estimates based on growth band counts, these counts were compared to the known absolute age of individuals (n = 166). To examine whether band counts reflect molting frequency, they were also compared with the molting records from the lab experiment. A one-way ANOVA was conducted to find out whether there is a difference between molting frequency and growth increment across temperature treatments, followed by Tukey’s post hoc analysis for comparisons between pairs. Statistical investigations were performed using IBM SPSS Statistics 27.0.1.
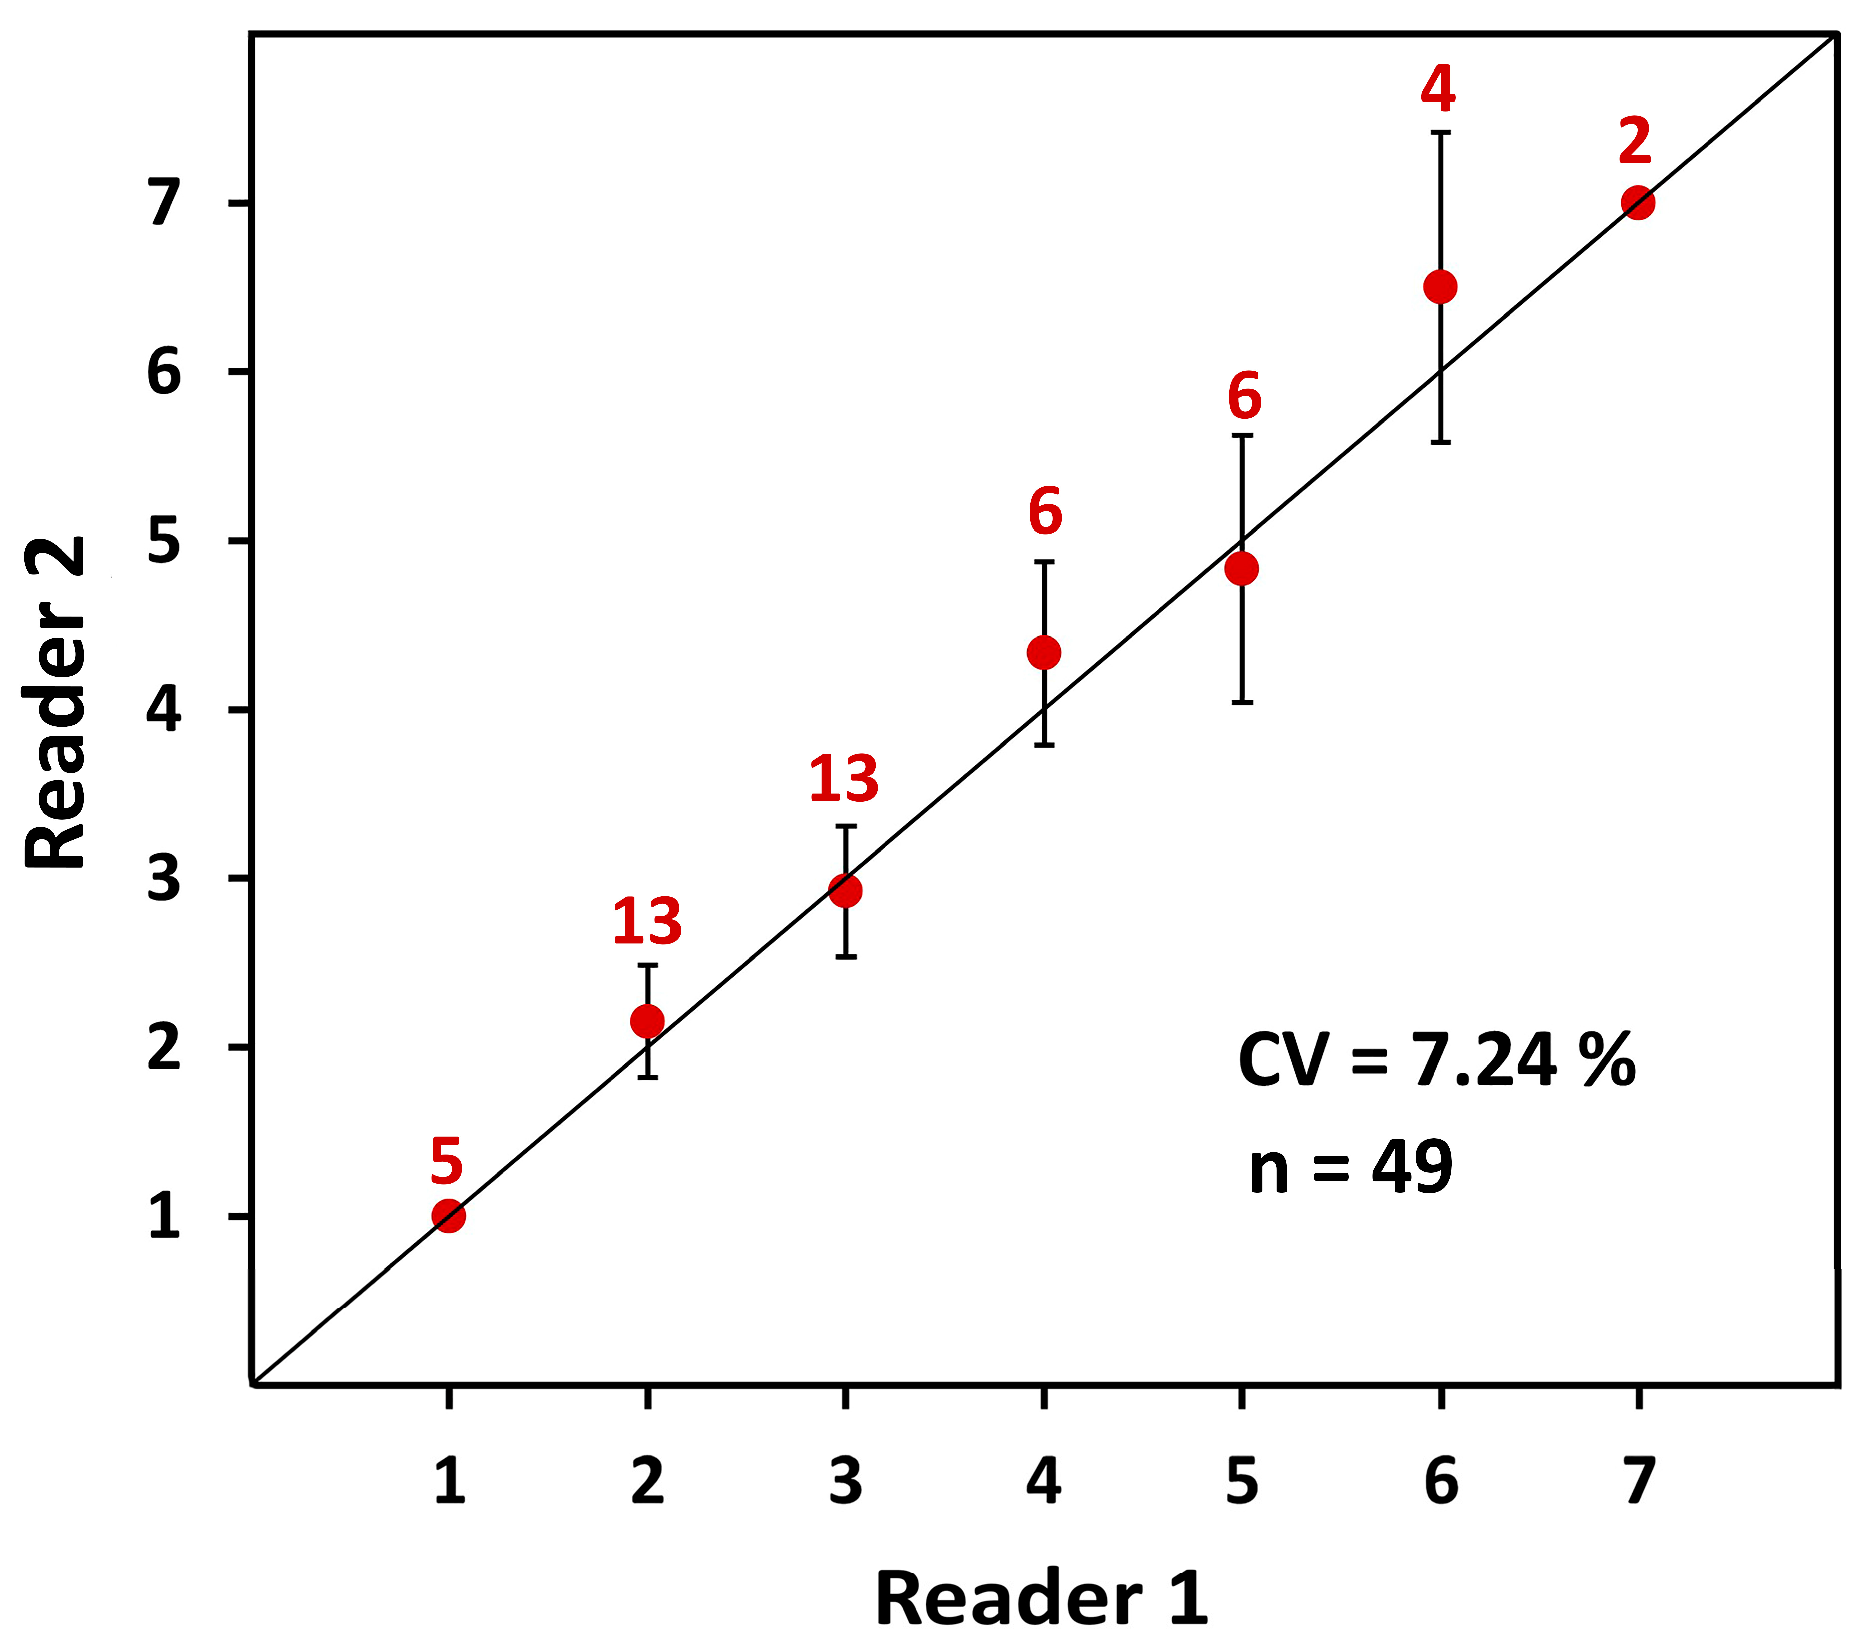
Precision, defined as the reproducibility of band counts, was assessed by having two independent readers evaluate the same specimens. The experienced reader (R.K.) trained the second reader (M.S.) using prepared sections not included in the final analysis. A total of 49 individuals (6 from the lab, 27 from Giza, and 16 from Aswan) were independently assessed by both readers. The results obtained by the two readers were compared to evaluate the presence of discernible bias in band counting by applying a bias plot, where the counts of the first reader (R.K.) were represented on the X-axis and those of the second reader (M.S.) were displayed on the Y-axis. It was agreed that when bands are observed followed by a segment of the new incomplete band, 1+ and 2+, we considered them as 1.5 and 2.5 years, respectively, to enhance the comparison. The bias was evaluated by calculating the average coefficient of variation (CV) of the two observations. The CV was computed using the following equation:
C V j = ( i = 1 R X i j X ¯ j 2 X ¯ j )
Above is the equation for the coefficient of variation for the jth particular red swamp crayfish. The ith band counts of MS (untrained reader) for the jth individual are denoted as X, while X ¯ signifies the mean band counts of RK (expert reader) for the jth individual.

2.1.4. Estimation of Von Bertalanffy Growth Curves

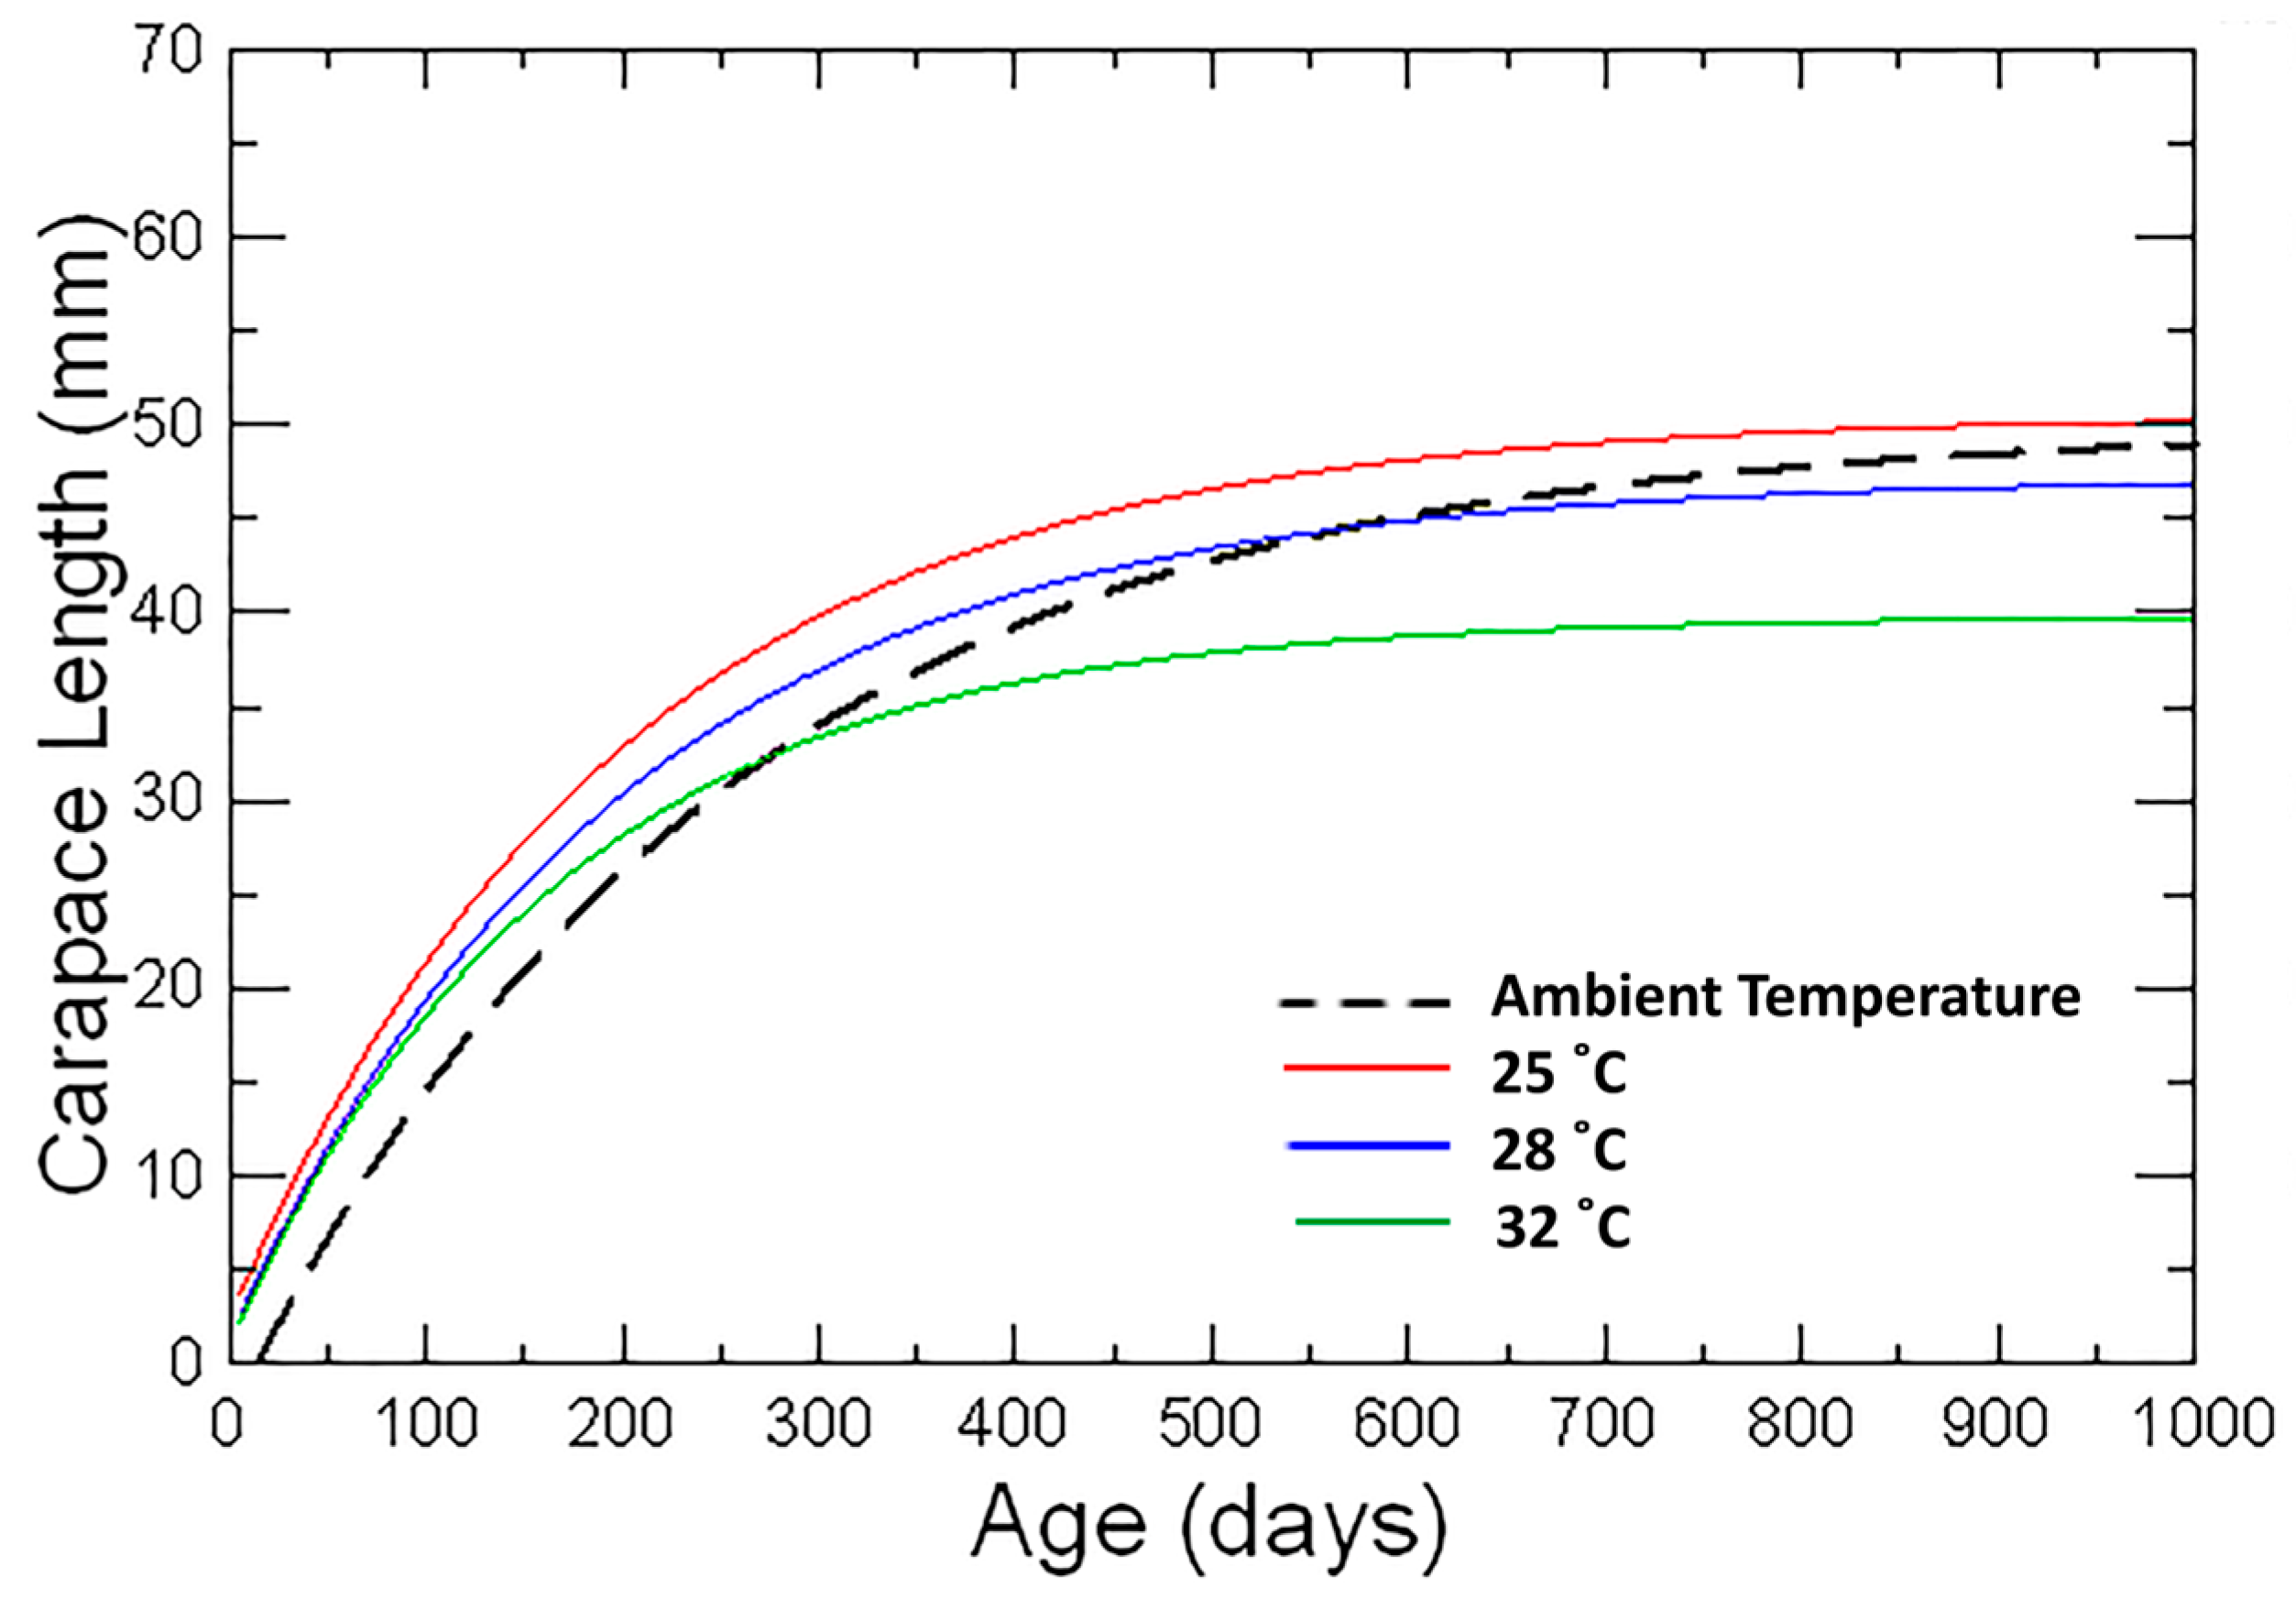
To estimate the in vitro growth rate of the red swamp crayfish under the four temperature treatments, the von Bertalanffy Growth Function (VBGF) was employed to model the relationship between absolute age in days and carapace length in millimeters:
L t   =   L   [ 1     e (   k   t     t o ) ]
where Lt represents the carapace length at age t, L is the asymptotic maximum carapace length, to is the hypothetical age at zero carapace length, and k is the growth coefficient. The growth parameters were estimated by the nonlinear least squares residual method using SYSTAT 3.2 software. Growth curves were fitted separately for each experimental group and statistically compared using a likelihood ratio test to assess the influence of temperature variation on growth of species.

2.2. Field Work

To assess the influence of natural temperature variation on red swamp crayfish growth, the ambient and constant temperatures tested in the lab fell within the temperature profiles typically seen at the two collection sites. Age was determined by applying direct (band counts) and indirect (CL–frequency analysis) methods.

2.2.1. Sites of Study

Two study sites were chosen along the River Nile in Egypt (Figure 1); the first one is located at Giza on the main Nile stream, with an annual average water temperature of about 22 °C and average depth of 1 to 2 m [51,62]. The second site is situated further south, on the main Nile course north of Aswan, with an annual mean water temperature of about 30 °C and average depth of 1 to 2 m [51,63]. Monthly samples were collected from both sites between April 2020 and March 2021.

2.2.2. Sampling

Crayfish were captured using locally known “Chinese traps” (Figure S2). The trap is rectangular in shape and 2 m long, and consists of multiple sections, each approximately 16 cm long and 20 cm wide, supported by metal frames. The mesh size ranges from 10 to 14 mm. The trap possesses a series of lateral funnel-shaped entrances that prevent the escape of trapped individuals (Figure S2B). Baited with fish or chicken viscera, traps were set overnight in shallow water, beside vegetations, and stuck specimens were obtained the following morning (Figure S2C).

2.2.3. Age Determination

Direct Method
The same method that was used in the lab experiment (Section 2.1.2) was also applied here. A total of 443 red swamp crayfish (220 males and 223 females) from Giza and 364 (197 males and 167 females) from Aswan were aged. Age-at-size relationship was modeled using VBGF for females, males, and both sexes combined. Age–at–carapace length, based on band-counts, were used to fit these curves through nonlinear regression. Parameters L, k, and to were determined using the nonlinear least-squares function in SYSTAT 3.2 software.
Indirect Method
A total of 1498 crayfish (738 males, 760 females) from Giza and 1183 (640 male, 543 female) from Aswan were used for length frequency analysis. After moving to the lab, the sex of each individual was defined by observing gonopod structure [64] and the CL (in mm) of each specimen was recorded. Analysis followed the procedure mentioned in Section 2.1.1.

2.2.4. Size and Age–at–Sexual Maturity

To determine the minimum size–at–sexual maturity, 325 individuals (size range: 20–59 mm) were sampled from Giza in July 2023 and 296 (size range: 24–75 mm) from Aswan in August 2023. The red swamp crayfish is dioecious, with both sexes possessing trilobed gonads, as described by Ando and Makioka [65] and Zhong et al. [66]. Maturity was assessed using criteria established by Saad and Hassan [67] to distinguish between mature and immature individuals. A logistic regression model was fitted to proportion maturity and size data by maximum likelihood in SYSTAT 3.2 software [28]:
P = e ( a + b C L ) / 1 + e ( a + b C L )
where P is the proportion of mature individuals, CL is the carapace length (mm), and a and b are model coefficients. The carapace length at which 50% of red swamp crayfish are mature (CL50) was calculated as
C L 50 = a / b
The mesocardia of individuals from the two samples were retained and aged as previously defined. Age–at–sexual maturity was similarly estimated using the same logistic model, replacing CL by A as age (y) and CL50 by A50 as age corresponding to 50% mature individuals.

3. Results

3.1. Laboratory Experiment

3.1.1. Molt Frequency

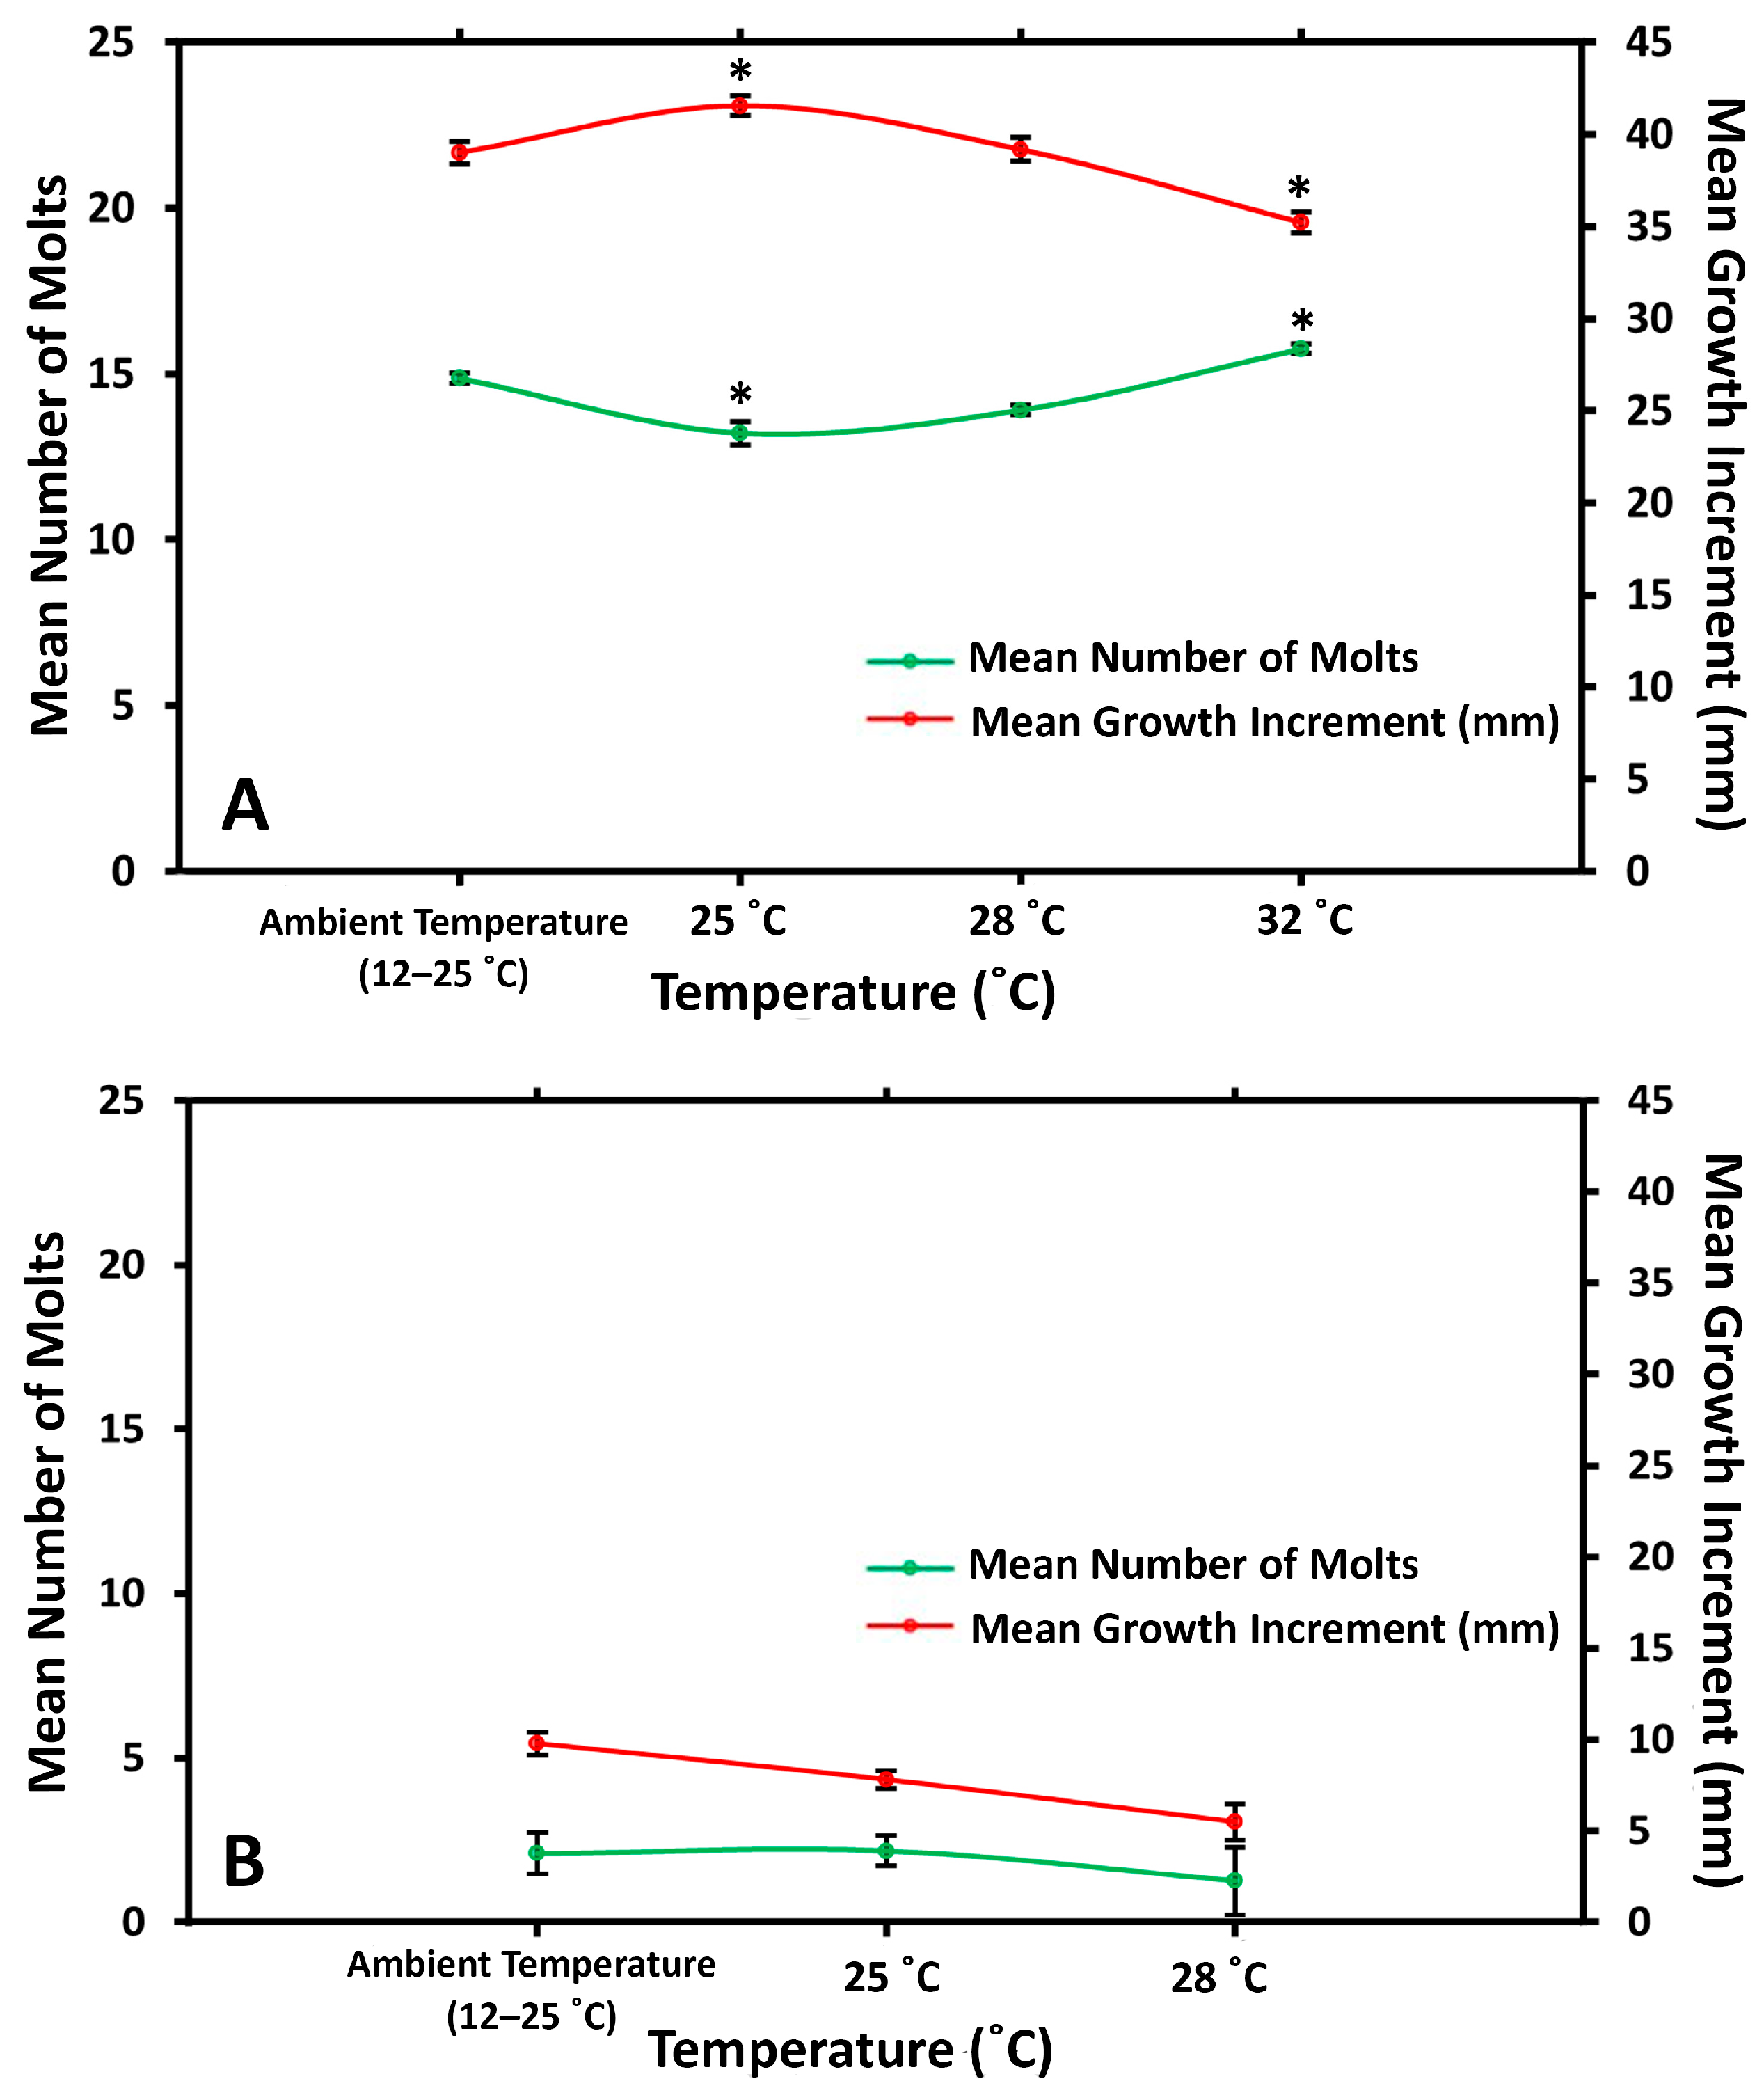
All animals in the four temperature treatments had survived through the first year, while all individuals used in the 32 °C treatment died before the beginning of the second year. Across all temperature treatments, red swamp crayfish molted more frequently in the first year (14.33 ± 0.136 SE) than in the second year (2.05 ± 0.115 SE) (Figure 2A and Table S1). Molt annual frequency was lowest at 25 °C (13.2 ± 0.33 SE) and highest at 32 °C (15.8 ± 0.13 SE) (Figure 2A). A one-way ANOVA showed significant differences in molt frequency between the four treatments in the first year (p < 0.001, n = 3). Tukey’s post hoc analysis showed a significant difference specifically between the 25 °C and 32 °C groups (p < 0.001; Table S2).
The mean growth increment in carapace length also varied significantly between the first and second years (Figure 2, Table S1). In the first year, red swamp crayfish at 25 °C showed the highest growth increment (41.55 mm/year ± 0.56 SE), while those at 32 °C had the lowest (35.20 mm/year ± 0.56 SE) (Figure 2A). Growth increments differed significantly between all treatment groups except ambient and 28 °C (p = 0.999; Table S2). Overall, growth decreased as temperature increased from 25 °C to 32 °C. In the second year, neither molt frequency nor growth increment differed among treatments (Figure 2B) (r = 0.91, p < 0.05).

3.1.2. Gastric Mill Processing and Growth Bands Validation

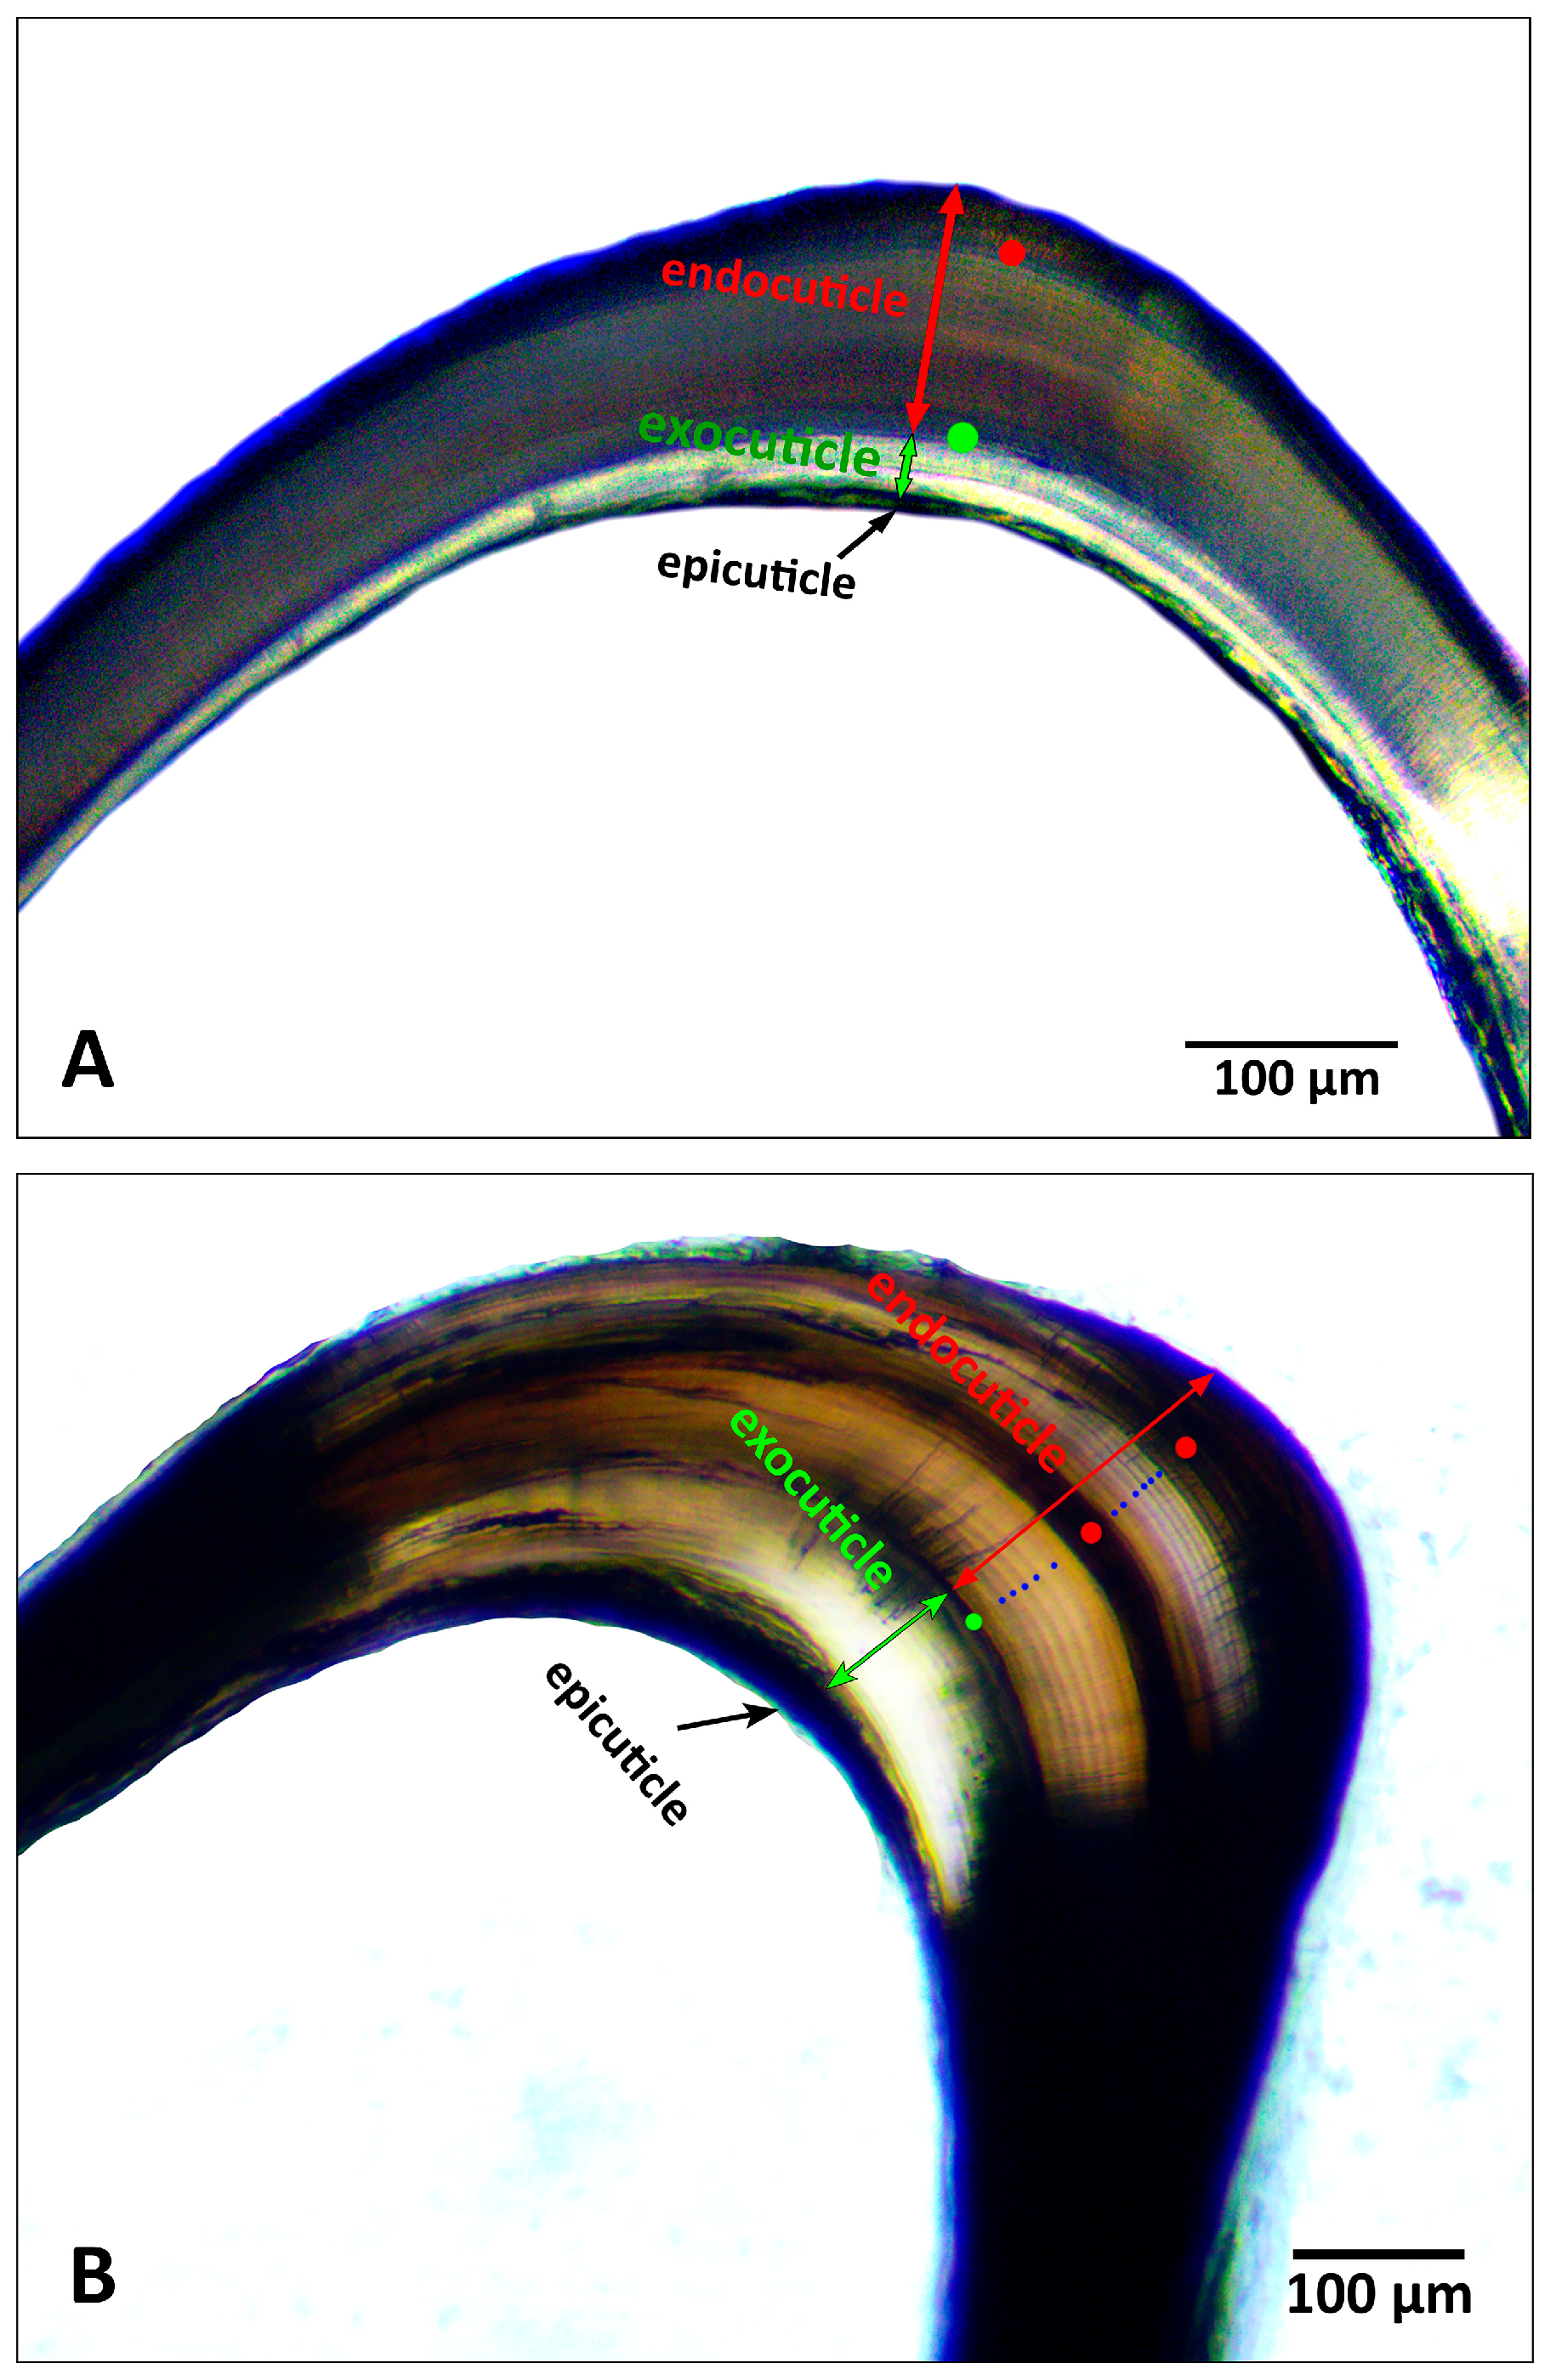
All sections revealed the typical four-layered structure of the exoskeleton (epicuticle, exocuticle, endocuticle, and membranous layer), as has been noted in the other decapods for which this approach has been used. Under transmitted light, growth bands appeared as alternating dark and bright zones in the endocuticle of longitudinal sections of mesocardiac ossicles (Figure 3). Moreover, Microlamellae (<5 µm) in the endocuticle were distinguishable by their small size, symmetry, and specific location (Figure 3B).
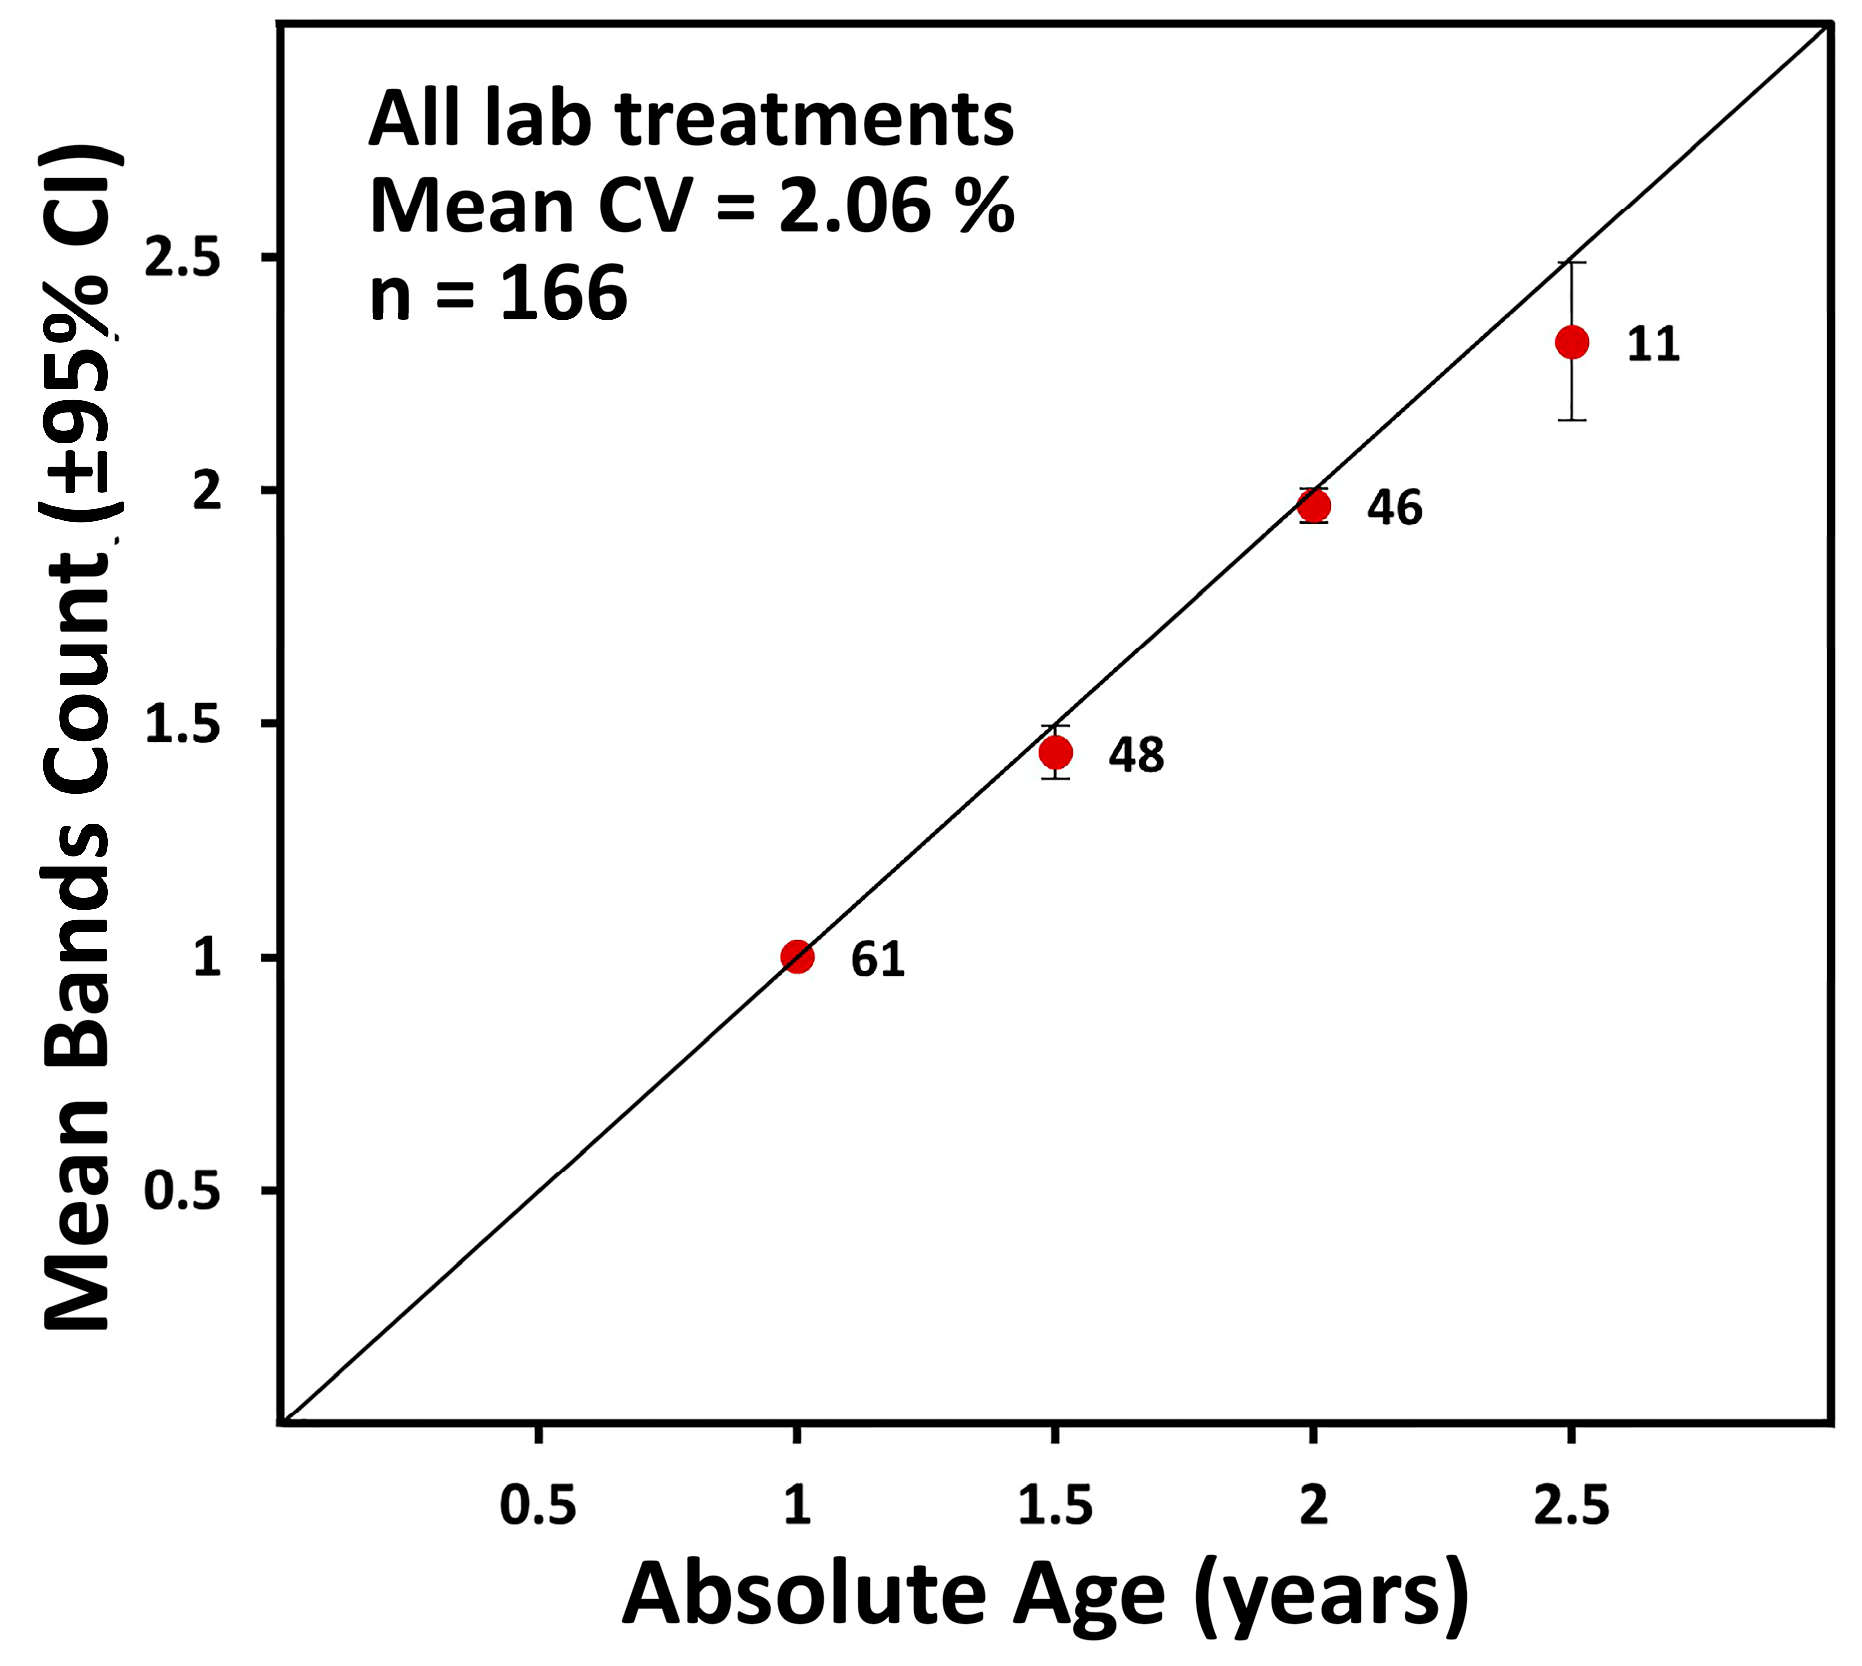
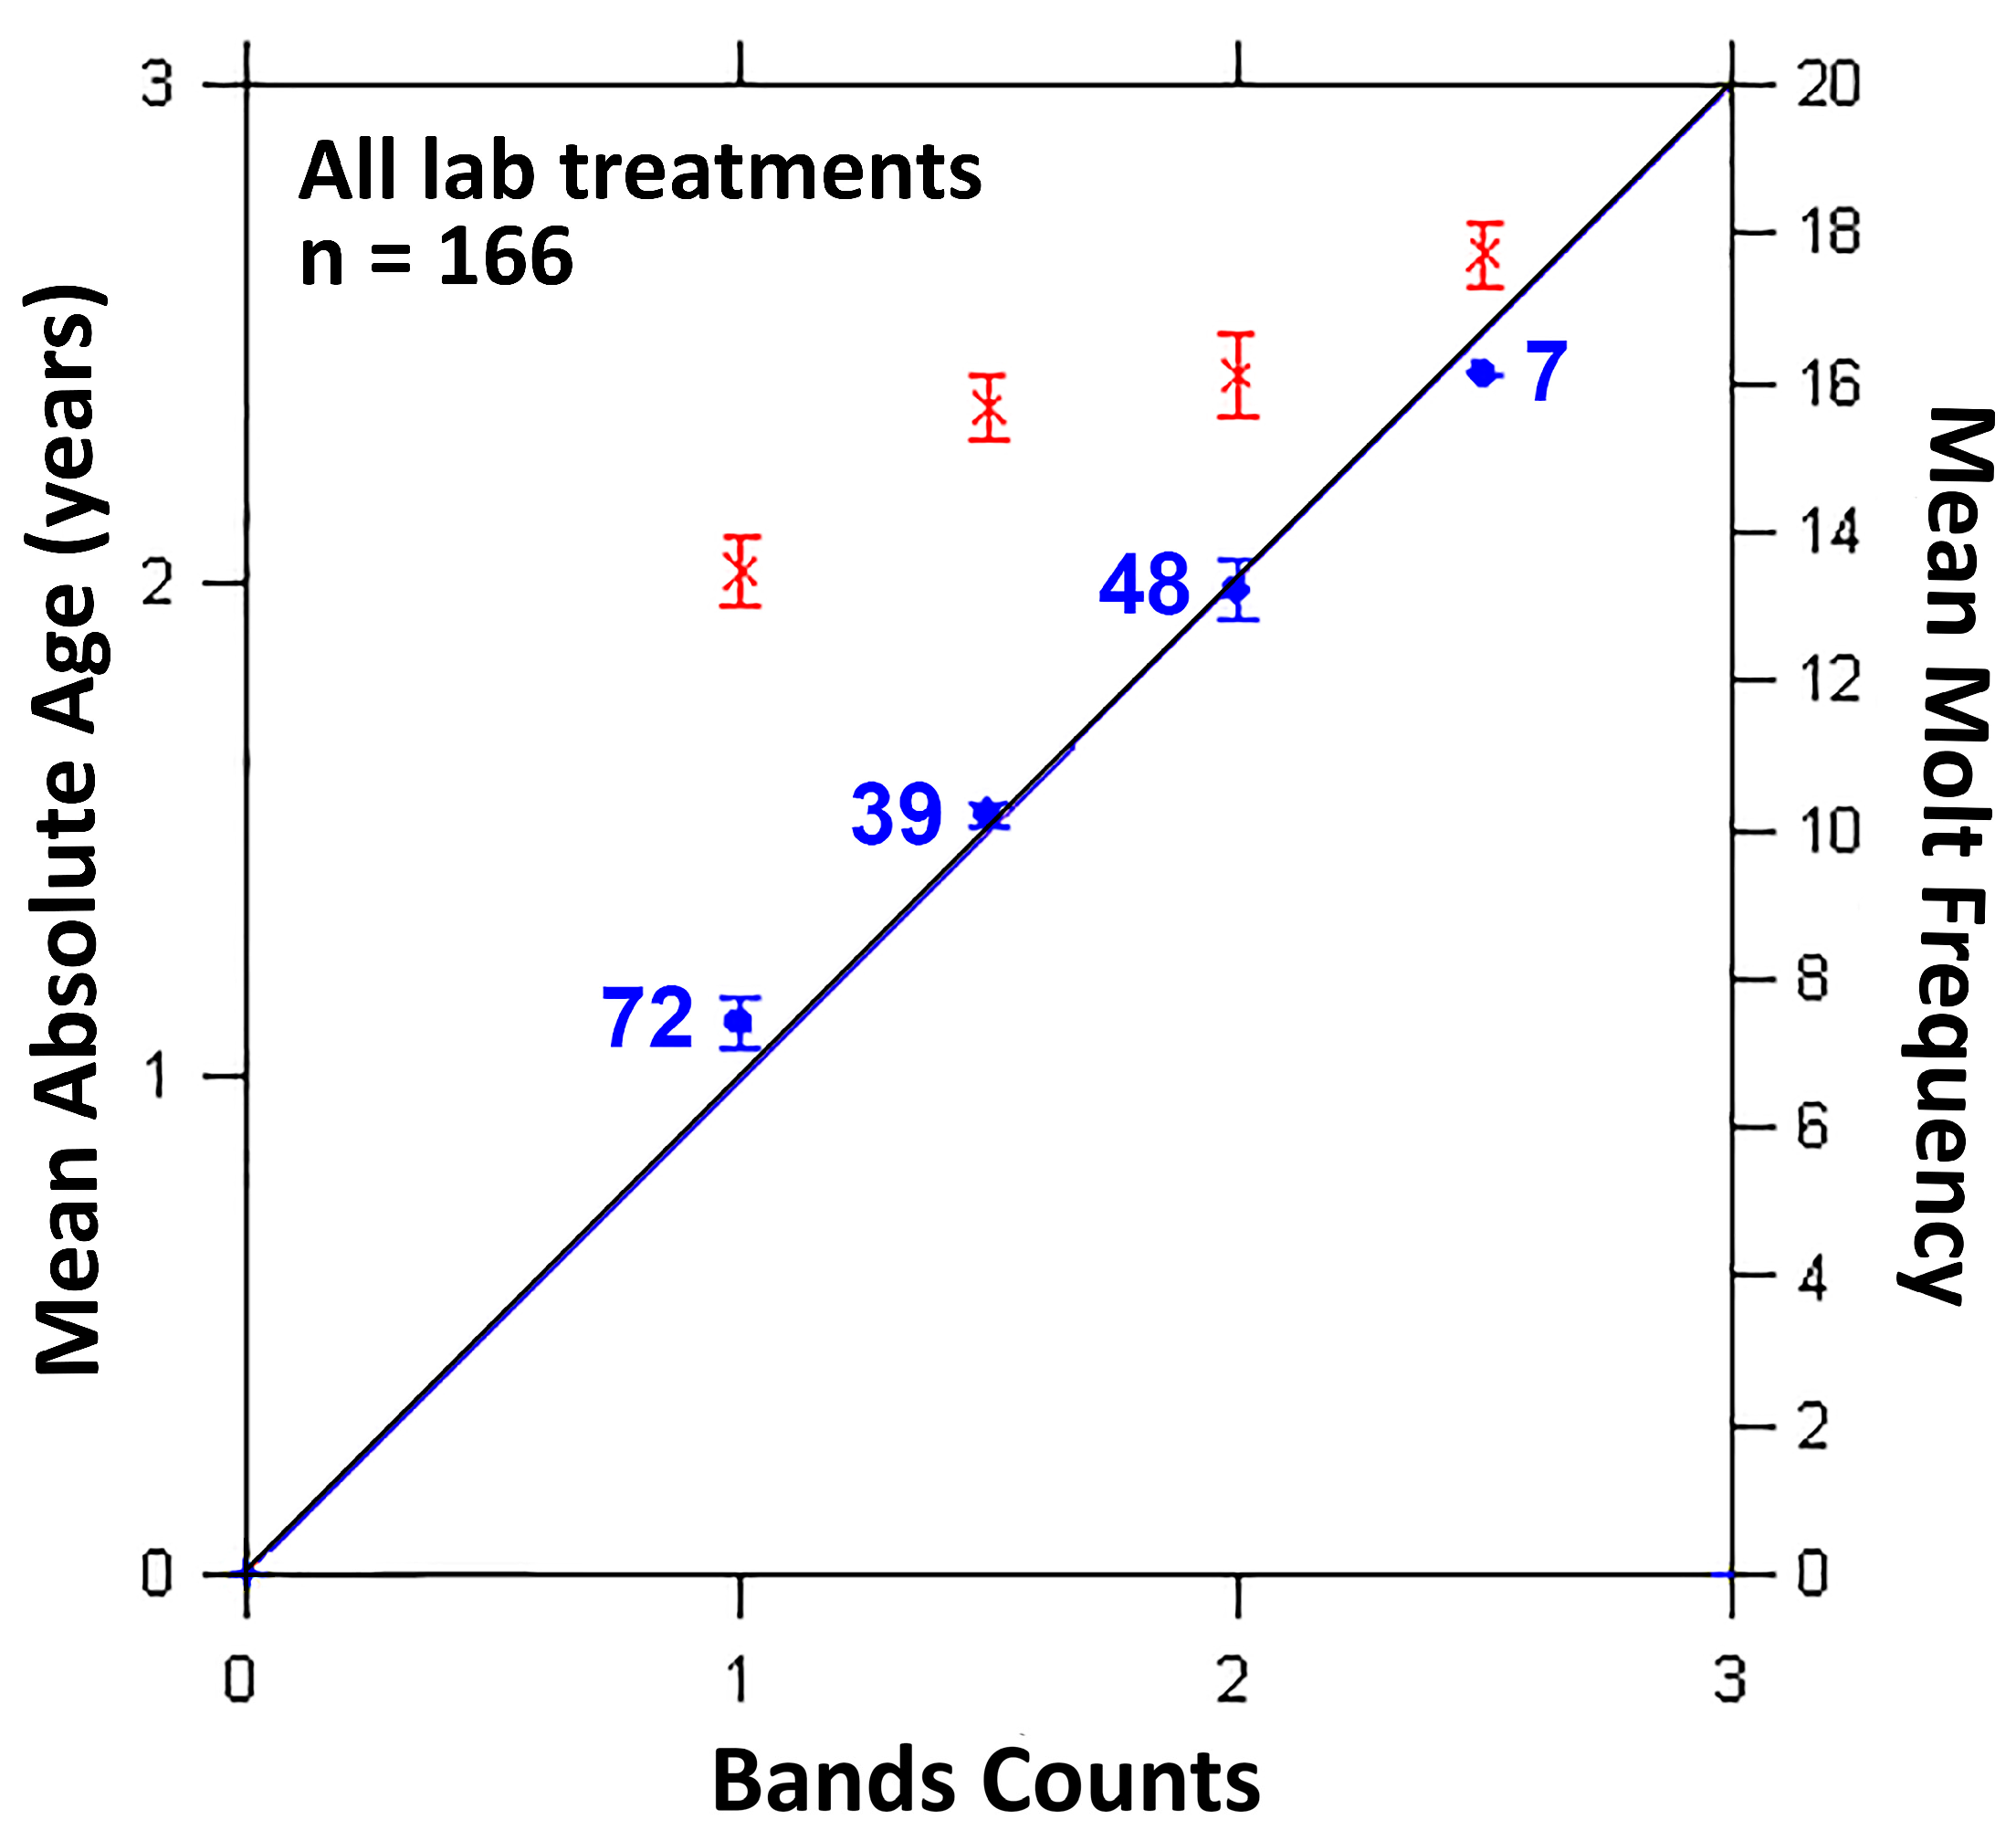
Age validation was conducted by comparing the absolute age of reared red swamp crayfish in the lab over 2.5 years with band counts in their mesocardiac ossicles. The accuracy of counting bands was assessed by plotting the absolute age versus average band counts and estimating the coefficient of variation (CV) (Figure 4). CV values were low (2.06%), and the band counts are more closely related to the absolute age of red swamp crayfish than to molting frequency, despite temperature variations (Figure 5), confirming that the growth bands represent annual increments rather than molting events.
To assess reading precision, independent band counts performed by Reader 1 (R.K.) and Reader 2 (M.S.) were compared using a bias plot. Counts were almost consistent between the two independent readers, with error bars closely aligned to the 1:1 equivalence line and a CV of 7.24% (Figure 6).

3.1.3. Carapace Length Frequency Analysis

The carapace length (CL) frequency distributions showed two prominent modes in the ambient, 25 °C, and 28 °C treatments, while the 32 °C group exhibited a single mode (Figure 7; Table S3). In the first year, the largest modal CL was at 25 °C (44.02 mm ± 1.77 SD), while the smallest at 32 °C (36.77 mm ± 2.38 SD), indicating faster growth rate of individuals at 25 °C than in higher temperatures. Modal sizes did not differ between ambient temperature and 28 °C. The modal sizes for the second year were similar across all treatments.

3.1.4. Estimation of Von Bertalanffy Growth Curves

Von Bertalanffy growth curves of combined sexes showed a rapid increase in the first year, followed by a plateau in the second. The curves showed a decline in size-at-age with increasing temperature (Figure 8, Table S4). The CL size of individuals at 32 °C was clearly lower than in the other temperature treatments (Figure 8). A Likelihood Ratio test revealed sex-based significant differences in growth only at ambient temperature (12–25 °C) and 28 °C (Table S5).

3.2. Field Work

3.2.1. Age Determination

Direct Method
After validating the growth bands as age indicators, i.e., one band equivalent to one year of age, the term “band counts” will be replaced with “age” in the text henceforth. The maximum observed age was 6 years in Giza (i.e., 6 growth bands) and 7 years in Aswan and (Figure 9D,E). Significant differences existed in the average age-at-size between Giza and Aswan (ANOVA, p < 0.001), with Giza’s specimens reaching size–at–harvest (45.8 mm CL) at a younger age than those of Aswan (Figure S3).
According to the Likelihood Ratio test results (Giza: X2= 2.398, df =1, p = 0.124; Aswan: X2= 3.258, df =1, p = 0.071), the von Bertalanffy growth parameters exhibited no significant differences between females and males in both Giza and Aswan (Table S6).
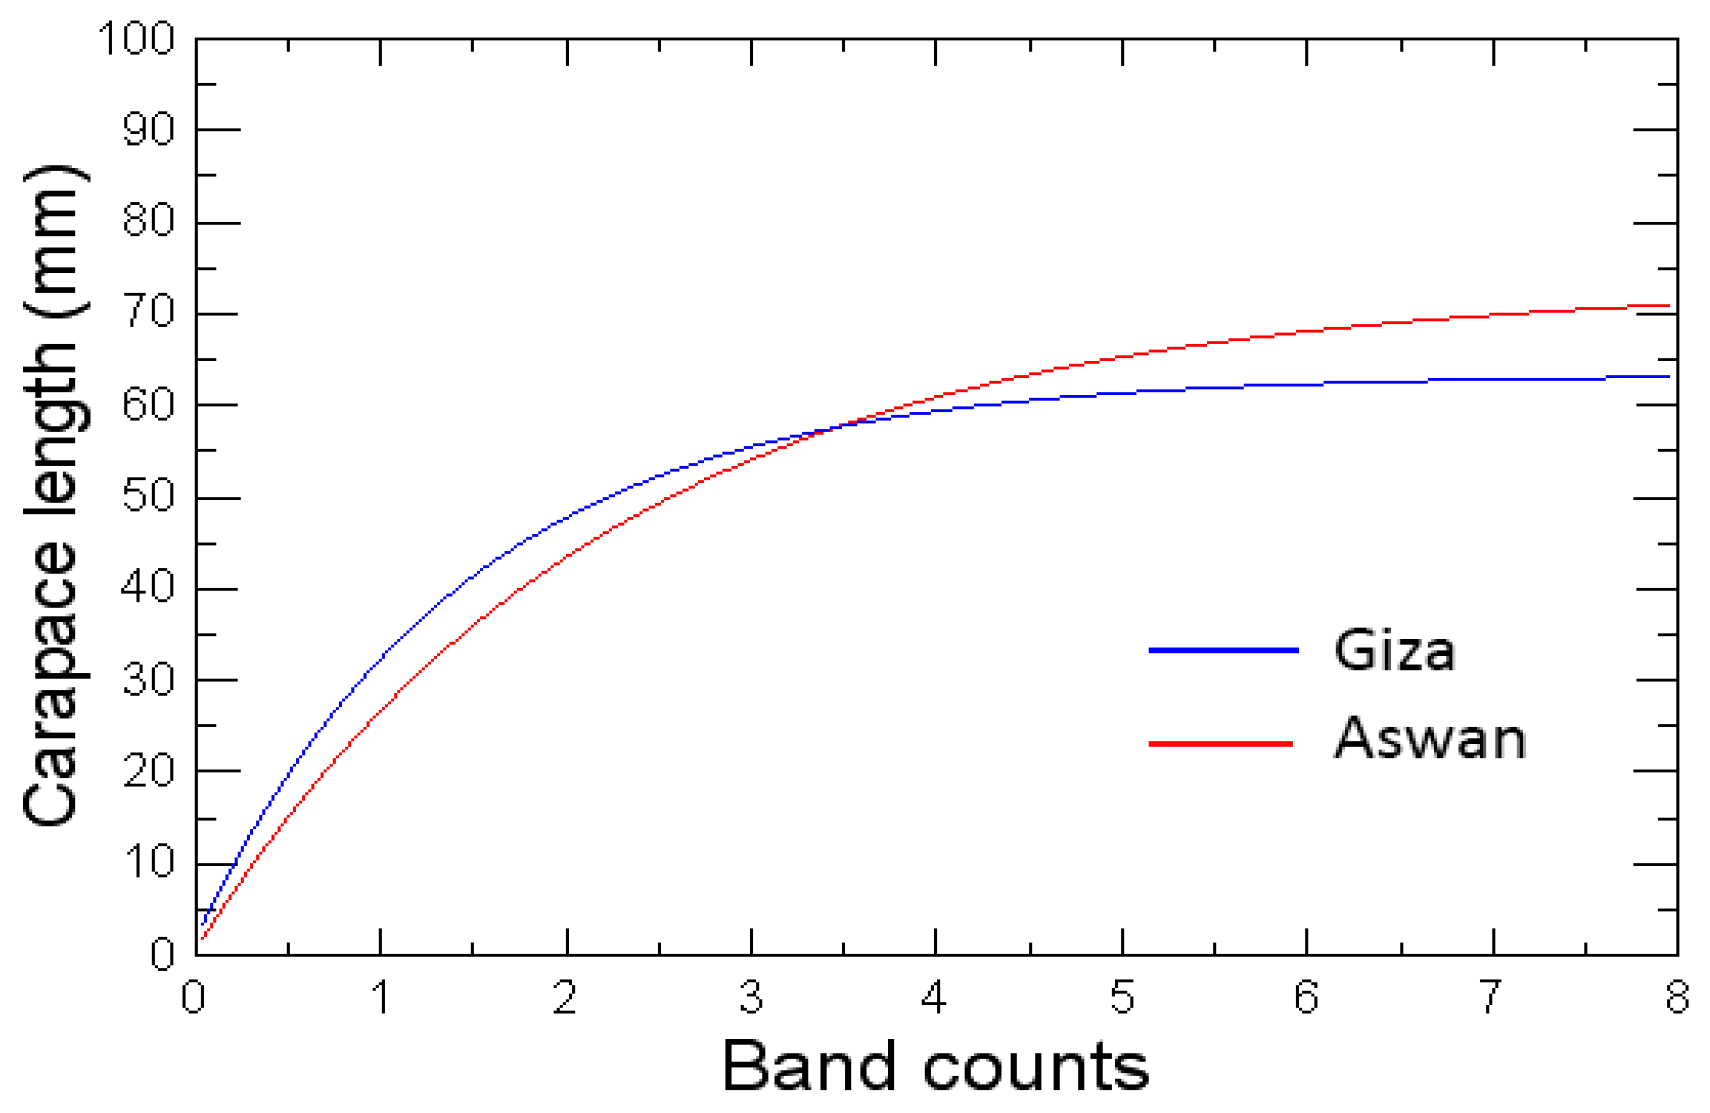
The growth curves of combined sexes in both locations demonstrated a pattern of rapid CL growth during the first two years of age, followed by a succeeding slowdown in growth (Figure 10). The mean CL values corresponding to age in years (i.e., band counts) in Giza and Aswan were presented in Table S7. During the first three years, individuals from Giza revealed larger CL, indicating a higher growth rate. By the fourth year, the mean CL in both locations were nearly equal. In the fifth and sixth years, individuals from Aswan attained larger mean CL than those from Giza. Remarkably, no seven-year-old individuals were recorded in Giza. Also, one female red swamp crayfish aged one year was documented in Aswan.
Indirect Method
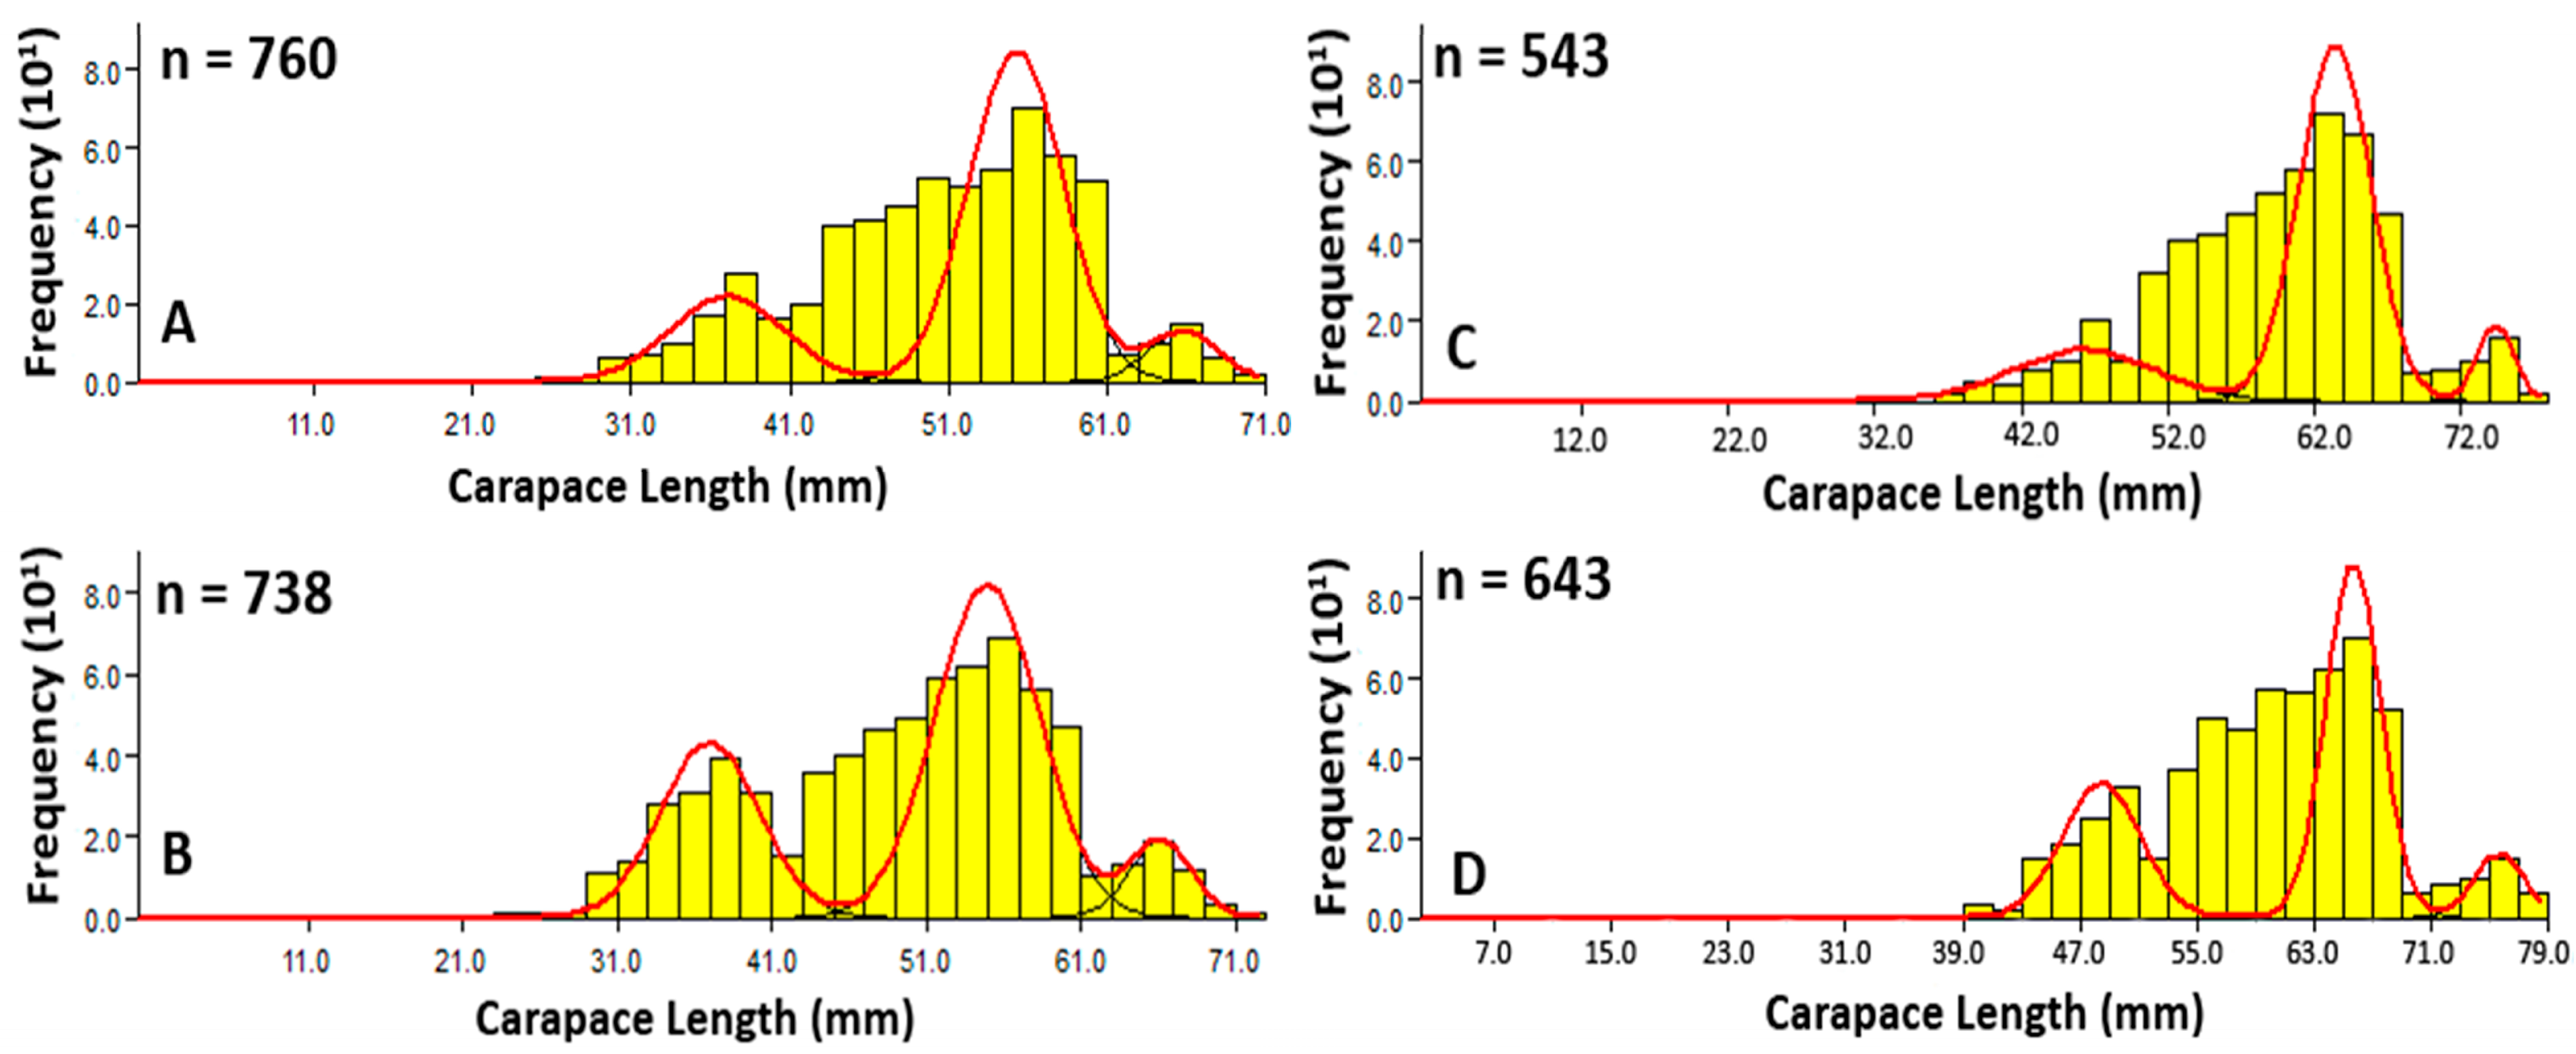
The results revealed three distinct modes (age groups) for both males and females in Giza and Aswan, indicating a maximum longevity of approximately three years at both sites (Figure 11). The corresponding carapace lengths for each age group, as estimated using Bhattacharya’s method, were detailed in Table S8.

3.2.2. Size and Age–at–Sexual Maturity

The age and size–at–sexual maturity differed between the two populations. In Giza, females exhibited sexual maturity earlier than males; although, in Aswan, both sexes attained sexual maturity at approximately one year of age (Tables S9 and S10; Figures S4 and S5). More precisely, in Giza, 50% sexual maturity was achieved at 30.45 mm CL and 0.94 years for females and 33.45 mm CL and 1 year for males. In case of Aswan, 50% sexual maturity happened at 30.64 mm and 0.99 years for females and 32.51 mm and 0.98 years for males. Overall, both sexes in both locations reached 50% sexual maturity at around one year of age. It was observed that males consistently tended to mature at larger sizes than females, which may reflect female preference for larger males during mating.

4. Discussion

Although the biology of the red swamp freshwater crayfish (P. clarkii) has been studied in various regions worldwide, its growth in relation to accurate age data has remained inadequately investigated. Providing such data improves the sustainability of this economically and ecologically important species, as it allows for accurate estimates of growth rates, longevity, mortality, and age at maturity, all fundamental parameters for stock assessments and population dynamics [29,68]. This study is the first to report a lifespan of up to seven years for red swamp crayfish in the River Nile, a finding that contrasts with the previously held belief that this species does not live more than two years in the same region.

4.1. Direct Age Determination and Validation

4.1.1. Direct Age Determination

The aging method and validation in this study, based on the absolute age of known-age individuals, represents the first direct method for the age determination of this species in the Middle East. A total of 166 red swamp crayfish individuals, reared from egg stage while still attached to their mothers, were raised in different temperature conditions and regularly fed for over two years. The study demonstrated that the growth band counts observed in thin sections of the gastric mill ossicles are a reliable age indicator rather than a molt indicator. This finding is significant, as it supports the hopeful use of gastric mill ossicles as hard structures for accurate age determination of economically important crustaceans.
In the present study, growth bands were determined and counted in 100 µm sections of the mesocardiac ossicles using 10× magnification under transmitted light. Similarly, in other species, growth bands were detected and counted in the mesocardiac ossicles of the American lobster (H. americanus) [35], red squat lobster (Pleuroncodes monodon), yellow squat lobster (Curvimunida johni) [41], Norway lobster (Nephrops norvegicus) [69], red king crab Paralithodes camtschaticus, and southern Tanner crab Chionoecetes bairdi from Alaska [70]. In contrast, other ossicles have been utilized in different species; the zygocardiac ossicles were used in the European lobster (Homarus gammarus) and Atlantic rock crab (Cancer irroratus) [69], as well as in the blue swimmer crab (Portunus pelagicus) from the Eastern Mediterranean [59], snow crab (Chionoecetes opilio) [38], Jonah crab (Cancer borealis) [39], and ringed crayfish (Faxonius neglectus) [42]. Additionally, pterocardiac ossicles were used for age determination in the red claw crayfish (Cherax quadricarinatus) [58] and the Caribbean spiny lobster (P. argus) [37].
Band counts in the endocuticle layer of the mesocardiac ossicles were assessed to confirm whether they indicate molt frequency or chronological age. Molt frequency in crustaceans varies across species and is influenced by environmental factors [48,51,71,72,73]. In this study, the molt frequency of the species was monitored under different temperature regimes for more than a two-year period in controlled laboratory conditions. When the number of molts and the growth band counts in each specimen’s mesocardiac were compared, it was found that across all treatments, individuals molted fourteen times in the first year and only twice in the second year (Figure 5). This finding suggests that the number of growth bands does not correspond to molting frequency. This result is consistent with that of Kilada et al. [35], who examined the relationship between growth band counts and instar numbers (molting frequency) in northern shrimp, American lobster, and snow crab. Growth bands do not represent molting events, as the authors mentioned that band counts were consistently and significantly lower than the number of molts within all species. Likewise, Leland et al. [58] stated that juvenile red claw crayfish (Cherax quadricarinatus) performed 12 molts in the first three months, however their gastric mill did not reflect these molts in band disposition. They noted that juveniles under one year of age, despite multiple molts, exhibited no growth bands. Gnanalingam et al. [37] and Hutchinson et al. [74] also observed similar patterns in Caribbean spiny lobsters. Mouser et al. [42] estimated the age of the ringed crayfish using band counts and length-frequency analysis and found out that number of molting events is higher in the first year, with eight events, than the second year, with four events [75]. This supports the findings of the current work that band counts are not a molt frequency indicator.
In contrast, Liu et al. [76] examined growth marks in the eyestalk of the swimmer crab (Portunus trituberculatus) and observed that, despite being reared for nine months, the eyestalks exhibited 7–11 growth bands, independent of age. Consequently, Liu suggested that the number of growth bands may be linked to the number of molts. This finding may not be accurate as the authors were counting different bands than the growth bands that are used in other studies, as shown in the published images. In conclusion, most previous studies support the findings of the present study, confirming that the number of molts does not correspond to growth band counts, which instead align more closely with absolute age (Table S11).

4.1.2. Age Validation

Age validation is essential to verify the increment periodicity of growth band formation across the entire age range of species, and the methods of validation differ from species to another [29]. In the current study, age validation was conducted by comparing the absolute age of red swamp crayfish individuals reared in the lab for two years with the band counts examined in the endocuticle layer of their mesocardiac ossicles. Validation using known-age, lab-reared individuals is the most rigorous method in age validation, particularly for short-lived species [29]. Despite the possible biases associated with growing individuals in captivity for age validation due to their growth in a controlled environment, this procedure is widely accepted for validating annual growth ring formation [29].
Several previous studies have validated the age of several economically valuable crustaceans through the absolute age of lab-reared specimens. For example, a known-age specimen of European lobster (H. Gammarus) was used to validate growth band counts [69]. One female, raised in captivity for four and a half years, possesses four deposited bands in the zygocardiac ossicles sections. This alignment between band count and known age supports the reliability of growth band periodicity as an age indicator. Similarly, Huntsberger et al. [39] validated the age of Jonah crab (C. borealis) using reared specimens. There have also been other studies that benefited from the possession of known-age individuals for the age validation of various crustaceans [37,39,58,77].
However, the mechanism of band deposition is still unknown, and some publications have questioned the reliability of band counts for measuring aging [45]. While it is crucial to clarify the mechanism of band deposition retention following successive molting events, the absence of such an explanation should not invalidate the actual and accurate observations presented in the current study and other previous research. Consequently, it will be helpful if this explanation is available in the future to further understandings of the technique of direct age determination in crustaceans. Some studies reported a loss of the gastric mill and its ossicles during the post-molt stage in certain species [40,44,45,46], whereas in the case of the Caribbean spiny lobster (P. argus), there is only one study that indicates that the gastric mill demineralizes but remains intact during molting process [37]. Moreover, although the temperature was almost stable in the lab experiment, annual growth bands were observed in the known-age animals, and the explanation of this was not investigated in the current work. Similar observations were documented in other species in situ, where annual growth bands have been validated in snow crab [38] and Jonah crab [39] that live in waters deeper than 100 m with minimum annual fluctuation in temperature range. The same has been documented for tropical coral reef fish in the great barrier reefs [78]. This phenomenon has not been explained and requires further investigation.
Validating absolute age in crustacea using gastric mill growth bands is challenging, and researchers often support findings through corroboration with other age estimation methods. For instance, Kilada et al. [35] corroborated the growth band counts in American Lobster (H. americanus) using size–frequency and tag–recapture data. The results were consistent with band counts in both immature and adult lobsters from the Bay of Fundy in eastern Canada. Also, Kilada and Acuña [41] correlated the band counts of gastric mill ossicles in three Chilean crustacean species with their age classes using size–frequency analysis, revealing a precise alignment with band counts. In case of blue crab (P. pelagicus), Kilada and Ibrahim [59] corroborated the growth band counts for wild animals from two Egyptian saltwater lakes using estimated age from carapace width frequency data.
The precision of the band counting process indicates whether there is any bias in the reproducibility of the band’s interpretation by two independent observers. In the current study, the coefficient of variation (CV) value was 7.2%, which indicates a small level of bias [33]. This value is analogous to findings documented in aging research for other crustaceans (Table S15). The standard range of CV values for fish range from 5% to 12% [29], whereas for bivalves it is between 5% and 7% [35]. Challenges such as distinguishing the growth bands from minor laminae, especially in thin sections, can contribute to the bias in precision, as shown in numerous publications. In the endocuticle, the apparent “growth bands” typically appear as paired translucent and opaque zones, but thinner sections may exaggerate fine-scale structures, leading to overcounting [59,79]. Therefore, careful section preparation is critical. Furthermore, to reduce the bias in the reproducibility of band counts between readers, proper training that takes more than two years and firm quality control procedures are required. Differences in experience among readers can also significantly affect the consistency of band interpretation.

4.2. Indirect Age Determination

In the current study, the indirect method of age determination (size–frequency analysis) revealed that the longevity of red swamp crayfish was three years old in both sexes in Giza and Aswan. Previous studies in Egypt demonstrated the age of red swamp crayfish via size–frequency analysis and found that the females have two age classes and males have one age class [80]. Other studies demonstrated that the longevity of the species is 4–5 years [10,81,82,83,84]. The age composition of adult red swamp crayfish gathered from brackish wetlands in Italy comprised six age classes for females and five to six for males [10], while other research identified only three age classes [81,85,86]. Scalici et al. [10] estimated the maximum longevity (tmax) of species as nine years. Huner [83] and Scalici and Gherardi [84] claim that the lifespan of species reaches 4 years in freshwater lakes in Louisiana and Italy, respectively, while Frutiger et al. [82] noted that the typical lifespan extends to three years in Central Europe, with larger individuals occasionally living up to five years (Table S12).
However, the longevity estimates from size–frequency analysis in the current study did not align with those obtained through direct age determination. Using validated growth band counts in the mesocardiac ossicles, this study found a maximum longevity of six years in Giza, where the mean annual temperature is 22 °C [62], and seven years in Aswan, with an annual mean temperature of 30 °C [63]. The discrepancy in the longevity estimated from the direct (band counts) and indirect (size–frequency analysis) methods may be explained by the error in estimating age using the indirect method, which lacks validation. Size–frequency analysis may be subjective to a certain extent and relies on the distinction between size classes. The age classes are clear in younger age but become overlapped as the animal grows. As a result, age estimation becomes inaccurate with older specimens [87,88]. In contrast, validated growth band counts offer accuracy and reliability, supporting more precise age-based stock assessments compared to those based solely on size.
The discrepancy in longevity estimates significantly influence the size-at-age values in the same species when different age determination methods are applied. For instance, in Aswan, the modal length of 1-year-olds based on size–frequency analysis corresponds to the mean length of 2-year-old individuals based on band counts (Table S13). Similarly, in Giza, the modal length of the second age class from length frequency analysis matches the mean length of 3-year-old red swamp crayfish determined by band counting. Finally, the third age class in Giza is comparable to the mean length of 6-year-olds by band counting. Furthermore, several age classes identified through direct band counting, ages 2, 4, and 5 in Giza and 1, 3, 4, and 6 in Aswan, were not detected by size–frequency analysis. These findings emphasize the limitations of size–frequency analysis and highlight the potential of using growth bands as a direct age determination method, which may provide more accurate age estimates for the species.
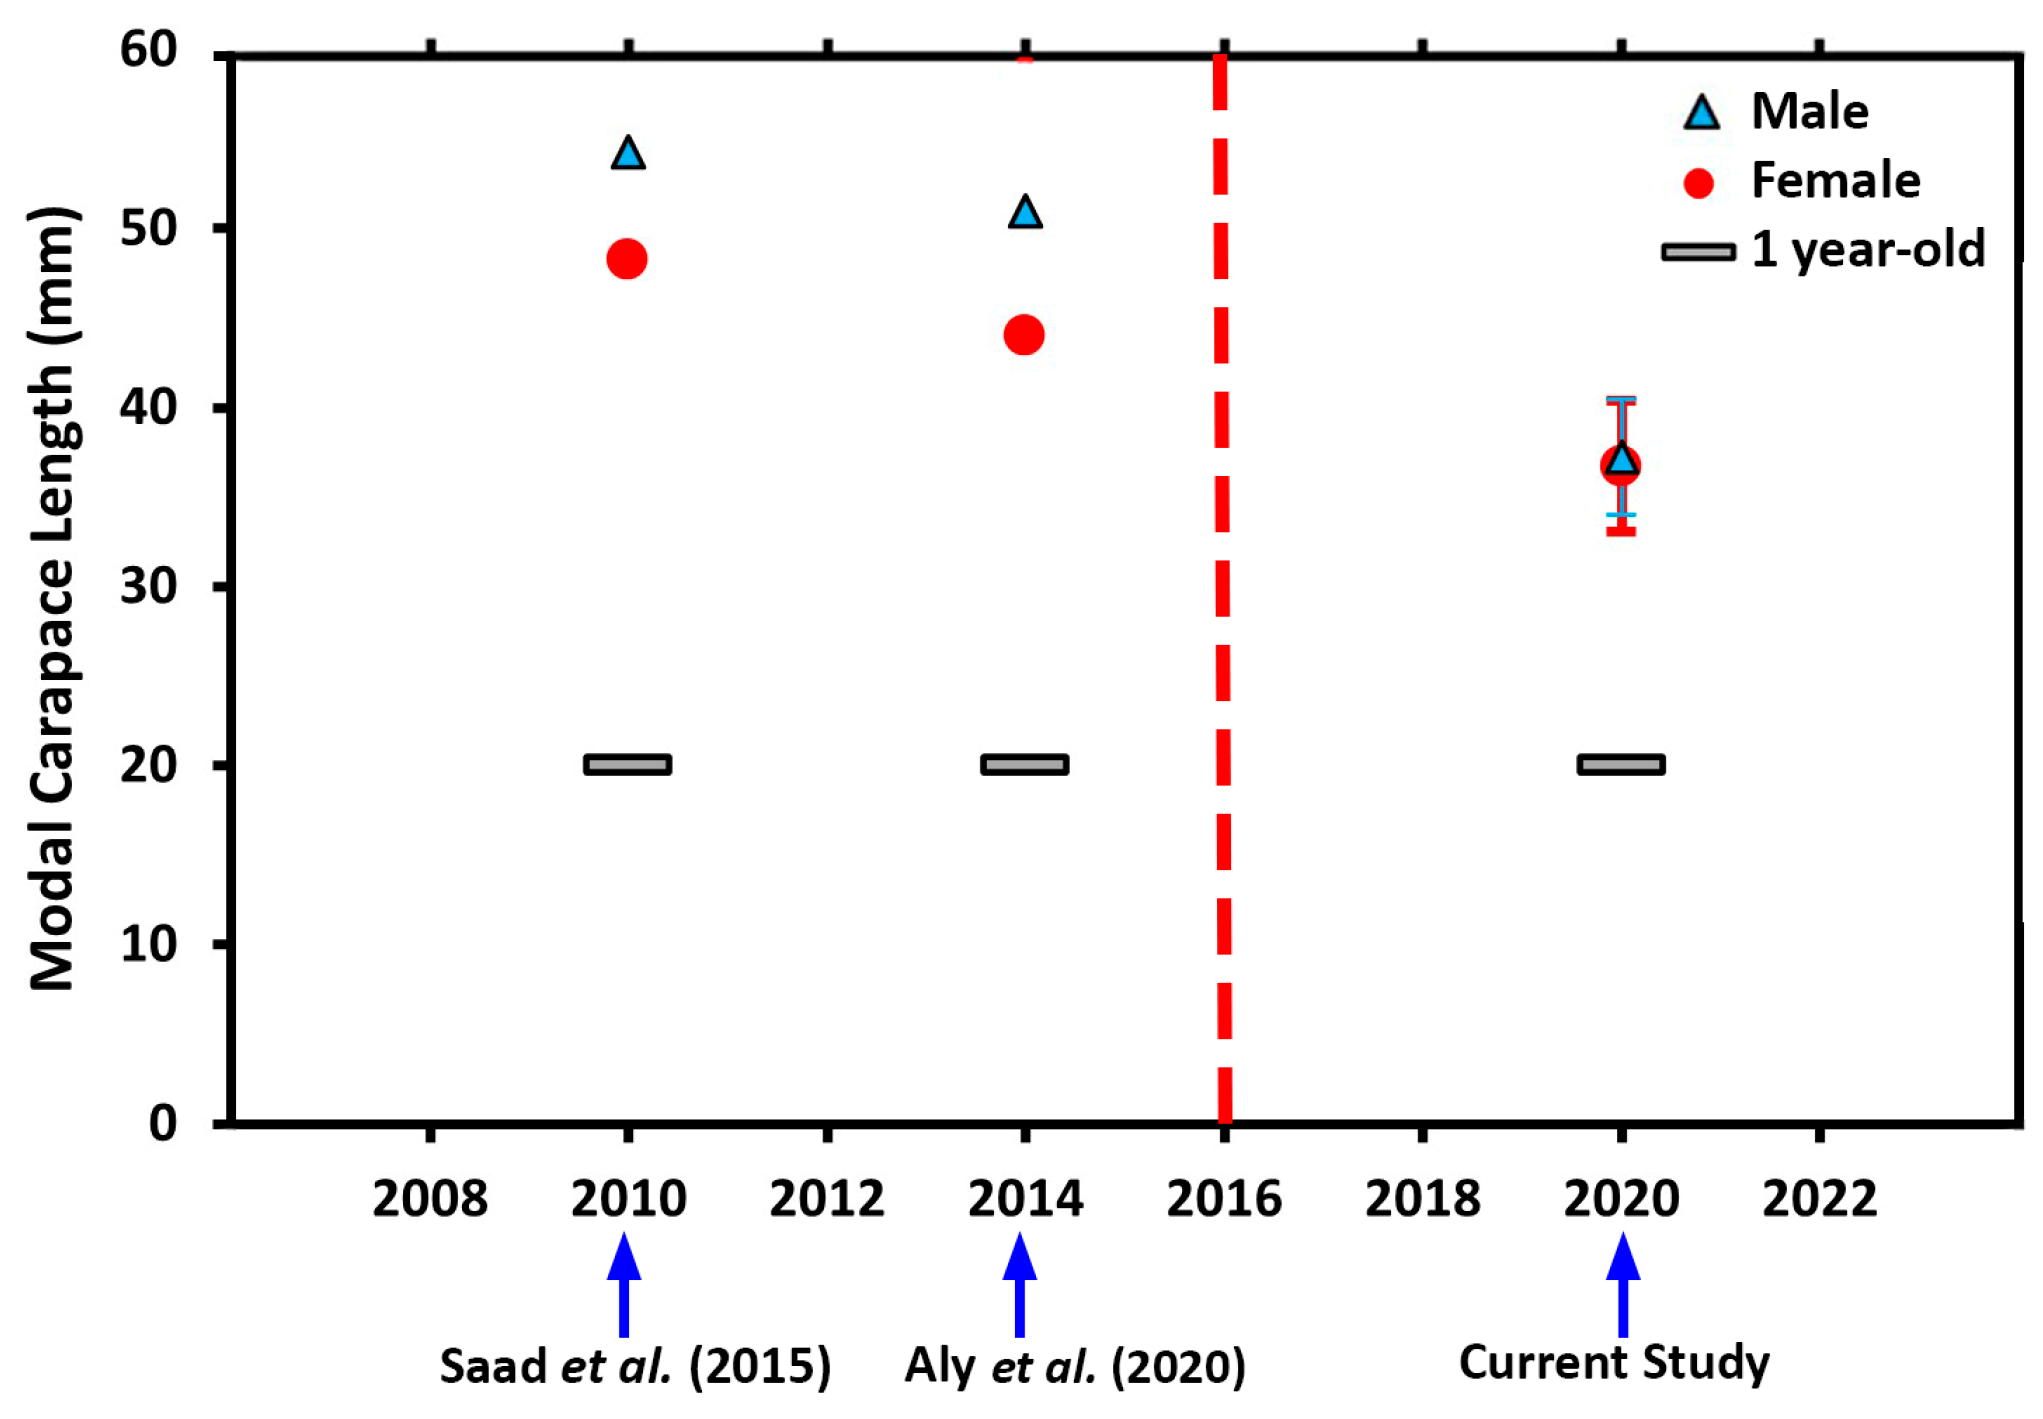
Unfortunately, no historical data on red swamp crayfish landings are available in Egypt, making it difficult to understand the current population status in relation to fisheries activities, except through the published literature. A significant decline in the modal CL at the first age class was observed between 2010 and 2020 (Figure 12). In 2010, the modal size-at-one-years-old was 48.2 mm and 54.3 mm (using length frequency analysis) for females and males, respectively, [80]. By 2014, these values had declined to 44.0 mm and 51.0 mm (using length frequency analysis) for females and males, respectively, [89]. In 2020, the current study recorded a further reduction to 36.7 mm and 37.2 mm for females and males, respectively. As mentioned earlier, direct and indirect aging methods provide similar size-at-one-years old for animals in the current work (Table S13) and hence the comparison with previous works between the two methods is valid.
The clear declining pattern in the modal size-at-one-years-old individuals over ten years may be attributed to changes in the fishing gear that is used in catching this species. In 2010 and 2014, more than 95% of the total fishing traps were Tilapia traps, with a large mesh size of 30 mm and with only two entrances. This allows smaller individuals (<30 mm CL) to escape [80]. Since 2016, Chinese traps have become extensively used. These traps have a smaller mesh size (10–14 mm) and up to ten entrances. Therefore, this shift in gear type has probably contributed to the observed decline in size-at-one-years-old individuals (Figure 12).
In addition to this, the main reason for changing fishing gear is the increase in the number of processing factories, from a single factory in 2010 to 10 factories in 2022. Moreover, many individual fishers have begun exporting live red swamp crayfish directly to China using foam ice boxes, bypassing the official processing centers. The unregulated and extensive exploitation of the species along the River Nile and its tributaries, including minor drainage canals, endangers the sustainability of the species. The lack of official catch-per-unit-effort (CPUE) data and absence of routine age–structure monitoring severely hinders accurate stock assessment plans. Filling in these gaps is critical to prevent additional decline and guarantee the long-term sustainability of red swamp crayfish fisheries in Egypt.

4.3. Growth Rate in Relation to Temperature

In the current work, the growth rate in the northern site (Giza, mean temperature 22 °C) was found to be higher than that in the southern site (Aswan, mean temperature 30 °C). This may be attributed to either genetic characteristics or variation in physicochemical variables (such as temperature) between the two sites. Mitochondrial cytochrome oxidase analysis showed minimal genetic variation between the two samples collected from the two sites, indicating that individuals from both locations are genetically similar [90]. Therefore, genetic factors do not explain the observed growth differences between the two sites.
The growth coefficient (k) indicates the rate at which the red swamp crayfish approach their asymptotic length; estimates using the direct age method were higher in Giza (0.687) than in Aswan (0.439), which may indicate a faster growth rate at lower temperature (Table S6). In conclusion, higher temperatures in Aswan may hinder the growth rate of red swamp crayfish. Similar results were observed in comparing the growth rate in the lab. The mean growth increment of individuals in the first year of age was 55 mm/year at 25 °C and 35.2 mm/year at 32 °C. Moreover, the relative molt increment reached its maximum at 25 °C and minimum at 32 °C, further supporting temperature’s role in modulating growth.
Few studies have been published investigating the optimal temperature range of the growth of red swamp crayfish. For example, in Luisiana in the USA, the growth rate of this species was higher in the fall, when the temperature was between 20 and 25 °C [49]. In a different study in Luisiana, the optimal range of the growth of the same species was found to be at temperatures ranging between 12.8 °C and 32 °C [51]. This was also demonstrated in another work in China [48].
In different crayfish species, winter freezing conditions cease the growth of virile crayfish (Orconectes virlis) for a few months each year [91]. Also, the white tubercled crayfish (Procambarus spiculifer) attained the highest mean individual growth rate at 23.4 °C and its growth also slowed at higher temperatures [50]. In the Mexican crayfish (Procambarus llamasi), growth was found to be enhanced with rising temperatures of up to 26 °C [92].
Unlike fish, the growth of crustaceans is limited only during the intermolt phase [71]. In the current study, a higher temperature (32 °C as compared with 25 °C) shortened the intermolt period and, as a result, decreased the relative molt increment, causing a decline in the growth rate, and this was documented in other crustaceans [71]. Also, in the current study, the reduction in the molt increment at high temperatures approaching 32 °C may have resulted from boosted metabolic activity induced by increased temperatures [48,93]. In conclusion, growth, measured as carapace length increment per molt, diminished with rising temperatures. Furthermore, the ideal temperature for the embryonic development of the species was suggested to be 25 °C, whereas embryonic exposure to temperatures of 29–33 °C resulted in defects and developmental arrest [94].
The impact of temperature on red swamp crayfish growth is also reflected in the period required to reach the marketable size in the lab experiment. The marketable size for harvested crayfish according to Egyptian crayfish exporters ranges between 38 and 42 mm (CL). In the lab experiment, individuals raised at 25 °C reached the marketable size faster (in 0.94 years) than those that were kept at 32 °C (in 1.53 years), as shown in Figure 13 and Table S14. This highlights the importance of thermal conditions in future trials of red swamp crayfish aquaculture in Egypt.
The determination of the age of red swamp crayfish holds considerable significance for the management of its fisheries. Regional size-at-age curves for red swamp crayfish populations subjected to various environmental factors should be established, thereby enhancing the accuracy of age-based stock assessments and improving the formulation of growth models. The fisheries of this species possess significant social, environmental, and economical importance for Egypt, so the enhancement of its management is necessary.
Similar studies on the regional age of harvestable size were conducted on other crustacean species. Huntsberger et al. [39] compared the age of harvestable size of Jonah crab (C. borealis) from divergent climatic regimes along the Maine coastline in the eastern United States, where crabs in a cooler environment were shown to have a greater number of bands compared to those of equivalent size in a hotter environment. The heat slope in the Gulf of Maine creates a perfect setting to assess the influence of temperature on growth, varying the size-at-age value. In analogous research on the American lobster (H. americanus), Huntsberger also identified a considerably greater number of bands in individuals from cooler regions compared to those from warmer environments, aligning with anticipated variations in age-at-size [43].

4.4. Size and Age at Sexual Maturity

The mean size and age at sexual maturity holds significance in evaluating the impact of environmental variables on natural populations [95] and is a useful measure of crayfish potential growth within a certain habitat [96,97]. Favorable settings produce larger mature animals than populations that are overfished [98] or those that have high densities, limited food supplies, fluctuating water levels, and poor water quality [99]. In the current study, the females reached sexual maturity at a size smaller than males. The 50% mature crayfish in Giza were attained in the female and males at CL of 30.45 and 33.54 mm after 0.94 and 1 year, respectively, while in Aswan they were attained at CL of 30.64 and 32.51 mm after 0.99 and 0.98 years for females and males, respectively. Consequently, any management strategy for this species must guarantee that the average capture size exceeds 35 mm for carapace length. Our research presents the age, growth rate, and size at sexual maturity as an initial step toward recognizing the biology of freshwater crayfish and their growth patterns across different localities in Egypt.
The maturation period of red swamp crayfish ranges from 2 to 8 months in subtropical zones, depending on water temperature and dietary factors [100,101,102,103]. Correia and Costa [104] observed that the estimated mean CL50 of the species in Portugal was 36.4 mm for males and 36.2 mm for females, which was smaller than that obtained by Oluoch [105] in Kenya and by Correia [106] in Portugal. These results are similar to those reported by Huner and Romaire [99] in Louisiana’s natural areas and by Sommer and Goldman [107] in the rice fields of California, USA [108,109].

5. Conclusions

Growth bands were detected in thin sections of the mesocardiac ossicles of the red swamp freshwater crayfish. These growth bands were validated to be age indicator using known-age animals raised in captivity for 2.5 years. The species could live in the wild for up to seven years and grow faster at 25 °C than at 32 °C. This direct method of age determination is suggested to be more accurate than the indirect method using size–frequency analysis. The indirect method has estimated the longevity of the species to be only 3 years. The study also suggested that further studies are required to understand the mechanism by which the crustacean animal was able to retain the bands after many molting events that occurred throughout its life cycle.

Supplementary Materials

The following supporting information can be downloaded at: https://www.mdpi.com/article/10.3390/fishes10090453/s1, Figure S1: Photograph showing dorsal view of red swamp crayfish; Figure S2: Chinese trap used in fishing of red swamp crayfish in Egypt; Figure S3: Regional comparison of average band counts for crayfish in harvestable size range (45.8 mm); Figure S4: Size– at–sexual maturity of red swamp crayfish in Giza and Aswan; Figure S5: Age–at–sexual maturity of red swamp crayfish in Giza and Aswan; Table S1: Mean molt Frequency and mean growth increment in carapace length (mm) of red swamp crayfish; Table S2: Tuckey’s post hoc test for molt frequency and growth increment in the first year for all lab groups; Table S3: Mean carapace length, standard deviation, and separation index from the modal analysis provided from the FiSAT analysis for red swamp crayfish from four lab groups; Table S4: Calculated von Bertalanffy equation for red swamp crayfish in the lab groups; Table S5: Likelihood Ratio test for significance between females’ and males’ von Bertalanffy growth curves in all lab groups; Table S6: Estimated von Bertalanffy growth parameters for red swamp crayfish in Giza and Aswan using band counts; Table S7: Mean carapace length (mm) for red swamp crayfish in Giza and Aswan for band counts [B.C.] (years) from 1 to 7; Table S8: Mean carapace length for each age group, standard deviation, and separation index using Bhattacharya’s method for red swamp crayfish from Giza and Aswan; Table S9: Size–at–sexual maturity (CL50) by mm for males and females of red swamp crayfish in Giza and Aswan; Table S10: Age–at–sexual maturity (A50) by year for males and females of red swamp crayfish in Giza and Aswan; Table S11: Absolute age and corresponding mean number of molts in different decapod crustaceans; Table S12: von Bertalanffy growth parameters (CL, K, to), age, maximum longevity (tmax), total mortality (Z), natural mortality (M), and fishing mortality (F) of red swamp crayfish, estimated by length frequency analysis from different locations around the world; Table S13: Comparison of the two methods of aging (band counts and length frequency analysis) of red swamp crayfish in current study with corresponding mean carapace length in mm. Further comparison illustrated in the table between length frequency analysis in current study and two previous studies in 2015 and 2020 on red swamp crayfish populations near Giza, Egypt; Table S14: Tukey’s post hoc test for differences in average absolute age for crayfish at harvestable size in the four lab groups; Table S15: Mean coefficient of variation (CV) values used to evaluate the precision of band counts conducted by two independent readers in crustacean age determination studies (2012–2024).

Author Contributions

M.S., R.K. and M.K.—experimental design, data collection, analysis, writing; S.M. and A.S.—data analysis and reviewing the manuscript. All authors have read and agreed to the published version of the manuscript.

Funding

This research was funded by the JESOR Project “Novel extraction and industry from wastes and exoskeleton of the introduced freshwater crawfish” Academy of Scientific Research and Technology (ASRT), Cairo, Egypt 2016.

Institutional Review Board Statement

This research examines the ecological study of wild fish habitats, the red swamp crayfish (Procambarus clarkii), through sampling along the River Nile in Egypt, without including human participants, vertebrate animal trials, or protected species. Ethics approval is not required, as the project does not include sensitive biological materials, human subjects, or issues pertaining to animal welfare.

Data Availability Statement

Data are contained within the article and Supplementary Materials.

Acknowledgments

We want to thank the staff of the Aquatic Ecology Laboratory at the Faculty of Science, Ain Shams University, for helping us with rearing the animals. Special thanks are given to the staff of the population dynamics Laboratory in the National Institute of Oceanography and Fisheries (NIOF), Suez, in Egypt for their assistance during sectioning of the ossicle’s specimens. We also thank many crayfish fishers in Giza and Aswan for sampling specimens from different sites. Thanks are also to two anonymous reviewers for their constructive comments.

Conflicts of Interest

There are no conflicts of interest.

References

  1. Capinha, C.; Anastácio, P. Assessing the Environmental Requirements of Invaders Using Ensembles of Distribution Models: Environmental Requirements from Ensembles of Models. Divers. Distrib. 2011, 17, 13–24. [Google Scholar] [CrossRef]
  2. Lodge, D.M.; Taylor, C.A.; Holdich, D.M.; Skurdal, J. Nonindigenous Crayfishes Threaten North American Freshwater Biodiversity: Lessons from Europe. Fisheries 2000, 25, 7–20. [Google Scholar] [CrossRef]
  3. Lane, S.J.; Fujioka, M. The Impact of Changes in Irrigation Practices on the Distribution of Foraging Egrets and Herons (Ardeidae) in the Rice Fields of Central Japan. Biol. Conserv. 1998, 83, 221–230. [Google Scholar] [CrossRef]
  4. Galeotti, P.; Rubolini, D.; Fea, G.; Ghia, D.; Nardi, P.A.; Gherardi, F.; Fasola, M. Female Freshwater Crayfish Adjust Egg and Clutch Size in Relation to Multiple Male Traits. Proc. R. Soc. B Biol. Sci. 2006, 273, 1105–1110. [Google Scholar] [CrossRef]
  5. Loureiro, T.G.; Anastácio, P.M.; Bueno, S.L.S.; Araujo, P.B.; Souty-Grosset, C.; Almerão, M.P. Distribution, Introduction Pathway, and Invasion Risk Analysis of the North American Crayfish Procambarus clarkii (Decapoda: Cambaridae) in Southeast Brazil. J. Crustac. Biol. 2015, 35, 88–96. [Google Scholar] [CrossRef]
  6. Oficialdegui, F.J.; Clavero, M.; Sánchez, M.I.; Green, A.J.; Boyero, L.; Michot, T.C.; Klose, K.; Kawai, T.; Lejeusne, C. Unravelling the Global Invasion Routes of a Worldwide Invader, the Red Swamp Crayfish (Procambarus clarkii). Freshw. Biol. 2019, 64, 1382–1400. [Google Scholar] [CrossRef]
  7. Clark, W.H.; Ralston, G.L. First Record of Crayfish from Baja California, Mexico (Decapoda, Astacidea). Crustaceana 1976, 30, 106–107. [Google Scholar] [CrossRef]
  8. Azofeifa-Solano, J.C.; Villalobos-Rojas, F.; Romero-Chaves, R.; Wehrtmann, I.S. Modeling the Habitat Suitability of Two Exotic Freshwater Crayfishes in Mesoamerica and the Caribbean: Cherax quadricarinatus (von Martens, 1868) and Procambarus clarkii Girard, 1852 (Decapoda: Astacidea: Parastacidae, Cambaridae). J. Crustac. Biol. 2023, 43, ruad059. [Google Scholar] [CrossRef]
  9. Gutiérrez-Yurrita, P.J.; Montes, C. Bioenergetics of Juveniles of Red Swamp Crayfish (Procambarus clarkii). Comp. Biochem. Physiol. A Mol. Integr. Physiol. 2001, 130, 29–38. [Google Scholar] [CrossRef] [PubMed]
  10. Scalici, M.; Chiesa, S.; Scuderi, S.; Celauro, D.; Gibertini, G. Population Structure and Dynamics of Procambarus clarkii (Girard, 1852) in a Mediterranean Brackish Wetland (Central Italy). Biol. Invasions 2010, 12, 1415–1425. [Google Scholar] [CrossRef]
  11. Matsuzaki, S.S.; Terui, A.; Kodama, K.; Tada, M.; Yoshida, T.; Washitani, I. Influence of Connectivity, Habitat Quality and Invasive Species on Egg and Larval Distributions and Local Abundance of Crucian Carp in Japanese Agricultural Landscapes. Biol. Conserv. 2011, 144, 2081–2087. [Google Scholar] [CrossRef]
  12. Putra, M.D.; Bláha, M.; Wardiatno, Y.; Krisanti, M.; Yonvitner; Jerikho, R.; Kamal, M.M.; Mojžišová, M.; Bystřický, P.K.; Kouba, A.; et al. Procambarus clarkii (Girard, 1852) and Crayfish Plague as New Threats for Biodiversity in Indonesia. Aquat. Conserv. Mar. Freshw. Ecosyst. 2018, 28, 1434–1440. [Google Scholar] [CrossRef]
  13. Ibrahim, A.; Khalil, M. The Red Swamp Crayfish in Egypt, 1st ed.; the Center of Research and Studies of Protectorates, Ain Shams University: Cairo, Egypt, 2009. [Google Scholar]
  14. Yahkoub, Y.B.; Fekhaoui, M.; El Qoraychy, I.; Yahyaoui, A. Current State of Knowledge on Louisiana Crawfish (Procambarus clarkii Girard, 1852) in Morocco. Aquac. Aquar. Conserv. Legis. 2019, 12, 618–628. [Google Scholar]
  15. Geiger, W.; Alcorlo, P.; Baltanás, A.; Montes, C. Impact of an Introduced Crustacean on the Trophic Webs of Mediterranean Wetlands. Biol. Invasions 2005, 7, 49–73. [Google Scholar] [CrossRef]
  16. Cruz, M.J.; Rebelo, R. Colonization of Freshwater Habitats by an Introduced Crayfish, Procambarus clarkii, in Southwest Iberian Peninsula. Hydrobiologia 2007, 575, 191–201. [Google Scholar] [CrossRef]
  17. Chucholl, C. Population Ecology of an Alien “Warm Water” Crayfish (Procambarus clarkii) in a New Cold Habitat. Knowl. Manag. Aquat. Ecosyst. 2011, 29, 401. [Google Scholar] [CrossRef]
  18. Mazza, G.; Tricarico, E.; Genovesi, P.; Gherardi, F. Biological Invaders Are Threats to Human Health: An Overview. Ethol. Ecol. Evol. 2014, 26, 112–129. [Google Scholar] [CrossRef]
  19. Lemmers, P.; Van Der Kroon, R.; Van Kleef, H.H.; Verhees, J.J.F.; Van Der Velde, G.; Leuven, R.S.E.W. Limiting Burrowing Activity and Overland Dispersal of the Invasive Alien Red Swamp Crayfish Procambarus clarkii by Sophisticated Design of Watercourses. Ecol. Eng. 2022, 185, 106787. [Google Scholar] [CrossRef]
  20. Haubrock, P.J.; Inghilesi, A.F.; Mazza, G.; Bendoni, M.; Solari, L.; Tricarico, E. Burrowing Activity of Procambarus clarkii on Levees: Analysing Behaviour and Burrow Structure. Wetl. Ecol. Manag. 2019, 27, 497–511. [Google Scholar] [CrossRef]
  21. Ibrahim, A.M.; Khalil, M.T.; Mubarak, F. On the Feeding Behavior of the Exotic Crayfish Procambarus clarkii in Egypt and Its Prospects in the Biocontrol of Local Vector Snails. J. Union Arab. Biol. Cairo 1995, 4, 321–340. [Google Scholar]
  22. Tolba, R. The Red Swamp Crayfish Procambarus clarkit (Decapoda; Cambaridae) as Bio-Indicator for Otal Water Quality Including Cu and Cd Pollution. Egypt. J. Aquat. Biol. Fish. 1999, 3, 59–71. [Google Scholar] [CrossRef]
  23. Ibrahim, A.; Khalil, M.; Mubarak, M. Ecological Studies on the Exotic Crayfishes Procambarus clarkii (Girard 1852) and P. Zoangulus Hobbs & Hobbs 1990, in the River Nile Egypt. J.-Egypt. Ger. Soc. Zool. 1996, 20, 167–186. [Google Scholar]
  24. Ibrahim, A.; Khalil, M.; Mubark, M. Ecological Studies on the Exotic Crayfishes Procambarus clarkii and Procambarus Zonangulus in the River Nile. Int. J. Ecol. Env. Sci. 1997, 23, 217–228. [Google Scholar]
  25. Soliman, G.; El-Assal, F.; El-Deen, M.; Hamdi, S. The Reproductive Biology of the Red Swamp Crayfish P. clarkii (Girard, 1852) (Decapoda: Cambridae) in the River Nile, Egypt. Egypt. J. Zool. 1998, 30, 311–325. [Google Scholar]
  26. Soliman, G.; El-Assal, F.; El-Deen, M.S.; Hamdy, S. Habitat, Distribution and Behaviour of the Red Swamp Crawfish Procambarus clarkii (Girard, 1852) (Decapoda: Combaridae) in the River Nile, Egypt. Egypt. J. Zool. 1998, 30, 297–310. [Google Scholar]
  27. Hamdi, S. Studies on the Red Swamp Crayfish Procambarus clarkii (Girard, 1852) (Decapoda: Camrbaridae) in the River Nile. Master’s Thesis, Cairo University, Giza, Egypt, 1994. [Google Scholar]
  28. Kilada, R.W.; Roddick, D.; Mombourquette, K. Age Determination, Validation, Growth and Minimum Size of Sexual Maturity of the Greenland smoothcockle (Serripes groenlandicus, Bruguiere, 1789) in Eastern Canada. J. Shellfish Res. 2007, 26, 443–450. [Google Scholar] [CrossRef]
  29. Campana, S.E. Accuracy, Precision and Quality Control in Age Determination, Including a Review of the Use and Abuse of Age Validation Methods. J. Fish Biol. 2001, 59, 197–242. [Google Scholar] [CrossRef]
  30. Campana, S.E.; Marks, L.; Joyce, W.; Kohler, N.E. Effects of Recreational and Commercial Fishing on Blue Sharks (Prionace glauca) in Atlantic Canada, with Inferences on the North Atlantic Population. Can. J. Fish. Aquat. Sci. 2006, 63, 670–682. [Google Scholar] [CrossRef]
  31. Hartnoll, R.G.; Paul, R.G.K. The Embryonic Development of Attached and Isolated Eggs of Carcinus maenas. Int. J. Invertebr. Reprod. 1982, 5, 247–252. [Google Scholar] [CrossRef]
  32. Hartnoll, R.G. Growth in Crustacea—Twenty Years On. In Advances in Decapod Crustacean Research; Paula, J.P.M., Flores, A.A.V., Fransen, C.H.J.M., Eds.; Springer: Dordrecht, The Netherlands, 2001; pp. 111–122. ISBN 978-90-481-5688-7. [Google Scholar]
  33. Kilada, R.; Driscoll, J.G. Age Determination in Crustaceans: A Review. Hydrobiologia 2017, 799, 21–36. [Google Scholar] [CrossRef]
  34. Sheehy, M.R.J. Potential of Morphological Lipofuscin Age-Pigment as an Index of Crustacean Age. Mar. Biol. 1990, 107, 439–442. [Google Scholar] [CrossRef]
  35. Kilada, R.; Sainte-Marie, B.; Rochette, R.; Davis, N.; Vanier, C.; Campana, S. Direct Determination of Age in Shrimps, Crabs, and Lobsters. Can. J. Fish. Aquat. Sci. 2012, 69, 1728–1733. [Google Scholar] [CrossRef]
  36. Leland, J.C.; Coughran, J.; Bucher, D.J. A Preliminary Investigation into the Potential Value of Gastric Mills for Ageing Crustaceans. In New Frontiers in Crustacean Biology; Brill: Leiden, The Netherlands, 2011; pp. 57–68. ISBN 90-474-2771-8. [Google Scholar]
  37. Gnanalingam, G.; Butler, M.J.; Matthews, T.R.; Hutchinson, E.; Kilada, R. Directly Ageing the Caribbean Spiny Lobster, Panulirus Argus with Validated Band Counts from Gastric Mill Ossicles. ICES J. Mar. Sci. 2019, 76, 442–451. [Google Scholar] [CrossRef]
  38. Mullowney, D.; O’Connell, N.; Kilada, R.; Rochette, R. Refining Age at Legal-Size Estimation in the Newfoundland & Labrador Populations of the Snow Crab Chionoecetes opilio (Fabricius, 1788) (Decapoda: Brachyura: Oregoniidae). J. Crustac. Biol. 2023, 43, ruad067. [Google Scholar] [CrossRef]
  39. Huntsberger, C.J.; Kilada, R.; Chen, Y.; Wahle, R.A. Integrating Different Aging Methods to Model the Dynamics of Hard-to-Age Crab Growth: Age at Size Estimates for the Jonah crab (Cancer Borealis). Fish. Res. 2024, 276, 107061. [Google Scholar] [CrossRef]
  40. Vatcher, H.E.; Roer, R.D.; Dillaman, R.M. Structure, Molting, and Mineralization of the Dorsal Ossicle Complex in the Gastric Mill of the Blue Crab, C Allinectes sapidus: Structure of blue crab ossicle and tooth. J. Morphol. 2015, 276, 1358–1367. [Google Scholar] [CrossRef] [PubMed]
  41. Kilada, R.; Acuña, E. Direct Age Determination by Growth Band Counts of Three Commercially Important Crustacean Species in Chile. Fish. Res. 2015, 170, 134–143. [Google Scholar] [CrossRef]
  42. Mouser, J.B.; Glover, J.; Brewer, S.K. Gastric Mill Age Estimates for Ringed Crayfish Faxonius neglectus neglectus (Faxon) and the Influence of Temperature on Band Formation. Freshw. Crayfish 2020, 25, 59–67. [Google Scholar] [CrossRef]
  43. Huntsberger, C.J.; Kilada, R.; Ambrose, W.G.; Wahle, R.A. Age-at-Size Relationships of the American Lobster (Homarus americanus) from Three Contrasting Thermal Regimes Using Gastric Mill Band Counts as a Direct Aging Technique. Can. J. Fish. Aquat. Sci. 2020, 77, 1733–1740. [Google Scholar] [CrossRef]
  44. Sheridan, M.; O’Connor, I.; Henderson, A.C. Investigating the Effect of Molting on Gastric Mill Structure in Norway Lobster (Nephrops norvegicus) and Its Potential as a Direct Ageing Tool. J. Exp. Mar. Biol. Ecol. 2016, 484, 16–22. [Google Scholar] [CrossRef]
  45. Becker, C.; Dick, J.T.A.; Cunningham, E.M.; Schmitt, C.; Sigwart, J.D. The Crustacean Cuticle Does Not Record Chronological Age: New Evidence from the Gastric Mill Ossicles. Arthropod Struct. Dev. 2018, 47, 498–512. [Google Scholar] [CrossRef] [PubMed]
  46. Sheridan, M.; O’Connor, I. Evidence of Complete Gastric Mill Ossicle Loss at Ecdysis in the European Green Crab Carcinus maenas (Linnaeus, 1758) (Decapoda: Brachyura: Carcinidae). J. Crustac. Biol. 2018, 38, 435–442. [Google Scholar] [CrossRef]
  47. Sheridan, M.; Durán, J.; Gil, M.D.M.; Pastor, E.; O’Connor, I. Can Crustacean Cuticle Preserve a Record of Chronological Age? Investigating the Utility of Decapod Crustacean Eyestalks for Age Determination of Two European Spider Crab Species. Fish. Res. 2020, 224, 105467. [Google Scholar] [CrossRef]
  48. He, N.; Ruan, G.; Liu, Y. Effects of Sustained High-Temperature Stress on Growth, Performance, Digestive Enzyme Activity and Immune Indexes of Crayfish, Procambarus clarkii. Acta Hydrobiol. Sin. 2022, 46, 395–402. [Google Scholar]
  49. Romaire, R.P.; Lutz, C.G. Population Dynamics of Procambarus clarkii (Girard) and Procambarus acutus acutus (Girard) (Decapoda: Cambaridae) in Commercial Ponds. Aquaculture 1989, 81, 253–274. [Google Scholar] [CrossRef]
  50. Taylor, R.C. Crayfish (Procambarus spiculifer) Growth Rate and Final Thermal Preferendum. J. Therm. Biol. 1990, 15, 79–81. [Google Scholar] [CrossRef]
  51. Huner, J.V.; Barr, J.E. Red Swamp Crawfish: Biology and Exploitation, 3rd ed.; Louisiana Sea Grant College Program, Louisiana State University: Baton Rouge, LA, USA, 1991. [Google Scholar]
  52. Aquiloni, L.; Gherardi, F. Evidence of Female Cryptic Choice in Crayfish. Biol. Lett. 2008, 4, 163–165. [Google Scholar] [CrossRef]
  53. Anastacio, P.M.; Parente, V.S.; Correia, A.M. Crayfish Effects on Seeds and Seedlings: Identification and Quantification of Damage. Freshw. Biol. 2005, 50, 697–704. [Google Scholar] [CrossRef]
  54. Badr, A. Fulfilling the Potentials of Residential Solar Energy in Egypt. Build. Eng. 2024, 2, 1510. [Google Scholar] [CrossRef]
  55. Oliveira, J.; Fabião, A. Growth Responses of Juvenile Red Swamp Crayfish, Procambarus clarkii Girard, to Several Diets under Controlled Conditions. Aquac. Res. 1998, 29, 123–129. [Google Scholar] [CrossRef]
  56. Jover, M.; Fernández-Carmona, J.; Del Río, M.C.; Soler, M. Effect of Feeding Cooked-Extruded Diets, Containing Different Levels of Protein, Lipid and Carbohydrate on Growth of Red Swamp Crayfish (Procambarus clarkii). Aquaculture 1999, 178, 127–137. [Google Scholar] [CrossRef]
  57. Gutiérrez-Yurrita, P.J.; Del Olmo, C.M. Population Dynamics of Juveniles of Red Swamp Crayfish (Procambarus clarkii) under Controlled Conditions. Freshw Crayfish 2004, 14, 180–189. [Google Scholar]
  58. Leland, J.C.; Bucher, D.J.; Coughran, J. Direct Age Determination of a Subtropical Freshwater Crayfish (Redclaw, Cherax quadricarinatus) Using Ossicular Growth Marks. PLoS ONE 2015, 10, e0134966. [Google Scholar] [CrossRef] [PubMed]
  59. Kilada, R.; Ibrahim, N.K. Preliminary Investigation of Direct Age Determination Using Band Counts in the Gastric Mill of the Blue Swimmer Crab (Portunus PelagicusLinnaeus, 1758) in Two Salt-Water Lakes in the Eastern Mediterranean. J. Crustac. Biol. 2016, 36, 119–128. [Google Scholar] [CrossRef]
  60. Rebert, A.L.; Kruse, G.H.; Webb, J.B.; Tamone, S.L.; Oxman, D.; McNeel, K.W. Evaluation of a Direct Age Estimation Method for Terminally Molted Male Snow Crab Chionoecetes opilio (Fabricius 1788) (Decapoda: Brachyura: Oregoniidae). J. Crustac. Biol. 2020, 40, 549–555. [Google Scholar] [CrossRef]
  61. Chakraborty, R.D.; Gayathri, A.P.; Purushothaman, P.; Kuberan, G.; Maheswarudu, G.; Abdussamad, E.M. Preliminary Investigation of Age Analysis in Crustacean Species from the Indian Coast, Using Growth Bands. Crustaceana 2022, 95, 605–614. [Google Scholar] [CrossRef]
  62. Nagy, A.; El-Zeiny, A.; Elshaier, M.; Sowilem, M.; Atwa, W. Water Quality Assessment of Mosquito Breeding Water Localities in the Nile Valley of Giza Governorate. J. Environ. Sci. Mansoura Univ. 2021, 50, 1–10. [Google Scholar] [CrossRef]
  63. Ashour, M.A.; El Degwee, Y.A.; Hashem, R.H.; Abdou, A.A.; Abu-Zaid, T.S. The Extent to Which the Available Water Resources in Upper Egypt Can Be Affected by Climate Change. Limnol. Rev. 2024, 24, 164–177. [Google Scholar] [CrossRef]
  64. Taketomi, Y.; Nishikawa, S.; Koga, S. Testis and Androgenic Gland During Development of External Sexual Characteristics of the Crayfish Procambarus clarkii. J. Crustac. Biol. 1996, 16, 24–34. [Google Scholar] [CrossRef]
  65. Ando, H.; Makioka, T. Structure of the Ovary and Mode of Oogenesis in a Freshwater Crayfish, Procambarus clarkii (Girard). Zoolog. Sci. 1998, 15, 893–901. [Google Scholar] [CrossRef]
  66. Zhong, Y.; Zhao, W.; Tang, Z.; Huang, L.; Zhu, X.; Liang, X.; Yan, A.; Lu, Z.; Yu, Y.; Tang, D.; et al. Comparative Transcriptomic Analysis of the Different Developmental Stages of Ovary in Red Swamp Crayfish Procambarus clarkii. BMC Genom. 2021, 22, 199. [Google Scholar] [CrossRef] [PubMed]
  67. Saad, A.E.-H.; Hassan, M. Anatomical and Histological Studies on the Male Reproductive System of the Red Swamp Crayfish Procambarus clarkii. Egypt. J. Aquat. Biol. Fish. 2010, 14, 87–100. [Google Scholar] [CrossRef]
  68. Hutchinson, C.E.; TenBrink, T.T. Age Determination of the Yellow Irish Lord: Management Implications as a Result of New Estimates of Maximum Age. N. Am. J. Fish. Manag. 2011, 31, 1116–1122. [Google Scholar] [CrossRef]
  69. Kilada, R.; Agnalt, A.-L.; Hammeken Arboe, N.; Bjarnason, S.; Burmeister, A.; Farestveit, E.; Gíslason, Ó.S.; Guðlaugsdóttir, A.; Guðmundsdóttir, D.; Jónasson, J.P.; et al. Feasibility of Using Growth Band Counts in Age Determination of Four Crustacean Species in the Northern Atlantic. J. Crustac. Biol. 2015, 35, 499–503. [Google Scholar] [CrossRef]
  70. Kilada, R.; Webb, J.B.; McNeel, K.W.; Slater, L.M.; Smith, Q.; Ferguson, J. Preliminary Assessment of a Direct Age Determination Method for 3 Commercially Important Crustaceans from Alaska. Fish. Bull. 2016, 115, 42–49. [Google Scholar] [CrossRef]
  71. Hartnoll, R. Strategies of Crustacean Growth. Mem. Aust. Mus. 1983, 18, 121–131. [Google Scholar] [CrossRef]
  72. Gong, J.; Yu, K.; Shu, L.; Ye, H.; Li, S.; Zeng, C. Evaluating the Effects of Temperature, Salinity, Starvation and Autotomy on Molting Success, Molting Interval and Expression of Ecdysone Receptor in Early Juvenile Mud Crabs, Scylla Paramamosain. J. Exp. Mar. Biol. Ecol. 2015, 464, 11–17. [Google Scholar] [CrossRef]
  73. Gencer, Ö. Survival and Moulting Rates of Larvae of Callinectes Sapidus Rathbun, 1896 under Different Environmental Circumstances (Brachyura, Portunidae). Crustaceana 2023, 96, 1135–1150. [Google Scholar] [CrossRef]
  74. Hutchinson, E.; Matthews, T.R.; Ross, E.; Hagedorn, S.; Butler, M.J. Gastric Mill Ossicles Record Chronological Age in the Caribbean Spiny Lobster (Panulirus argus). Fish. Res. 2024, 277, 107083. [Google Scholar] [CrossRef]
  75. Price, J.O.; Payne, J.F. Size, Age, and Population Dynamics in an R-Selected Population of Orconectes Neglectus Chaenodactylus Williams (Decapoda, Cambaridae). Crustaceana 1984, 46, 29–38. [Google Scholar] [CrossRef]
  76. Liu, B.; Zhang, J.; Rui, J.; Ni, Z.; Shu, C. Growth Marks in Eyestalks of Portunus Trituberculatus: A Development of Technique and Evidence of Molting. Acta Oceanol. Sin. 2021, 40, 84–91. [Google Scholar] [CrossRef]
  77. Kilada, R.; Reiss, C.S.; Kawaguchi, S.; King, R.A.; Matsuda, T.; Ichii, T. Validation of Band Counts in Eyestalks for the Determination of Age of Antarctic Krill, Euphausia Superba. PLoS ONE 2017, 12, e0171773. [Google Scholar] [CrossRef] [PubMed]
  78. Fowler, A. Validation of Annual Growth Increments in the Otoliths of a Small, Tropical Coral Reef Fish. Mar. Ecol. Prog. Ser. 1990, 64, 25–38. [Google Scholar] [CrossRef]
  79. Amato, C.G.; Waugh, D.A.; Feldmann, R.M.; Schweitzer, C.E. Effect of Calcification on Cuticle Density in Decapods: A Key to Lifestyle. J. Crustac. Biol. 2008, 28, 587–595. [Google Scholar] [CrossRef]
  80. Saad, A.E.-H.; Mehanna, S.; Khalil, M.; Said, M. Population Dynamics of the Freshwater Crayfish Procambarus clarkii (Girard,1852) in the River Nile, Egypt. Egypt. J. Aquat. Biol. Fish. 2015, 19, 101–116. [Google Scholar] [CrossRef][Green Version]
  81. Chiesa, S.; Scalici, M.; Gibertin, G. Occurrence of Allochthonous Freshwater Crayfishes in Latium (Central Italy). Bull. Fr. Pêche Piscic. 2006, 380–381, 883–902. [Google Scholar] [CrossRef]
  82. Frutiger, A.; Borner, S.; Büsser, T.; Eggen, R.; Müller, R.; Müller, S.; Wasmer, H. How to Control Unwanted Populations of Procambarus clarkii in Central Europe. Freshw. Crayfish 1999, 12, 714–726. [Google Scholar]
  83. Huner, J. Procambarus. In Biology of Freshwater Crayfish; Blackwell Science Ltd.: Oxford, UK, 2002; pp. 541–584. [Google Scholar]
  84. Scalici, M.; Gherardi, F. Structure and Dynamics of an Invasive Population of the Red Swamp Crayfish (Procambarus clarkii) in a Mediterranean Wetland. Hydrobiologia 2007, 583, 309–319. [Google Scholar] [CrossRef]
  85. Guerra, J.; Niño, A. Ecology of Red Swamp Crayfish (Procambarus clarkii, Girard) in the Central Meseta of Spain. Freshw. Crayfish 1995, 8, 179–200. [Google Scholar]
  86. Ligas, A. Population Dynamics of Procambarus clarkii (Girard, 1852) (Decapoda, Astacidea, Cambaridae) from Southern Tuscany (Italy). Crustaceana 2008, 81, 601–609. [Google Scholar] [CrossRef]
  87. Parrack, M.L.; Cummings, N.J. Errors in Transforming Length Samples to Age Frequencies without Age Samples. Fish. Res. 2003, 63, 235–243. [Google Scholar] [CrossRef]
  88. Heery, E.C.; Berkson, J. Systematic Errors in Length Frequency Data and Their Effect on Age-Structured Stock Assessment Models and Management. Trans. Am. Fish. Soc. 2009, 138, 218–232. [Google Scholar] [CrossRef]
  89. Aly, W.; El-Far, A.; Fetouh, M.A. Some Fisheries and Biological Aspects of the Crayfish Procambarus clarkii (Girard, 1852) in the River Nile, Egypt. Egypt. J. Aquat. Biol. Fish. 2020, 24, 33–42. [Google Scholar] [CrossRef]
  90. Saeed, M.; Kilada, R.; Saad, A.E.-H.; Mehanna, S.F.; Abeer, S.A.; Khalil, M.T. Comparative Study on Genetic Variation and Nutritional Value of Freshwater Crayfish Procambarus clarkii in the River Nile, Egypt. Egypt. J. Aquat. Biol. Fish. 2024, 28, 2131–2151. [Google Scholar] [CrossRef]
  91. Aiken, D.E. The Crayfish Orconectes Virilis: Survival in a Region with Severe Winter Conditions. Can. J. Zool. 1968, 46, 207–211. [Google Scholar] [CrossRef]
  92. Carmona-Osalde, C.; Rodriguez-Serna, M.; Olvera-Novoa, M.A.; Gutierrez-Yurrita, P.J. Gonadal Development, Spawning, Growth and Survival of the Crayfish Procambarus Llamasi at Three Different Water Temperatures. Aquaculture 2004, 232, 305–316. [Google Scholar] [CrossRef]
  93. Vernberg, W.B.; Vernberg, F.J. Freshwater Adaptations. Environ. Adapt. 1983, 8, 335. [Google Scholar]
  94. Jin, S.; Jacquin, L.; Huang, F.; Xiong, M.; Li, R.; Lek, S.; Li, W.; Liu, J.; Zhang, T. Optimizing Reproductive Performance and Embryonic Development of Red Swamp Crayfish Procambarus clarkii by Manipulating Water Temperature. Aquaculture 2019, 510, 32–42. [Google Scholar] [CrossRef]
  95. Wenner, A.M.; Fusaro, C.; Oaten, A. Size at Onset of Sexual Maturity and Growth Rate in Crustacean Populations. Can. J. Zool. 1974, 52, 1095–1106. [Google Scholar] [CrossRef]
  96. Huner, J. Observations on the Life Histories of Recreationally Important Crawfishes in Temporary Habitats. Proc. Louis. Acad. Sci. 1975, 38, 20–24. [Google Scholar]
  97. Huner, J. Exploitation of Freshwater Crayfishes in North-America. Fisheries 1978, 3, 2–5. [Google Scholar]
  98. Jin, S.; Jacquin, L.; Xiong, M.; Li, R.; Lek, S.; Li, W.; Zhang, T. Reproductive Pattern and Population Dynamics of Commercial Red Swamp Crayfish (Procambarus clarkii) from China: Implications for Sustainable Aquaculture Management. PeerJ 2019, 7, e6214. [Google Scholar] [CrossRef]
  99. Huner, J.; Romaire, R. Size Maturity as a Means of Comparing Populations of Procambarus clarkii (Girard)(Crustacea, Decapoda) from Different Habitats. Freshw. Crayfish 1978, 4, 53–64. [Google Scholar]
  100. Penn, G.H. A Study of the Life History of the Louisiana Red-Crawfish, Cambarus Clarkii Girard. Ecology 1943, 24, 1–18. [Google Scholar] [CrossRef]
  101. Suko, T. Studies on the Development of the Crayfish. I. The Development of Secondary Sex Characters in Appendages. Sci. Rep. Saitama Univ. B 1953, 1, 77–96. [Google Scholar]
  102. Huner, J.V.; Barr, J.E. Red Swamp Crawfish: Biology and Exploitation, revised ed.; Louisiana Sea Grant College Program, Louisiana State University: Baton Rouge, LA, USA, 1984. [Google Scholar]
  103. Lutz, C.; Wolters, W. Growth and Yield of Red Swamp Crawfish and White River Crawfish Stocked Separately and in Combination. Crawfish Tales 1987, 6, 20–21. [Google Scholar]
  104. Correia, A.M.; Costa, A.C. Introduction of the Red Swamp Crayfish, Procambarus clarkii (Crustacea: Decapoda) in São Miguel, Azores, Portugal. Arquipél. Ciênc. Biológicas E Mar. Life Mar. Sci. 1994, 12, 67–73. [Google Scholar]
  105. Oluoch, A.O. Breeding Biology of the Louisiana Red Swamp Crayfish Procambarus clarkii Girard in Lake Naivasha, Kenya. Hydrobiologia 1990, 208, 85–92. [Google Scholar] [CrossRef]
  106. Correia, A. Population Dynamics of Procambarus clarkii (Crustacea: Decapoda) in Portugal. Freshw. Crayfish 1995, 8, 276–290. [Google Scholar]
  107. Sommer, T.; Goldman, C. The Crayfish Procambarus clarkii from California Ricefields: Ecology, Problems and Potential for Harvest. Freshw. Crayfish 1983, 5, 418–428. [Google Scholar]
  108. Catlin, N. Age Validation, Size-at-Age, Size-at-Maturity, and Age-at-Maturity in Snow Crab (Chionoecetes Opilio) from Different Thermal Regimes in Newfoundland. Bachelor’ Thesis, University of New Brunswick, Fredericton, NB, Canada, 2020. [Google Scholar]
  109. Bluhm, B.A.; Kilada, R.; Ambrose, W.; Renaud, P.E.; Sundet, J.H. First Record of Cuticle Bands in the Stomach Ossicles of the Red King Crab Paralithodes Camtschaticus (Tilesius, 1815) (Decapoda: Anomura: Lithodidae) from Norway. J. Crustac. Biol. 2019, 39, 703–710. [Google Scholar] [CrossRef]
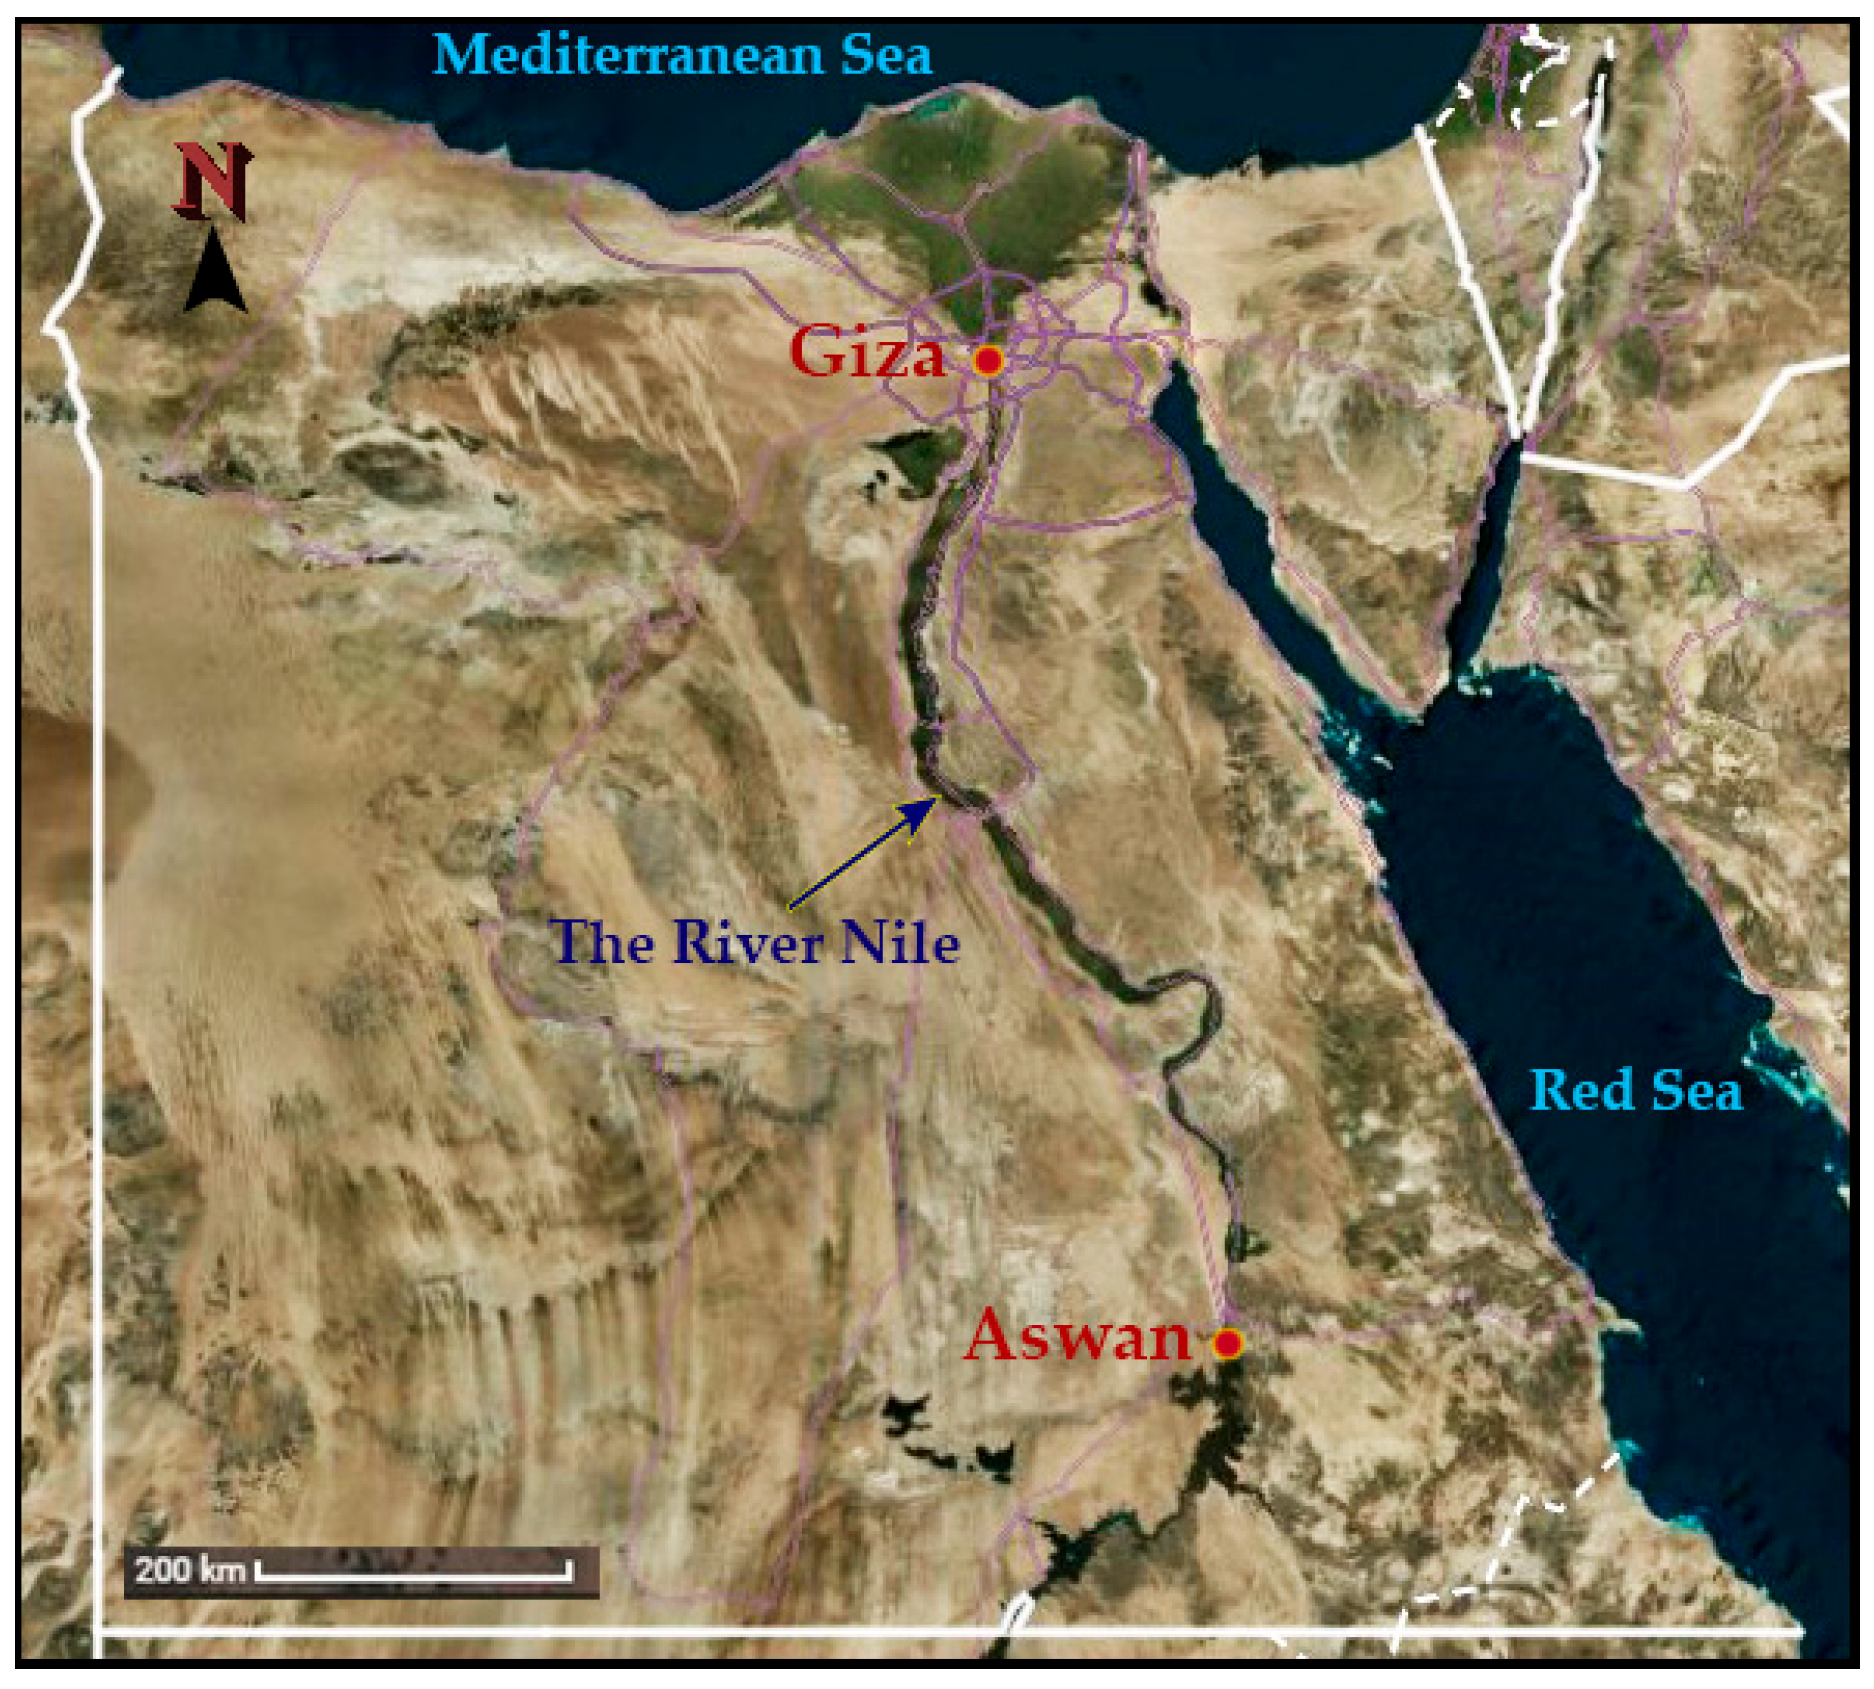
Figure 1. Map of Egypt showing the two study sites: Giza at the north and Aswan at the south (Created by Microsoft Power BI Desktop version).
Fishes 10 00453 g001
Figure 2. Mean number of molts and mean growth increment in carapace length of red swamp crayfish in the (A) first year and (B) second year for the four temperature treatments (* = p ˂ 0.001 by Tukey’s post hoc test).
Fishes 10 00453 g002
Figure 3. Longitudinal thin section (100 μm) of the mesocardiac ossicles of red swamp crayfish (P. clarkii). (A) One-year-old (absolute age) 42 mm CL male reared in the lab for one year showing one band. (B) Two-year-old (absolute age) 49.5 mm CL female reared in the lab for two years showing two bands. The growth bands are marked with red dots, the border between the endocuticle and exocuticle is delineated with a green dot, and the microlamellae of the endocuticle are marked with blue dots.
Fishes 10 00453 g003
Figure 4. Age bias plot for age validation of red swamp crayfish across all lab treatments. Each error bar indicates the 95% confidence level of the mean age determined from band counts. The values indicate the number of individuals at each age group. The solid line corresponds to 1:1 equality.
Fishes 10 00453 g004
Figure 5. The relation between band counts, mean absolute age (blue symbols, error bars are 95% confidence intervals) provided from the known age red swamp crayfish that were reared in captivity at different temperature regimes, and mean molting frequency (red symbols, 95% confidence intervals). The values represent the number of individuals processed in each age group. A 1:1 equivalence line between age and band counts is shown.
Fishes 10 00453 g005
Figure 6. Age bias plot for band counts in thin sections of mesocardiac ossicles of the red swamp crayfish counted by two independent readers. Each error bar corresponds to the 95% confidence intervals of the mean count determined by Reader 2 to all specimens’ band counts by Reader 1. The values indicate the number of individuals for which endocuticle bands were read at each band counts’ group. The solid line signifies 1:1 equality. A total of 49 individuals were processed (6 from the lab, 27 from Giza, and 16 from Aswan).
Fishes 10 00453 g006
Figure 7. The size–frequency of red swamp crayfish binned in 2 mm increments from four lab treatments with different temperature regimes. Modes detected using the Bhattacharya method (black) followed by the NormSep method are displayed in red. (A) Ambient temperature (12–25 °C): (B) 25 °C, (C) 28 °C, (D) 32 °C.
Fishes 10 00453 g007
Figure 8. Growth curves of red swamp crayfish subjected to different temperature regimes in the lab (each curve represents combined sexes of each treatment).
Fishes 10 00453 g008
Figure 9. Longitudinal thin sections (100 μm) of the mesocardiac ossicles of selected red swamp crayfish (P. clarkii) specimens from different ages. (A) Three-year-old 54.6 mm CL female collected from Giza showing three bands. (B) Four-year-old 58.5 mm CL female collected from Giza showing four bands. (C) Five-year-old 63 mm CL male collected from Giza showing five bands. (D) Six-year-old 66.7 mm CL female collected from Giza showing six bands. (E) Seven-year-old 69.7 mm CL male collected from Aswan with seven bands. The prominent bands are marked with red dots, the border between the endocuticle and exocuticle is labeled with a green dot, and the microlamellae of the endocuticle are marked with blue dots.
Fishes 10 00453 g009
Figure 10. Growth curve of red swamp crayfish in Giza and Aswan (each curve represents combined sexes in each location).
Fishes 10 00453 g010
Figure 11. Size–frequency (adjusted frequency as estimated by FiSAT II) of wild caught red swamp crayfish. Modes identified with the Bhattacharya method (black) followed by the NormSep routine are shown in red. (A,B) Females and males from Giza. (C,D) Females and males from Aswan.
Fishes 10 00453 g011
Figure 12. Decrease in modal carapace length in the first age class of red swamp crayfish between 2010 and 2020. Red dashed line indicates the start of using hundreds of thousands of Chinese traps. In 2010 and 2014, Tilapia traps were used: for explanation, see text. Note that in case of Saad et al. (2015) [80], the study was conducted in 2010, while for Aly et al. (2020) [89], the study was performed in 2014.
Fishes 10 00453 g012
Figure 13. Comparison of the mean absolute age for red swamp crayfish in harvestable size (about 40 mm CL) in different lab temperature treatments. Red arrowheads: average absolute age; Bars: average harvestable size by mm; n: number of individuals; W: total body weight (g).
Fishes 10 00453 g013
Disclaimer/Publisher’s Note: The statements, opinions and data contained in all publications are solely those of the individual author(s) and contributor(s) and not of MDPI and/or the editor(s). MDPI and/or the editor(s) disclaim responsibility for any injury to people or property resulting from any ideas, methods, instructions or products referred to in the content.