Article

Impact of Novel Diets on the Distribution of Mucosal Immune Cells in the Digestive System of High-Growth Genetically Selected Gilthead Seabream (Sparus aurata) in a Long-Term Feeding Trial

Aquaculture Research Group (GIA), Institute of Sustainable Aquaculture and Marine Ecosystems (IU-ECOAQUA), University of Las Palmas Gran Canaria, 35214 Telde, Canary Islands, Spain
*
Author to whom correspondence should be addressed.
Fishes 2025, 10(8), 396; https://doi.org/10.3390/fishes10080396
Submission received: 7 July 2025 / Revised: 28 July 2025 / Accepted: 2 August 2025 / Published: 8 August 2025
(This article belongs to the Section Nutrition and Feeding)

Abstract

An alternative fish feed (ALT) replacing 50% of the fishmeal with poultry byproduct meal and insect meal and total fish oil with microalgae, poultry, and salmon byproducts oils was tested for 300 days on 900 gilthead seabream (Sparus aurata) with an initial body weight of 17.1 ± 1.8 g (mean ± SD) of unselected (REF) and selected (HG) genotypes. Using in situ, histochemistry, and immunohistochemistry techniques, we assessed the immune response by characterizing IgT and IgM immunoglobulins, CD3ε+ T lymphocytes, and eosinophilic granular cells (EGCs) along the digestive system. IgT mRNA+ cells were concentrated in the second part of the digestive tract, while IgM+ predominated in the first and occasionally showed intraepithelial localization. CD3ε+ and EGCs were most prominent in the midgut. The diet affected IgT and IgM mRNA+ cells mainly in the initial part of the digestive tract. For CD3ε+, the diet only affected the initial and final parts, while the ALT diet increased EGC abundance across the middle compartments. Genetic selection had minimal effect on IgT+ and CD3ε+ cells, affecting only the first compartments. The REF group showed higher IgM+ cell abundance in specific regions, while EGCs differed between genotypes, favoring anterior accumulation in HG and ileocecal abundance in the REF group.
Key Contribution: This study provides the first detailed mapping of mucosal immune cell populations along the entire digestive tract of gilthead seabream and reveals how alternative sustainable diets and genetic selection differentially modulate local immune responses.

1. Introduction

In recent years, there has been an increased emphasis on enhancing sustainability and reducing the environmental footprint of aquaculture [1]. A key strategy involves replacing fishmeal (FM) and fish oil (FO) with alternative ingredients to reduce reliance on finite marine resources [2]. Insect meal (IM), for instance, has gained attention since its approval in the EU (Regulation EU 2017/893) due to its high nutritional value, efficient production, and environmental benefits [3,4,5]. Similarly, microalgae oils are rich in n-3 highly unsaturated fatty acids (n-3 HUFA) [6,7], and animal byproducts, such as poultry meal, feather meal hydrolysate, poultry oil, and salmon oil, offer cost-effective and circular alternatives [8]. These replacements have shown promising results in various species, including gilthead seabream (Sparus aurata) (GSB), without compromising growth or health performance during different growth phases [8,9,10]. Alongside feed innovation, selective breeding has emerged as a tool to optimize GSB production, aiming for higher growth rates and better adaptability to feeds with low FM and FO [11,12]. Selective breeding may alter physiology and nutrient requirements [13], necessitating optimized feeds tailored to genetically improved fish that can reduce dependence on marine ingredients and enhance the use of sustainable, cost-effective resources in aquafeeds. Most studies to date have focused on short-term or early-life-stage responses, with limited information available on long-term effects throughout the entire growth period to commercial size, warranting further investigation [14,15,16].
The fish immune system is a key indicator of physiological adaptation to dietary and genetic changes. In teleosts, three primary B cell subtypes have been identified by their surface immunoglobulins: IgM+, IgD+, and IgT+ [17,18]. IgT+ B cells are crucial for mucosal immunity and are predominantly located in mucosal-associated tissues, whereas IgM+ B cells are considered the prevalent immunoglobulin for systemic immune responses and are abundant in teleost body fluids [19,20,21]. Although IgT is considered the main mucosal immunoglobulin, the role of IgM in mucosal responses should not be discarded [22]. Mucosal immune activity during inflammation involves increased neutrophilic and eosinophilic granulocytes, IgM+ cells, and CD3ε+ T-cell infiltration [23,24]. CD3ε+ lymphocytes have been implicated in intestinal inflammation in response to dietary challenges, such as a diet containing soybean meal [25,26]. Additionally, eosinophilic granular cells (EGCs) vary in distribution and abundance in response to inflammatory stimuli, including dietary changes [27,28]. Understanding the effect of dietary changes involving FM/FO replacement on the immune system is particularly crucial in carnivorous marine species such as GSB, a key species in Mediterranean aquaculture with growing economic importance [29]. Despite its importance and potential as a teleost immunology model, the spatial organization of immune cells along the GSB digestive tract remains poorly characterized [30].
The present study aimed to map the distribution of IgT+ and IgM+ mRNA-expressing cells, CD3ε+ T lymphocytes, and EGCs throughout all digestive compartments of GSB. Additionally, it assessed how these immune cell populations respond to a long-term diet replacing FM/FO with insect meal, microalgae oil, and animal byproducts. It also examined whether selective breeding for high growth modulates immune responses to such diets, contributing to the development of sustainable, high-performance aquafeeds.

2. Materials and Methods

2.1. Animal Study

The GSB used in this study originated from two different broodstock groups included in the Spanish National Breeding Program for GSB (PROGENSA®). These groups consisted of the following: (1) the High-Growth (HG) group, comprising fish bred from individuals with high Estimated Breeding Values (EBVs), and (2) the Reference (REF) group, consisting of fish from breeders with lower EBVs, serving as the reference population. A total of 192 breeders were selected based on their EBVs and relationship coefficients. Two broodstock groups were established: the HG, divided into two subgroups of 46 and 48 breeders each, and the REF. The groups exhibited contrasting EBVs, with the HG group showing a mean EBV of +39.68. Collectively, the HG and REF breeders represented approximately 47% of the evaluated population. A total of 900 GSB, with an initial body weight of 17.1 ± 1.8 g (mean ± SD), were randomly distributed across twelve 500 L tanks, resulting in an initial stocking density of 75 fish per tank. Before the experiment began, the fish underwent a one-week acclimation period to adapt to the rearing conditions while being fed the control diet.
The fish were fed for 300 days until reaching commercial size (231.5 ± 39.6 g; mean ± SD). They were manually fed to apparent satiation three times daily with two different diets: a control diet (CON), with a low level of FM (15%) and FO (7%), supplemented by vegetable meal (VM; 36.6%) and vegetable oil (VO; 7.7%), and an alternative diet (ALT), in which FM and VM were largely replaced by a combination of poultry byproduct meal, IM, feather meal hydrolysate, and porcine blood meal, while half of the VO and the total of FO were substituted by a blend of microalgae oil and poultry and salmon byproduct oils (Table 1; Table S1). Throughout the experiment, the fish were maintained under a natural photoperiod (12 h light:12 h dark), with an average water temperature of 21.07± 1.68 °C, and the dissolved oxygen levels were consistently measured at 6.5 mg/L.

2.2. Sampling

At the end of the trial, when fish reached the commercial size, six fish per tank were slaughtered under simulated commercial conditions, according to the UNE 173300 Pisciculture Standard: Guide to Good Practice for Sacrifice [31]. The entire digestive system was sampled and fixed in buffered formaldehyde. The dissection was performed one day before processing, with the digestive tract divided into the esophagus, stomach, anterior intestine (a 3 cm segment below the stomach), posterior intestine (a 3 cm segment above the ileocecal valve), ileocecal valve, and rectum (a 2 cm segment below the ileocecal valve to the anus). Samples were then automatically processed using a Spin Tissue Processor Microm STP-120 (Thermo Fisher Scientific, Waltham, MA, USA). Tissue blocks were prepared to include two esophagus sections, the complete stomach, four anterior and posterior intestinal sections, one ileocecal valve section, and three rectal sections.

2.3. In Situ Hybridization

The in situ hybridization procedure was performed using RNAscope® 2.5 HD Assay–RED (Advanced Cell Diagnostics (ACD), Newark, CA, USA) according to the manufacturer’s instructions. Briefly, tissue sections (3 µm, Jung Autocut 2055, Leica, Nussloch, Germany) embedded in paraffin were affixed onto positively charged glass slides (Superfrost, Mentzel, Braunschweig, Germany), followed by drying at 37 °C for 48 h and subsequent incubation at 60 °C for 90 min. De-paraffinization was accomplished through two rounds of 5-min xylene incubation and two rounds of 1-min 100% ethanol treatment. Samples underwent endogenous peroxidase blocking (10 min at room temperature), followed by target retrieval (15 min at 100 °C) and protease digestion (30 min at 40 °C) to enable cell permeabilization. For probe hybridization, samples were exposed to the RNAscope probe for 2 h at 40 °C. Sequential hybridizations were conducted with varying incubation durations as per the manufacturer’s instructions to facilitate signal amplification. Signal detection was achieved by treating samples with Fast Red chromogenic substrate for 10 min, followed by counterstaining with a 50% Gill’s hematoxylin solution for 2 min. Subsequently, samples were dehydrated and mounted using EcoMount (BioCare Medical, Pacheco, CA, USA). Two GSB-specific target probes manufactured for this study were used, targeting the coding sequences for IgT and IgM, respectively (Table 2). The head kidney was used as the positive control for the probes (Figure S1). A probe targeting peptidylprolyl isomerase B (PPIB) was used as a reference target gene to test RNA integrity in the samples, while dihydrodipicolinate reductase (DapB), a bacterial gene from Bacillus subtilis, was used as a negative control gene to confirm the absence of background and non-specific cross-reactivity of the assay (Table 2; Figure S1).

2.4. Immunohistochemistry and Histochemistry

CD3ε+ T lymphocytes were labeled with immunohistochemistry (IHQ) using the Envision Flex+ system (Agilent Technologies, Glostrup, Denmark) and an anti-CD3ε+ rabbit polyclonal antibody (Dako cat. #A0452, Agilent Technologies, Glostrup, Denmark) at a concentration of 1/300. The AEC substrate was applied for 20 min. The detection of eosinophilic granulocytes (EGCs) was achieved using the May–Grünwald Giemsa (MGG) staining protocol [32].

2.5. Image Acquisition and mRNA+ Cell Counting

The sections were scanned with a MoticEasyScan Pro digital scanner (Motic, Xiamen, China) operated using the Motic DS Assistant software (Motic VM V1 Viewer 2.0). The intestine area was measured using the analySIS® software package for Windows (Image Pro Plus® V. 4.5.0.29) (Media Cybernetics, Silver Spring, MD, USA). Each digestive compartment area was manually selected with the eyedropper tool, converted into a binary format, and automatically measured after calibration with the scale bar. The search for positive signals was conducted in all of the digestive compartments present on each slide. The counting covered the entire digestive compartment area from mucosa to serosa for IgT and IgM mRNA+ B lymphocytes. The process of counting positive cells was done manually with a keyed counter. For CD3ε+ T lymphocytes and EGCs, it was performed using the analySIS® software package based on the signal intensity in the corresponding channel. Only a quarter of the total circular area of each portion of the digestive tract was counted and then multiplied by four to obtain the total signal amount. Subsequently, the measurements were converted into cell densities (average number of positive cells per μm2) and multiplied by 10−5 for B lymphocytes and 10−6 for CD3ε+ T lymphocytes and EGCs.

2.6. Statistical Analyses

The data were analyzed using IBM SPSS Statistics, Version 27.0 (Armonk, NY, USA: IBM Corp.). Normality and homogeneity of variances were tested using the Shapiro–Wilk and Levene tests, respectively. A one-way analysis of variance (ANOVA) was performed to assess differences among the intestinal compartments. When significant differences were detected, Duncan’s multiple-range test was applied for post hoc analysis to determine specific group differences. To evaluate the effects of treatments (diets and genotypes) within each intestinal compartment, pairwise comparisons were conducted using Student’s t-tests. A significance level of p < 0.05 was used for all statistical tests.

2.7. Ethical Statement

All wet-laboratory sampling was performed at the Ecoaqua Research Institute (ULPGC Marine Scientific and Technological Park, Taliarte Road S/N, 35214 Telde, Las Palmas, Spain), which is authorized for animal experimentation according to the European Union Directive 2010/63/EU and Spanish legislation (RD 1201/2005) on the protection of animals used for scientific purposes. All procedures were approved by the Bioethical Committee of the University of Las Palmas de Gran Canaria (reference OEBA-ULPGC-16-2021). The fish were euthanized solely for the use of their tissues for research and were not exposed to pain or distress.

3. Results

IgT mRNA+ cells were localized exclusively in the lamina propria and submucosa of the GSB digestive tract, situated between the muscular layer and the mucosa (Figure 1 and Figure 2; Figures S2 and S3). No IgT mRNA+ cells were detected as intraepithelial lymphocytes (IELs) within the mucosal layer in any digestive segment (Figure 1 and Figure 2). Quantitative analysis revealed significant differences in IgT mRNA+ cell distribution across digestive tract regions (p < 0.05; Figure 3). The esophagus, stomach, and anterior intestine showed lower cell counts (Figure 1), while the posterior intestine, ileocecal valve, and rectum exhibited significantly higher densities (Figure 2 and Figure 3).
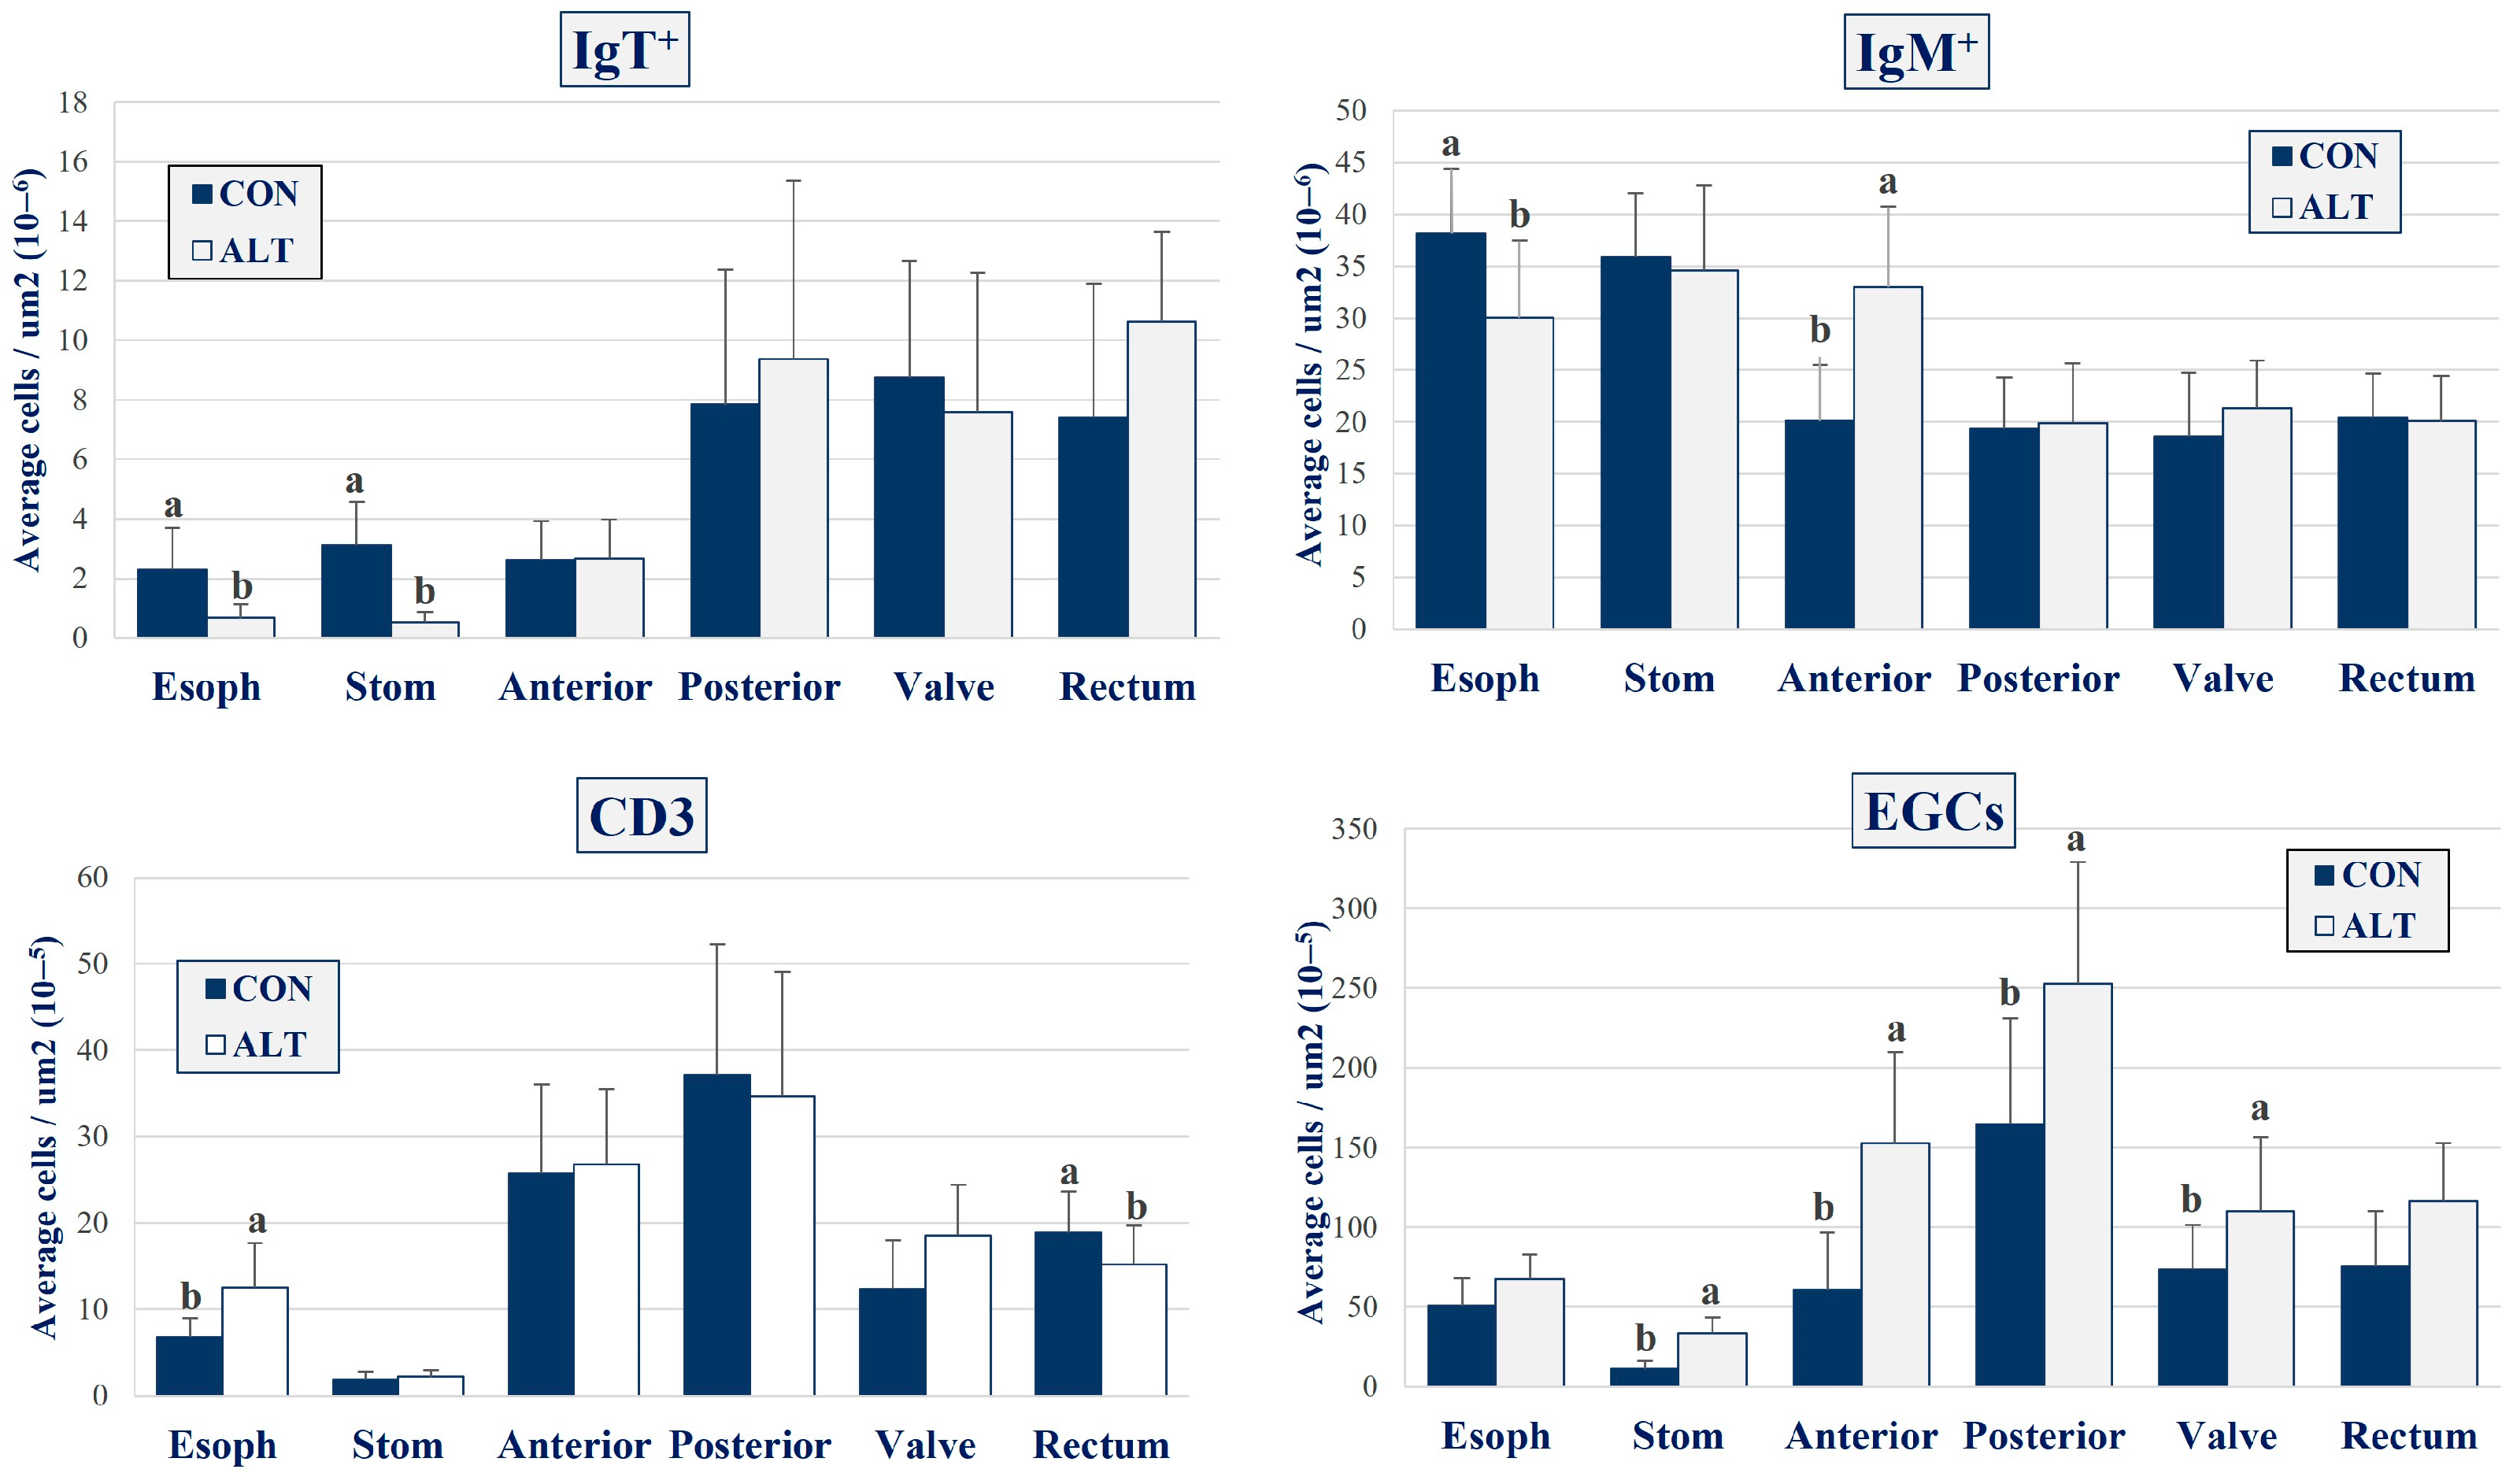
The dietary treatment influenced IgT+ lymphocyte abundance in the esophagus and stomach (p < 0.05), with the CON diet yielding the highest counts (Figure 4). Genetic selection had no overall effect on IgT mRNA+ cell distribution, except in the anterior intestine, where REF fish showed significantly higher cell density (p < 0.05; Figure 5).
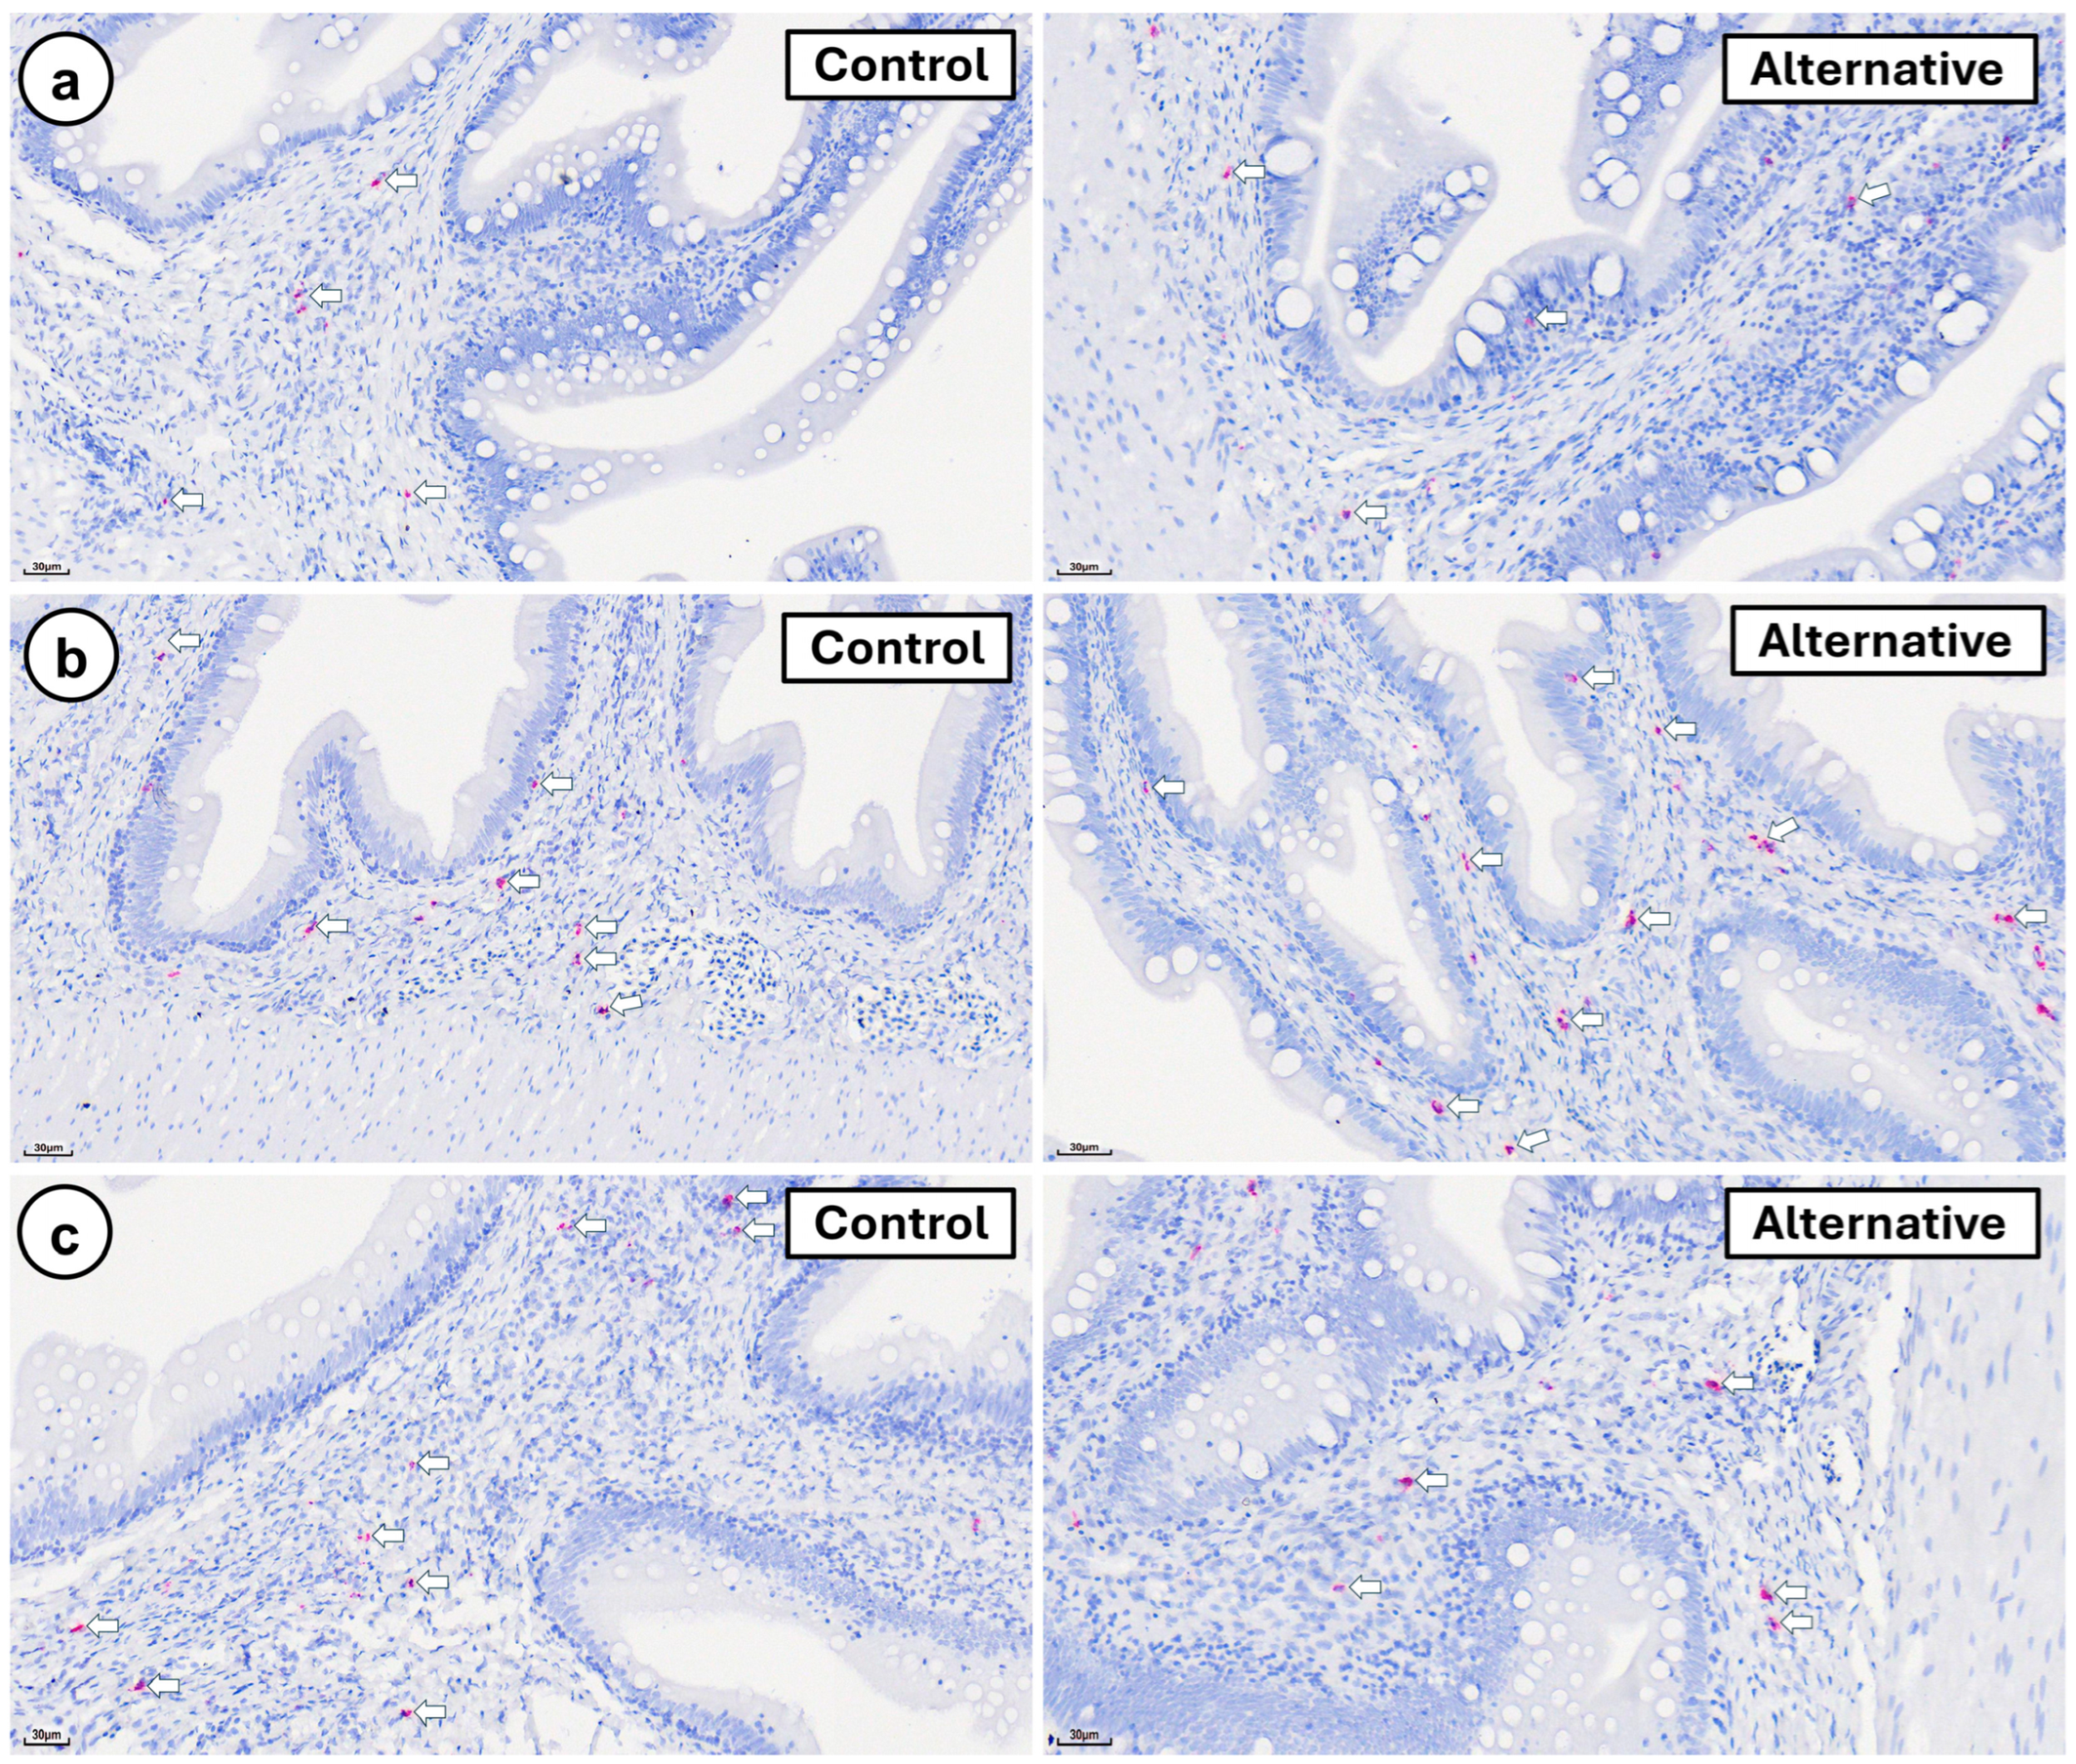
IgM mRNA+ cells were primarily located in the lamina propria and submucosa (Figure 6, Figure 7, Figures S4 and S5). In some cases, they were also observed within the mucosa, just beneath the enterocyte nuclei (Figure 6a,c and Figure 7a). These cells were most abundant in the upper digestive tract, particularly in the esophagus and stomach, with decreasing presence toward the posterior segments (Figure 3, Figure 6 and Figure S4).
Diet significantly influenced the IgM mRNA+ cell distribution in the esophagus and anterior intestine (p < 0.05). The CON diet led to the highest cell counts in the esophagus, while the ALT diet showed greater abundance in the anterior intestine (Figure 4). No dietary effects were observed in the posterior gut. Genotype-related differences were found in the esophagus, stomach, and posterior intestine (p < 0.05), with REF fish consistently showing higher IgM mRNA+ cell counts (Figure 5).
CD3ε+ T cells were predominantly located in the lamina propria beneath the enterocyte nuclei (Figure 8 and Figure 9), with occasional intraepithelial localization (Figure 8a,b and Figure 9b). The highest density of CD3ε+ lymphocytes was observed in the posterior intestine, while the stomach showed the lowest counts (Figure 3).
Diet significantly affected CD3ε+ T cell abundance in the esophagus and rectum (p < 0.05), but in opposite directions; the ALT diet increased the cell numbers in the esophagus (Figure 8a), whereas the CON diet led to higher counts in the rectum (Figure 4).
Genotype also influenced CD3ε+ T cell distribution, with significant differences in the stomach and anterior intestine (p < 0.05; Figure 5).
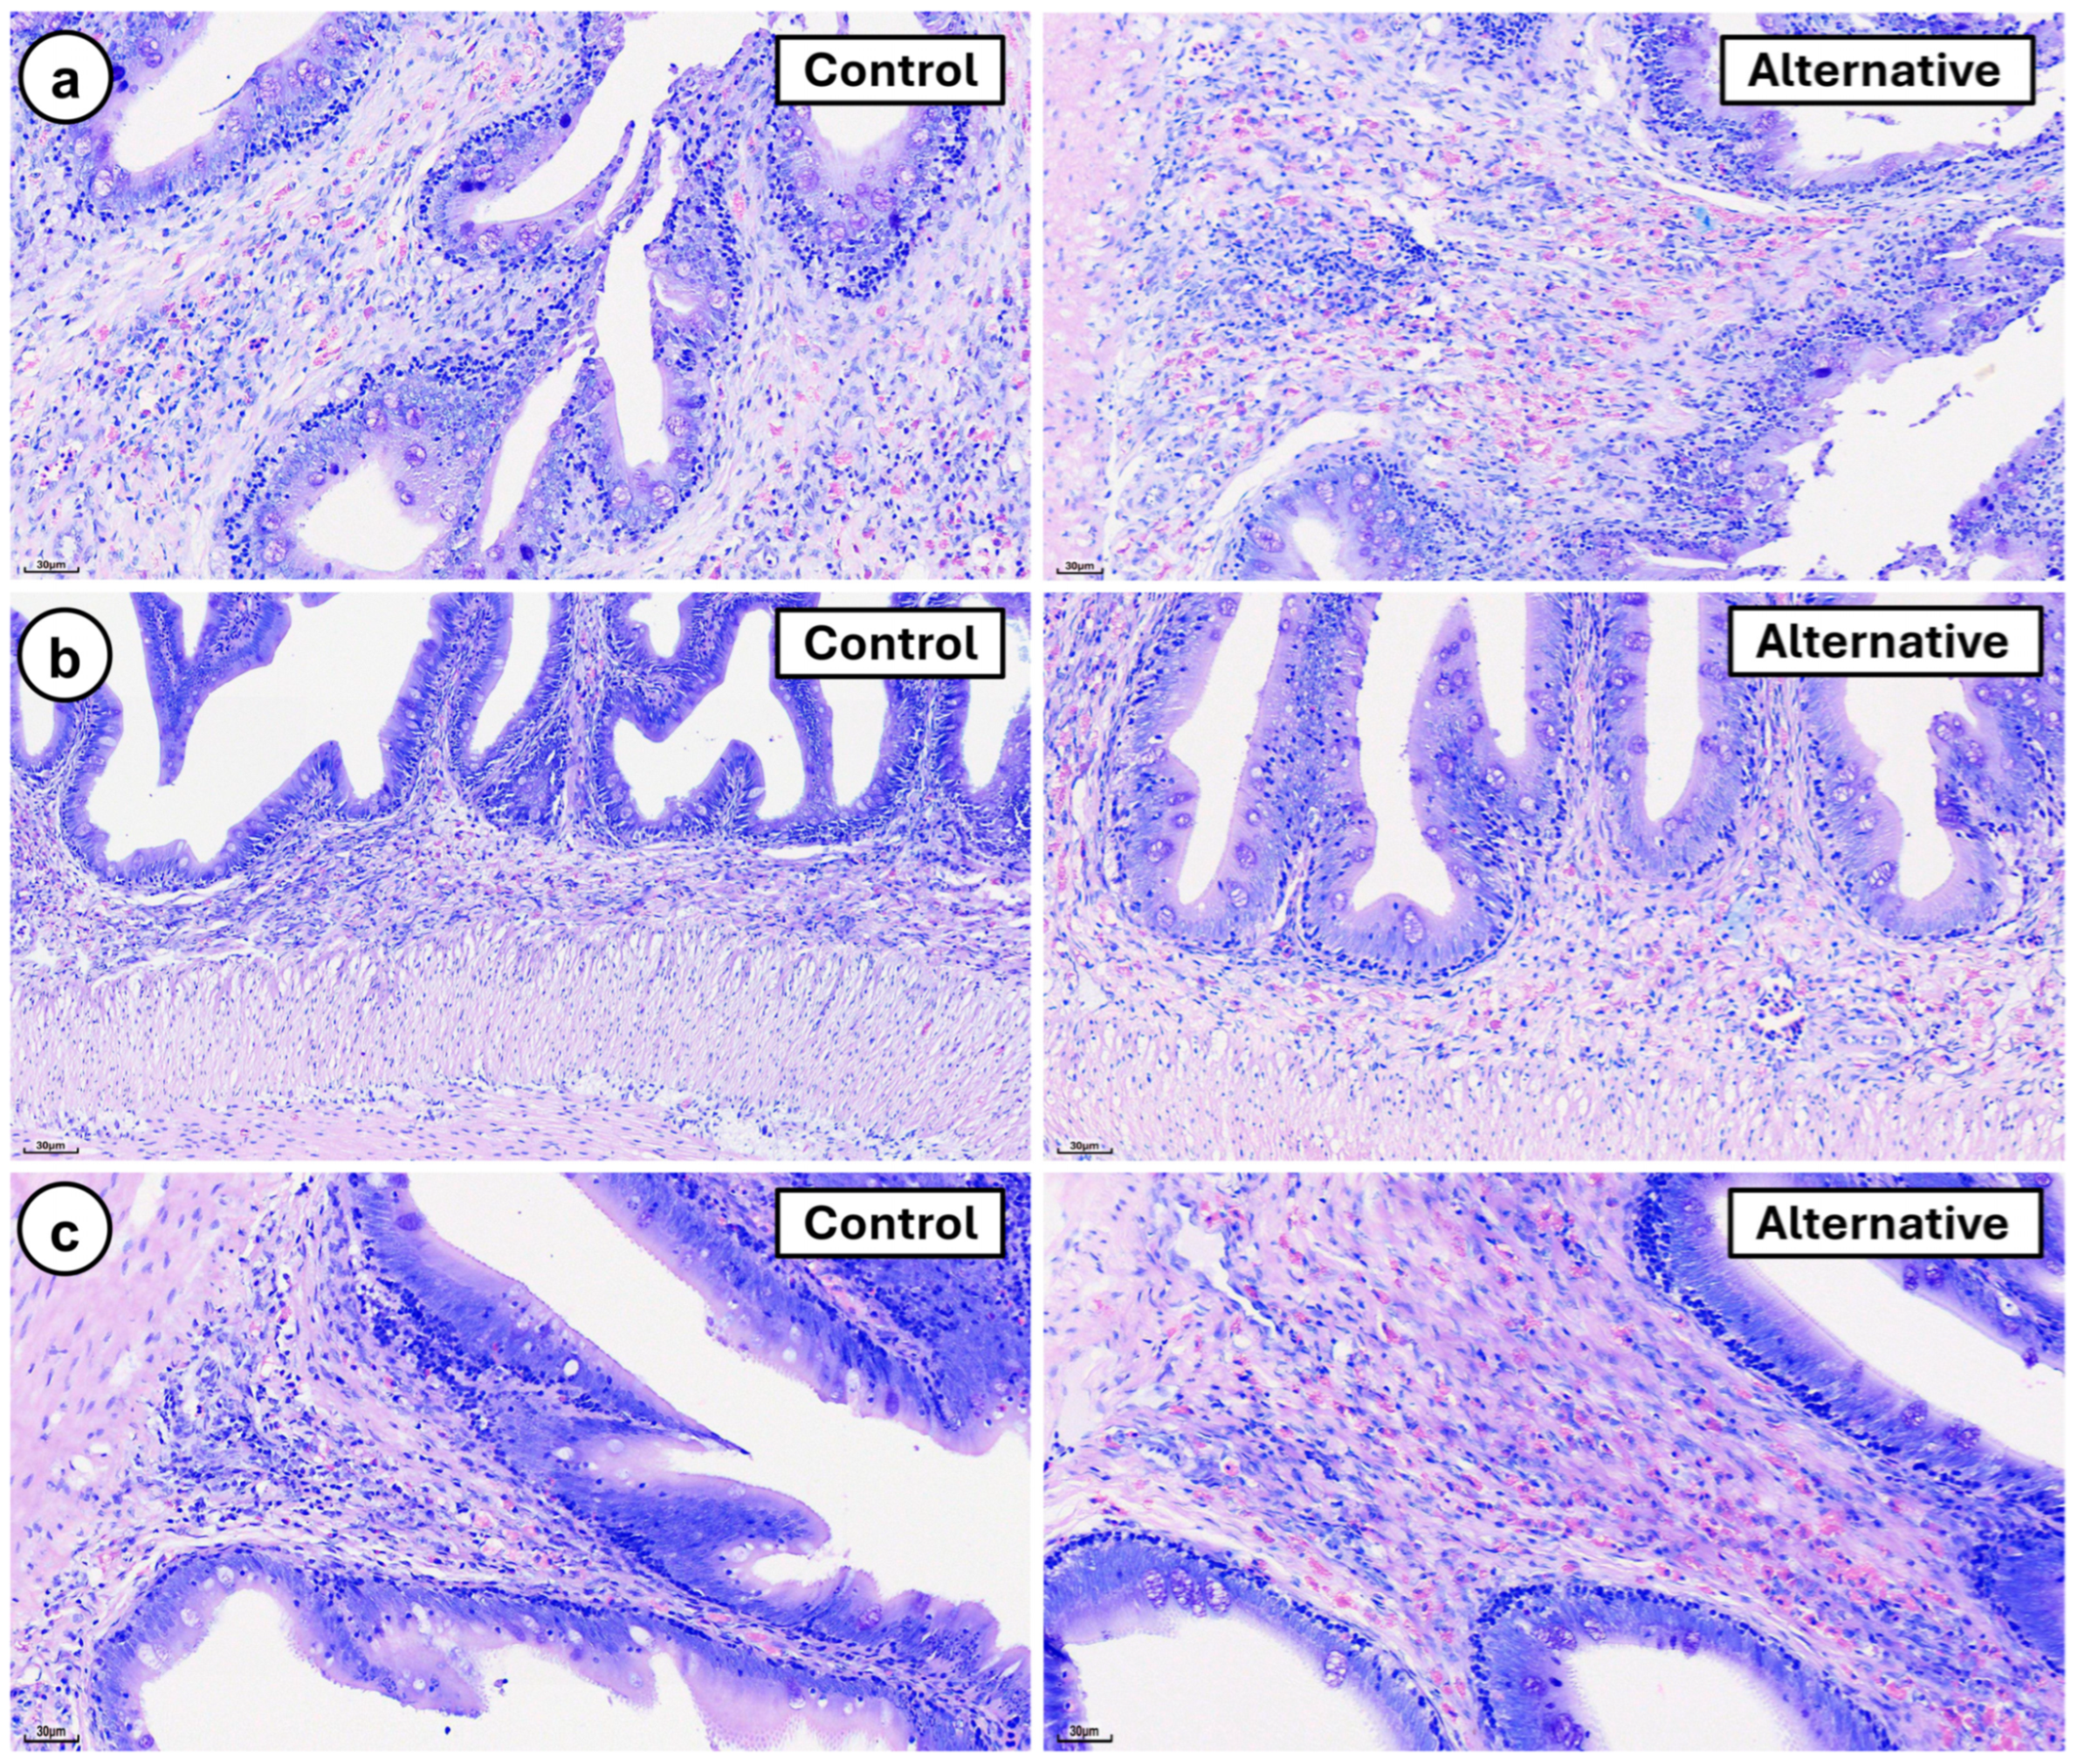
EGCs were consistently confined to the lamina propria and submucosa across all digestive segments (Figure 10 and Figure 11). The highest EGC density was observed in the posterior intestine (Figure 11), while the stomach showed the lowest counts (Figure 10; Figures S8 and S9). In the esophagus, goblet cells displayed distinct staining patterns with the MGG technique, suggesting the presence of different subtypes, one of which was characterized by strongly acidophilic granules (Figure 10a and Figure S8a).
Diet had a significant effect on EGC abundance (p < 0.05), with the ALT diet increasing the cell counts in the stomach, anterior and posterior intestine, and ileocecal valve (Figure 4). Genotype also influenced the EGC distribution. The HG group showed significantly higher counts up to the posterior intestine (p < 0.05), while in the ileocecal valve, the REF group exhibited greater EGC presence (Figure 5).

4. Discussion

The integration of nutritional and immunological research is increasingly essential for enhancing health management and animal welfare in aquaculture. Studies on B lymphocyte populations have revealed varying physiological capacities along different segments of the digestive tract in teleost species [33,34], primarily through IHQ and genetic expression analyses, in both secretory and membrane-bound Igs. Recent advancements are enabling a more accurate assessment of their immunological properties through morphological approaches, such as in situ approaches. In addition, the usual division of the digestive tract into anterior and posterior digestive compartments in most of the studies, while useful, often overlooks the initial segments, rendering it somewhat vague and insufficient.
The distribution of IgT mRNA+ cells was restricted to the lamina propria with no presence in the epithelium as IELs. In carp (Cyprinus carpio) and European seabass (Dicentrarchus labrax), IgT mRNA+ cells, apart from those in the lamina propria, were also primarily localized within the epithelium [35]. In vaccinated and unvaccinated Atlantic salmon (Salmo salar), no IgT mRNA+ intraepithelial cells were found [20]. In a study in which GSBs were immunologically challenged, Estensoro et al. [36] described a similar location using IHQ, but the authors could not differentiate lymphocytes from other Ig-containing cell types, such as macrophages, neutrophils, and nonspecific cytotoxic cells. With in situ hybridization, detection occurs while mRNA is being synthesized, and under homeostatic conditions, the distribution appears more restricted to the lamina propria. Differences may arise due to the inherent time delay between mRNA appearance and the corresponding protein product, since mRNA is transcribed from DNA and then translated into proteins [37]. Thus, the presence of Ig+ B lymphocytes in the mucosa may be explained by differences in membrane protein expression.
The regional distribution of IgM as the prevalent Ig transcript+ cell in the first half and IgT in the last part confirms the idea of the differential regulation of these two types of immunoglobulins in fish, particularly in GSB [22,38]. Similarly, studies on European seabass and Napoleon fish (Labrus bergylta) have demonstrated a differential expression of IgT along the intestinal tract, as shown by in situ hybridization [34,39]. In other species, such as Atlantic salmon, it has been noted that the second segment of the middle intestine is more immunologically active than other areas of the gastrointestinal tract [20,40]. This regionalization was first identified in Atlantic salmon by Løkka et al. [34], who found significantly higher transcriptional levels of immunity-related genes such as IgT in the second middle and posterior segments compared with the pyloric caecum. At the transcriptional level, researchers have analyzed the relative expression of IgT in the mucosa of Atlantic salmon, maragota (Labrus bergylta), European seabass, and grass carp (Ctenopharyngodon idella) through RT-qPCR [41,42,43,44]. The authors reported that IgT is mainly present in the intestine, gills, and skin, with the highest expression in the posterior intestine, highlighting a significantly marked concentration of IgT+ B lymphocytes in the middle, posterior, and rectum. The important presence of IgM transcript+ cells in the first part of the digestive tract, which is poorly studied so far, may indicate a role distribution linked with dietary antigens and feed intake. IgT has traditionally been indicated as a major actor, but it could be more relevant in situations of unbalanced homeostasis. In GSB, IgM mRNA+ cells must be considered prevalent in the gut, pending evaluation of the role of IgD. Thus, IgD distribution in the digestive tract is warranted and will complete the view on the Ig transcript+ cell distribution. Our results corroborate the presence of a regional distribution of IgT+ and IgM+ B lymphocytes in the GSB intestine, like that observed in other fish species, highlighting the complex relationship between immunological responses and intestinal physiology [20,34,35,45].
Regarding the effect of diets on Ig transcript+ cell counts in GSB, gene expression analysis revealed that intestinal IgM was markedly upregulated in the anterior intestine of fish fed an alternative diet including IM, yeast, microbial biomasses, and processed animal proteins, with no changes observed when the same diet excluded processed animal proteins [38]. The experimental diets used in the present study differed in protein and lipid sources, containing FM and soy protein in the CON diet and IM and poultry byproduct meal in the ALT diet. However, despite these differences, both diets elicited similar Ig+ cell responses in the second half of the digestive tract. In a previous study involving GSB fed different feed additives, the diet ingredients alone did not significantly modify the expression of membrane IgM (mIgM). However, a diet including Bacillus-based probiotics significantly increased the expression of membrane IgT (mIgT) in the posterior intestine of GSB [46]. In addition, in GSB, combining diets with homeostasis disruption revealed that a plant-based diet inhibited mIgT upregulation upon intestinal parasitic challenge [22]. Bjørgen et al. [47], using in situ hybridization in Atlantic salmon, reported a low number of IgT mRNA+ cells and no significant differences between fish fed a diet containing FM, soy protein concentrate, and FO and those fed an alternative diet with poultry byproduct meal and poultry oil. In rainbow trout (Oncorhynchus mykiss), Seibel et al. [48] found no significant differences in the relative gene expression of IgT immunoglobulins between fish fed plant-protein-based diets and those fed FM diets. Regardless of the digestive compartments or the nature of the ingredients, the level of inclusion appears to have an effect. For instance, in Atlantic salmon, increasing levels of IM in diets led to higher relative gene expression of IgM, IgD, and IgT immunoglobulins, but only when FM was fully replaced by IM [49]. Another study in rainbow trout revealed that IgT and IgM gene expression increased with the rising dietary inclusion of IM levels [50].
For the genotype, the prevalence of Ig transcript+ cells in the REF group is consistent with findings reported by Piazzon et al. [51], which demonstrated that a plant-based diet significantly alters the microbiota in slow- and low-growth GSB families, with a much smaller impact on fast-growing groups. In comparative studies of rainbow trout genotypes, the most resistant genetic group exhibited a lower abundance of IgM+ and IgM++ cells than the fish from the less resistant group, while both groups showed a very low abundance of IgT++-secreting cells in the head kidney, spleen, and blood, with no significant differences between them [52,53]. In European seabass, an interaction between diet and genotype was observed in the distal part of the intestine, leading to an increase in the expression of IL-1β in fish selected for higher genetic growth when fed a probiotic diet compared with a commercial diet [54].
The local distribution of CD3ε+ lymphocytes was similar to that found in European seabass [55] and Atlantic salmon, where CD3ε+ cells were detected in the lamina propria and epithelium of the second segment of the foregut [40], and in intraepithelial locations basal to the nuclei of enterocytes [34,56,57]. The regional distribution throughout the digestive tract is also consistent with previous studies, which found this region of the fish digestive tract to be highly active in terms of nutrient absorption, requiring robust immune surveillance [34,35,57,58]. Likewise, in Atlantic salmon, the second segment of the intestine showed the highest abundance of CD3ε+ mRNA using RT-qPCR [40,57,59]. The location of EGCs aligns with previous descriptions in GSB [60,61], occupying the lamina propria and submucosa. Similar locations were reported in Atlantic salmon [62], European seabass [45], and rainbow trout [63]. Interestingly, the digestive tract of GSB revealed the same significant regional variations as those in CD3ε+ cells, with a greater presence of EGCs mainly in the posterior intestine, indicating alignment in cellular immunity.
According to Løkka et al. [34] and Picchietti et al. [27,58], the middle region of the intestine hosts numerous intestinal bacteria that play crucial roles in digestion and the immune response in fish. The high metabolic activity in this region necessitates increased immune surveillance to protect against pathogens and manage dietary antigens. The abundance of EGCs in the middle intestine suggests that these cells could constitute a first line of defense in the food tract, playing an active role in mucosal immunity against pathogens and dietary elements. Significant EGC variation across different intestinal regions has been reported in fish [64]. The presence of different mucus-secreting cells, EGCs, and Ig transcripts+ in the esophagus suggests that this region may have a digestive role, despite digestion in teleosts typically starting in the stomach [65].
The experimental diets significantly influenced CD3ε+ lymphocyte counts in both the esophagus and rectum, regions of the digestive tract in direct contact with the external environment, suggesting that CD3ε+ cells may not play a central role in managing dietary antigens under homeostatic conditions. Consistent with these findings, El-Araby et al. [66] reported that varying levels of microalgae (Spirulina platensis) did not significantly affect CD3ε+ cell presence in the anterior and posterior intestines of Nile tilapia (Oreochromis niloticus). In contrast, replacing FM with microalgae (Nannochloropsis sp.) led to increased CD3ε+ cell counts in European seabass [58]. Previous studies have also highlighted the immunomodulatory potential of alternative dietary ingredients [67]. For instance, Islam et al. [68] demonstrated that IM modulates mucosal immune-related genes and glycosylated proteins in the intestine, enhancing T cell activity and promoting the expression of CD3γδ and foxp3, which suggests a role in epithelial protection and immune regulation. Other studies have reported increased expression of CD3γδ and foxp3 with IM inclusion levels as high as 60% [59] and even as low as 15% [69] in Atlantic salmon compared with a conventional diet. Regarding terrestrial plant ingredients such as soybean meal, Bakke-McKellep et al. [29] observed a significant increase in CD3ε+ cells in the intestine and upregulation of several T cell markers (CD3pp, CD4, CD8β), indicating increased T lymphocyte infiltration. These findings suggest dynamic interactions in which alternative ingredients such as IM may counteract the immunological effects induced by terrestrial-plant-based components, such as those present in the CON diet [26,60,61].
Consistent with our results, the inclusion of processed animal proteins in the diet increased EGC counts in GSB [70]. Generally, organic ingredients such as IM are known to contain nutrients with antioxidant properties that can influence immune function [68]. For plant-based ingredients, Couto et al. [26] reported an increase in EGCs in the pyloric intestine of GSB fed with a diet including saponins and phytosterols, potentially indicating an immune response. Regarding genotype, a study using flow cytometry on Nile tilapia demonstrated that the most resistant groups exhibited a higher percentage of CD3+ cells compared to the control group [71], indicating superior immune surveillance and defense potential. The role of the stomach in dietary or genetically selected breeds should be considered for its capacity to discriminate among zootechnical interventions.
In younger GSB, dietary formulas led to an increase in EGCs in the lamina propria and submucosa [61], with this effect being more influenced by the experimental diets rather than by the growth-selected fish. These findings suggest that fast-growing genetic groups possess more adaptable microbiota in response to dietary changes. Indeed, selection for enhanced growth in GSB has been associated with distinct growth trajectories and high dietary and intestinal plasticity [11]. Although less evident than the impact of diet itself, fish with high genetic growth potential contribute to a greater phenotypic plasticity in response to diets, underscoring the importance of considering genetic variability when evaluating nutritional outcomes [11,51,54].

5. Conclusions

The results of this study describe the effects of diet and genotype on the distribution of immune cells in the digestive tract of gilthead seabream. After a long-term feeding trial, the distribution of IgT and IgM mRNA+ cells under homeostasis was found to be region-specific. IgT mRNA+ cells were more concentrated in the distal sections of the digestive tract, whereas IgM mRNA+ cells, the most abundant immunoglobulin in this tissue, were primarily located in the proximal regions and found in intraepithelial locations. CD3ε+ cells and EGCs showed limited and no intraepithelial localization, respectively, with both cell types being most abundant in the posterior intestine.
The formulations with alternative ingredients reduced the presence of IgT+ and IgM+ cells locally, mainly in the initial part of the digestive tract. These ingredients also modified CD3ε+ cell distribution, increasing their presence in the anterior part while decreasing it in the posterior part. In contrast, EGCs increased across all other digestive compartments.
A limited effect of genetic selection was observed on IgT+ cells, whereas IgM+ cell counts were more broadly affected in specific digestive compartments of the unselected fish. The genetic selection had less impact on CD3ε+ cell responses, with significant differences observed only in the stomach and anterior intestine. In contrast, the distribution of EGCs varied according to genotype, with selected fish showing an increase in the first part of the digestive tract, while unselected fish exhibited higher EGC counts in the ileocecal valve.
Further studies analyzing dietary ingredients in isolation, as well as investigating the role of IgD, are warranted to better understand these region-specific dietary immune responses.

Supplementary Materials

The following supporting information can be downloaded at: https://www.mdpi.com/article/10.3390/fishes10080396/s1, Table S1: Vitamin and mineral premix composition of the experimental diets; Figure S1: RNAscope in situ hybridization demonstrating IgT and IgM mRNA+ distribution in lymphoid organs in gilthead seabream (Sparus aurata) as a positive control: (a) Head kidney, IgT. (b) Head kidney, IgM. (c) mid-gut, PPIB. As a negative control: (d) Head kidney, DapB. Scale bar: 50 μm; Figure S2: IgT-mRNA-positive cell distribution (red signal) in the different compartments of the digestive tract of seabream fed with control and alternative diet. (a) Esophagus, (b) stomach, and (c) anterior intestine. Scale bar: 100 μm; Figure S3: IgT-mRNA-positive cell distribution (red signal) in the different compartments of the digestive tract of seabream fed with the control and alternative diets. (a) Posterior intestine, (b) ileocecal valve, and (c) rectum. Scale bar: 100 μm; Figure S4: Distribution of IgM-mRNA-positive cells (red signal) in the different compartments of the digestive tract of seabream fed with the control and alternative diets. (a) Esophagus, (b) stomach, and (c) anterior intestine. Scale bar: 100 μm; Figure S5: Distribution of IgM-mRNA-positive cells (red signal) in the different compartments of the digestive tract of seabream fed with the control and alternative diets. (a) Posterior intestine, (b) ileocecal valve, and (c) rectum. Scale bar: 100 μm; Figure S6: Distribution of CD3ε+ T cells (red signal) in the different compartments of the digestive tract of seabream fed with the control and alternative diets. (a) Esophagus, (b) stomach, and (c) anterior intestine. Scale bar: 100 μm; Figure S7: Distribution of CD3ε+ T cells (red signal) in the different compartments of the digestive tract of seabream fed with the control and alternative diets. (a) Posterior intestine, (b) ileocecal valve, and (c) rectum. Scale bar: 100 μm; Figure S8: Distribution of eosinophilic granule cells (EGCs) (red signal) in the different compartments of the digestive tract of seabream fed with the control and alternative diets. (a) Esophagus, (b) stomach, and (c) anterior intestine. Scale bar: 100 μm; Figure S9: Distribution of eosinophilic granule cells (EGCs) (red signal) in the different compartments of the digestive tract of seabream fed with the control and alternative diets. (a) Posterior intestine, (b) ileocecal valve, and (c) rectum. Scale bar: 100 μm.

Author Contributions

Conceptualization, P.L.C. and R.G.; Validation, P.L.C. and R.G.; Formal analysis, S.A., P.S. and G.D.; Investigation, S.A., P.S. and G.D.; Resources, P.L.C. and R.G.; Data curation, P.L.C. and R.G.; Writing—original draft, S.A.; Writing—review and editing, P.S., P.L.C. and R.G.; Visualization, P.L.C., P.S. and R.G.; Supervision, P.L.C. and R.G. All authors have read and agreed to the published version of the manuscript.

Funding

This research was co-funded by the Agencia Canaria de Investigación, Innovación y So-ciedad de la Información de la Consejería de Universidades, Ciencia e Innovación y Cultura (ACIISI) and by the Fondo Social Europeo Plus (FSE+) Programa Operativo Integrado de Canarias 2021–2027, Eje 3 Tema Prioritario 74 (85%) (TESIS2021010061). The authors would like to thank the Centro Internacional de Altos Estudios Agronómicos Mediterráneos, through the Instituto Agronómico Mediterráneo de Zaragoza (CIHEAM), for funding Sirine Abdeljaouad.

Institutional Review Board Statement

The animal study protocol was approved by the Bioethical Committee of the University of Las Palmas de Gran Canaria (reference: OEBA-ULPGC-16-2021).

Informed Consent Statement

Not applicable.

Data Availability Statement

The raw data supporting the conclusions of this article will be made available by the authors upon request.

Conflicts of Interest

The authors declare no conflicts of interest.

References

  1. Boyd, C.E.; D’Abramo, L.R.; Glencross, B.D.; Huyben, D.C.; Juarez, L.M.; Lockwood, G.S.; Valenti, W.C. Achieving sustainable aquaculture: Historical and current perspectives and future needs and challenges. J. World Aquac. Soc. 2020, 51, 578–633. [Google Scholar] [CrossRef]
  2. Qiu, H.; Dai, M.; Chen, N.; Li, S. Apparent digestibility of ten protein ingredients for largemouth bass (Micropterus salmoides). Aquac. Res. 2022, 53, 6846–6854. [Google Scholar] [CrossRef]
  3. Sánchez-Muros, M.J.; Barroso, F.G.; Manzano-Agugliaro, F. Insect meal as renewable source of food for animal feeding: A review. J. Clean. Prod. 2014, 65, 16–27. [Google Scholar] [CrossRef]
  4. Ferrer-Llagostera, P.; Kallas, Z.; Reig, L.; De Gea, D.A. The use of insect meal as a sustainable feeding alternative in aquaculture: Current situation, Spanish consumers’ perceptions and willingness to pay. J. Clean. Prod. 2019, 229, 10–21. [Google Scholar] [CrossRef]
  5. Van Huis, A. Potential of insects as food and feed in assuring food security. Annu. Rev. Entomol. 2013, 58, 563–583. [Google Scholar] [CrossRef] [PubMed]
  6. Sarker, P.K.; Kapuscinski, A.R.; Lanois, A.J.; Livesey, E.D.; Bernhard, K.P.; Coley, M.L. Towards sustainable aquafeeds: Complete substitution of fish oil with marine microalga Schizochytrium sp. improves growth and fatty acid deposition in juvenile Nile tilapia (Oreochromis niloticus). PLoS ONE 2016, 11, e0156684. [Google Scholar] [CrossRef]
  7. Carvalho, M.; Montero, D.; Rosenlund, G.; Fontanillas, R.; Ginés, R.; Izquierdo, M. Effective complete replacement of fish oil by combining poultry and microalgae oils in practical diets for gilthead sea bream (Sparus aurata) fingerlings. Aquaculture 2020, 529, 735696. [Google Scholar] [CrossRef]
  8. Carvalho, M.; Marotta, B.; Xu, H.; Geraert, P.A.; Kaushik, S.; Montero, D.; Izquierdo, M. Complete replacement of fish oil by three microalgal products rich in n-3 long-chain polyunsaturated fatty acids in early weaning microdiets for gilthead sea bream (Sparus aurata). Aquaculture 2022, 558, 738354. [Google Scholar] [CrossRef]
  9. Pulido-Rodriguez, L.F.; Cardinaletti, G.; Secci, G.; Randazzo, B.; Bruni, L.; Cerri, R.; Olivotto, I.; Tibaldi, E.; Parisi, G. Appetite regulation, growth performances and fish quality are modulated by alternative dietary protein ingredients in gilthead sea bream (Sparus aurata) culture. Animals 2021, 11, 1919. [Google Scholar] [CrossRef] [PubMed]
  10. Randazzo, B.; Zarantoniello, M.; Cardinaletti, G.; Cerri, R.; Giorgini, E.; Belloni, A.; Contò, M.; Tibaldi, E.; Olivotto, I. Hermetia illucens and poultry by-product meals as alternatives to plant protein sources in gilthead seabream (Sparus aurata) diet: A multidisciplinary study on fish gut status. Animals 2021, 11, 677. [Google Scholar] [CrossRef] [PubMed]
  11. Perera, E.; Simó-Mirabet, P.; Shin, H.S.; Rosell-Moll, E.; Naya-Catalá, F.; Heras, V.d.L.; Martos-Sitcha, J.A.; Karalazos, V.; Armero, E.; Arizcun, M.; et al. Selection for growth is associated in gilthead sea bream (Sparus aurata) with diet flexibility, changes in growth patterns and higher intestine plasticity. Aquaculture 2019, 507, 349–360. [Google Scholar] [CrossRef]
  12. Carvalho, M.; Ginés, R.; Martín, I.; Zamorano, M.J.; Acosta, F.; Fontanillas, R.; Montero, D. Genetic selection for high growth improves the efficiency of gilthead sea bream (Sparus aurata) in using novel diets with insect meal, single-cell protein and a DHA rich-microalgal oil. Aquaculture 2024, 578, 740034. [Google Scholar] [CrossRef]
  13. Moroni, F.; Carvalho, M.; Di Rosa, A.R.; Torrecillas, S.; Fontanillas, R.; Haffray, P.; Montero, D. Genetic selection and novel feeds containing single cell protein as a substitute for fishmeal in european sea bass: Effects on growth, fatty acid profile and E-sensing analysis of fillets. Aquac. Rep. 2024, 35, 102021. [Google Scholar] [CrossRef]
  14. Yamamoto, T.; Murashita, K.; Matsunari, H.; Oku, H.; Furuita, H.; Okamoto, H.; Amano, S.; Suzuki, N. Selectively bred juvenile F2 amago salmon Oncorhynchus masou ishikawae fed a low fishmeal diet exhibit growth comparable to unselected juveniles fed a fishmeal-based diet. Fish. Sci. 2015, 81, 83–93. [Google Scholar] [CrossRef]
  15. Geay, F.; Ferraresso, S.; Zambonino-Infante, J.L.; Bargelloni, L.; Quentel, C.; Vandeputte, M.; Mazurais, D. Effects of the total replacement of fish-based diet with plant-based diet on the hepatic transcriptome of two European sea bass (Dicentrarchus labrax) half-subfamilies showing different growth rates with the plant-based diet. BMC Genom. 2011, 12, 522. [Google Scholar] [CrossRef]
  16. Montero, D.; Moyano, F.J.; Carvalho, M.; Sarih, S.; Fontanillas, R.; Zamorano, M.J.; Torrecillas, S. Nutritional innovations in superior gilthead seabream (Sparus aurata) genotypes: Implications in the utilization of emerging new ingredients through the study of the patterns of secretion of digestive enzymes. Aquaculture 2023, 577, 739958. [Google Scholar] [CrossRef]
  17. Cao, J.; Xu, H.; Yu, Y.; Xu, Z. Regulatory roles of cytokines in T and B lymphocytes-mediated immunity in teleost fish. Dev. Comp. Immunol. 2023, 140, 104621. [Google Scholar] [CrossRef]
  18. Jenberie, S.; van der Wal, Y.A.; Jensen, I.; Jørgensen, J.B. There and back again? A B cell’s tale on responses and spatial distribution in teleosts. Fish Shellfish Immunol. 2024, 148, 109479. [Google Scholar] [CrossRef] [PubMed]
  19. Yu, Y.; Wang, Q.; Huang, Z.; Ding, L.; Xu, Z. Immunoglobulins, mucosal immunity and vaccination in teleost fish. Front. Immunol. 2020, 11, 567941. [Google Scholar] [CrossRef]
  20. Castro, P.L.; Barac, F.; Hansen, T.J.; Fjelldal, P.G.; Hordvik, I.; Bjørgen, H.; Koppang, E.O. The distribution of IgT mRNA+ cells in the gut of the atlantic salmon (Salmo salar L.). Animals 2023, 13, 3191. [Google Scholar] [CrossRef]
  21. Parra, D.; Takizawa, F.; Sunyer, J.O. Evolution of B cell immunity. Annu. Rev. Anim. Biosci. 2013, 1, 65–97. [Google Scholar] [CrossRef]
  22. Piazzon, M.C.; Galindo-Villegas, J.; Pereiro, P.; Estensoro, I.; Calduch-Giner, J.A.; Gómez-Casado, E.; Novoa, B.; Mulero, V.; Sitjà-Bobadilla, A.; Pérez-Sánchez, J. Differential modulation of IgT and IgM upon parasitic, bacterial, viral, and dietary challenges in a perciform fish. Front. Immunol. 2016, 7, 637. [Google Scholar] [CrossRef]
  23. Bakke-McKellep, A.M.; Press, C.M.; Baeverfjord, G.; Krogdahl, Å.; Landsverk, T. Changes in immune and enzyme histochemical phenotypes of cells in the intestinal mucosa of Atlantic salmon, Salmo salar L., with soybean meal-induced enteritis. J. Fish Dis. 2008, 23, 115–127. [Google Scholar] [CrossRef]
  24. Rombout, J.H.W.M.; Abelli, L.; Picchietti, S.; Scapigliati, G.; Kiron, V. Teleost intestinal immunology. Fish Shellfish Immunol. 2011, 31, 616–626. [Google Scholar] [CrossRef]
  25. Bakke-McKellep, A.M.; Frøystad, M.K.; Lilleeng, E.; Dapra, F.; Refstie, S.; Krogdahl, Å.; Landsverk, T. Response to soy: T-cell-like reactivity in the intestine of Atlantic salmon, Salmo salar L. J. Fish Dis. 2007, 30, 13–25. [Google Scholar] [CrossRef] [PubMed]
  26. Couto, A.; Kortner, T.M.; Penn, M.; Bakke, A.M.; Krogdahl, Å.; Oliva-Teles, A. Effects of dietary soy saponins and phytosterols on gilthead sea bream (Sparus aurata) during the on-growing period. Anim. Feed Sci. Technol. 2014, 198, 203–214. [Google Scholar] [CrossRef]
  27. Picchietti, S.; Miccoli, A.; Fausto, A.M. Gut immunity in european sea bass (Dicentrarchus labrax): A review. Fish Shellfish Immunol. 2021, 108, 94–108. [Google Scholar] [CrossRef] [PubMed]
  28. Romano, L.A.; Oliveira, F.P.S.; Pedrosa, V.F. Mast cells and eosinophilic granule cells in Oncorhynchus mykiss: Are they similar or different? Fish Shellfish Immunol. Rep. 2021, 2, 100029. [Google Scholar] [CrossRef]
  29. APROMAR. La Acuicultura en España; Asociación Empresarial de Acuicultura de España (APROMAR): Chiclana de la Frontera, Spain, 2023; Available online: www.apromar.es/wp-content/uploads/2023/09/LaacuiculturaEspana2023APROMAR_v2.pdf (accessed on 20 January 2024).
  30. Mhalhel, K.; Levanti, M.; Abbate, F.; Laurà, R.; Guerrera, M.C.; Aragona, M.; Porcino, C.; Briglia, M.; Germanà, A.; Montalbano, G. Review on gilthead seabream (Sparus aurata) aquaculture: Life cycle, growth, aquaculture practices and challenges. J. Mar. Sci. Eng. 2023, 11, 2008. [Google Scholar] [CrossRef]
  31. AENOR. Pisciculture. In Guide to Good Practice for Sacrifice; AENOR: Madrid, Spain, 2016; Available online: www.mapa.gob.es/en/pesca/temas/calidad-seguridad-alimentaria/pisciculturaguiadepracticascorrectasparaelsacrificio_tcm38-291479.pdf (accessed on 20 January 2024).
  32. Martoja, R.; Martoja-Pierson, M. Técnicas de Histología Animal; Toray-Masson: Barcelona, Spain, 1970; p. 350. [Google Scholar]
  33. Ballesteros, N.A.; Castro, R.; Abos, B.; Rodríguez Saint-Jean, S.S.; Pérez-Prieto, S.I.; Tafalla, C. The pyloric caeca area is a major site for IgM+ and IgT+ B cell recruitment in response to oral vaccination in rainbow trout. PLoS ONE 2013, 8, e66118. [Google Scholar] [CrossRef]
  34. Løkka, G.; Austbø, L.; Falk, K.; Bromage, E.; Fjelldal, P.G.; Hansen, T.; Hordvic, I.; Koppang, E.O. Immune parameters in the intestine of wild and reared unvaccinated and vaccinated Atlantic salmon (Salmo salar L.). Dev. Comp. Immunol. 2014, 47, 6–16. [Google Scholar] [CrossRef]
  35. Zhang, Y.A.; Salinas, I.; Li, J.; Parra, D.; Bjork, S.; Xu, Z.; La Patra, S.E.; Bartholomew, J.; Sunyer, J.O. IgT, a primitive immunoglobulin class specialized in mucosal immunity. Nat. Immunol. 2010, 11, 827–835. [Google Scholar] [CrossRef]
  36. Estensoro, I.; Calduch-Giner, J.A.; Kaushik, S.; Pérez-Sánchez, J.; Sitjà-Bobadilla, A. Modulation of the IgM gene expression and IgM immunoreactive cell distribution by the nutritional background in gilthead sea bream (Sparus aurata) challenged with Enteromyxum leei (Myxozoa). Fish Shellfish Immunol. 2012, 33, 401–410. [Google Scholar] [CrossRef]
  37. Li, Y.; Chen, T.; Du, F.; Wang, H.; Ma, L. Concordance of RT-qPCR with immunohistochemistry and its beneficial role in breast cancer subtyping. Medicine 2023, 102, e35272. [Google Scholar] [CrossRef] [PubMed]
  38. Naya-Català, F.; Wiggers, G.A.; Piazzon, M.C.; López-Martínez, M.I.; Estensoro, I.; Calduch-Giner, J.A.; Martínez-Cuesta, M.C.; Requena, T.; Sitjà-Bobadilla, A.; Miguel, M.; et al. Modulation of gilthead sea bream gut microbiota by a bioactive egg white hydrolysate: Interactions between bacteria and host lipid metabolism. Front. Mar. Sci. 2021, 8, 698484. [Google Scholar] [CrossRef]
  39. Fuglem, B.; Jirillo, E.; Bjerkås, I.; Kiyono, H.; Nochi, T.; Yuki, Y.; Raida, M.; Fischer, U.; Koppang, E.O. Antigen-sampling cells in the salmonid intestinal epithelium. Dev. Comp. Immunol. 2010, 34, 768–774. [Google Scholar] [CrossRef]
  40. Bjørgen, H.; Koppang, E.O.; Gunnes, G.; Hordvik, I.; Moldal, T.; Kaldhusdal, M.; Dale, O.B. Ectopic epithelial cell clusters in salmonid intestines are associated with inflammation. J. Fish Dis. 2018, 41, 1031–1040. [Google Scholar] [CrossRef]
  41. Xu, H.; Wang, Z.; Li, Y.; Xu, Z. The distribution and function of teleost IgT. Fish Shellfish Immunol. 2024, 144, 109281. [Google Scholar] [CrossRef]
  42. Buonocore, F.; Stocchi, V.; Nunez-Ortiz, N.; Randelli, E.; Gerdol, M.; Pallavicini, A.; Picchietti, S. Immunoglobulin T from sea bass (Dicentrarchus labrax L.): Molecular characterization, tissue localization and expression after nodavirus infection. BMC Mol. Biol. 2017, 18, 8. [Google Scholar] [CrossRef] [PubMed]
  43. Koppang, E.O.; Kvellestad, A.; Fischer, U. Fish mucosal immunity: Gill. In Mucosal Health in Aquaculture; Academic Press: Cambridge, MA, USA, 2015; pp. 93–133. [Google Scholar] [CrossRef]
  44. Xiao, F.; Wang, Y.; Yan, W.; Chang, M.; Yao, W.; Xu, Q.; Wang, X.; Gao, Q.; Nie, P. Ig heavy chain genes and their locus in grass carp (Ctenopharyngodon idella). Fish Shellfish Immunol. 2010, 29, 594–599. [Google Scholar] [CrossRef]
  45. Torrecillas, S.; Terova, G.; Makol, A.; Serradell, A.; Valdenegro, V.; Gini, E.; Izquierdo, M.; Acosta, F.; Montero, D.; Wilson, B.A. Dietary phytogenics and galactomannan oligosaccharides in low fish meal and fish oil-based diets for European sea bass (Dicentrarchus labrax) juveniles: Effects on gut health and implications on in vivo gut bacterial translocation. PLoS ONE 2019, 14, e0222063. [Google Scholar] [CrossRef]
  46. Simó-Mirabet, P.; Piazzon, M.C.; Calduch-Giner, J.A.; Ortiz, Á.; Puyalto, M.; Sitjà-Bobadilla, A.; Pérez-Sánchez, J. Sodium salt medium-chain fatty acids and Bacillus-based probiotic strategies to improve growth and intestinal health of gilthead sea bream (Sparus aurata). PeerJ 2017, 5, e4001. [Google Scholar] [CrossRef]
  47. Bjørgen, H.; Oaland, Ø.; Midtllyng, P.; Tafalla, C.; Krogdahl, Å.; Koppang, E.O. IgD-transcript positive cells suggest hypersensitivity in feed-related intestinal inflammation in the Atlantic salmon. Fish Shellfish Immunol. 2023, 132, 108469. [Google Scholar] [CrossRef]
  48. Seibel, H.; Krassilnikova, K.; Fichtner-Grabowski, F.T.; Rebl, A.; Schulz, C.; Hornburg, S.C. Interactions of plant-based feeding and handling stress on the expression of selected immune markers in rainbow trout (Oncorhynchus mykiss). Aquac. Res. 2022, 53, 4304–4315. [Google Scholar] [CrossRef]
  49. Habte-Tsion, H.M.; Hawkyard, M.; Sealey, W.M.; Bradshaw, D.; Meesala, K.M.; Bouchard, D.A. Effects of fishmeal substitution with mealworm meals (Tenebrio molitor and Alphitobius diaperinus) on the growth, physiobiochemical response, digesta microbiome, and immune genes expression of Atlantic salmon (Salmo salar). Aquac. Nutr. 2024, 1, 6618117. [Google Scholar] [CrossRef] [PubMed]
  50. Sayramoğlu, H.; Öztürk, R.; Ustaoglu, D.; Terzi, Y.; Yandi, I.; Kayis, S.; Capkin, E.; Altinok, I. Effects of black soldier fly meal feeding on rainbow trout gut microbiota, immune-related gene expression, and Lactococcus petauri resistance. J. Insects Food Feed. 2023, 10, 141–157. [Google Scholar] [CrossRef]
  51. Piazzon, M.C.; Naya-Català, F.; Perera, E.; Palenzuela, O.; Sitjà-Bobadilla, A.; Pérez-Sánchez, J. Genetic selection for growth drives differences in intestinal microbiota composition and parasite disease resistance in gilthead sea bream. Microbiome 2020, 8, 168. [Google Scholar] [CrossRef]
  52. Zwollo, P.; Ray, J.C.; Sestito, M.; Kiernan, E.; Wiens, G.D.; Kaattari, S.; StJacques, B.; Epp, L. B cell signatures of BCWD-resistant and susceptible lines of rainbow trout: A shift towards more EBF-expressing progenitors and fewer mature B cells in resistant animals. Dev. Comp. Immunol. 2015, 48, 1–12. [Google Scholar] [CrossRef]
  53. Zwollo, P.; Hennessey, E.; Moore, C.; Marancik, D.P.; Wiens, G.D.; Epp, L. A BCWD-resistant line of rainbow trout exhibits higher abundance of IgT+ B cells and heavy chain tau transcripts compared to a susceptible line following challenge with Flavobacterium psychrophilum. Dev. Comp. Immunol. 2017, 74, 190–199. [Google Scholar] [CrossRef] [PubMed]
  54. Rimoldi, S.; Montero, D.; Torrecillas, S.; Serradell, A.; Acosta, F.; Haffray, P.; Hostins, B.; Fontanillas, R.; Allal, F.; Bajek, A.; et al. Genetically superior European sea bass (Dicentrarchus labrax) and nutritional innovations: Effects of functional feeds on fish immune response, disease resistance, and gut microbiota. Aquac. Rep. 2023, 33, 101747. [Google Scholar] [CrossRef]
  55. Liu, Y.; Moore, L.; Koppang, E.O.; Hordvik, I. Characterization of the CD3ζ, CD3γδ and CD3ε subunits of the T cell receptor complex in Atlantic salmon. Dev. Comp. Immunol. 2008, 32, 26–35. [Google Scholar] [CrossRef]
  56. Koppang, E.O.; Bjerkås, E.; Bjerkås, I.; Sveier, H.; Hordvik, I. Vaccination induces major histocompatibility complex class II expression in the Atlantic salmon eye. Scand. J. Immunol. 2003, 58, 9–14. [Google Scholar] [CrossRef]
  57. Koppang, E.O.; Fischer, U.; Moore, L.; Tranulis, M.A.; Dijkstra, J.M.; Köllner, B.; Aune, L.; Jirillo, E.; Hordvik, I. Salmonid T cells assemble in the thymus, spleen and in novel interbranchial lymphoid tissue. J. Anat. 2010, 217, 728–739. [Google Scholar] [CrossRef] [PubMed]
  58. Picchietti, S.; Buonocore, F.; Guerra, L.; Belardinelli, M.C.; De Wolf, T.; Couto, A.; Fausto, A.M.; Saraceni, P.R.; Miccoli, A.; Scapigliati, G. Molecular and cellular characterization of European sea bass CD3ε+ T lymphocytes and their modulation by microalgal feed supplementation. Cell Tissue Res. 2021, 384, 149–165. [Google Scholar] [CrossRef] [PubMed]
  59. Li, Y.; Kortner, T.M.; Chikwati, E.M.; Munang’andu, H.M.; Lock, E.J.; Krogdahl, Å. Gut health and vaccination response in pre-smolt Atlantic salmon (Salmo salar) fed black soldier fly (Hermetia illucens) larvae meal. Fish Shellfish Immunol. 2019, 86, 1106–1113. [Google Scholar] [CrossRef]
  60. Castro, C.; Couto, A.; Diógenes, A.F.; Corraze, G.; Panserat, S.; Serra, C.R.; Oliva-Teles, A. Vegetable oil and carbohydrate-rich diets marginally affected intestine histomorphology, digestive enzymes activities, and gut microbiota of gilthead sea bream juveniles. Fish Physiol. Biochem. 2019, 45, 681–695. [Google Scholar] [CrossRef] [PubMed]
  61. Naya-Català, F.; Torrecillas, S.; Piazzon, M.C.; Sarih, S.; Calduch-Giner, J.; Fontanillas, R.; Hostins, B.; Sitjà-Bobadilla, A.; Acosta, F.; Pérez-Sánchez, J.; et al. Can the genetic background modulate the effects of feed additives? Answers from gut microbiome and transcriptome interactions in farmed gilthead sea bream (Sparus aurata) fed with a mix of phytogenics, organic acids or probiotics. Aquaculture 2024, 586, 740770. [Google Scholar] [CrossRef]
  62. Brown, T.D.; Hori, T.S.; Xue, X.; Ye, C.L.; Anderson, D.M.; Rise, M.L. Functional genomic analysis of the impact of camelina (Camelina sativa) meal on Atlantic salmon (Salmo salar) distal intestine gene expression and physiology. Mar. Biotechnol. 2016, 18, 418–435. [Google Scholar] [CrossRef]
  63. Powell, M.D.; Wright, G.M.; Burka, J.F. Morphological and distributional changes in the eosinophilic granule cell (EGC) population of the rainbow trout (Oncorhynchus mykiss walbaum) intestine following systemic administration of capsaicin and substance P. J. Exp. Zool. 1993, 266, 19–30. [Google Scholar] [CrossRef]
  64. Öztop, M. Density, Distribution and staining properties of eosinophilic granular cells in oscar fish (Astronotus ocellatus) intestine. J. Hellenic Vet. Med. Soc. 2022, 73, 4957–4964. [Google Scholar] [CrossRef]
  65. Cataldi, E.; Cataudella, S.; Monaco, G.; Rossi, A.; Tancioni, L. A study of the histology and morphology of the digestive tract of the sea-bream, Sparus aurata. J. Fish Biol. 1987, 30, 135–145. [Google Scholar] [CrossRef]
  66. El-Araby, D.A.; Amer, S.A.; Attia, G.A.; Osman, A.; Fahmy, E.M.; Altohamy, D.E.; Tolba, S.A. Dietary spirulina platensis phycocyanin improves growth, tissue histoarchitecture, and immune responses, with modulating immunoexpression of CD3 and CD20 in Nile tilapia, Oreochromis niloticus. Aquaculture 2022, 546, 737413. [Google Scholar] [CrossRef]
  67. Dawood, M.A. Nutritional immunity of fish intestines: Important insights for sustainable aquaculture. Rev. Aquac. 2021, 13, 642–663. [Google Scholar] [CrossRef]
  68. Islam, S.M.; Siddik, M.A.; Sørensen, M.; Brinchmann, M.F.; Thompson, K.D.; Francis, D.S.; Vatsos, I.N. Insect meal in aquafeeds: A sustainable path to enhanced mucosal immunity in fish. Fish Shellfish Immunol. 2024, 150, 109625. [Google Scholar] [CrossRef] [PubMed]
  69. Li, Y.; Bruni, L.; Jaramillo-Torres, A.; Gajardo, K.; Kortner, T.M.; Krogdahl, Å. Differential response of digesta-and mucosa-associated intestinal microbiota to dietary insect meal during the seawater phase of Atlantic salmon. Anim. Microbiom. 2021, 3, 8. [Google Scholar] [CrossRef] [PubMed]
  70. Solé-Jiménez, P.; Naya-Català, F.; Piazzon, M.C.; Estensoro, I.; Calduch-Giner, J.À.; Sitjà-Bobadilla, A.; Van Mullem, D.; Pérez-Sánchez, J. Reshaping of gut microbiota in gilthead sea bream fed microbial and processed animal proteins as the main dietary protein source. Front. Mar. Sci. 2021, 8, 705041. [Google Scholar] [CrossRef]
  71. Zhang, J.; Geng, M.; Xiao, J.; Chen, L.; Cao, Y.; Li, K.; Yang, J.; Wei, X. Comparative analysis of T-cell immunity between Streptococcus agalactiae susceptible and resistant tilapia (Oreochromis niloticus). Fish Shellfish Immunol. 2024, 154, 109967. [Google Scholar] [CrossRef]
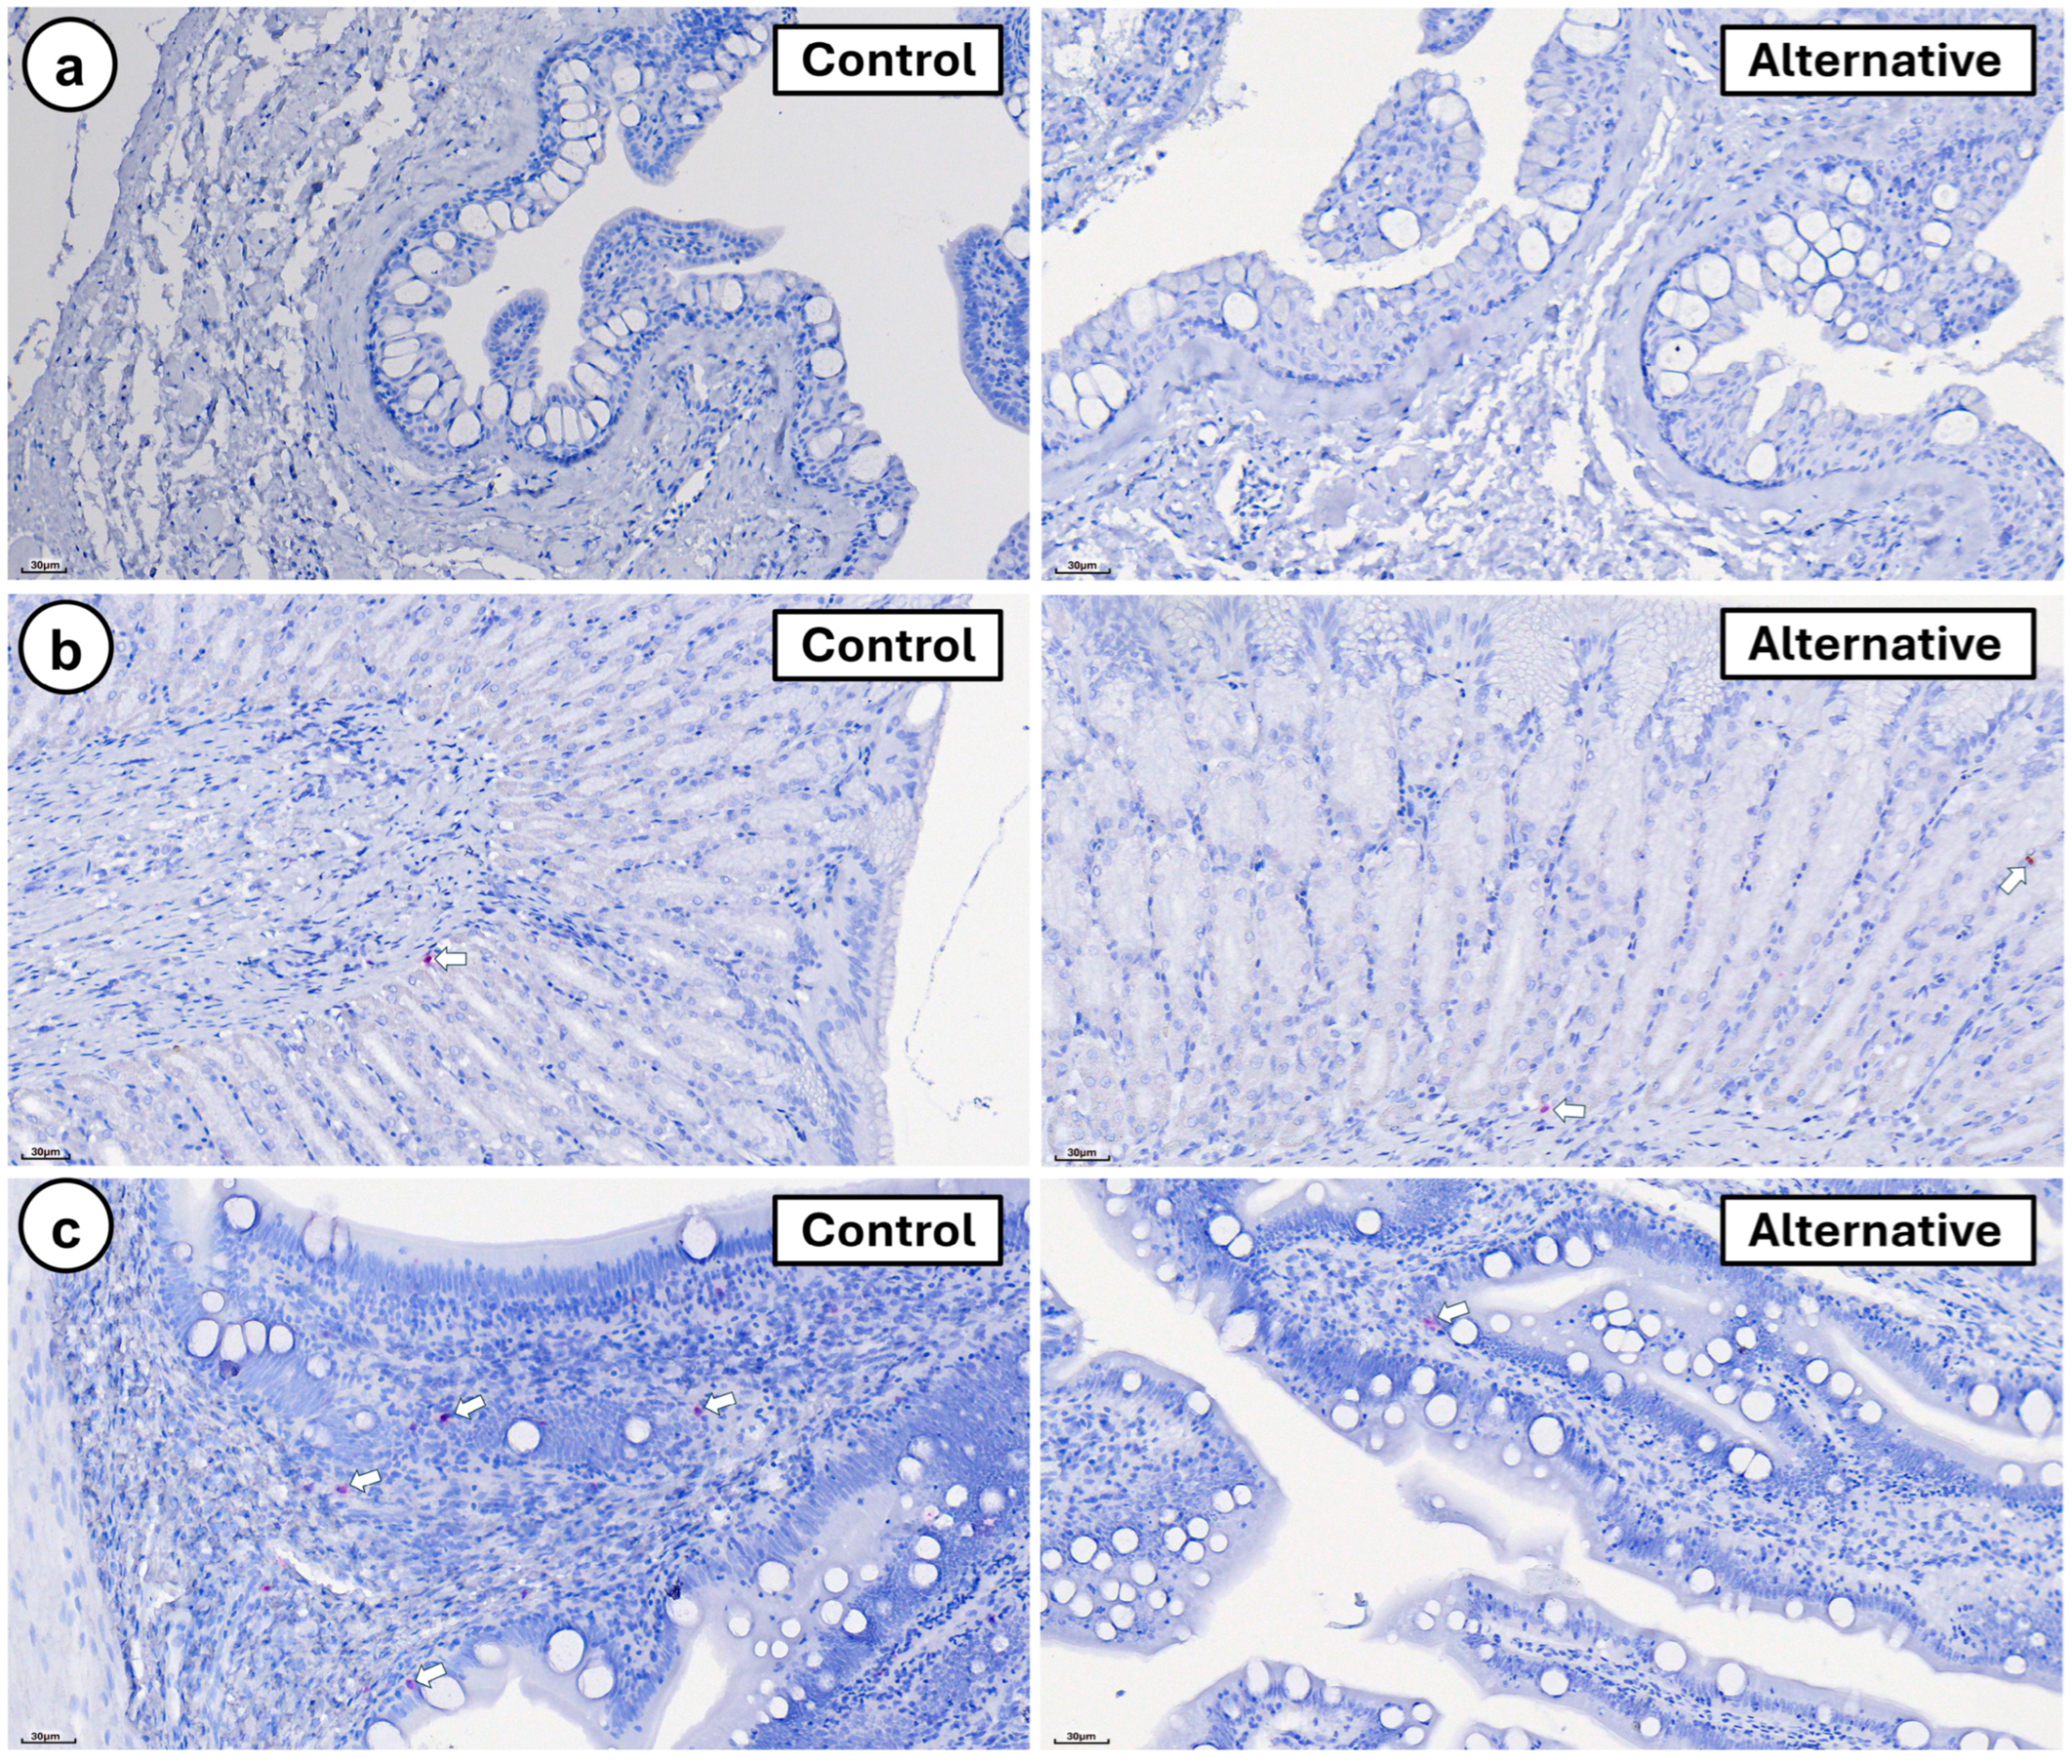
Figure 1. IgT-mRNA-positive cell distribution in the different compartments of the digestive tract of seabream fed with the control and alternative diets. (a) Esophagus, (b) stomach, and (c) anterior intestine. White arrow: IgT -mRNA-positive cell signal. Scale bar: 30 μm.
Fishes 10 00396 g001
Figure 2. IgT-mRNA-positive cell distribution in the different compartments of the digestive tract of seabream fed with the control and alternative diets. (a) Posterior intestine, (b) ileocecal valve, and (c) rectum. White arrow: IgT -mRNA-positive cell signal. Scale bar: 30 μm.
Fishes 10 00396 g002
Figure 3. Mucosal immune cell distribution in the different compartments of the digestive tract. IgT+: immunoglobulin T -mRNA-positive cells; IgM+: immunoglobulin M -mRNA-positive cells; CD3: CD3ε+ T lymphocytes; EGCs: eosinophilic granular cells; Esoph: esophagus, Stom: stomach; anterior: anterior intestine; Posterior: posterior intestine; Valve: ileocecal valve. Lowercase letters indicate significant differences (p < 0.05; n = 72). Bars with the same letters are not significantly different.
Fishes 10 00396 g003
Figure 4. Mucosal immune cell distribution in the different compartments of the digestive tract, depending on the experimental diets. IgT+: immunoglobulin T -mRNA-positive cells; IgM+: immunoglobulin M -mRNA-positive cells; CD3: CD3ε+ T lymphocytes; EGCs: eosinophilic granular cells; Esoph: esophagus, Stom: stomach; Anterior: anterior intestine; Posterior: posterior intestine; Valve: ileocecal valve; CON: control diet; ALT: alternative diet. Lowercase letters indicate significant differences (p < 0.05; n = 72). Bars with the same letters are not significantly different.
Fishes 10 00396 g004
Figure 5. Mucosal immune cell distribution in the different compartments of the digestive tract depends on the genetic selection. IgT+: immunoglobulin T -mRNA-positive cells; IgM+: immunoglobulin M -mRNA-positive cells; CD3: CD3ε+ T lymphocytes; EGCs: eosinophilic granule cells; Esoph: esophagus, Stom: stomach; Anterior: anterior intestine; Posterior: posterior intestine; Valve: ileocecal valve; REF: reference; HG: genetically selected. Lowercase letters indicate significant differences (p < 0.05; n = 72). Bars with the same letters are not significantly different.
Fishes 10 00396 g005
Figure 6. Distribution of IgM-mRNA-positive cells in the different compartments of the digestive tract of seabream fed with the control and alternative diets. (a) Esophagus, (b) stomach, and (c) anterior intestine. White arrow: IgM -mRNA-positive cell signal. Scale bar: 30 μm.
Fishes 10 00396 g006
Figure 7. Distribution of IgM-mRNA-positive cells in the different compartments of the digestive tract of seabream fed with the control and alternative diets. (a) Posterior intestine, (b) ileocecal valve, and (c) rectum. White arrow: IgM -mRNA-positive cell signal. Scale bar: 30 μm.
Fishes 10 00396 g007
Figure 8. Distribution of CD3ε+ T cells in the different compartments of the digestive tract of seabream fed with the control and alternative diets. (a) Esophagus, (b) stomach, and (c) anterior intestine. White arrow: CD3ε+ T cell signal. Scale bar: 30 μm.
Fishes 10 00396 g008
Figure 9. Distribution of CD3ε+ T cells in the different compartments of the digestive tract of seabream fed with the control and alternative diets. (a) Posterior intestine, (b) ileocecal valve, and (c) rectum. White arrow: CD3ε+ T cell signal. Scale bar: 30 μm.
Fishes 10 00396 g009
Figure 10. Distribution of eosinophilic granular cells (EGCs) in the different compartments of the digestive tract of seabream fed with the control and alternative diets. (a) Esophagus, (b) stomach, and (c) anterior intestine. Scale bar: 30 μm.
Fishes 10 00396 g010
Figure 11. Distribution of eosinophilic granular cells (EGCs) in the different compartments of the digestive tract of seabream fed with the control and alternative diets. (a) Posterior intestine, (b) ileocecal valve, and (c) rectum. Scale bar: 30 μm.
Fishes 10 00396 g011
Table 1. Ingredients and proximate and fatty acid compositions of the experimental diets.
Diets
Ingredients (%)ControlAlternative
Fishmeal Super Prime15.007.50
Feather meal hydrolysate 7.50
Porcine blood meal 5.00
Poultry meal 10.00
Worm meal (Tenebrio molitor) 7.50
Aminopro NT70–C. glutamicum 7.50
Soy protein concentrate16.00
Wheat gluten13.603.00
Corn gluten meal7.003.00
Soybean meal 486.005.80
Wheat meal14.2315.63
Faba beans (low tannins)8.008.00
Fish oil7.00
Salmon oil 4.00
Algae oil (Veramaris®) 1 3.30
Rapeseed oil7.703.90
Poultry fat 2.85
Vitamin and mineral premix 21.001.00
Proximate composition (% feed)ControlAlternative
Crude protein43.046.0
Crude fat18.018.0
Fiber1.81.2
Starch15.614.4
Ash5.76.0
Fatty acids (%fat)ControlAlternative
Myristic acid (C14:0) 0.5 0.3
Palmitic acid (C16:0) 1.9 2.4
Stearic acid (C18:0) 0.4 0.5
Oleic acid (C18:1n-9) 6.5 6.3
Linoleic acid (LNA, C18:2n-6) 2.1 2.6
α-Linolenic acid (ALA, C18:3n-3) 0.8 0.8
Arachidonic acid (ARA, C20:4n-6) 0.1 0.1
Eicosapentaenoic acid (EPA, C20:5n-3) 1.4 0.7
Docosahexaenoic acid (DHA, 22:6n-3) 0.8 1.5
1 Veramaris algal oil (Veramaris, Delft, The Netherlands). 2 Vitamin and mineral premix (Trouw Nutrition, Boxmeer, The Netherlands; Table S1).
Table 2. Target and control probes for in situ hybridization. The probes were provided by Advanced Cell Diagnostics (ACD Bio, Newark, CA, USA), and the corresponding catalogue numbers can be used to locate them at the National Center for Biotechnology Information (NCBI; https://www.ncbi.nlm.nih.gov/ accessed on 20 January 2024). IgT: immunoglobulin T; IgM: immunoglobulin M.
ProbeAccession No.Target Region (bp)Catalog No.
TargetIgTKX599200.1681–16081270141
IgMJQ811851.4751–14241573471
ControlDapB (negative)EF191515414–862310043
PPIB (positive)NM_00114087020–934494421
Disclaimer/Publisher’s Note: The statements, opinions and data contained in all publications are solely those of the individual author(s) and contributor(s) and not of MDPI and/or the editor(s). MDPI and/or the editor(s) disclaim responsibility for any injury to people or property resulting from any ideas, methods, instructions or products referred to in the content.