1. Introduction
Aquaculture, as an important part of the world’s fisheries, has played a pivotal role in promoting the rapid growth of the world’s fishery production [
1]. With the continuous decline of natural fishery resources, in order to ensure that fishery resources continue to contribute to the growing world population, economic and social interests, it has become a global consensus to develop fishery fishing within limits, and vigorously develop aquaculture models, such as deep-sea aquaculture, high-standard ponds, and industrialized aquaculture [
2]. Monitoring of farmed fish, as a powerful means to improve the controllability of the aquaculture process, reduce aquaculture risks, and enhance the quality of aquaculture products, is an important link in boosting the high-quality development of aquaculture fisheries. It is also a key focus for the informatization of aquaculture and the intelligentization of aquaculture equipment [
3]. With the continuous expansion of the aquaculture scale and the aquaculture water body, manual and visual methods are gradually unable to meet the demand for remotely sensing the information of farmed fish. In particular, the characteristics of deep water areas and turbid water bodies further intensify the difficulty of sensing the parameters and status of farmed fish, such as growth, aggregation, and escape [
4].
Hydroacoustic technology is an important means to achieve target perception and detection in complex water environments. It is less affected by water turbidity and has a wide coverage range, gradually becoming an important technical means for the monitoring of farmed fish [
5,
6]. The detection of individual fish targets, as an important part of traditional fisheries acoustic applications, is an important prerequisite for applications such as in situ measurement of fish target strength [
7,
8] and acoustic assessment of fish abundance using the counting method [
9,
10]. In the monitoring of farmed fish, the accurate identification of individual broadband echoes of fish is related to the accuracy of fish school counting and assessment of aquacultural biomass [
11]. Incorrect detection of overlapping echoes will affect the accuracy of target strength estimation for individual fish, which indirectly influences the accurate estimation of body length and weight of farmed fish [
12]. Obtaining individual fish echoes is also an important basis for carrying out the assessment of parameters and states such as growth and escape of farmed fish [
13] as well as aquaculture risk management and control [
14].
However, the density of farmed fish schools is high and the spatial distribution is uneven, resulting in a higher probability of interference or superposition of multiple target echoes. There are problems such as the failure of peak detection for small targets and a high rate of misidentification of individual fish echoes. The performance of the individual fish identification algorithm determines the accuracy of the assessment of the target strength of farmed fish [
15] or the effect of target detection [
16], which affects the reliability of applications based on the acoustic echoes of farmed fish.
From the SIMRAD EK500 to the EK80 series of scientific fish finders, with the maturation of underwater acoustic broadband technology and instrumentation, individual fish identification technology has also been booming [
17,
18,
19,
20]. Relying on broadband signal matched filtering technology, the range resolution of target detection [
21] and the instantaneous peak signal-to-noise ratio [
22] have been significantly improved, effectively enhancing the usability in scenarios with low signal-to-noise ratios. Other than the signal-to-noise ratio factor, the target strength (TS) of individual fish varies significantly with tilt or orientation (e.g., ±5–10 dB), resulting in possible overlap of echoes from individual fish at different orientations within the beam. Methods such as those based on the peak phase information of broadband signals [
23] and the angular standard deviation within echoes [
24] discriminate using angular information obtained from split beams to further filter overlapping echoes. Furthermore, approaches like improving broadband matched filtering replica signals by integrating scenarios [
25] have been proposed, which further enhance the recognition performance of individual targets. Meanwhile, the application of underwater acoustic broadband technology has advanced research on echo characteristics of individual fish from classical time-domain features [
17,
18] to higher dimensions such as time-frequency domain analysis, enabling the acquisition of target fish information in more dimensions [
26,
27,
28], laying a foundation for improving the accuracy of individual fish recognition and reducing the probability of misrecognition.
With the continuous advancement of machine learning, deep learning technologies have demonstrated excellent robustness in fields such as fish echo classification. For instance, by combining passive acoustic data with Convolutional Neural Networks (CNNs) to extract time-frequency features of sonar signals, automatic classification of fish vocalizations has been achieved [
29]. Additionally, distinguishing between gas-bearing organisms and fluid-like organisms by learning swim bladder resonance features has been realized [
20], and unsupervised classification of acoustic signals from coral reefs has been performed by integrating the idea of spectral clustering [
30]. These technologies have provided new technical paradigms for individual fish recognition. However, their reliance on large-scale data annotation, high computational costs, and difficulties in miniaturized deployment pose challenges for their application in aquaculture scenarios.
The technology for identifying broadband echoes of individual fish, characterized by enhanced range resolution capability, improved ability to distinguish overlapping echoes from individual ones, and ease of deployment on existing hardware platforms (e.g., FPGA), presents opportunities for application in complex aquaculture scenarios such as high-density environments. However, the performance of individual fish recognition methods in aquaculture scenarios is still constrained by the complexity of farmed fish behavior, the orientation of fish within the acoustic beam, and the complex signal-to-noise conditions in aquaculture settings.
In previous work, the research group proposed a broadband identification method for individual fish based on the combined characteristics of peak time delay and instantaneous frequency [
31]. In theoretical simulations and fish school false target tests, the combined time–frequency analysis method has demonstrated good capabilities in extracting the characteristics of individual fish echoes and overlapping echoes. However, farmed fish have more complex echo characteristics and activity patterns. In order to further clarify the application challenges in aquaculture scenarios and evaluate algorithm performance, this paper conducts a comparative analysis of the performance of three methods, including the method for broadband recognition of individual fish based on the joint features of peak time delay and instantaneous frequency. Additionally, a refined echo acquisition system for farmed fish was constructed to carry out live fish experiments, aiming to test the effectiveness of the new method. This study employed crucian carp as the experimental fish species and adopted the average target strength of crucian carp within a certain range of body lengths, obtained based on the Kirchhoff approximation model, as the target strength threshold. In this study, the swimming direction of the fish was assumed to be dorsal orientation, and the uncertainties introduced by swimming orientation have, to a certain extent, restricted the scope of this research and the applicability of the method. These efforts provide a reference for the research on the application of echo recognition technology for individual fish in aquaculture scenarios.
2. Materials and Methods
2.1. Amplitude–Pulse Width Method Based on the Echo Envelope
Under the condition of a relatively good signal-to-noise ratio, the echo amplitude of a single fish will remain consistent and will not change significantly. However, due to the influence of signal superposition or interference in overlapping echoes, the amplitude of the overlapping part will change greatly, which is manifested as jittering changes in amplitude at the same phase. In classical narrowband echo recognition methods for individual fish, the approach of calculating the mean deviation or standard deviation based on the phase and amplitude of sampling points essentially exhibits the amplitude differences between single echoes and overlapping echoes over a larger time scale [
18]. Therefore, a threshold can be set according to the change in the amplitude envelope of a section of the signal to reject overlapping echoes.
When the transducer emits a signal with a pulse width of 1 ms, theoretically, if the distance between two fish in the direction of the acoustic axis of the transducer is less than 75 cm, their echoes will overlap in the time domain, and the pulse duration of the overlapping signal envelope will exceed the pulse width of the emitted signal. Therefore, on the basis of peak threshold detection, the pulse width of the emitted signal can be used to exclude echoes from relatively close distances. In order to accurately obtain the envelope starting point of the suspected echo signal of an individual fish, this method takes the value of the echo peak of the fish target reduced by 6 dB as the amplitude threshold to obtain the endpoints of the echo signal. After that, taking 0.8 times the pulse width of the emitted signal as the pulse duration threshold, the echo is further detected. When the pulse duration of the echo exceeds 0.8 times the pulse width of the emitted signal, it is determined as an overlapping echo. This method assumes that the orientation of the fish body is the dorsal direction, which limits the research scope of this method.
The detection method process based on the amplitude and pulse duration of the echo signal is shown in
Figure 1, and the specific steps are as follows:
- (1)
After the sonar receives the echo from the fish school target, low-pass filtering is first performed, with the cutoff frequency of the low-pass filter set to 250 kHz.
- (2)
Calculate the RMS envelope of the echo of the fish school target. Take the peak value reduced by 6 dB as the amplitude threshold to obtain the starting point and the ending point of the suspected target echo signal.
- (3)
Obtain the pulse duration of the echo signal according to the endpoints of the echo signal, and conduct detection with 0.8 times the pulse width of the emitted signal as the threshold.
- (4)
When the pulse duration of the echo exceeds 0.8 times the pulse width of the emitted signal, it is determined as an overlapping echo; otherwise, it is an echo of an individual target.
2.2. Peak Detection and Time Delay Estimation Method
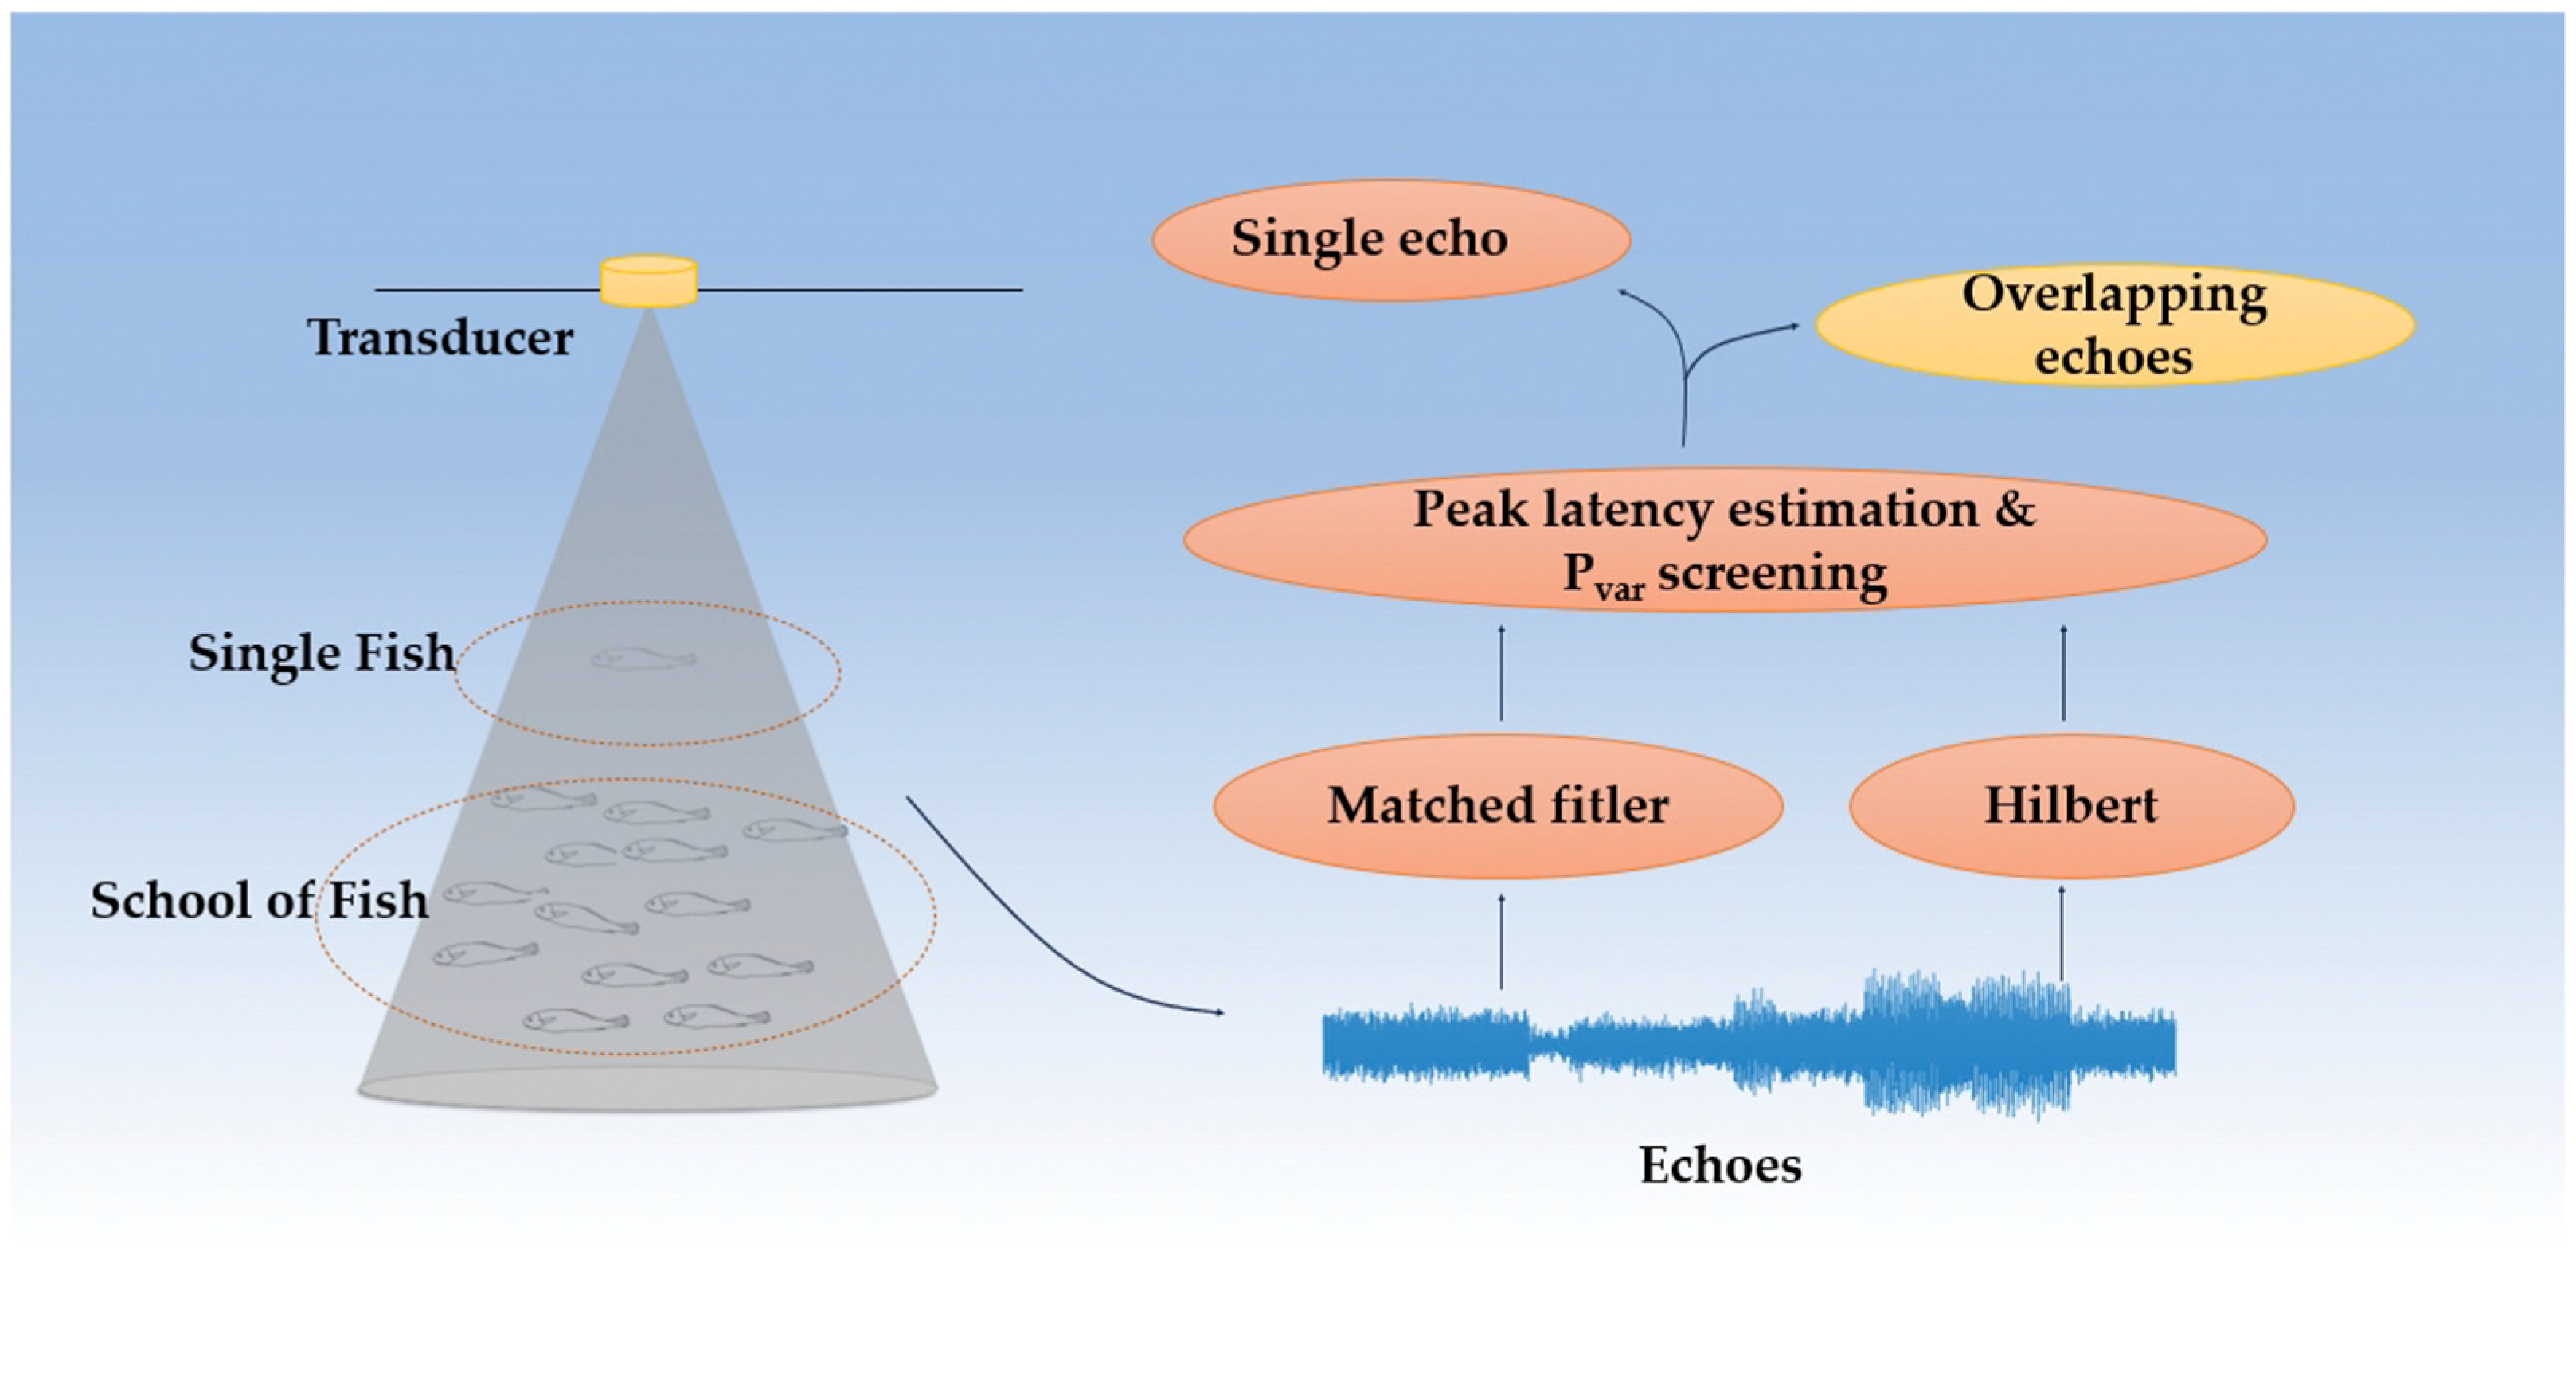
Different from the narrow-band detection method, the application of broadband signal matched filtering technology enhances the range resolution ability of the echo signal in the time domain. In the deep-sea aquaculture environment with a high density of fish schools, individual fish targets that are relatively close to each other can be detected. After matched filtering, the echoes of individual fish in the school form a series of peaks. By combining with the prior target strength data of the cultured fish species, non-fish targets can be excluded through peak detection. On this basis, the distances of different individuals along the acoustic axis can be accurately obtained. Based on the time delay difference between two adjacent peaks and the pulse width of the transmitted signal, overlapping echoes from relatively close targets can be excluded.
After matched filtering, the peak value is increased by
times compared with the original value, which improves the instantaneous peak signal-to-noise ratio [
32]. Where
,
is the signal pulse duration, and
is the bandwidth of the LFM pulse. Based on the time delay
of the signal envelope peak, the time delay difference
between adjacent maximum values can be obtained. When the time delay difference between adjacent peaks is less than the pulse width of the transmitted signal, the echoes that are relatively close to each other can be eliminated, so as to obtain the echo signal of an individual fish that is free from the interference of overlapping echoes.
This method assumes that the orientation of the fish body is the dorsal direction, which similarly limits the research scope of this method.
The process of the individual fish echo detection method based on peak detection and time delay estimation is shown in
Figure 2, and the specific steps are as follows:
- (1)
After the sonar receives the echoes of the fish school targets, it first conducts a band-pass filtering process. In this paper, a fourth-order Butterworth filter is used to process the fish school echoes. The passband frequency range of the bandpass filter is set from 160 kHz to 240 kHz, while the stopband frequency range is defined as 155 kHz to 245 kHz.
- (2)
After completing the matched filtering process, the peak detection method is used to obtain the peaks of the target echoes.
- (3)
Based on the acoustic scattering echo experiments of crucian carp and the Kirchhoff model, a body length-target strength model was constructed. Furthermore, the average target strength within a certain range of body lengths was selected as the peak detection threshold to judge the echo peaks. When the peaks fall within the threshold, preliminary screening of individual fish echoes can be performed.
- (4)
Combining with the pulse width of the transmitted signal, a peak time delay threshold is set to further exclude overlapping echoes. When the time delay difference between two adjacent echoes is less than the pulse width of the transmitted signal, it can be determined as an overlapping echo.
2.3. Peak Time Delay Combined with Instantaneous Frequency Method
The echo signals of farmed fish based on linear frequency modulation (LFM) signals are typical non-stationary signals. Ideally, due to the randomness of their phases and amplitudes, overlapping echoes should possess time–frequency characteristics different from those of the echoes of individual targets. In order to effectively detect individual fish targets and simultaneously reduce the probability of misjudging overlapping echoes when peak detection fails, time–frequency analysis is carried out on the echo signals of fish schools. The Hilbert transform is utilized to calculate the instantaneous frequency and the variance of the instantaneous frequency of the signals, and a further determination is made on the preliminary screening results obtained by the time delay estimation method. Compared with the STFT method, the Hilbert transform features a more streamlined computational process. While it is less capable than STFT in smoothly suppressing random noise under low signal-to-noise ratio (SNR) conditions, a comparable effect can be achieved when paired with a bandpass filter, and the characteristic differences between individual fish echoes and noise are more distinct. In contrast to high-computation methods such as WVD, it is more likely to be deployed on compact platforms like FPGA-based sonar systems for monitoring farmed fish.
Among them, is the instantaneous frequency sequence of the time-varying signal, is the instantaneous frequency at the central position of the sliding window, and is the length of the sliding window.
Ideally, for an individual fish target, the instantaneous frequency of its echo signal should be a straight line with a slope of . Where is the FM slope of the signal (, where is the bandwidth of the LFM pulse and is the signal pulse duration). The variance of the instantaneous frequency reflects the degree to which the instantaneous frequency sequence of the signal deviates from the center. The variance of the instantaneous frequency of the echo of an individual target should approach 0, which is significantly different from the overlapping echoes of individual fish and the noise signals. Therefore, the joint detection of the echoes of suspected individual fish targets can be carried out based on the significant differences in the instantaneous frequency characteristics between the echoes of individual fish and the overlapping echoes. It should be noted that echoes from targets with angular deviation or those in noisy environments may cause distortion of this shape, which is reflected in the instantaneous frequency as a greater deviation of the instantaneous frequency variance from the threshold. Thus, situations where individual fish echoes exist but are not detected may occur, manifesting as a more stringent orientation for screening individual fish echoes, which constitutes the limitation of this method.
- (1)
The procedure of the method for individual fish echo detection based on peak time delay combined with instantaneous frequency is shown in
Figure 3, with the specific steps as follows:After obtaining the target signal, a band-pass filtering process is carried out first. In this chapter, a fourth-order Butterworth filter is used to process the echoes of the fish school. The passband frequency range of the band-pass filter is from 160 kHz to 240 kHz, and the stopband frequency range is from 155 kHz to 245 kHz.
- (2)
After completing the matched filtering process, the peak detection method introduced in the previous section is adopted to conduct peak detection on the echoes. At the same time, peak time delay estimation is used to perform time-domain screening on the echoes of the fish school.
- (3)
The signal after band-pass filtering is synchronously processed in the time-frequency domain. Through the Hilbert transform, the instantaneous frequency of the echoes of the fish school is obtained, and then the variance of the instantaneous frequency is calculated to further screen the echoes of individual fish that have been screened in the time domain in the time–frequency domain.
- (4)
Through the joint detection of the peak time delay threshold and the instantaneous frequency variance threshold, when the echoes of individual fish all meet the threshold conditions, they can be determined as the echoes of individual targets.
2.4. Experimental Design
2.4.1. Fish School Echo Simulation
In order to evaluate the detection performance of the proposed method, the echoes of fish schools are simulated, and different identification methods are tested. For the echo of a single fish, its echo amplitude is affected by multiple factors jointly. These mainly include the parameters of the sonar system, such as the central frequency of the transmitted signal, the signal bandwidth, and the parameters of the transmitting and receiving systems, as well as the target strength of the fish [
33,
34]. After the unit amplitude signal transmitted by the fishing sonar is backscattered by the target fish, the echo amplitude of the target fish can be obtained.
With the continuous change in the spatial position of the fish school, the echo signals of the fish school collected by the sonar at a certain moment can be regarded as a linear superposition of a series of individual echo signals with different time delay differences in the time domain. In the simulation of fish school echo signals, the key influencing parameters include sonar system parameters, fish school density, parameters of a single fish, and the distance between the target and the transducer. Among them, the sonar system parameters can be preset in advance, and the echo frequency and pulse duration of a single fish can be adjusted according to the parameters of the transmitting system. The fish school density is determined by the number of fish in a unit space. The independent targets within the fish school are randomly distributed in space, which is manifested as the randomness of the spatial distance between independent individuals and the transducer. By randomly setting the time delay value of the echo of a single fish reaching the transducer, and combining with the amplitude change caused by the angular deviation of the target, the echo of the independent target fish at a random position can be obtained. Finally, by coherently superimposing the echoes generated by each individual target fish, the overall echo of the fish school can be obtained.
In practical applications, after the sonar transducer collects the echo signals of the fish school, the receiver will perform range compensation (Tvg) on the target. At this time, the processed echo signals of the fish school are mainly affected by the signal frequency, the signal bandwidth, and the target strength of the fish. In the simulation, a linear frequency modulation (LFM) signal is employed, with a central frequency of 200 kHz, a signal bandwidth of 80 kHz, a pulse width of 1 ms, and a sampling frequency of 2 MHz. Among them, the target strength of the fish within the fish school is determined based on that of the crucian carp. It is randomly selected from the dataset of the target strength of crucian carp with a body length ranging from 10 cm to 45 cm. Echoes with different signal-to-noise ratios are simulated by adding random Gaussian noise.
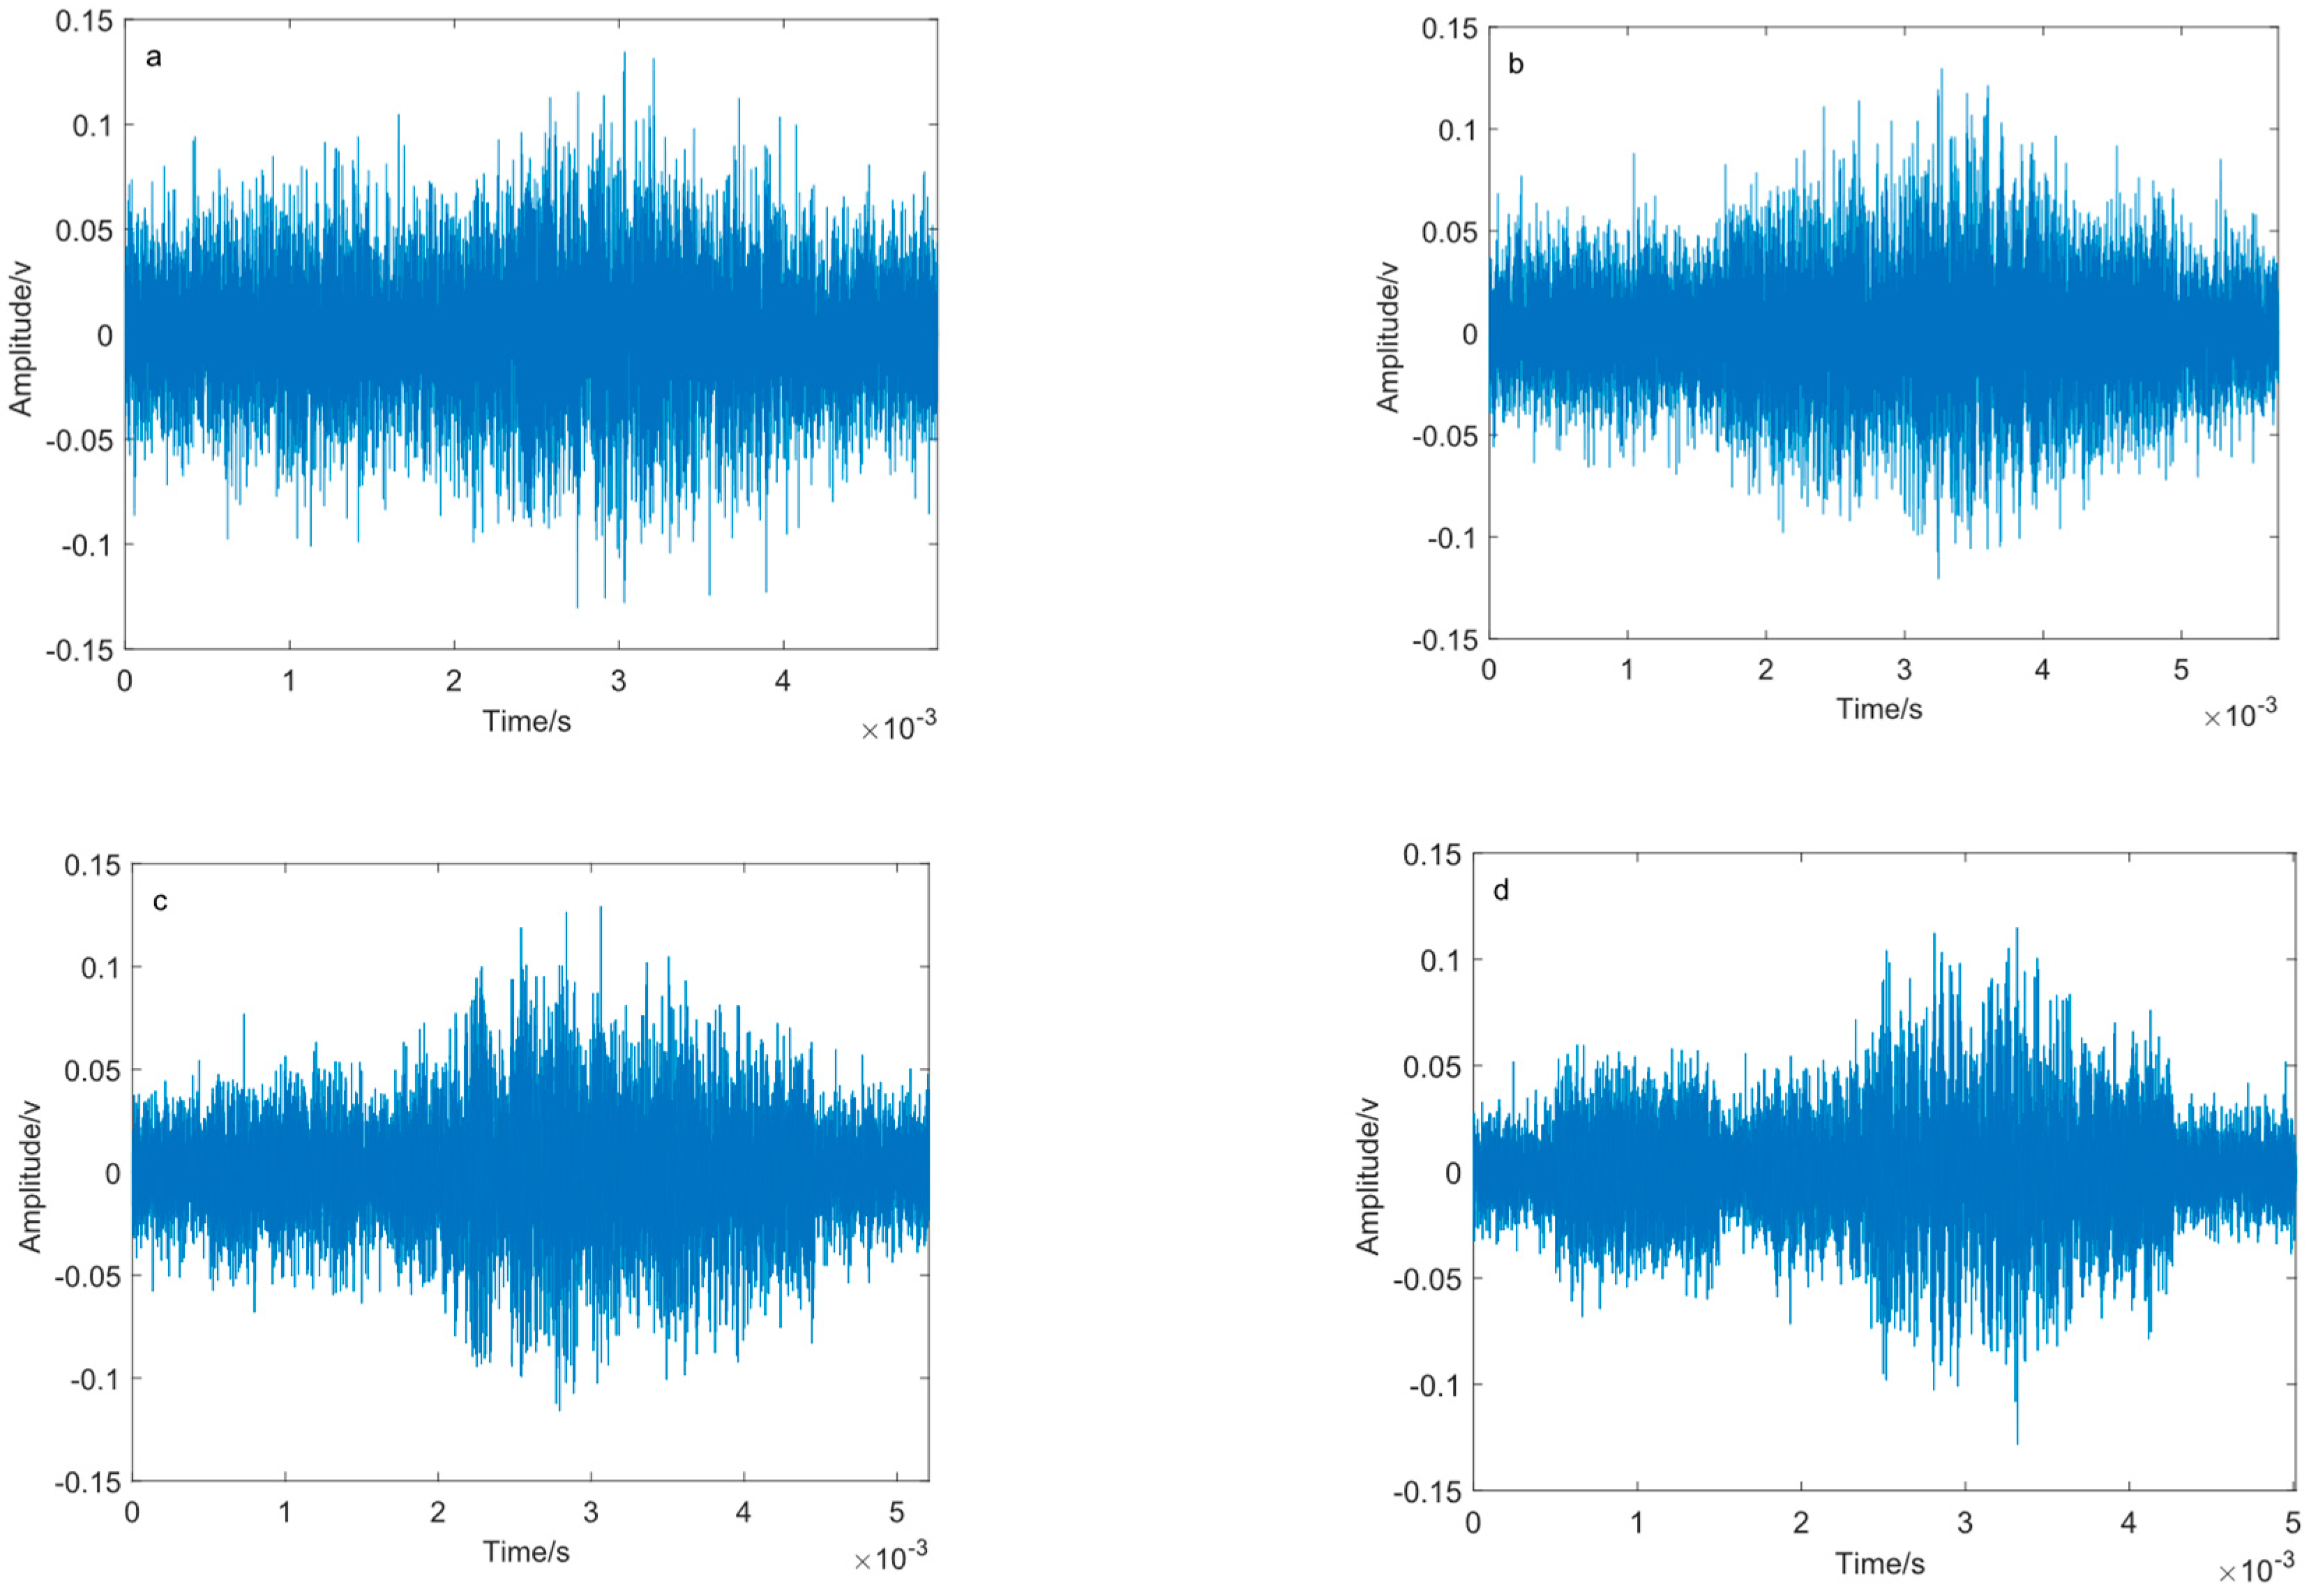
Figure 4 shows the simulated echoes of a fish school with 10 fish under different signal-to-noise ratio (SNR) conditions, when the distance (Dis) between a free individual fish and the fish school is 90 cm.
Figure 5 depicts the simulated echoes of fish schools with 10 fish at SNR = 10 dB under conditions of different fish school distances (Dis).
2.4.2. Live Fish Echo Collection
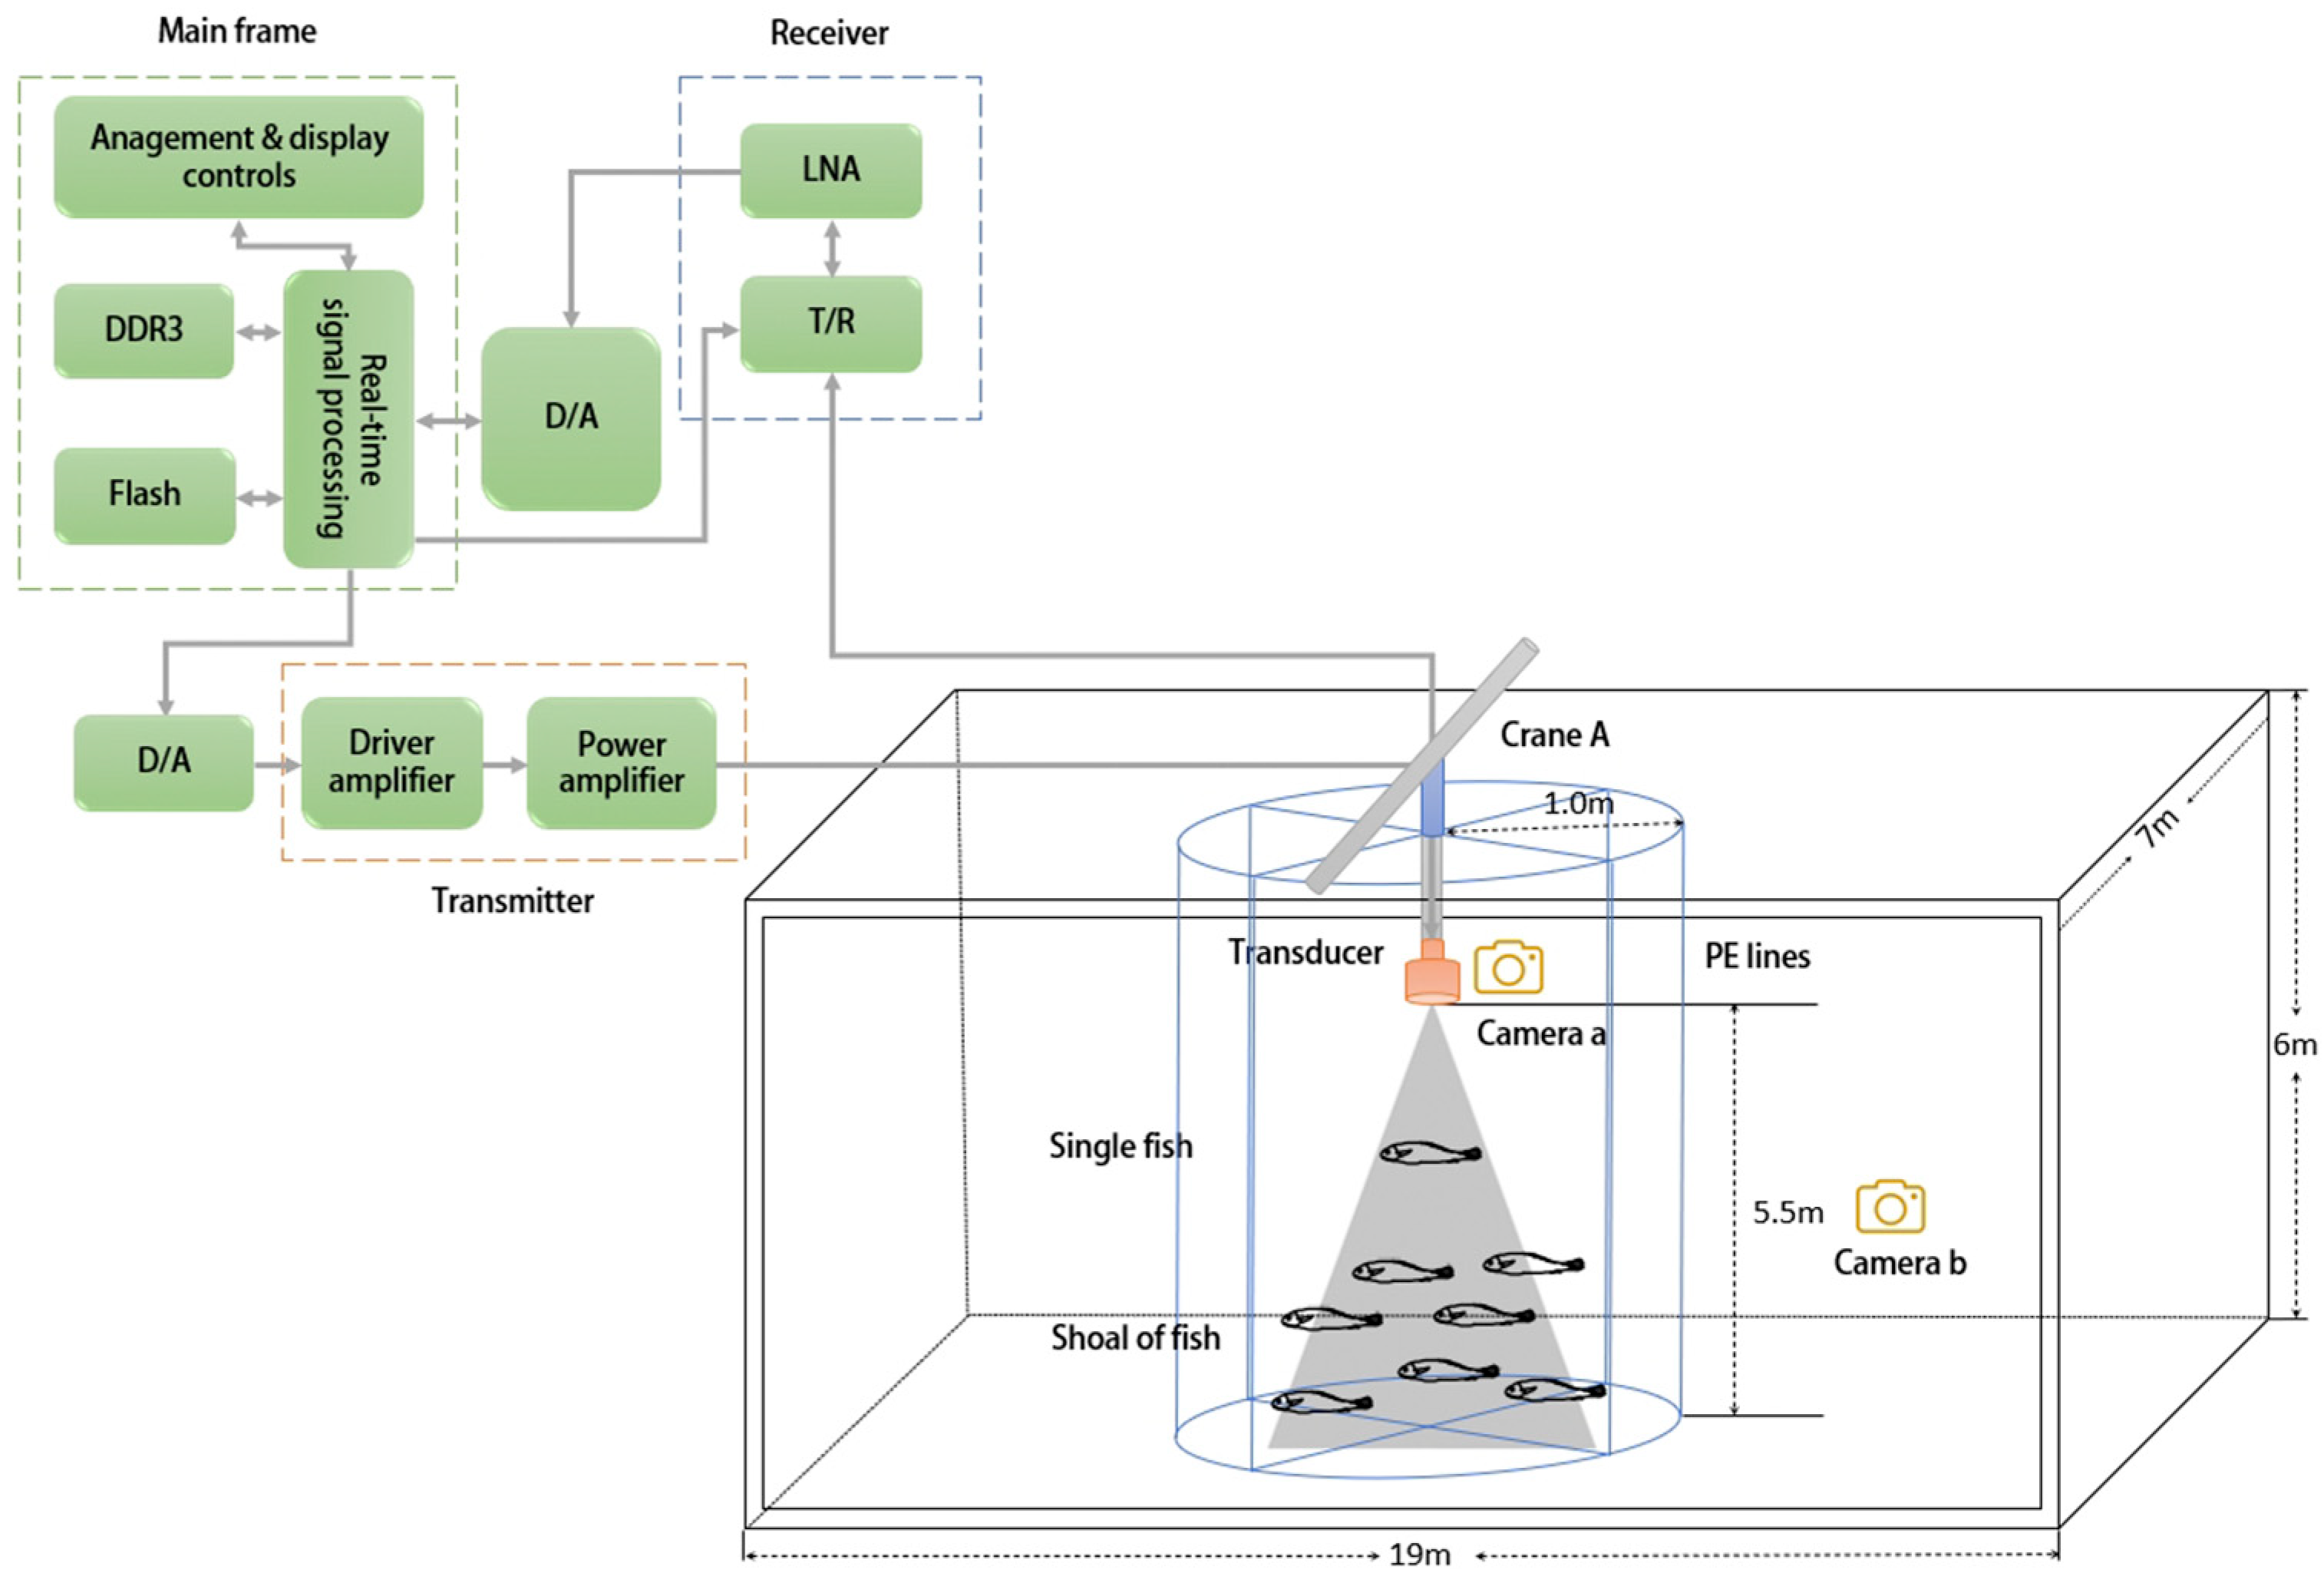
In order to verify the proposed method for identifying the echo of individual fish targets and its performance, this study built an experimental platform in an anechoic water tank to collect the echo signals of live fish schools. The water tank has dimensions of 19 m × 7 m × 6 m, and the experimental platform is shown in
Figure 6.
- (1)
Experimental Materials: Crucian carp with a body length of 200 mm to 350 mm were used in the experiment. During the experiment, all the fish were in good condition and swam freely in the water tank.
- (2)
Device Setup: First, the construction of the fish cage was completed before the experiment. A small cylindrical fish cage with a diameter of 2 m and a height of 6 m was used in the experiment to simulate the aquaculture scenario in the water tank and was fixed on the platform of the traveling crane A, as shown in
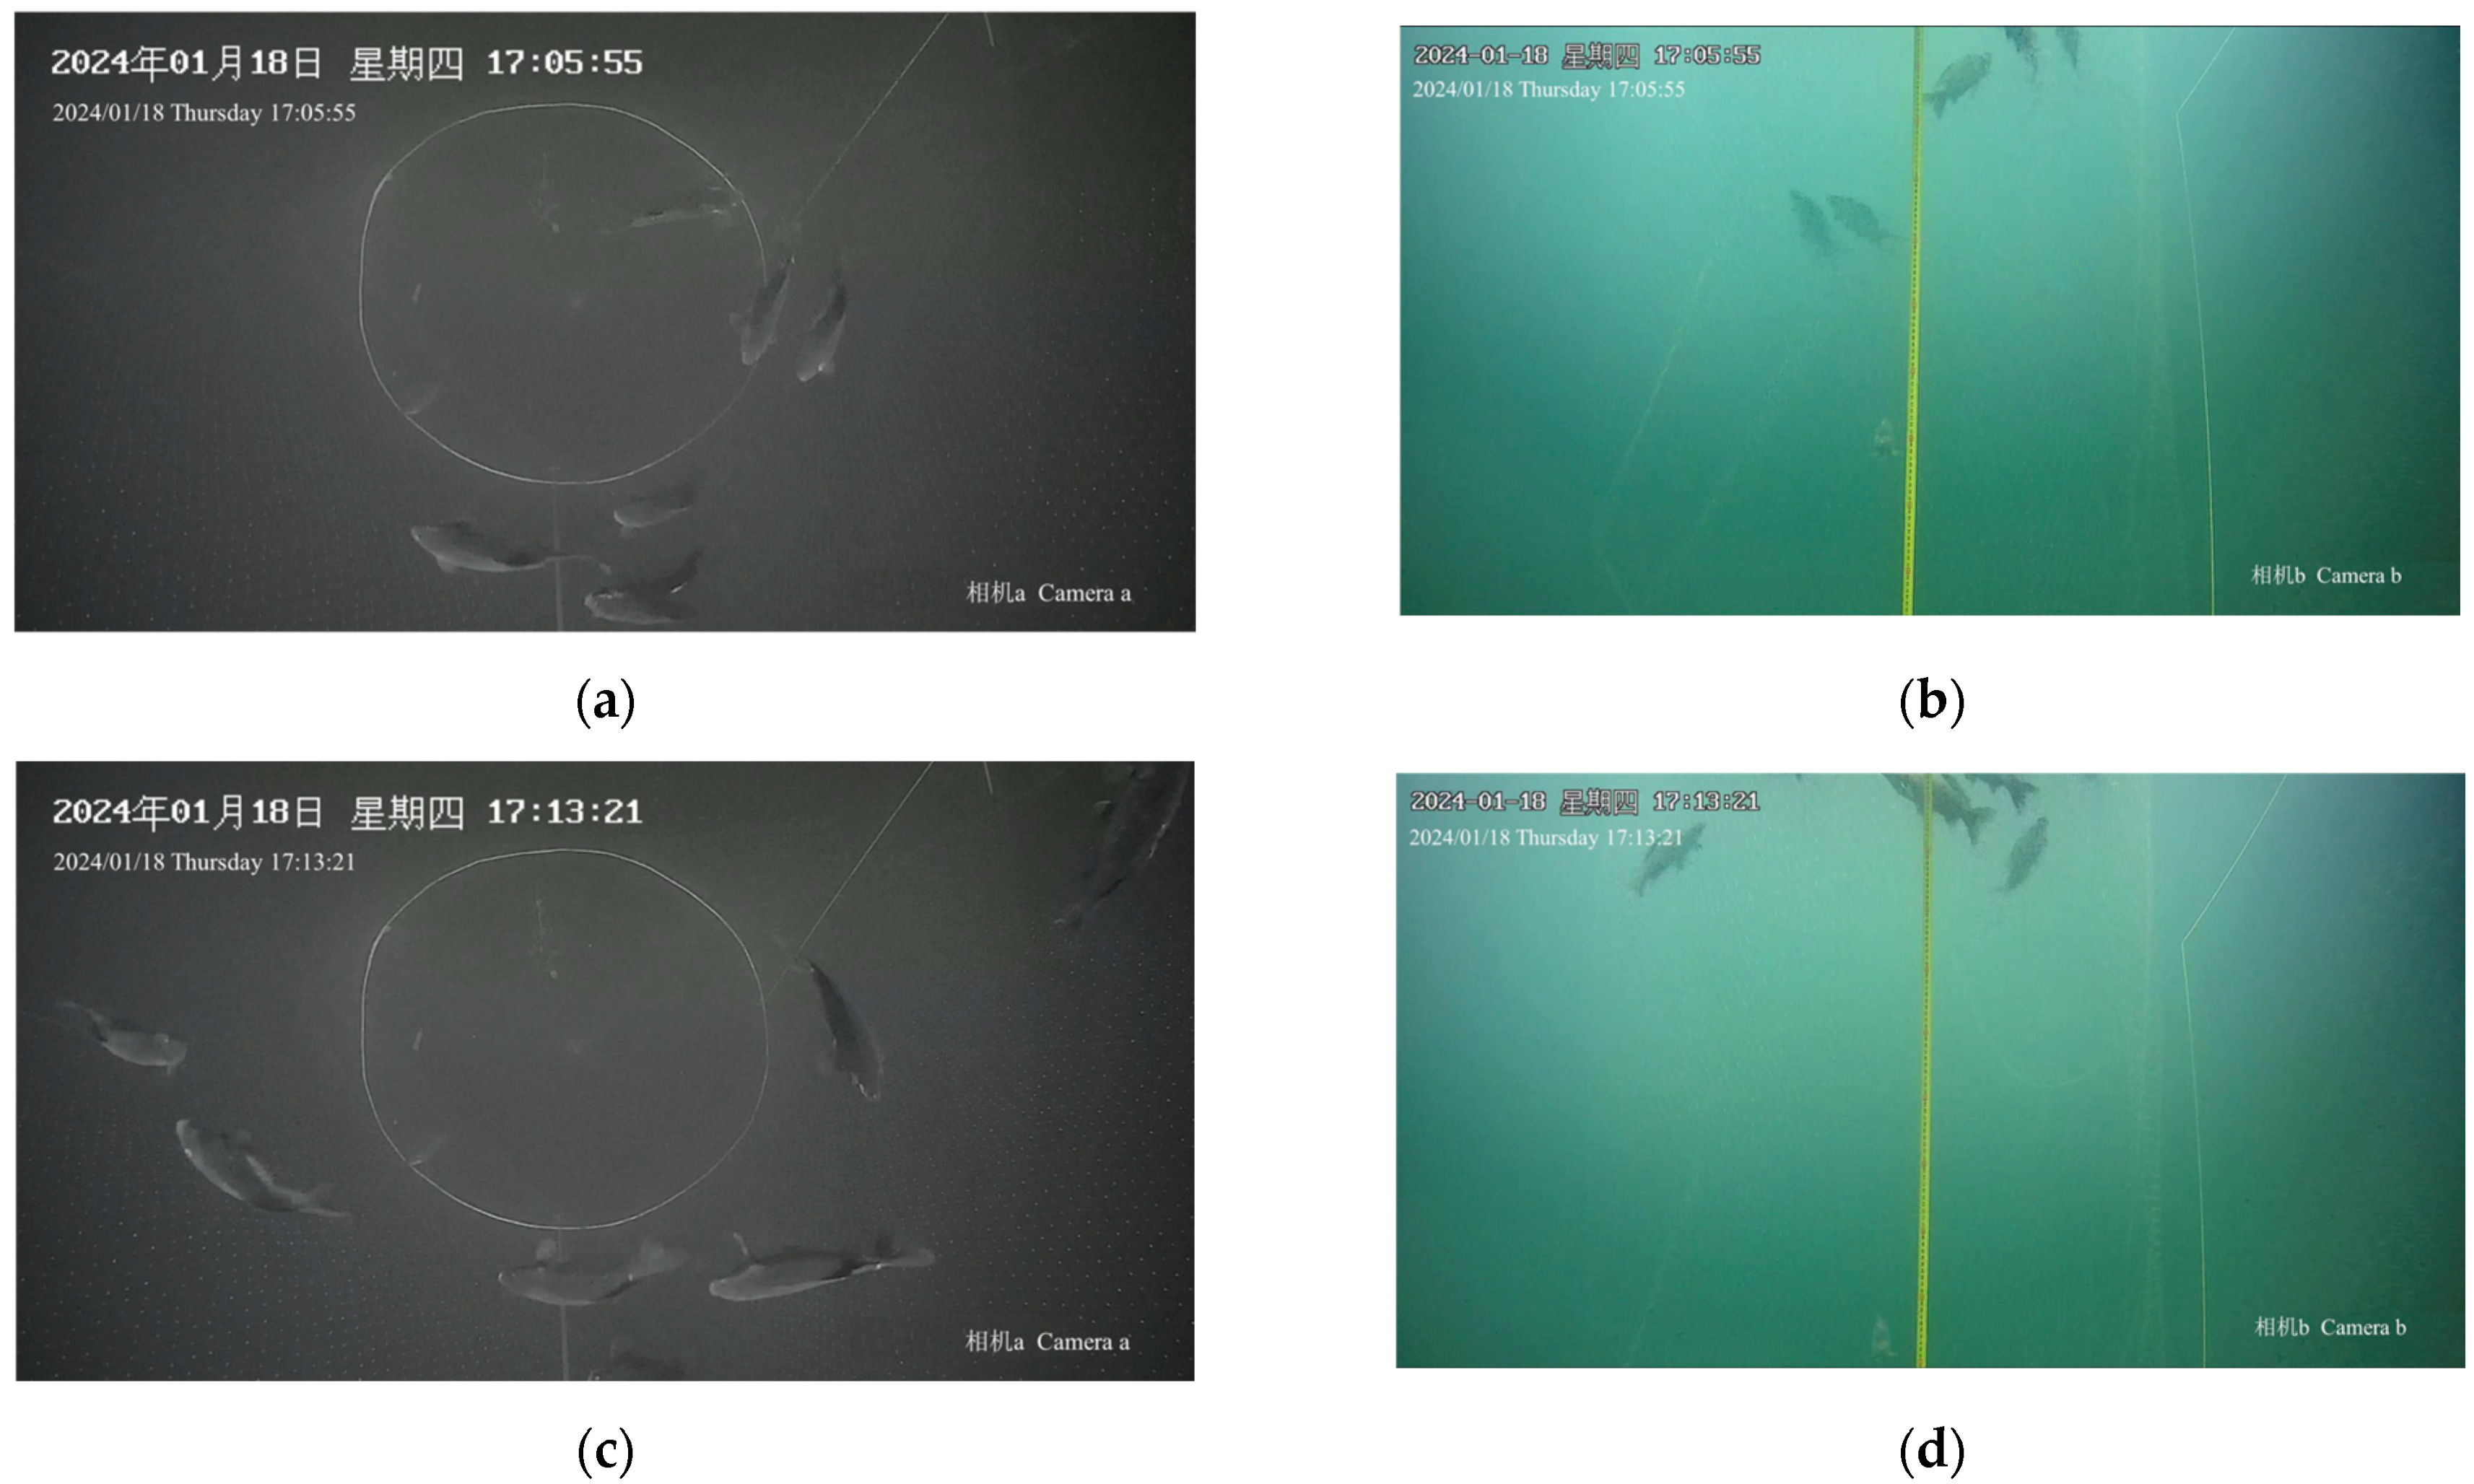
Figure 6. A 20-degree opening angle split-beam transducer is mounted on the lifting mechanism of trolley A. The transducer is positioned vertically downward in the middle part of the anechoic tank, at a water depth of 0.5 m. It is 5.5 m away from the tank bottom and 3.5 m from each of the two side walls of the tank. The signal processing system was used for the real-time collection of the echo signals of fish schools and individual fish. In order to ensure the visualization of the spatial positions of individual fish and the fish school at the moment of collecting the echoes, a scale was laid outside the aquaculture cage. At the same time, underwater cameras a and b were, respectively, set on the side of the transducer in the anechoic water tank and underwater, and they were turned on synchronously during the collection of the echo signals to monitor the spatial positions and states of the fish school.
- (3)
Experimental Parameters: A fast-tapered LFM (Linear Frequency Modulated) signal with a pulse duration of 1 ms is transmitted. The bandwidth of the transmitted signal was set to 80 kHz, and the echo signals were collected at a sampling rate of 2 MHz.
- (4)
Data Collection: The test was carried out in a vertical detection mode. Ten crucian carp were put into the fish cage. Among them, the water volume within the beam range was about 2 m3, corresponding to a density of about 5 fish per cubic meter. Five groups of fish school echo samples are sequentially collected over time and then preprocessed.
- (5)
Data preprocessing: To ensure that fish are within the range of acoustic wave irradiation, two underwater cameras were installed to perform manual screening on the collected fish school echoes. The spatial positions of swimming individuals were estimated using images from the underwater cameras and a scale ruler. Given that the transducer opening angle and the vertical distance from the fish body to the transducer are known, the distance from the fish body to the central axis of the cage can be calculated to estimate the fish’s position and further evaluate whether it is within the beam. In addition, to achieve a more controllable and relatively fair evaluation of the method’s performance, this study followed the approach adopted in previous research by selecting fish school echoes with objectively existing individual fish echoes for performance verification. By measuring the distance from an individual fish that strayed from the school (wherein the fish school refers to aggregated fish with overlapping echoes) to the edge of the school, it was ensured that, under the condition of transmitting a signal with a 1 ms pulse duration, when the distance between the individual fish target in the acoustic axis direction and the outer edge of the fish school exceeds 75 cm, there must be individual fish echoes in the fish school echoes that should be correctly detected. These were confirmed as valid echoes, and individual fish echo recognition experiments were conducted on the data collected at that moment to verify the effectiveness of the broadband individual fish recognition method. The state of the fish school during the collection is shown in
Figure 7.
The configuration information of the hardware and echo signal processing system adopted in the experiment is shown in
Table 1. Before the experiment started, parameters such as the water temperature in the anechoic water tank were measured. The water temperature was 13 °C, and the sound speed was approximately 1460 m/s. According to the calculation formula for the near-field range of the transducer, as well as the diameter
and wavelength
of the split-beam transducer:
It is calculated that the near-field range of the experimental transducer is 1.07 m. The experiment ensured that all the targets were outside the near-field range.
2.4.3. Echo Detection and Threshold Setting
To analyze the performance of the single fish echo detection method based on the combined features of peak time delay and instantaneous frequency proposed in this study, the experimental samples to be tested were the simulated echoes of fish schools and the echoes of live fish under different spatial distribution states and signal-to-noise conditions, respectively. Performance studies were carried out on the amplitude pulse width method(APM), the peak detection and time delay estimation method (PDM), and the peak time delay combined with the instantaneous frequency method (PDIM).
In echo detection, the experiment set the peak detection threshold PeakAmp, the signal time delay threshold PeakT, and the instantaneous frequency variance threshold PeakVar (as shown in
Table 2). In this experiment, the peak detection threshold PeakAmp was derived from the fitting dataset of the target strength of crucian carp within a certain body length range, which was obtained based on the Kirchhoff approximation model and pool measurements of the target crucian carp. Since the sonar performs range compensation (Tvg) on the fish school echoes, it can be considered that the amplitude of the fish school echoes is independent of the distance and only related to the TS of the target fish body. Therefore, a detection threshold within a certain range can be set through the prior data of the target strength.
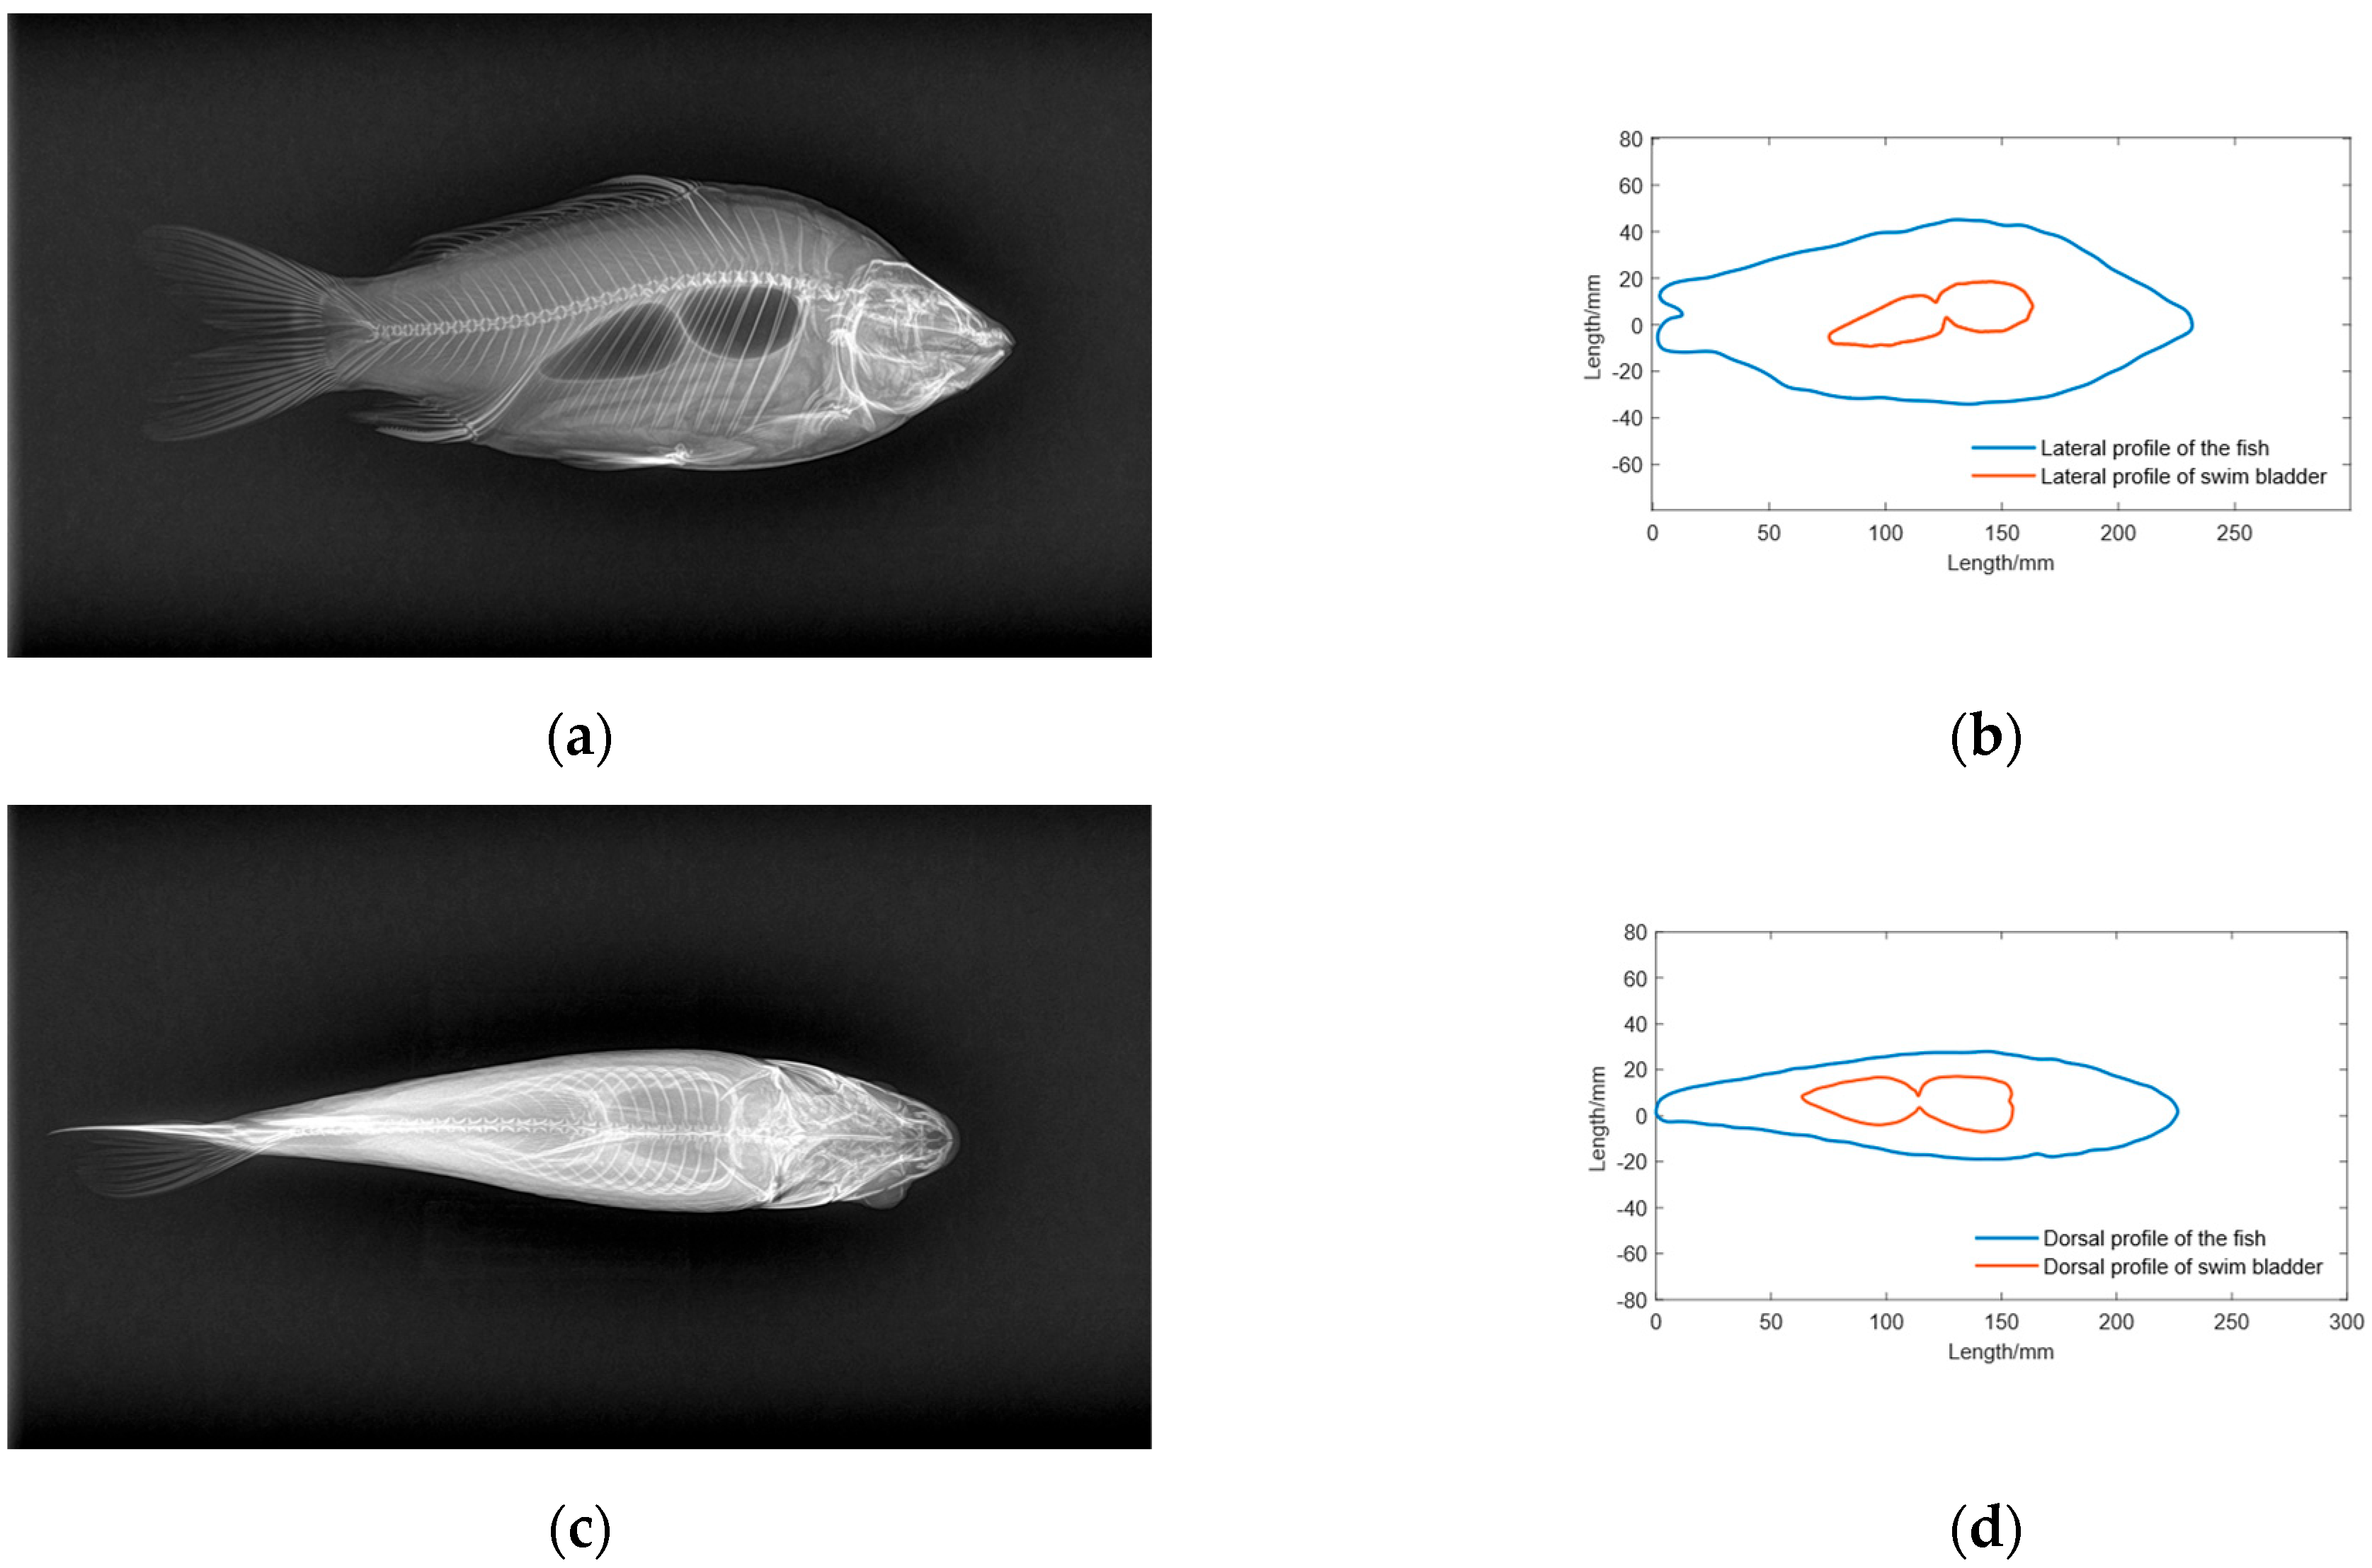
According to the theory of the Kirchhoff approximation model, crucian carp was selected as the target fish in the experiment. The parameters of the target fish were obtained through X-ray photography and contour extraction (as shown in
Figure 8), which served as the parameters for the Kirchhoff model. Meanwhile, the fish body and swim bladder were placed in a three-dimensional coordinate system to obtain the input parameters of the Kirchhoff approximation model. The specific parameters of the fish body and swim bladder were obtained through experimental dissection. According to the contours of the swim bladder and fish body obtained from the experiment, the Kirchhoff approximation model was used to obtain the target strengths of fish with different body lengths, and then the target strength–body length curve was fitted.
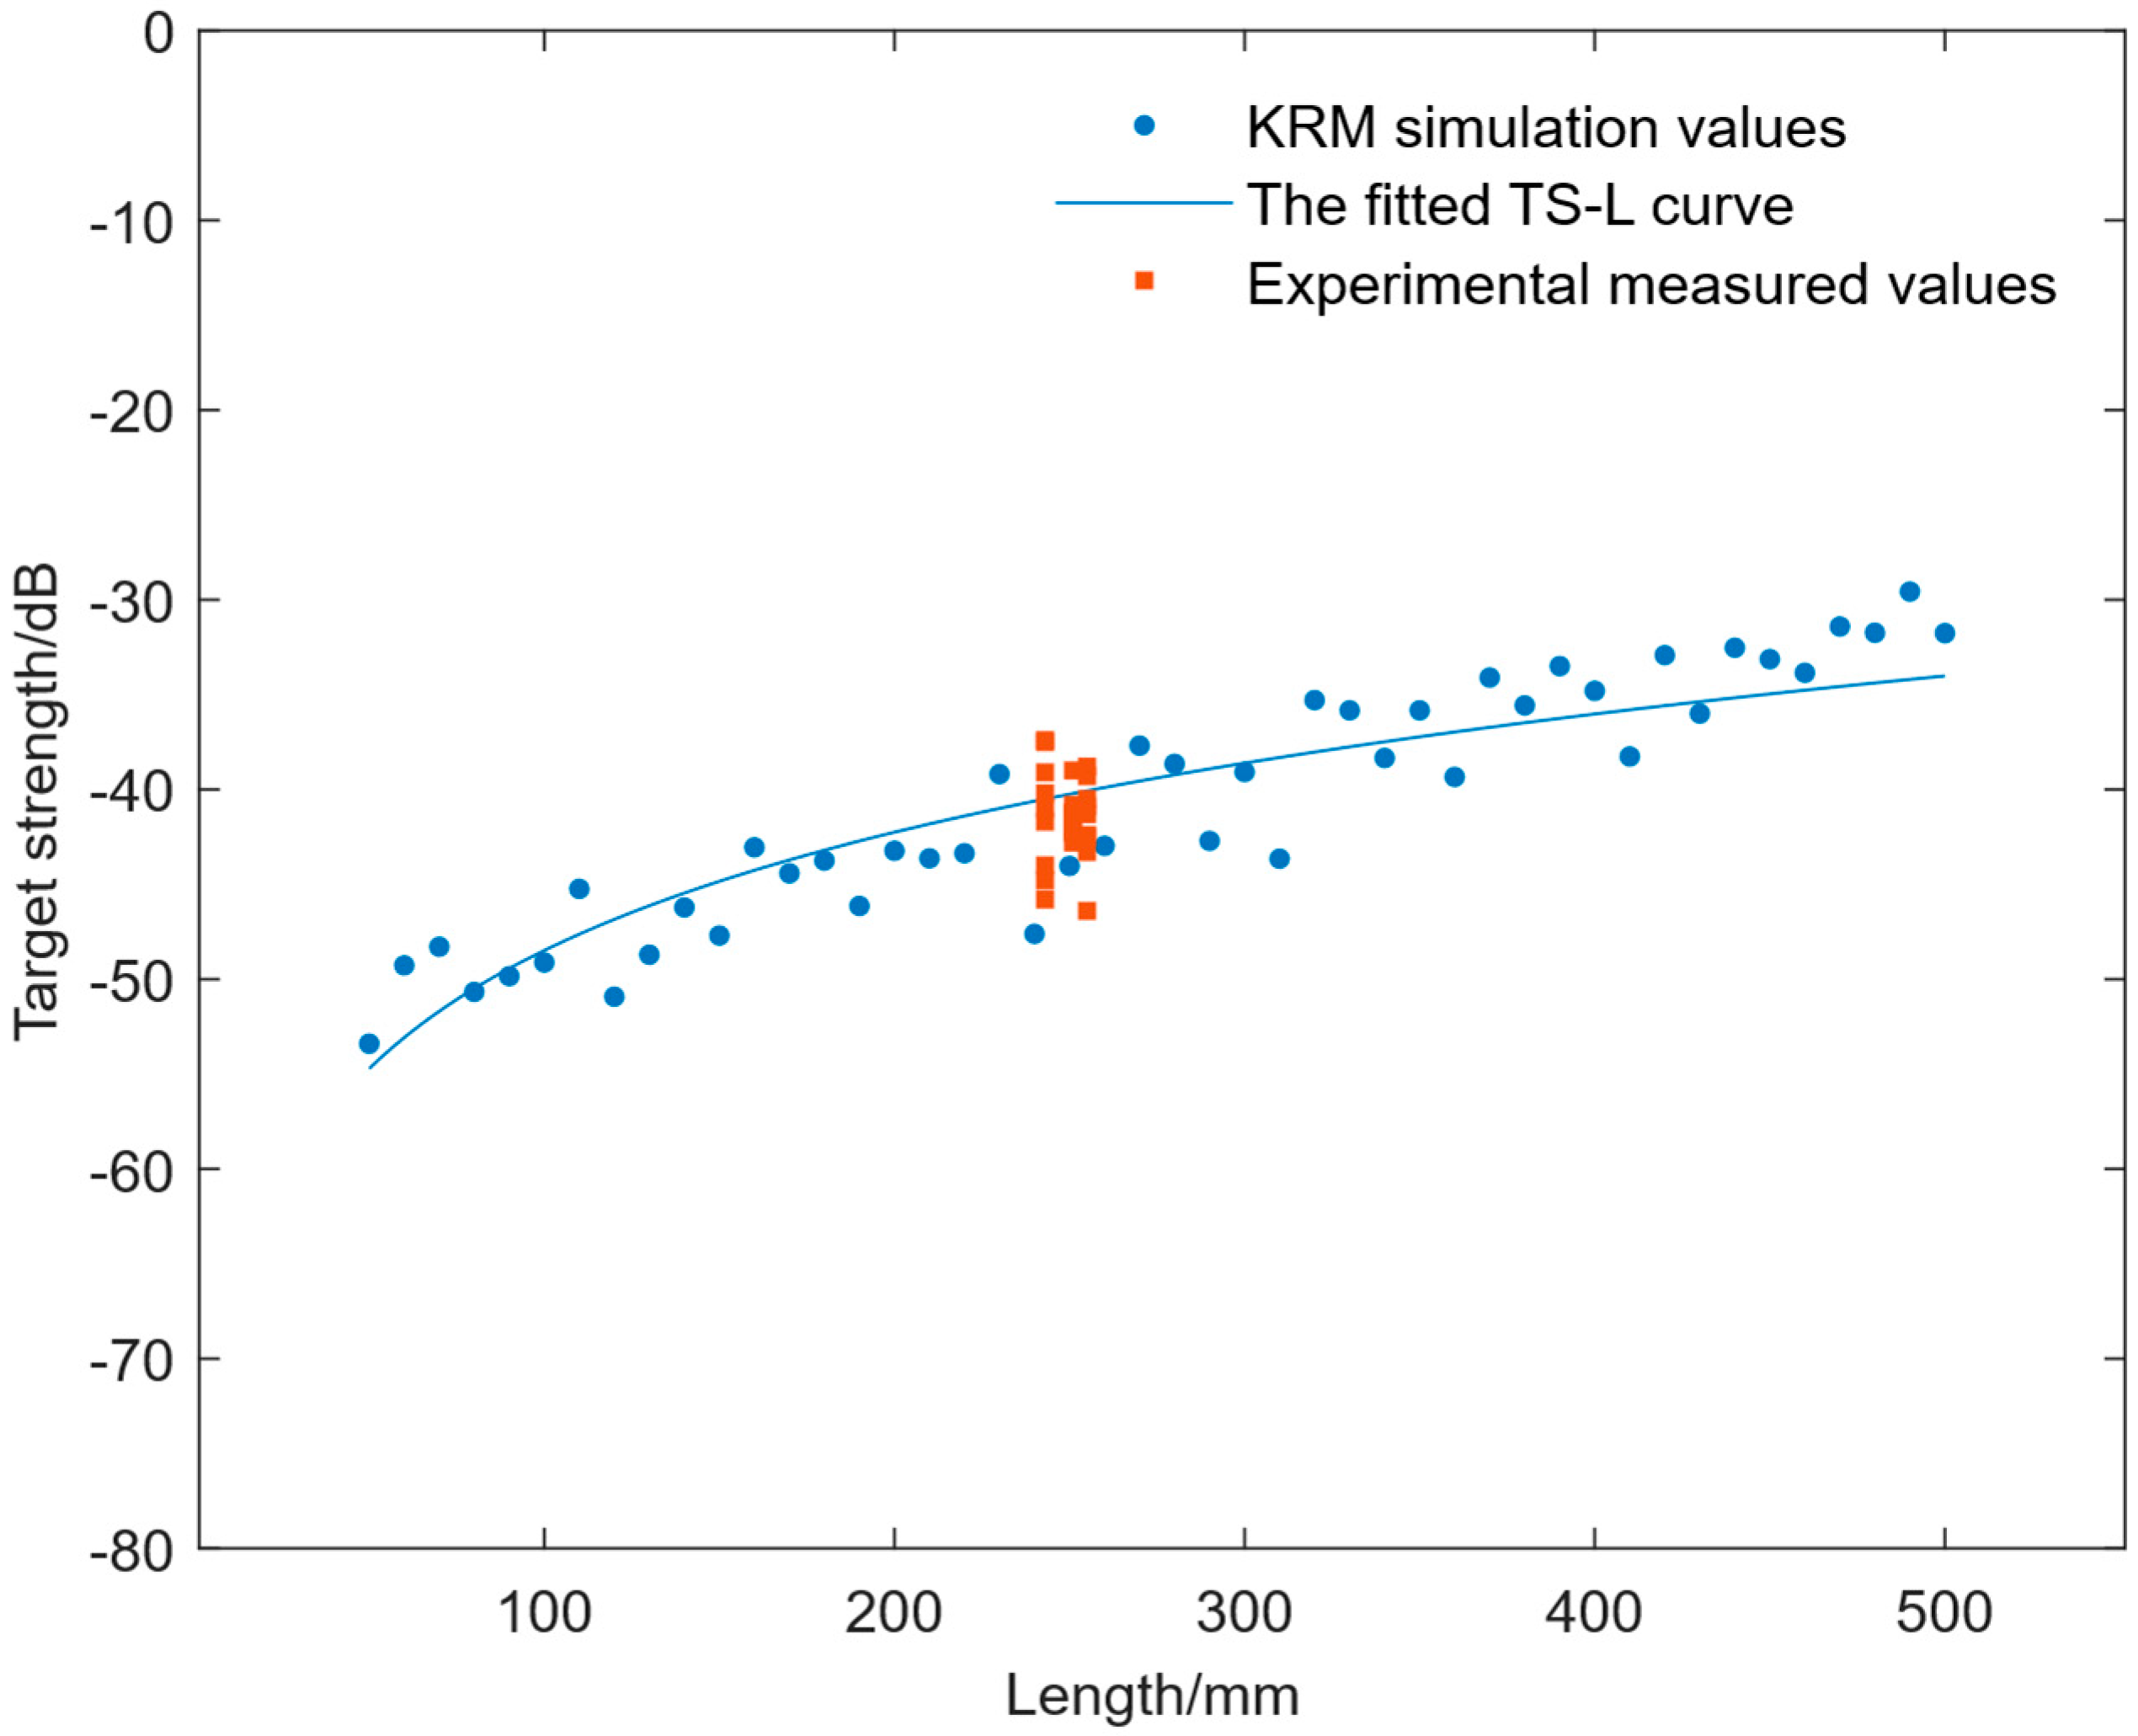
Furthermore, through actual measurements of the target strength of experimental crucian carp using the tethering method, measurements were obtained for three crucian carp at a dorsal posture angle of 82–98°. In
Figure 9, the blue dots represent the target strength of single fish calculated by the model, the blue line represents the fitted average target strength–body length curve of crucian carp in the dorsal lateral aspect, and the red square dots are the target strength of crucian carp obtained from the experimental measurement. Target strength–body length fitting adopted the classical relationship [
35]:
where b is −71.7. Under the same conditions, the target strength values obtained from experimental measurements and model-based simulations both vary within an approximate range. Based on this, the dorsal lateral average target strength within a certain range of body lengths was obtained to set the peak detection threshold.
The signal time delay threshold PeakT is directly related to the pulse width of the transmitted signal. Echoes with a time delay difference close to the pulse width of the transmitted signal can be regarded as suspected single fish echoes. After obtaining the peak positions of the suspected single fish target echoes and conducting a preliminary screening of the overlapping echoes, the instantaneous frequency variance threshold PeakVar is set to carry out detection synchronously. It is used to distinguish single echoes from overlapping echoes. When the instantaneous frequency variance
is lower than the threshold, the single-target signal is obtained. The instantaneous frequency variance threshold is set according to the method in Reference [
31], which can meet the requirement of excluding overlapping echoes while retaining more single echoes.
2.5. Experimental Data Processing
Simulation experiments were conducted on the MATLAB(R2021b) platform, and an individual fish echo detection program was constructed. Through simulation, 3000 frames of fish school echo samples were generated, in which individual fish echoes objectively exist and overlapping echoes serve as interference items, for the detection program to test. When individual fish echoes are detected and their quantity is consistent with the number of individual fish echoes in the samples, it is confirmed as a successful detection, and the number of successful detections is counted. The recognition accuracy is obtained by dividing the number of successfully detected samples by the total number of samples. When the number of detected individual fish echoes exceeds the number of individual fish echoes set in the experiment, it indicates that overlapping echoes are falsely detected. Finally, the false recognition rate is obtained by dividing the total number of falsely detected samples by the total number of experimental samples.
For the live fish echo experiment, the same individual fish echo detection program was adopted. The samples collected in 5 acquisitions were detected separately, and the recognition accuracy and false recognition rate were calculated using the same method.
3. Results
3.1. Peak Detection and Time-Delay Estimation of Simulated Fish School Echoes
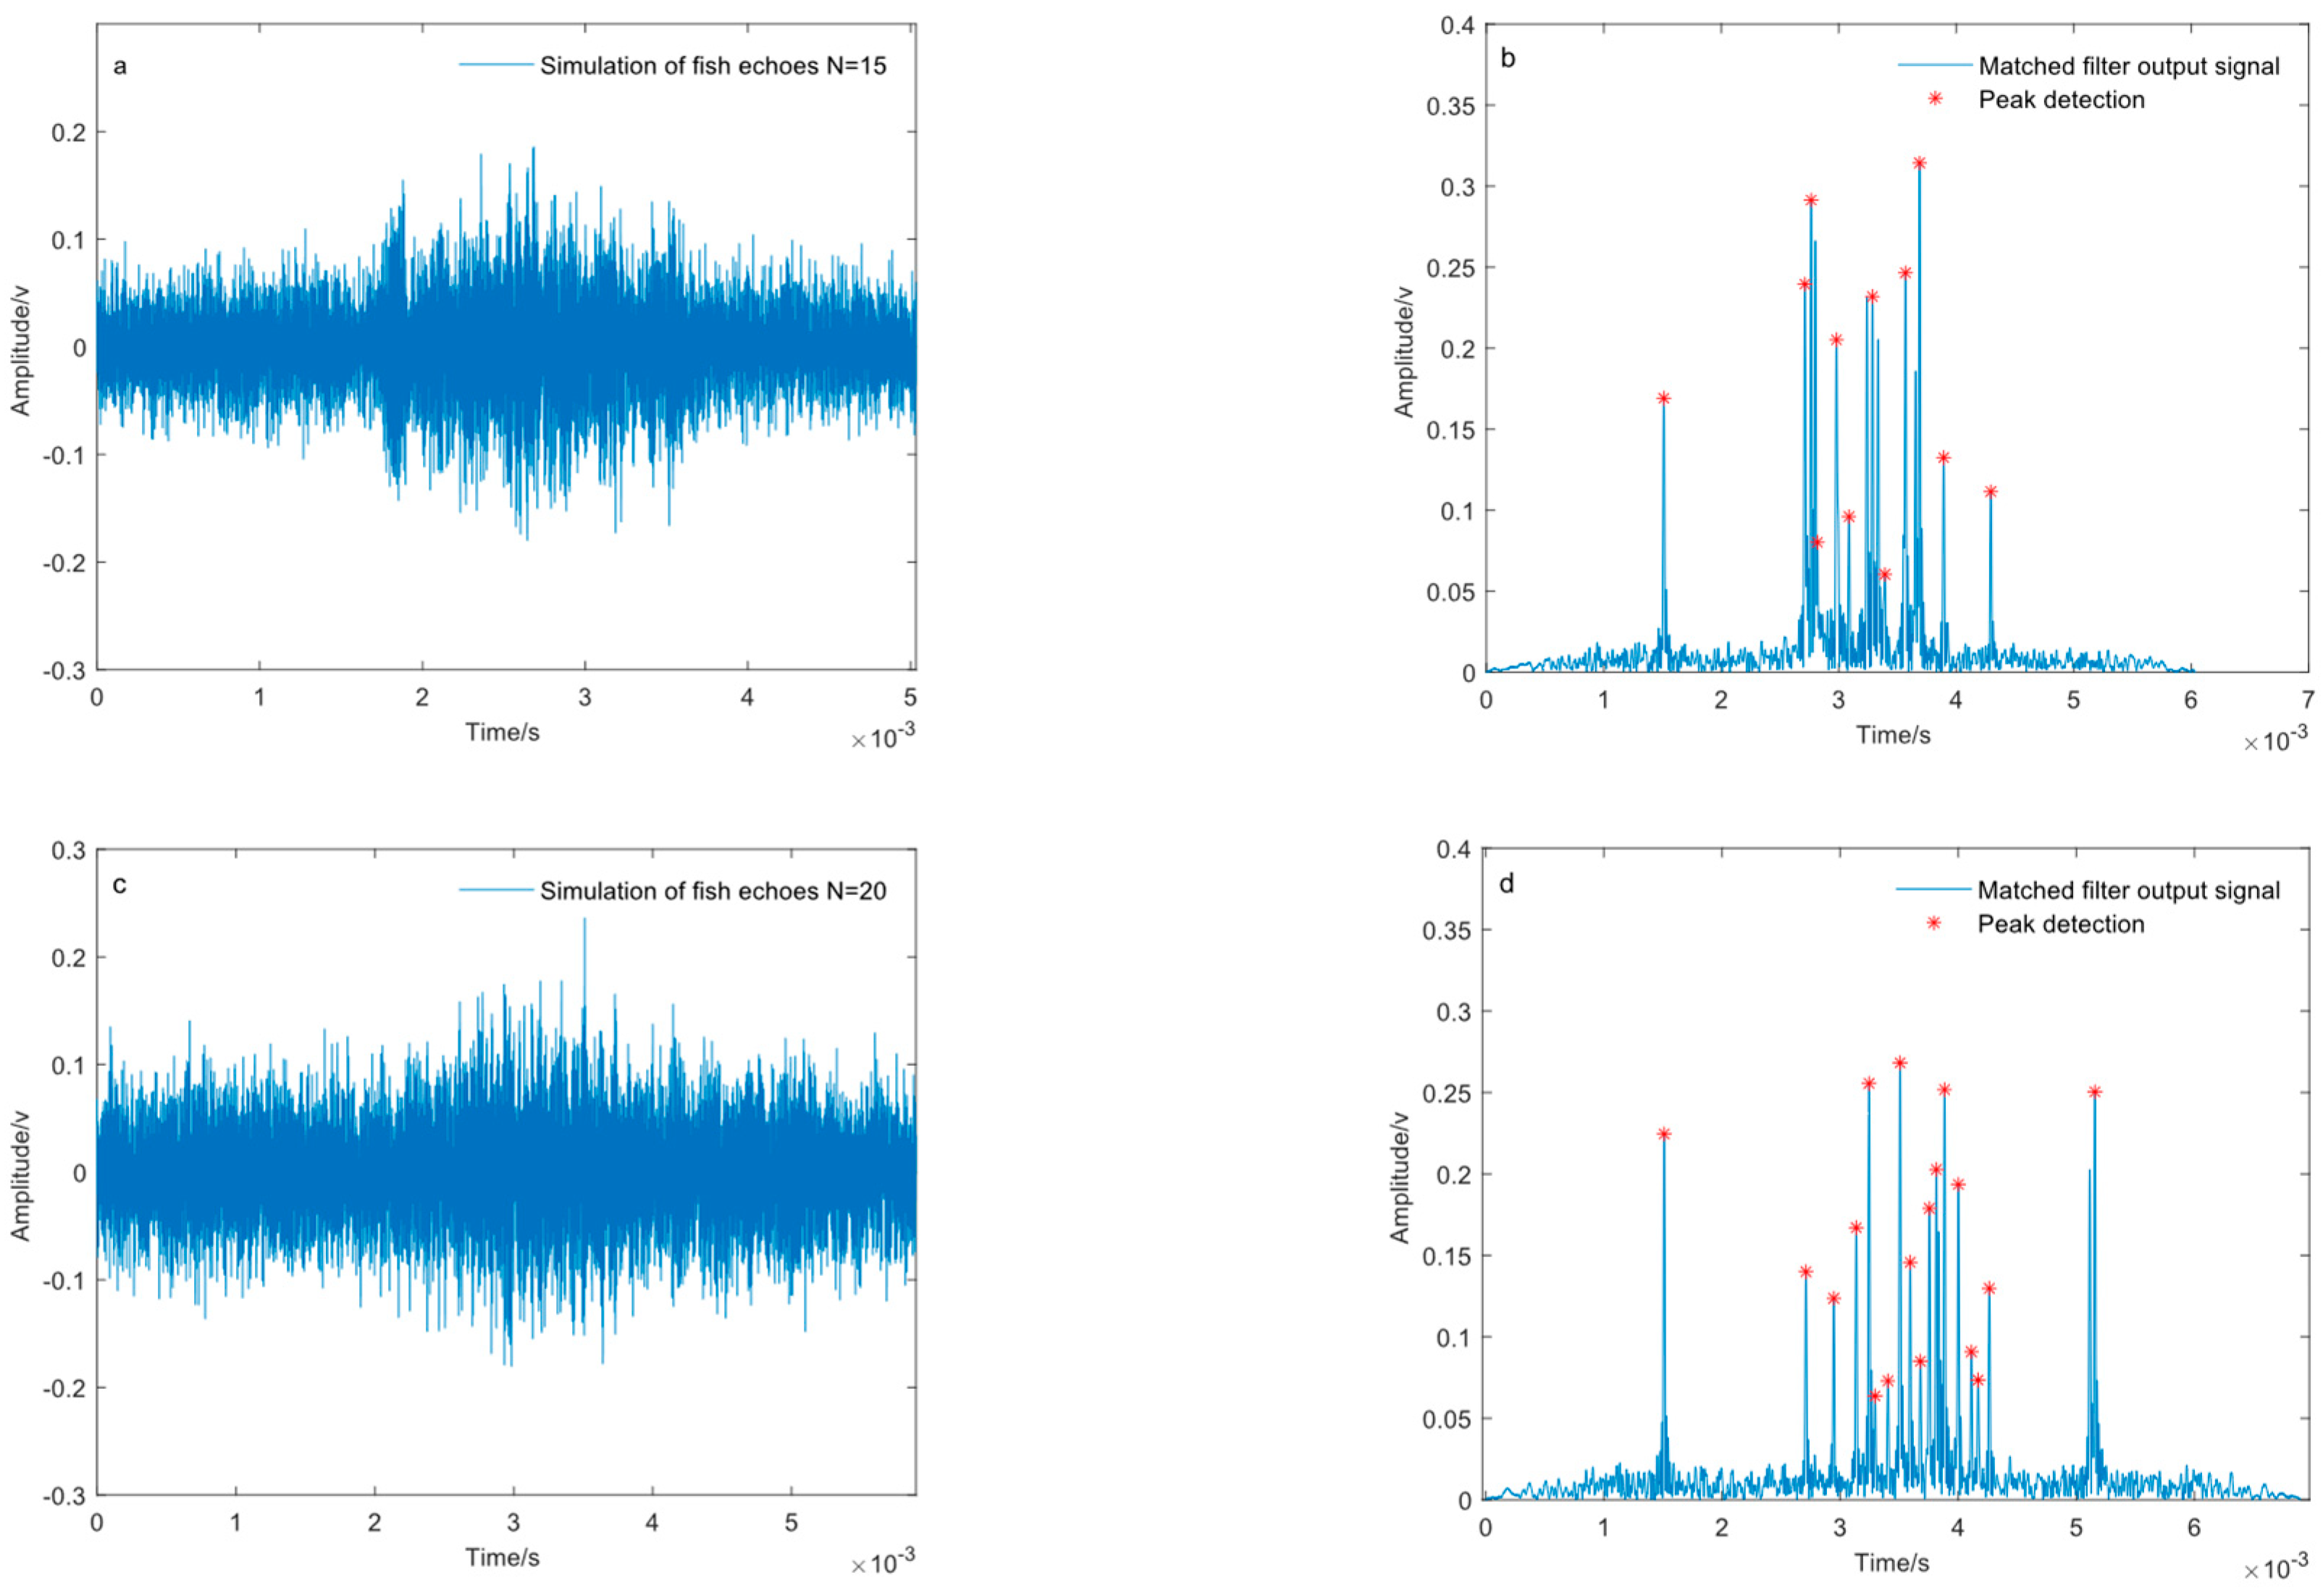
Figure 10 shows the simulated fish school echoes after matched filtering processing. It can be seen that the matched filtering processing exhibits a high range resolution capability. For fish schools with different numbers, good time-domain characteristics have been obtained, which provide a time-domain basis for accurately acquiring the echoes of single fish. By means of peak detection, the time delay difference between adjacent echoes can be obtained. Combined with the pulse width of the transmitted signal, most of the overlapping echoes can be excluded. However, the matched filtering processing cannot fully reflect the spatial characteristics and information of the fish school. When relying on peak detection to obtain the distance information of individual fish targets relative to the acoustic axis direction of the transducer, there are situations where some targets are missed in detection.
3.2. The Echoes of Crucian Carp Collected in Tank Experiments and Their Spectral Characteristics
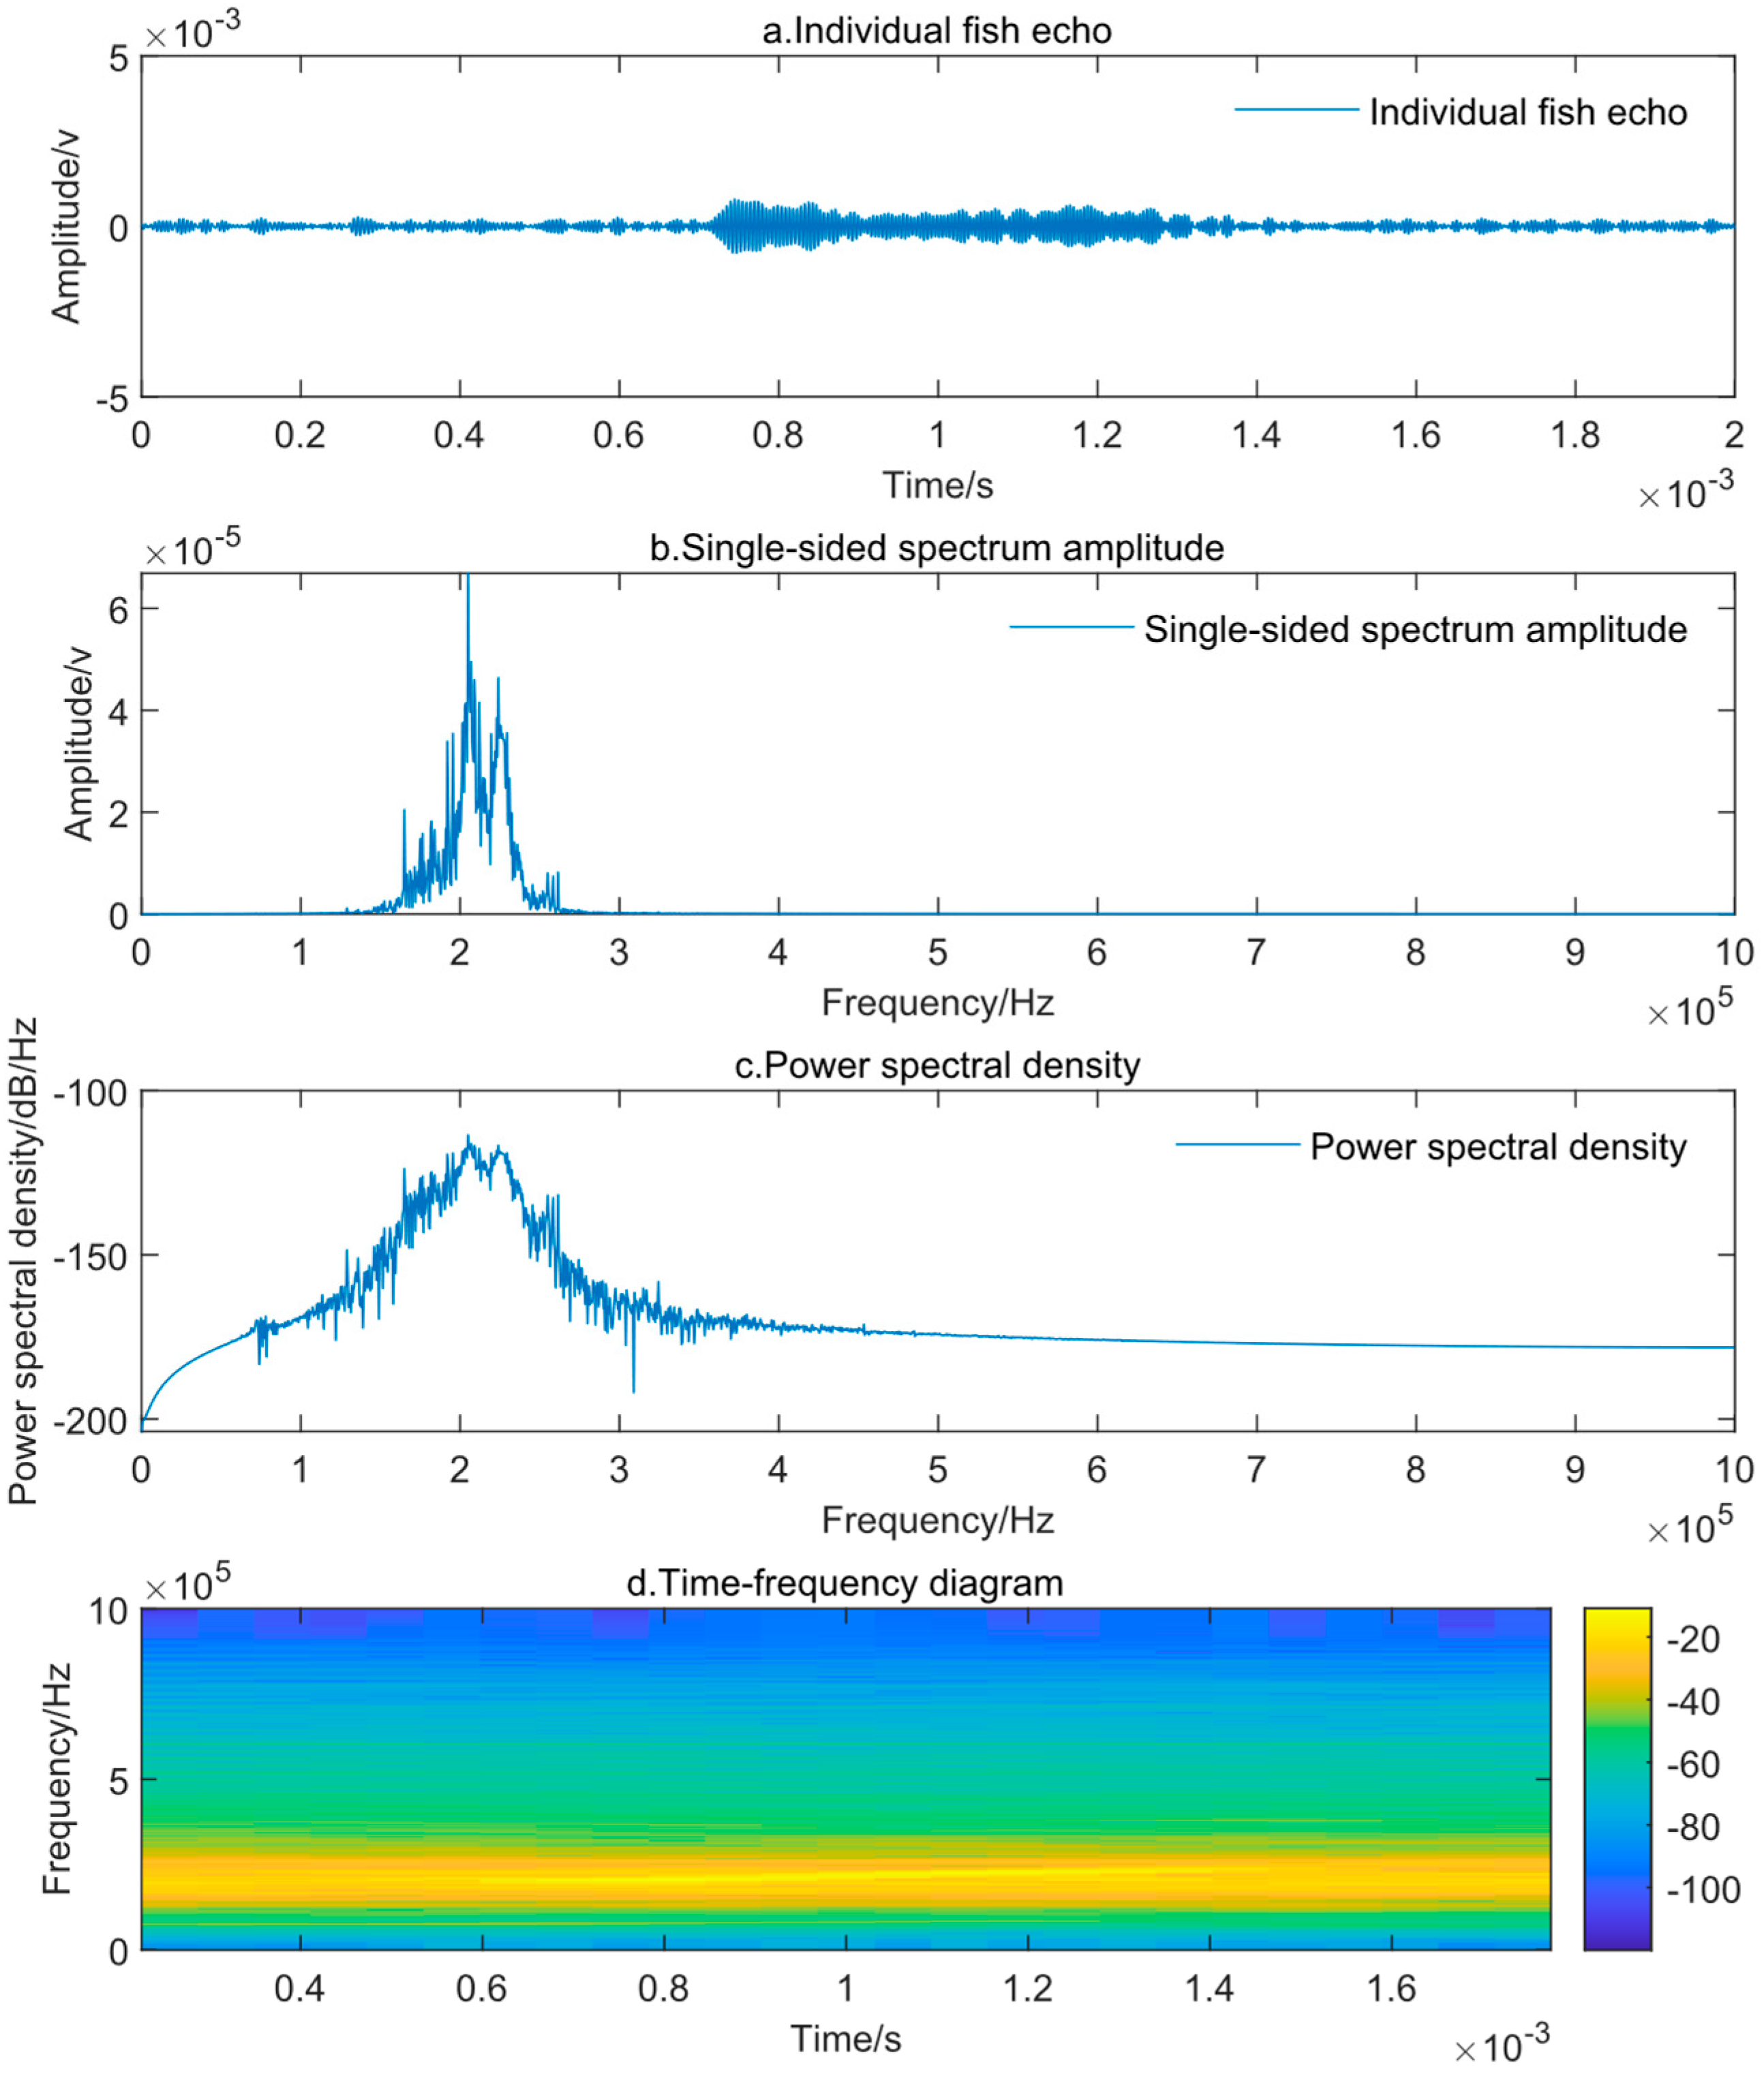
Figure 11 shows the echoes of crucian carp and their frequency spectra collected in the tank experiment. The collected echoes were first subjected to band-pass filtering.
Figure 11a presents the original time-domain signal after filtering with a fourth-order Butterworth filter.
Figure 11b displays the frequency spectrum of the crucian carp echoes, from which it can be observed that the echo frequencies are concentrated in the 160 kHz–240 kHz band.
Figure 11c shows the power spectral density of the crucian carp echoes containing environmental noise from the tank.
Figure 11d is the spectrogram of the crucian carp echoes, and it can be seen that the instantaneous frequency of the echo from a single fish exhibits a regular distribution.
3.3. Instantaneous Frequency Estimation of Simulated Fish School Echoes and the Collected Fish School Echoes
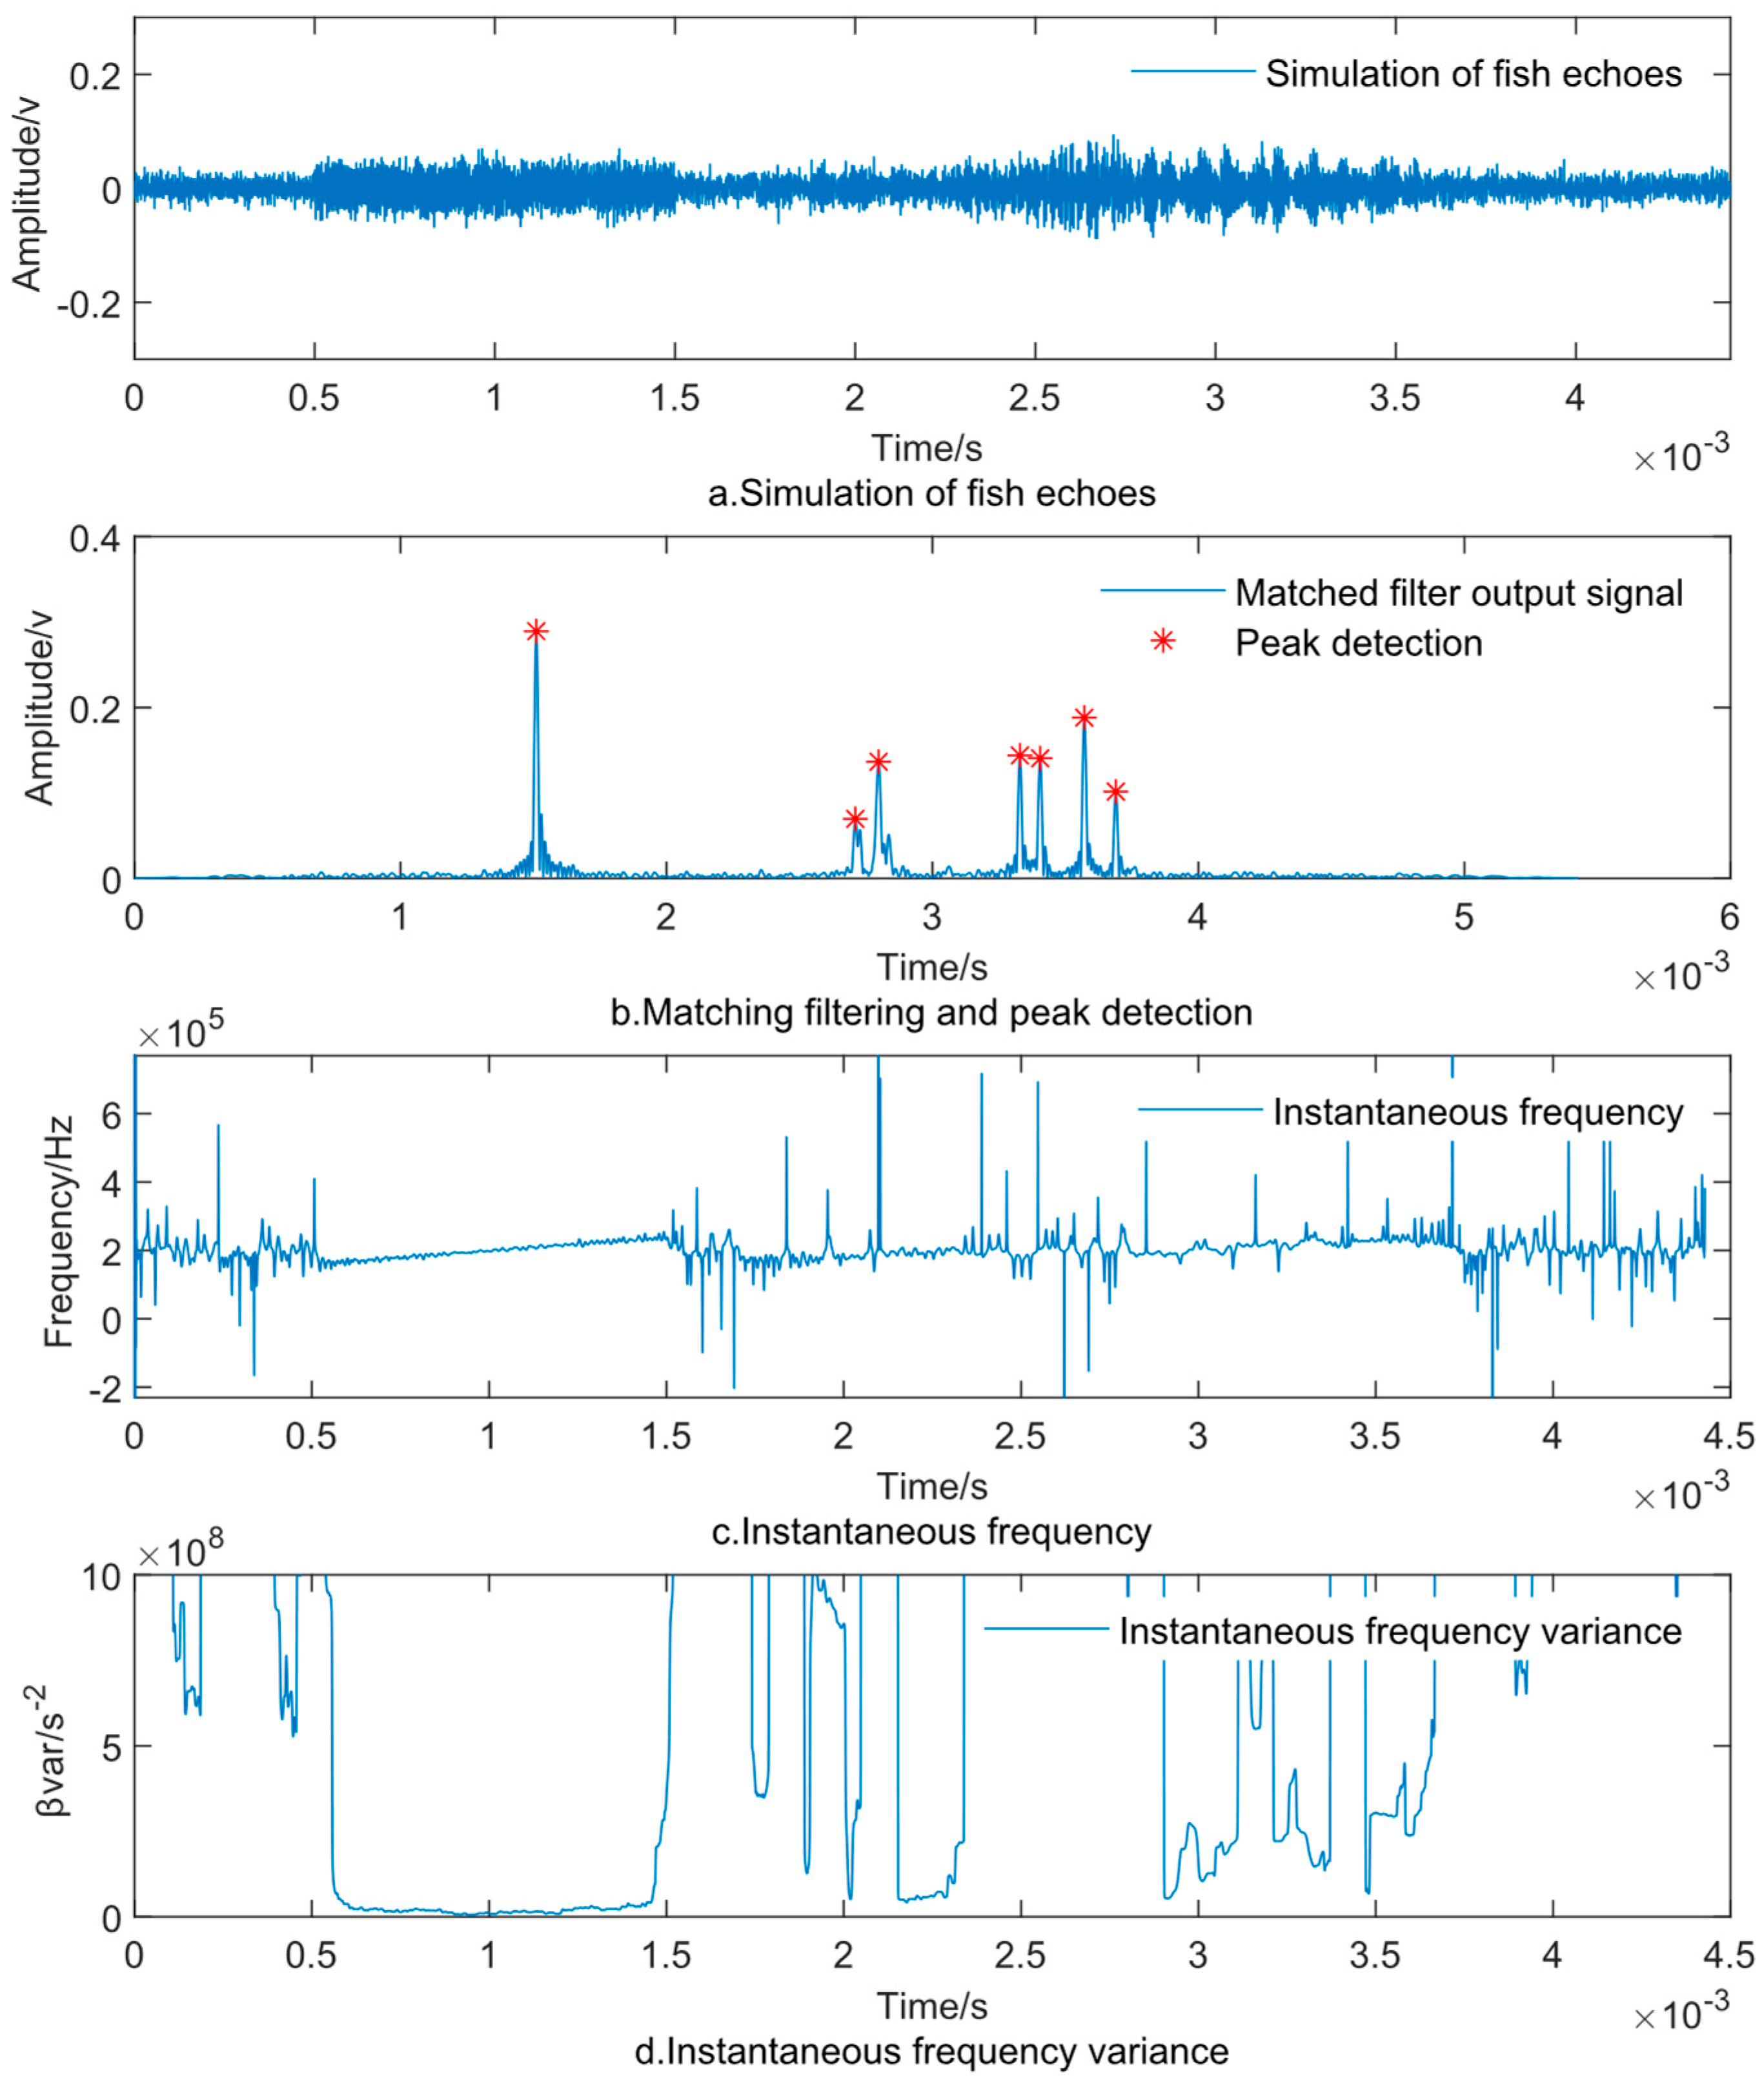
Figure 12a shows typical simulated fish school echoes, including single-target echoes and overlapping echoes. Among them, the time axis from 0.5 to 1.5 ms corresponds to the single-target echoes, and the time axis from 2.2 to 3.8 ms corresponds to the overlapping echoes.
Figure 12b shows the results of the simulated fish school echoes after matched filtering processing. According to the Hilbert transform, the instantaneous frequency of the collected echo signal can be estimated. The results are shown in
Figure 12c. The instantaneous frequency of the signal corresponding to the single-target echo moment is a slanted straight line without obvious frequency jumps. The time width is close to the pulse width of the transmitted signal, approximately 1 ms. The results of obtaining the instantaneous frequency variance through a sliding window are shown in
Figure 12d. The characteristics of the instantaneous frequency variance of the single-target echo signal are significantly different from those of the overlapping echo signal. By setting a reasonable instantaneous frequency variance threshold, single-target echoes and overlapping echoes can be distinguished.
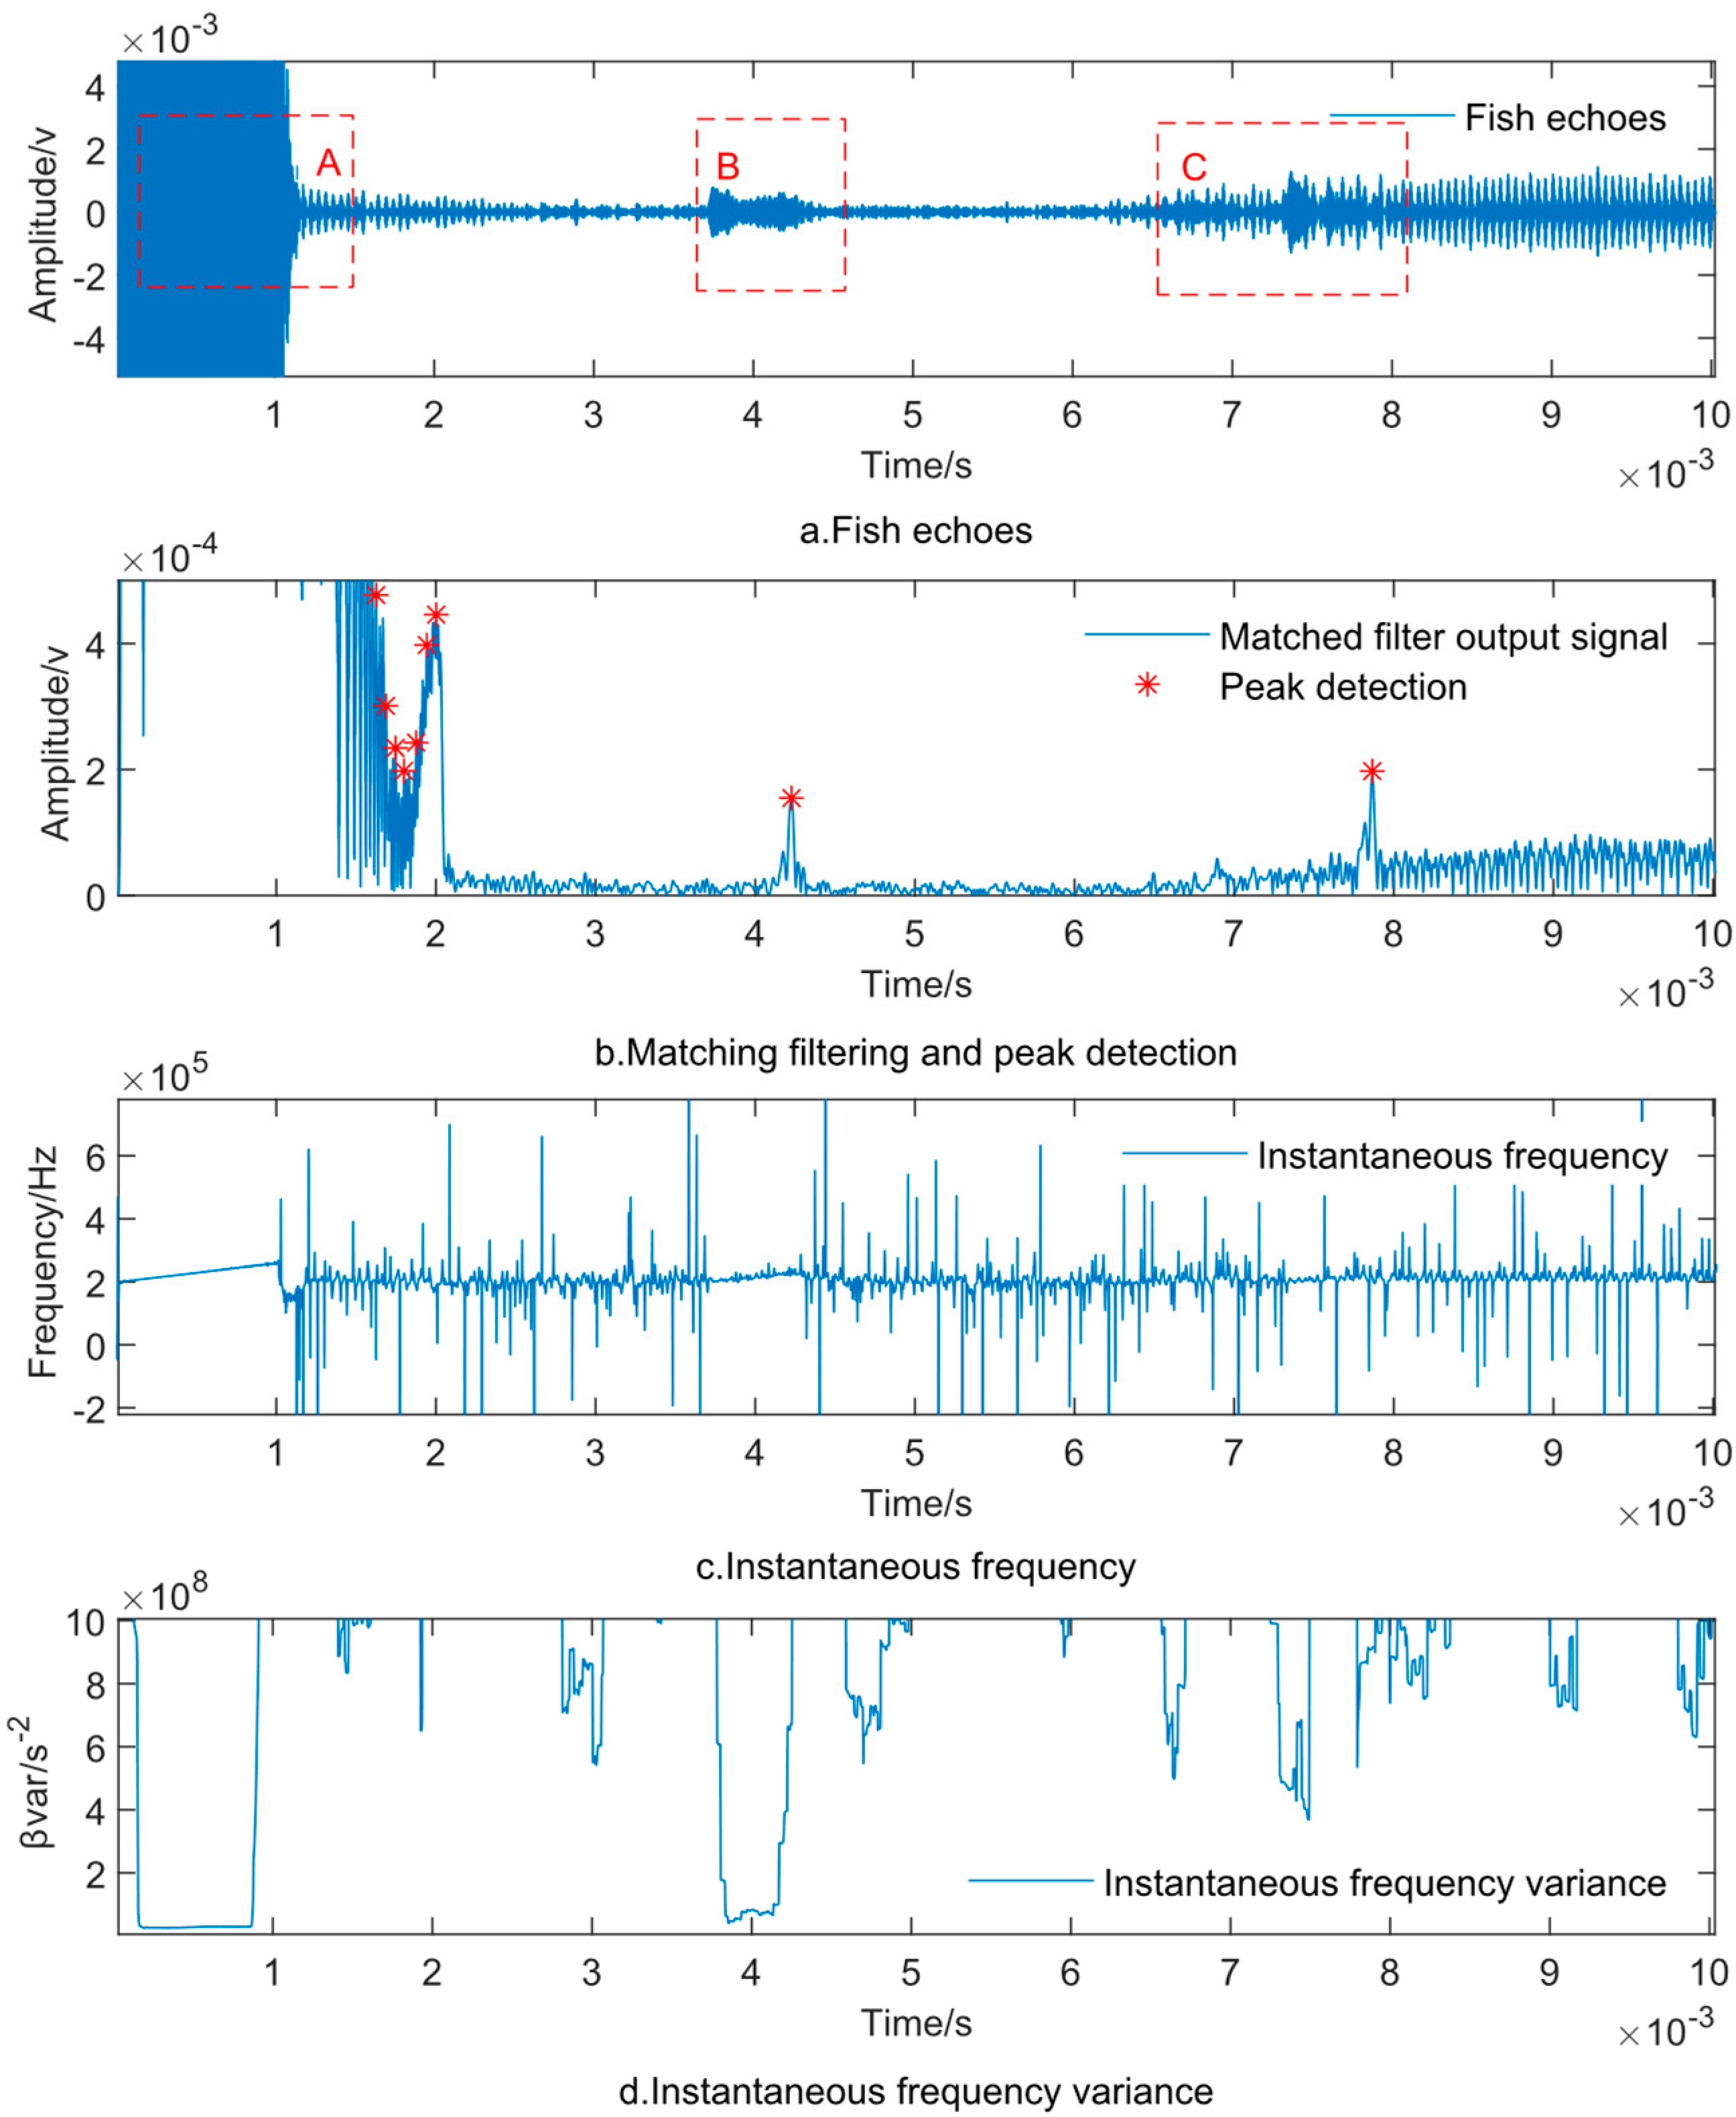
Figure 13a shows typical fish school target echoes collected in the water tank, including single-target echoes and overlapping echoes. Among them, the echoes in the time interval of 0–1 ms on the time axis are the crosstalk of the transmitted signal when the receiver receives the echoes (as indicated by the red dashed box A in
Figure 13a). By analyzing the underwater camera monitoring images at the same time and combining with the time delay difference between the peaks after matched filtering, it can be obtained that the time axis from 3.5 to 4.5 ms corresponds to the single-target echoes (as indicated by the red dashed box B in
Figure 13a), and the time axis from 6.5 to 8.5 ms corresponds to the overlapping echoes (as indicated by the red dashed box C in
Figure 13a). Using the same signal processing method as that for the simulated echoes, the fish school echoes are subjected to matched filtering processing, and the output signals are subjected to peak detection, as shown in
Figure 13b. It can be seen that there are situations where the peak detection of some target echoes fails in the matched filtering output signals of the fish school echoes. At this time, the overlapping echoes may be misjudged as the echoes of a single fish. In addition, the instantaneous frequency estimation can be carried out for the collected fish school echo signals, and the results are shown in
Figure 13c. The instantaneous frequency of the signal corresponding to the single fish echo moment is almost a slanted straight line, which is consistent with the simulation results. The pulse duration is close to the pulse width of the transmitted signal, approximately 1 ms. The results of obtaining the instantaneous frequency variance through a sliding window are shown in
Figure 13d. The characteristics of the instantaneous frequency variance of the single fish echo signal are significantly different from those of the overlapping echoes and the noise. By setting a reasonable instantaneous frequency variance threshold, single-target echoes and overlapping echoes can be further distinguished.
3.4. Analysis of the Recognition Performance of Simulated Fish School Echoes
The experiment took 3000 frames of simulated fish school echoes randomly generated under different spatial distribution states and signal-to-noise conditions, respectively, as the samples to be tested, and carried out a comparative study on the recognition performance of the APM based on the echo envelope of broadband signals, the PDM based on broadband echoes, and the PDIM.
3.4.1. Recognition Accuracy Rate of Single Fish Echoes
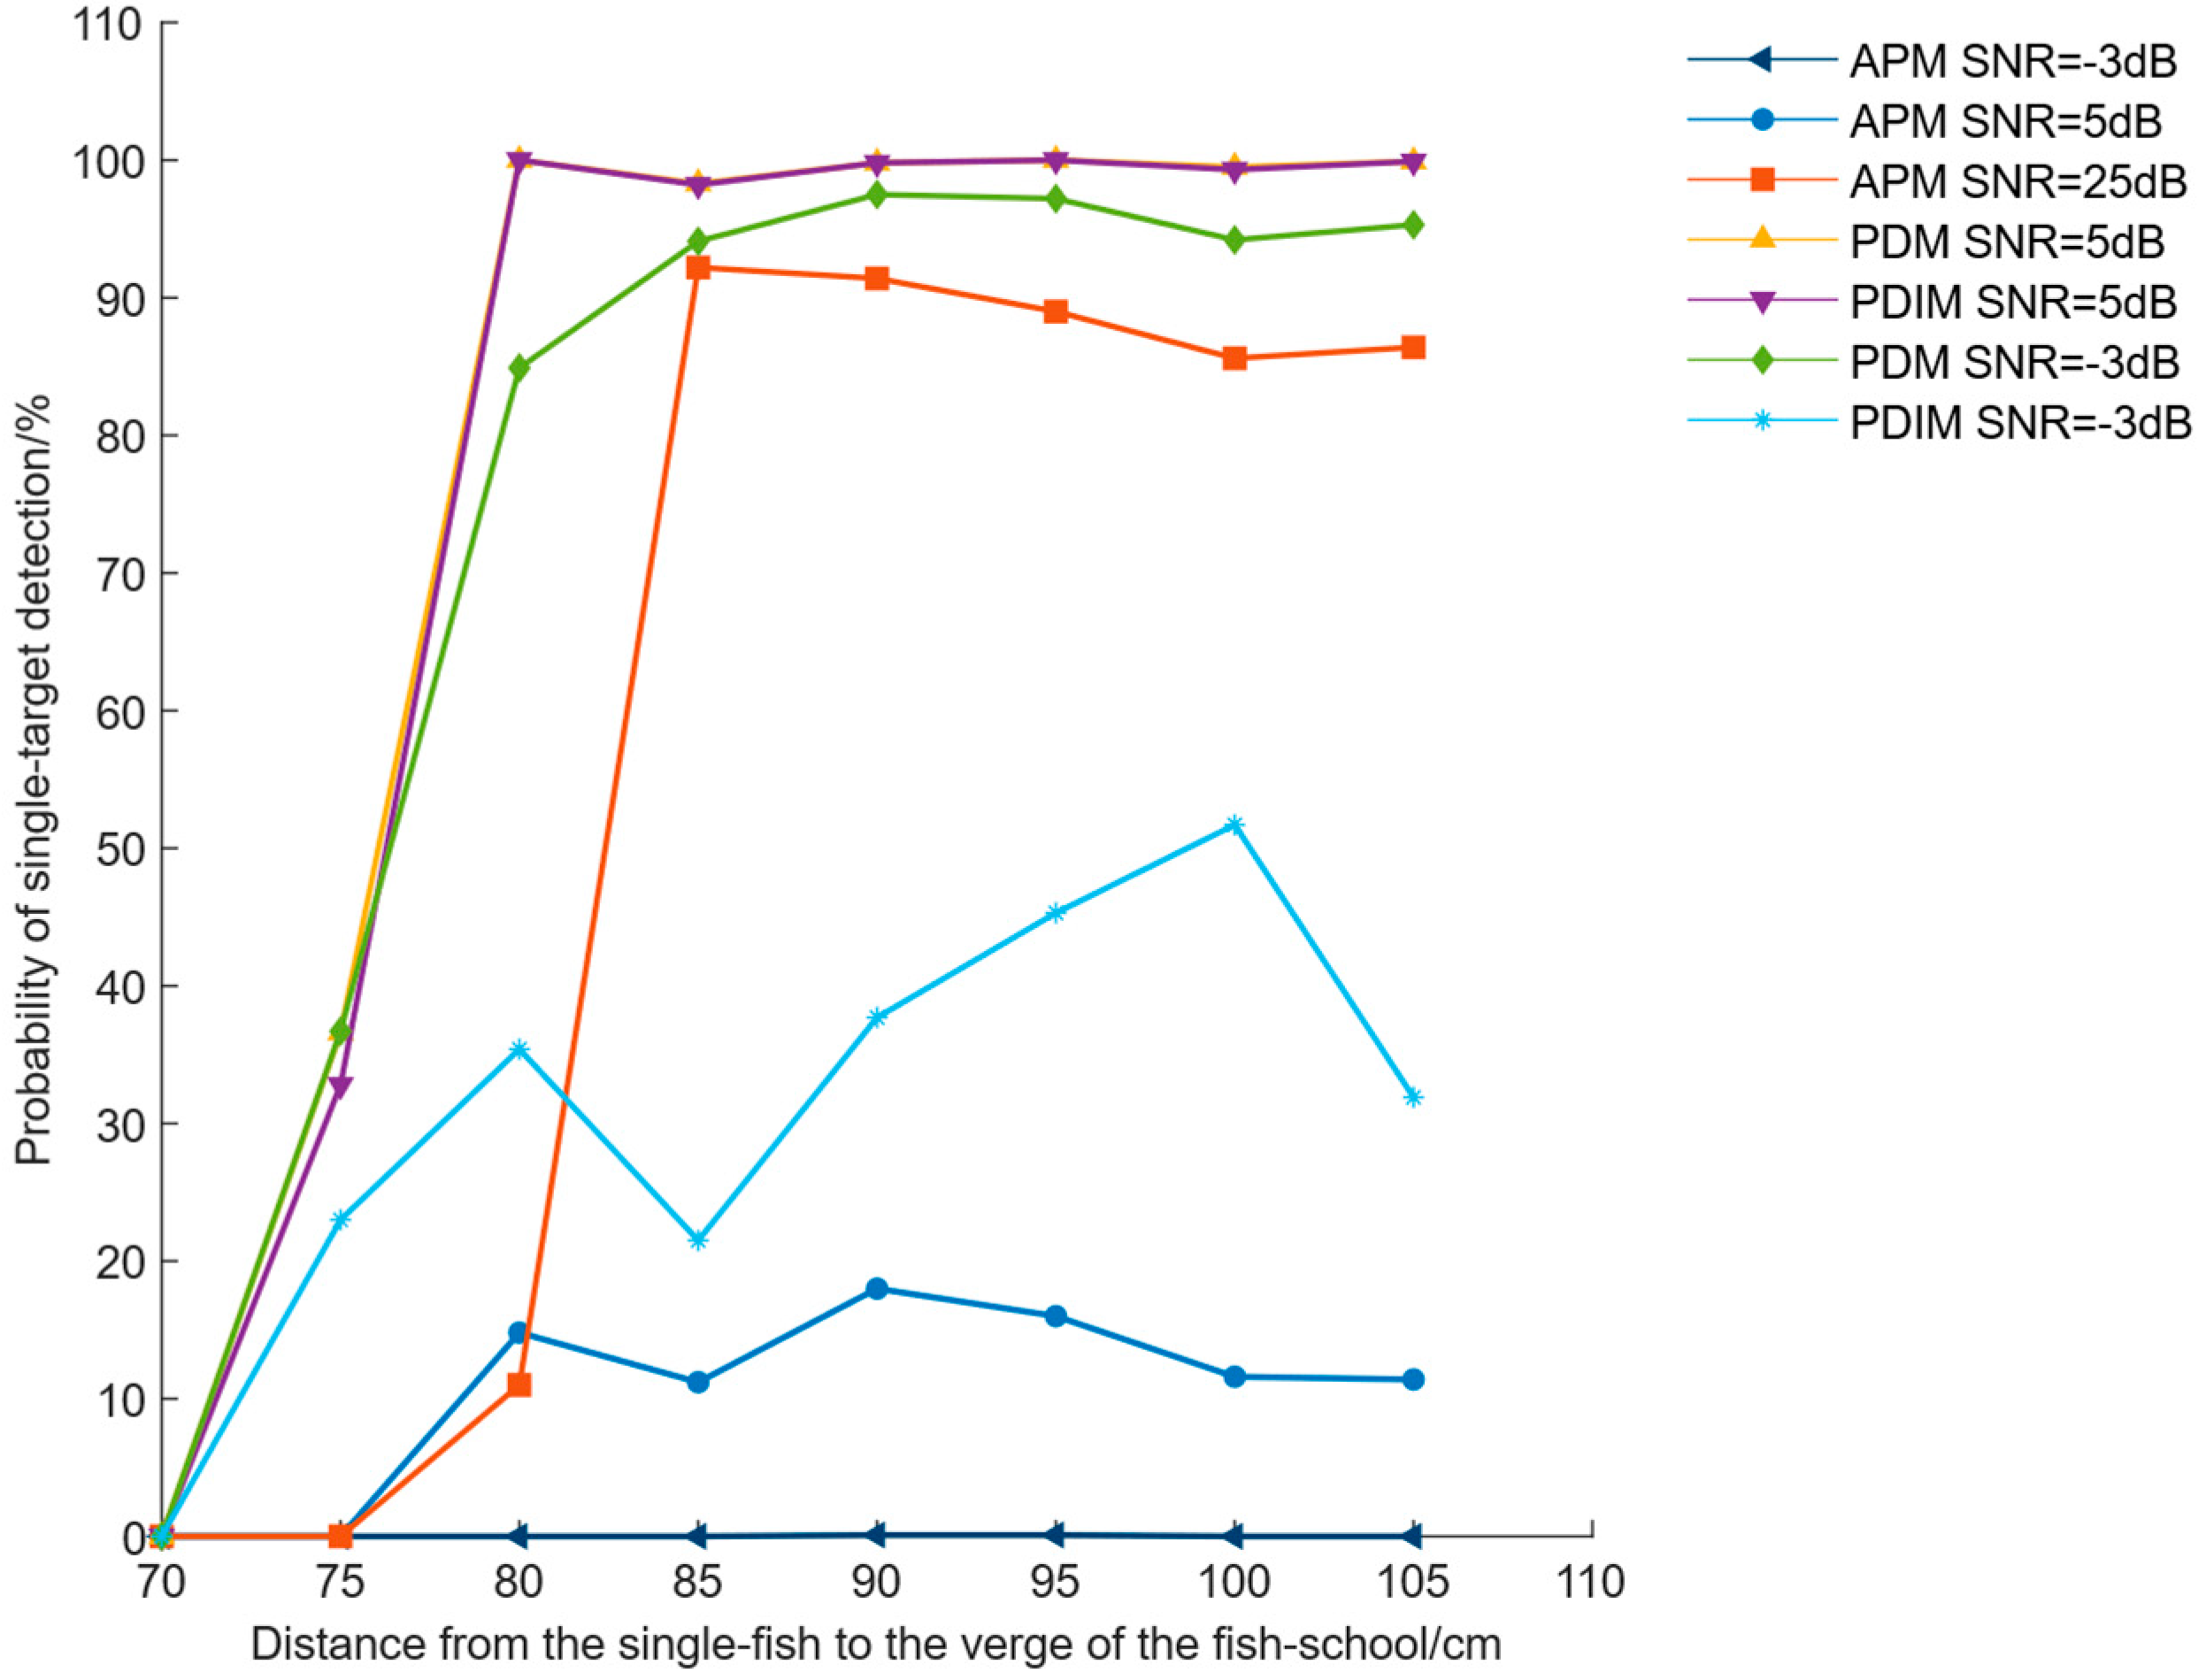
Figure 14 shows the recognition accuracy rates of single-target echoes under different signal-to-noise ratios (SNRs) and the spacing conditions from the free single fish to the outer edge of the fish school. The spacing from the free single fish to the outer edge of the fish school is defined as the product of the time delay difference between the single fish echo (generated by a single fish) and the overlapping echo (generated by fish with similar distances or a clustered fish school) in the time domain and the sound speed. Under the condition that the pulse width of the test signal is determined, the spacing from the free single fish to the outer edge of the fish school reflects whether the single fish echo overlaps with the echoes of other fish. When the spacing from the free single fish to the outer edge of the fish school exceeds the minimum separable spacing, this echo is considered not to be aliased by the echoes of other fish and is an ideal, perfect echo, which can be used for subsequent application research based on single fish echoes. The accuracy rate reflects the ability of the recognition method to accurately detect single fish echoes from the fish school echoes where separable single fish echoes exist. The simulation results show that as the spacing between the free single target and the group target increases, the detection accuracy rate of single fish echoes gradually increases. When the SNR is 5 dB or above and the spacing between the single target and the group target is greater than 80 cm, a good recognition effect can be obtained, and the recognition accuracy rate exceeds 90%. The PDIM shows consistent performance with the single-echo detection method based on peak detection and time-delay estimation. However, under the same condition of SNR = 5 dB, the recognition accuracy rate of the APM is only 15%. When the SNR is increased to 25 dB and the spacing between the single target and the group target reaches 85 cm, a detection performance similar to that of the other two detection methods can be obtained.
Below 0 dB, under the condition of SNR = −3 dB, the recognition accuracy rate of the APM is almost 0. Compared with the single-echo recognition accuracy rate of the PDM, that of the PDIM drops to a certain extent. When the spacing is 80 cm, the single-echo recognition accuracy rate under the condition of −3 dB decreases from 80% to 35%. As the target spacing increases, the recognition accuracy rate improves.
3.4.2. The Probability of Misjudging Overlapping Echoes as Echoes of a Single Fish
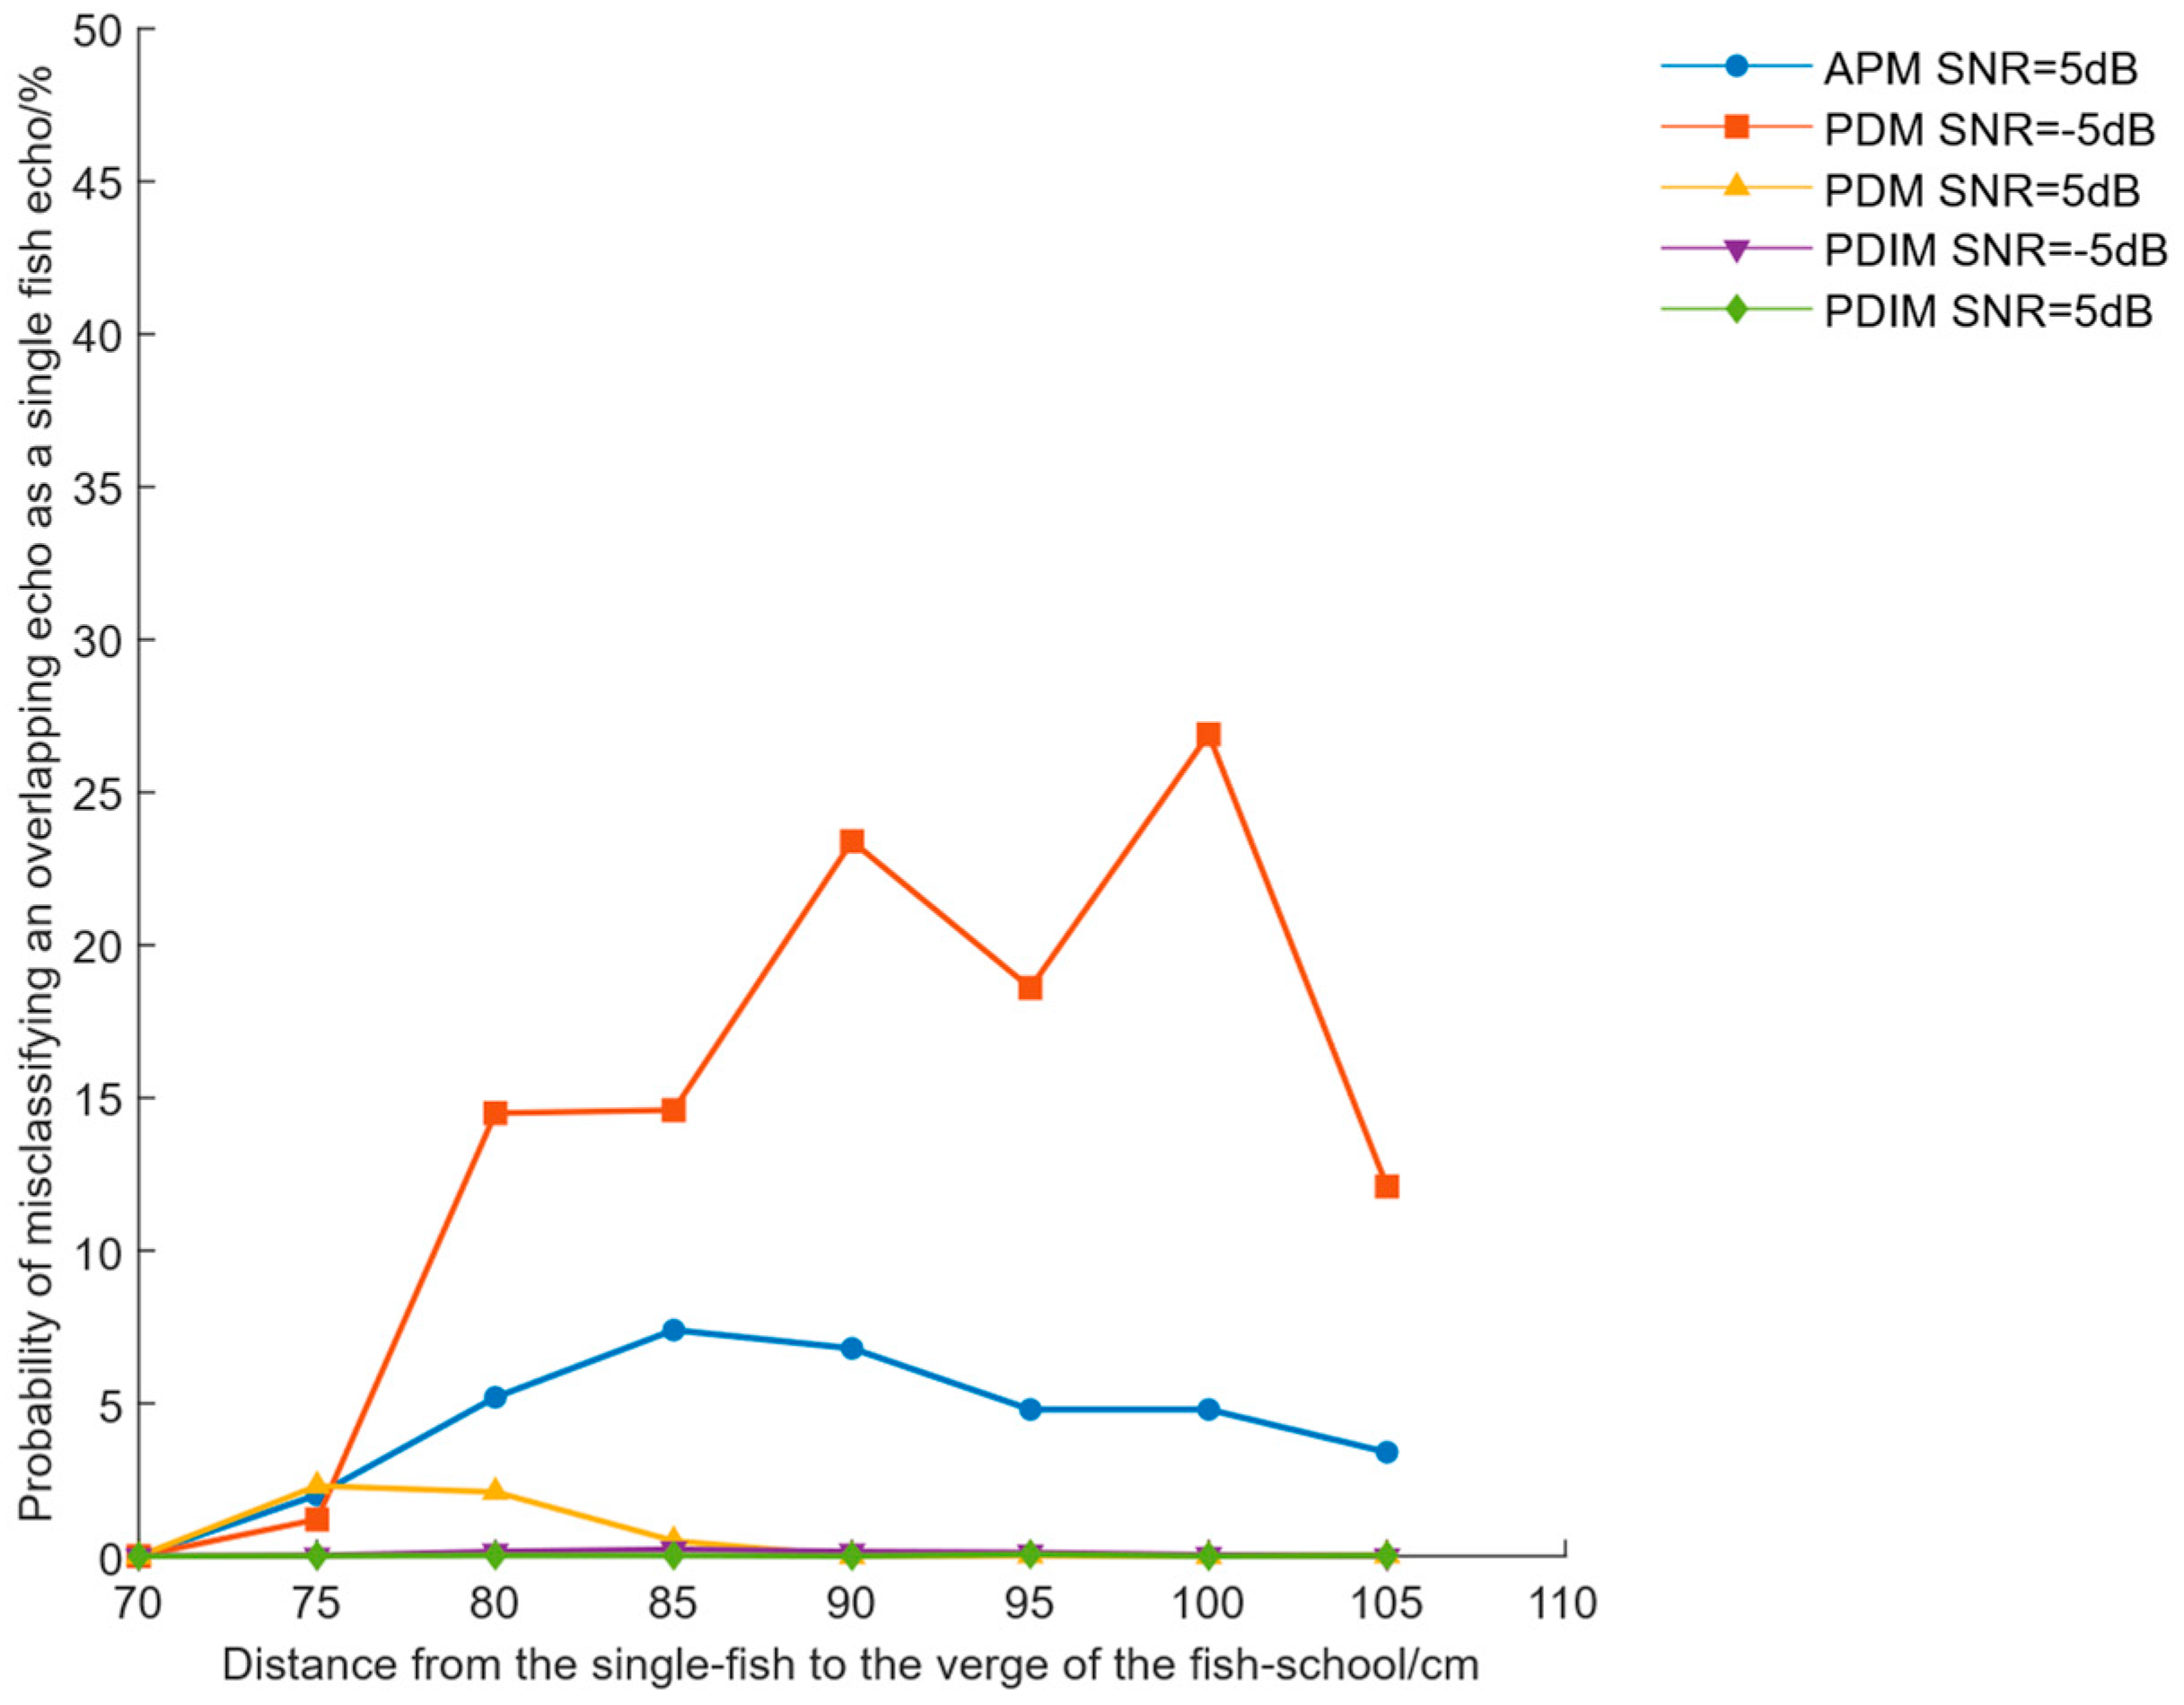
Figure 15 shows the probability of misidentifying overlapping echoes as single-target echoes under different signal-to-noise ratios (SNRs) and the spacing conditions from the free single fish to the outer edge of the fish school. The simulation results show that as the spacing from the free single fish to the outer edge of the fish school increases, the misidentification rates of overlapping echoes for the three methods all show a trend of first increasing and then decreasing. When the SNR = 5 dB, the misidentification rate of the APM is the highest, followed by the PDM, and the misidentification rate of overlapping echoes for the PDIM is below 1%.
When the signal-to-noise conditions are poor, as shown in
Figure 14, the APM cannot be used when the SNR = −3 dB. Therefore, only the PDM and the PDIM are compared. It can be seen that when affected by noise, the PDM has a relatively high probability of misidentification, which may lead to the misidentification of overlapping echoes as single fish echoes and further affect the application research based on single fish echoes. The PDIM, on the other hand, shows good rejection ability for overlapping echoes and can improve the detection accuracy of single fish echoes.
3.5. Recognition Performance of Live Fish Echoes
A total of 1845 frames of fish school echoes in different states were collected in the experiment. Since the fish school swims freely in the space of the net cage, the moment when a single fish breaks away from the fish school is random. Therefore, the underwater camera and the echo acquisition system were turned on for synchronous acquisition, and the echo data samples were screened in combination with the video data of the underwater camera. Through the monitoring of the underwater camera, when the spacing between the single fish target in the direction of the acoustic axis of the transducer and the outer edge of the fish school exceeds 75 cm, it is confirmed that the echo of a single fish exists, and the corresponding acquired echo data at that moment is extracted as a sample. After screening, a total of 128 frames of effective echoes with the presence of single fish were obtained. For the echo samples with the presence of single fish, single fish echo recognition experiments were carried out, respectively, using the APM, PDM, and PDIM.
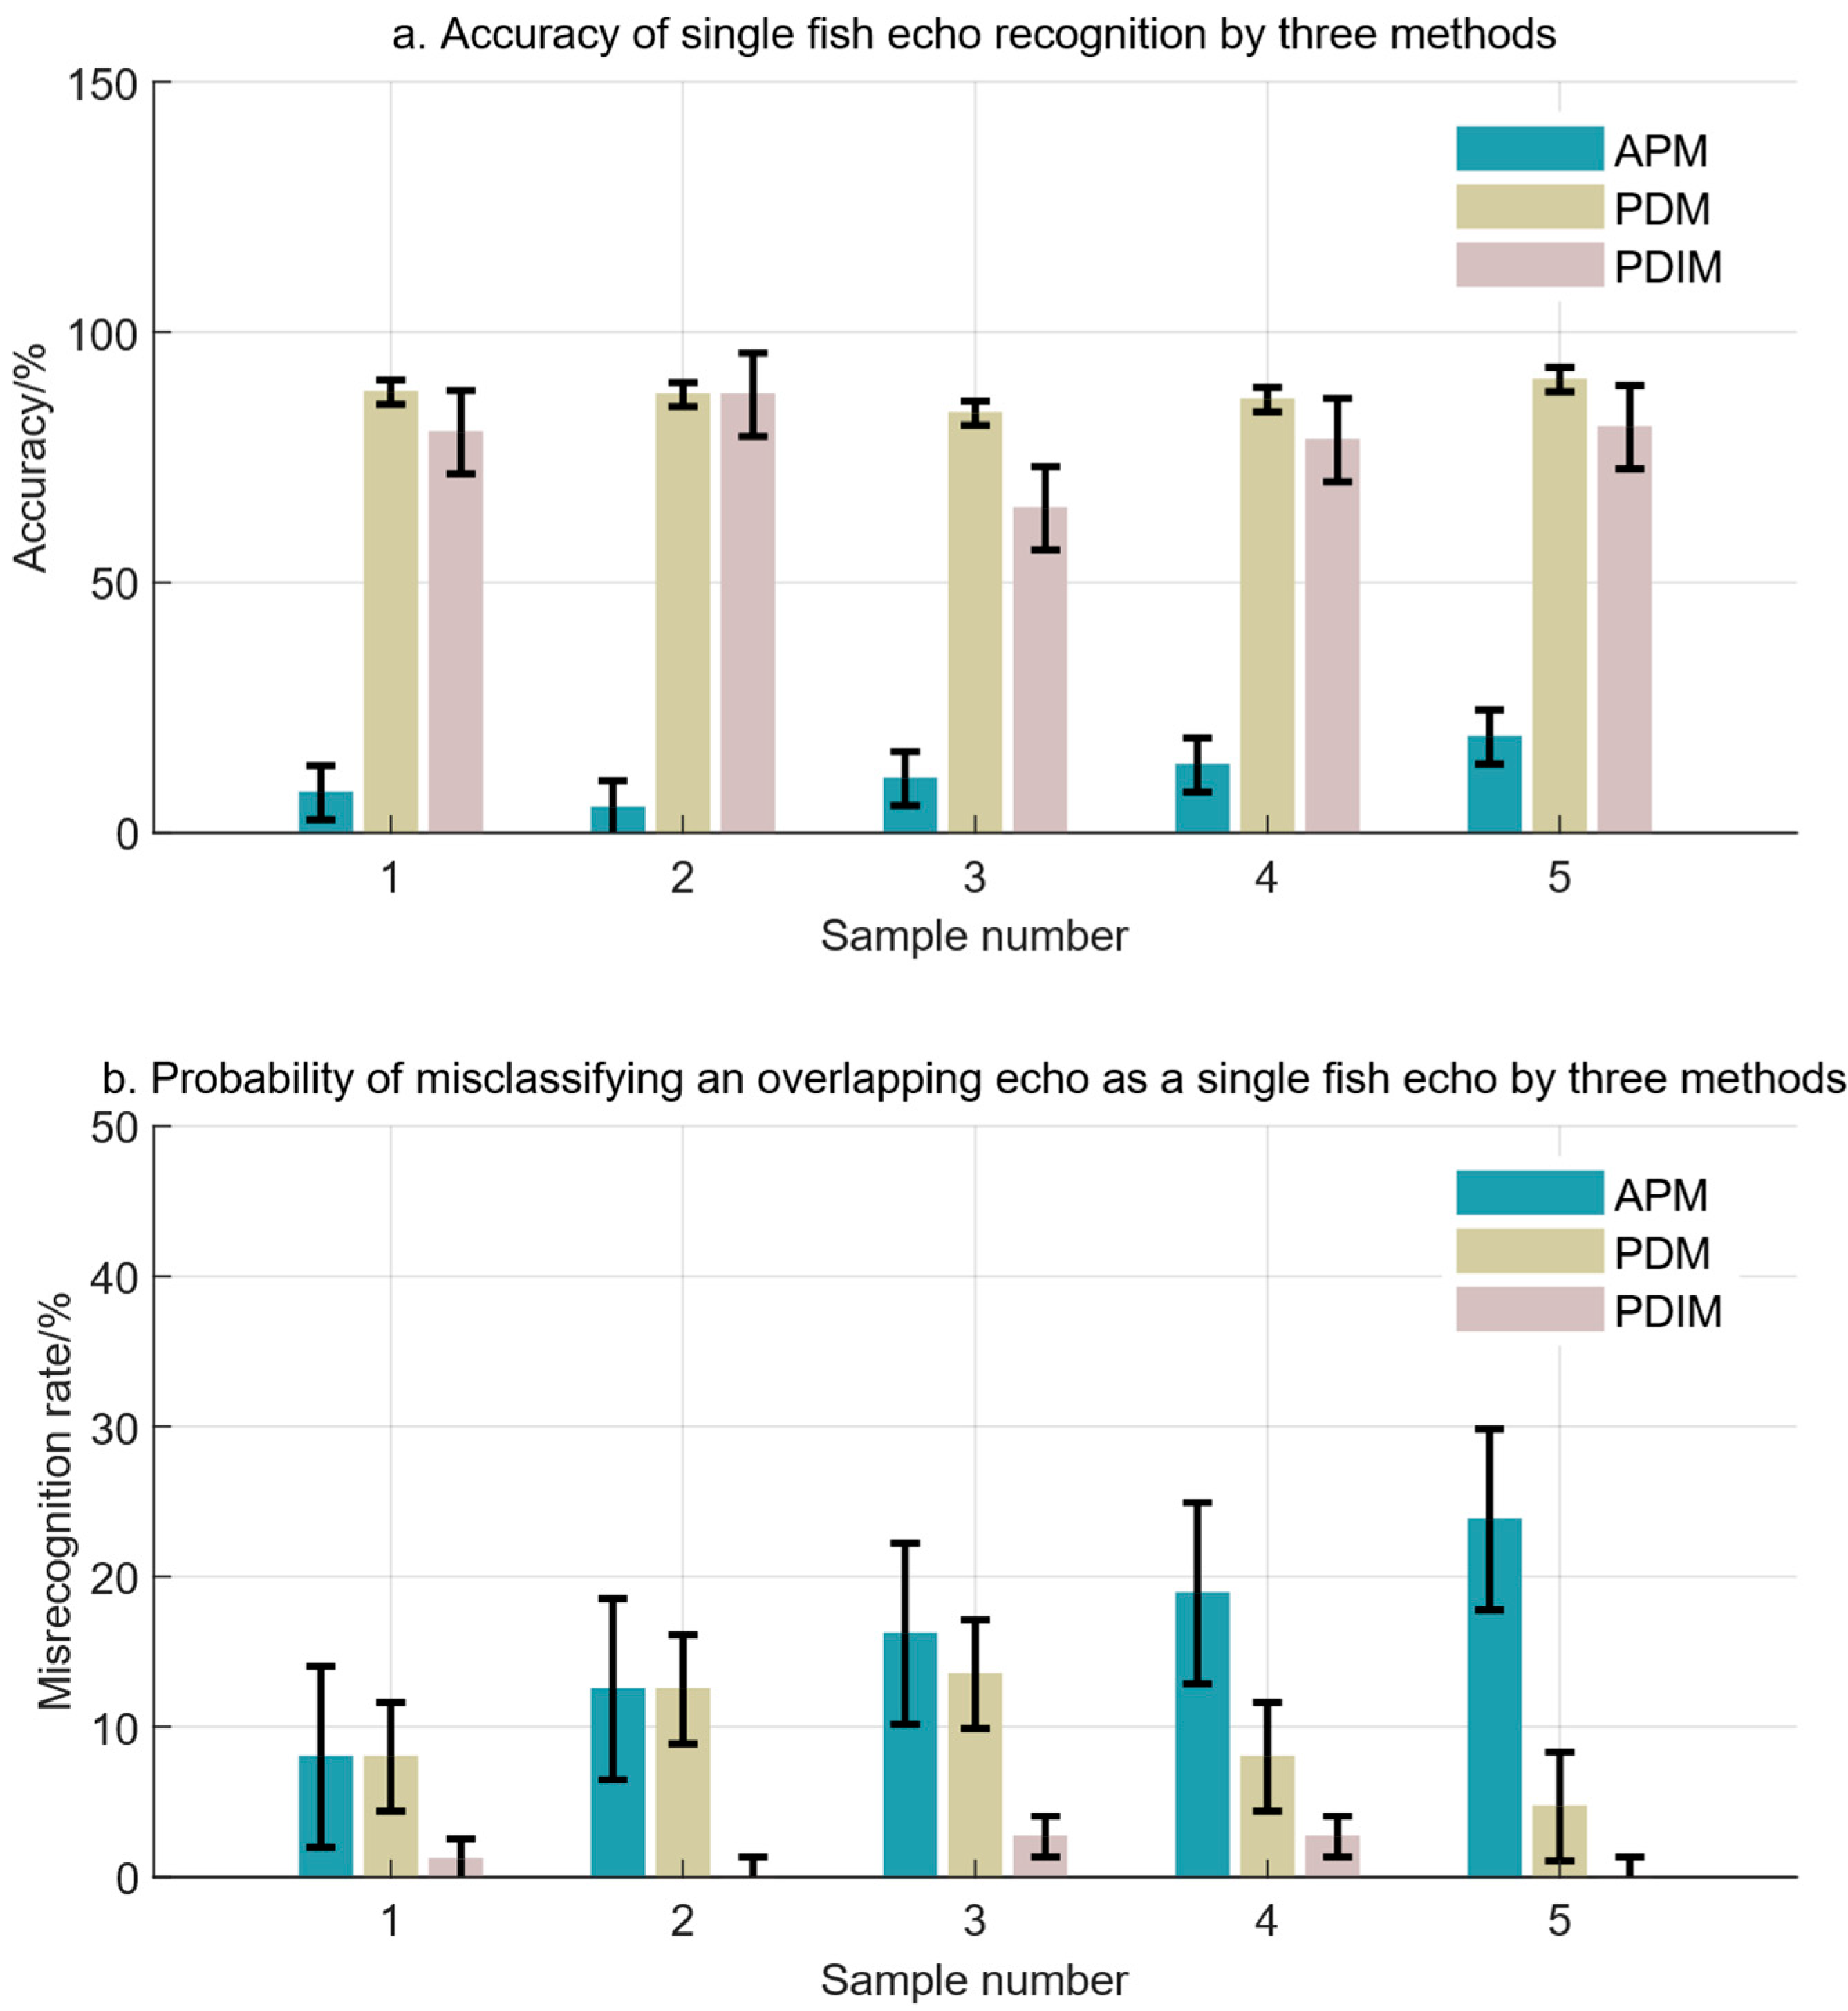
Figure 16a shows the individual fish echo recognition accuracy of the APM, PDM, and PDIM within different collection groups. Accuracy reflects the ability of the recognition method to accurately detect individual fish echoes from school echoes. By comparing the individual fish echo recognition accuracies of the three methods under swimming fish schools, it can be observed that the recognition accuracy of the APM is the lowest, with an average recognition accuracy of 11.28% (SD = 5.40%, 95% CI: 6.55–16.01%); the recognition accuracy of the PDM is the highest, with an average recognition accuracy of 87.26% (SD = 2.43%, 95% CI: 85.13–89.39%); the individual fish echo recognition accuracy based on the PDIM is slightly lower, with an average recognition accuracy of 78.34% (SD = 8.32%, 95% CI: 71.04–85.64%).
Figure 16b shows the individual fish echo misrecognition rate of the three methods within different collection groups. The misrecognition rate refers to the probability that the three methods incorrectly identify overlapping echoes or noise as individual fish echoes. By comparing the misrecognition rates, it can be seen that the misrecognition rate of the APM is the highest, with an average misrecognition rate of 15.88% under swimming fish schools in the laboratory (SD = 5.40%, 95% CI: 10.59–21.17%); the misrecognition rate of the PDM for individual fish echo recognition is the second highest, with an average misrecognition rate of 9.34% (SD = 3.62%, 95% CI: 6.17–12.51%), and there are still cases where overlapping echoes are incorrectly identified as individual fish; the individual fish echo misrecognition rate of the PDIM is the lowest, with an average misrecognition rate of 1.32% under swimming fish schools in the laboratory (SD = 1.35%, 95% CI: 0.14–2.50%). The experimental results show that the APM is insensitive to individual fish echoes and exhibits low recognition accuracy. Since this method does not perform matched filtering, it directly uses the root mean square (RMS) to extract the envelope characteristics of echo signals. Analysis of experimental echoes reveals that the failure of echo endpoint detection causes a large amount of noise interference to be misidentified as individual fish echoes, and this phenomenon is more prominent under low signal-to-noise ratio conditions.
Using broadband signal detection and the PDM can achieve better recognition accuracy for individual fish echoes; however, there is still a certain probability of misidentifying overlapping echoes as individual fish echoes. This is because during the peak detection process, targets with smaller target strengths are missed, which in turn leads to deviations in delay estimation and may increase the erroneous estimation of the echo intensity of target fish.
In contrast, the PDIM exhibits slightly lower recognition accuracy for individual echoes than the PDM. Analysis of individual fish echoes shows that to reduce the misidentification of overlapping fish echoes as individual fish echoes, the presence of an instantaneous frequency variance threshold rejects some individual target echoes affected by noise interference, resulting in a decrease in recognition accuracy.
The PDIM exhibits excellent ability to reject overlapping echoes, with a significantly lower probability of misidentifying individual fish echoes compared to the other two methods. The results of live fish tank experiments show a consistent trend with those obtained from simulations. While the new method sacrifices some recognition accuracy, it achieves good overlapping echo rejection capability, which may help improve the accuracy of target strength estimation for long-term monitoring of farmed fish.
4. Discussion
Based on the broadband acoustic echoes of individual fish, this study proposes a broadband echo recognition method for individual fish based on time- and frequency-domain features. It conducts experimental studies on the APM based on envelope features of individual fish broadband echoes, the PDM based on matched filtering of echo signals, and PDIM, and analyzes the recognition performance of these three methods. It should be noted that this study focuses on the signal-to-noise ratio, as well as the efficiency and accuracy of the algorithm recognition under the condition that individual fish echoes objectively exist, while simplifying the influence of factors such as fish orientation and the angle of fish within the beam. In a fully realistic aquaculture environment, the swimming behavior of fish schools is complex and variable [
36]. In addition to the factor of fish size, there is a probability that, due to fish orientation or angle, the echoes of two fish located at different positions within the beam may overlap, their waveforms may change, or their target strengths may alter significantly [
20,
23]. In this study, by screening echo samples and limiting the research scope, the influence of fish orientation was reduced in the experiment. In practical applications, errors may be introduced when performing target strength threshold detection on echoes, which in turn increases the probability of misrecognition. Although further screening using an instantaneous frequency variance threshold can reduce the probability of misrecognition, the lack of angular information for discrimination remains one of the limitations of the current method. Changes in fish orientation may affect the instantaneous frequency and echo shape, thereby triggering the rejection threshold, which may lead to the false rejection of real individual fish echoes, exhibiting a more stringent filtering tendency. In subsequent research, the applicability of the current method will be further improved by incorporating or testing angular response filtering and expanding the experimental paradigm to include fish orientation metadata.
Noise and fish school density are also critical factors influencing the recognition accuracy of individual fish echoes. In typical aquaculture scenarios such as deep-sea and offshore aquaculture, noise constitutes a non-negligible environmental factor [
37,
38]. Under identical signal-to-noise ratio conditions, the recognition accuracy of individual fish echoes achieved by the PDM (based on matched filtering of echo signals) and the PDIM is significantly superior to that of the APM (
Figure 14). The results of live fish tank experiments are consistent with those derived from simulations. This is attributed to the fact that matched filtering of echo signals enhances the instantaneous signal-to-noise ratio at the peak, thereby enabling the acquisition of favorable target signal characteristics even in scenarios with poor signal-to-noise conditions. Broadband recognition methods based on matched filtering thus exhibit superior recognition performance under low signal-to-noise ratio conditions. In the experiment, the distance between a stray individual fish and the edge of the fish school objectively reflects the density of the school: the higher the fish school density, the closer this distance, and the lower the probability of detecting valid samples. In simulation experiments conducted by Ito et al., the probability of separating individual fish echoes decreases gradually with increasing fish school density [
23], which aligns with the trend of individual fish detection probability observed in this study. For instance, in aquaculture scenarios where fish school density is higher than in natural waters, the probability of stray individual fish appearing is relatively low. This implies that individual target recognition algorithms should identify as many targets as possible within the limited set of detectable samples.
The acoustic characteristics of farmed fish themselves are also one of the key factors influencing individual fish recognition methods. There is a wide variety of farmed fish species, with structural differences among different species, such as variations in body shape, body structure, swim bladder morphology, and the number of swim bladder chambers [
35]. These differences endow distinct fish species with unique acoustic scattering properties and also determine the limitations of a single target strength threshold. In this study, by measuring the acoustic scattering properties of crucian carp, constructing its target strength model, and deriving the target strength threshold, an attempt was made to establish a technical pathway encompassing modeling, threshold determination, and individual recognition based on the threshold specific to the target species. In the future, a more comprehensive broadband recognition method for individual fish could be developed by expanding the range of experimental fish species or by introducing a database of existing fish acoustic scattering models. Additionally, in real aquaculture scenarios, complex acoustic field environments—along with interface reverberation caused by bait, sediment, and shallow water settings such as ponds [
12]—introduce numerous uncertain factors into individual fish recognition. This necessitates further research to enhance the universality of the method.
In terms of algorithm complexity and real-time performance, the instantaneous frequency method has certain application potential. For applications in farmed fish monitoring, low cost, ease of miniaturized deployment, and real-time monitoring capability are the general expectations of the fisheries industry for acoustic monitoring methods [
12]. Compared with high-resolution time–frequency analysis methods such as WVD, the Hilbert transform features concise calculation steps, low computational cost, and good real-time performance [
39], making it more favorable for fishery applications requiring rapid response. The technical route of jointly using band-pass filtering and Hilbert transform to obtain the instantaneous frequency characteristics of farmed fish has low algorithm complexity and can be implemented via FIR filters, which creates conditions for convenient deployment on small-scale platforms such as farmed fish monitoring sonar systems based on DSP or FPGA.


