Article

An Assessment of the Population Structure and Stock Dynamics of Megalobrama skolkovii During the Early Phase of the Fishing Ban in the Poyang Lake Basin

1
Key Laboratory of Exploration and Utilization of Aquatic Genetic Resources, Shanghai Ocean University, Shanghai 201306, China
2
National Demonstration Center for Experimental Fisheries Science Education, Shanghai Ocean University, Shanghai 201306, China
3
Jiujiang Academy of Agricultural Sciences, Jiujiang 332000, China
*
Authors to whom correspondence should be addressed.
These authors contributed equally to this work.
Fishes 2025, 10(8), 378; https://doi.org/10.3390/fishes10080378
Submission received: 2 June 2025 / Revised: 10 July 2025 / Accepted: 1 August 2025 / Published: 4 August 2025
(This article belongs to the Section Biology and Ecology)

Abstract

The ten-year fishing ban on the Yangtze River aims to restore aquatic biodiversity and rebuild fishery resources. Megalobrama skolkovii, a key species in the basin, was investigated using 2024 data to provide a preliminary assessment of its population structure, stock dynamics, and early recovery. Age analysis (n = 243) showed that 1–6-year-olds were dominated by fish aged 3 (35%), with few older than 4, indicating moderate structural truncation. Growth parameters modeled by the von Bertalanffy Growth Function yielded L = 61.89 cm and k = 0.25 year1, with a weight–growth inflection age of 4.4 years. Natural mortality (M = 0.48 year−1) was estimated using Pauly’s empirical formula, and total mortality (Z = 0.55 year−1) was estimated from the catch curve analysis. While fishing mortality (F) was statistically indistinguishable from zero, a plausible low-intensity fishing scenario was explored to assess potential impacts of residual activities. Length-based indicators (LBIs) showed Pmat = 46.05%, Popt = 9.51%, and Pmega = 6.88%, suggesting reproductive recovery but incomplete structural restoration. These preliminary findings reveal an asymmetrical recovery trajectory, whereby physiological improvements and enhanced recruitment have occurred, yet full structural restoration remains incomplete. This underscores the need for continued, long-term conservation and monitoring to support population resilience.
Key Contribution: This study provides the first integrated evaluation of the population structure and stock status of Megalobrama skolkovii, an ecologically important representative species in the Yangtze River Basin, during the early phase of the fishing ban. It reveals a two-phase recovery pattern—physiological improvement preceding structural restoration—and provides key biological reference points to support long-term monitoring and future adaptive management.

1. Introduction

The Yangtze River is the longest river in China and the third longest in the world, with a drainage area exceeding 1.8 million km2, covering approximately one-fifth of China’s territory and supporting one of the most diverse temperate freshwater ecosystems globally [1]. Historically, the basin has recorded over 400 freshwater fish species, more than half of which are endemic to China [2], underscoring its exceptional biodiversity and ecological value. As an integral part of the Yangtze River Basin, Poyang Lake is located in northern Jiangxi Province, China (115°49′–116°46′ E, 28°22′–29°45′ N), and is the largest freshwater lake in the country [3]. Situated on the southern bank of the middle–lower Yangtze River, it connects to the mainstem via a narrow outlet, forming a typical river–lake connected system and serving as a critical ecological hub within the Yangtze ecosystem [4]. With an area of 16,220 km2 encompassing interconnected water bodies and wetlands, the lake plays a crucial role in regulating the Yangtze River’s water levels, conserving hydrological resources, stabilizing the regional climate, and supporting ecological balance. Due to its important strategic position in ecology, agriculture, and economics, the lake is often referred to as the “Kidney of the Yangtze”, “Paradise for Migratory Birds”, and “Land of Fish and Rice”, underscoring both ecological and socioeconomic value [3]. As a global biodiversity hotspot region, the lake’s rich aquatic resources are considered essential for maintaining regional ecological security and supporting the sustainability of fisheries in the Yangtze River Basin [5].
Megalobrama skolkovii belongs to the order Cypriniformes and the family Cyprinidae. It is taxonomically regarded as a synonym of M. mantschuricus. This species is widely distributed across major river systems in China, including the Heilong River, Yellow River, and Yangtze River, as well as in southeastern coastal regions and the Russian Far East [6]. Given its broad distribution and large body size, M. skolkovii plays a vital role in aquatic communities and holds substantial ecological value. As a herbivorous freshwater species, it primarily feeds on aquatic macrophytes. It typically reaches sexual maturity at 2–3 years of age, with spawning occurring during May to July in lotic environments. Individuals can attain a maximum standard length of up to 60 cm and a body weight exceeding 3.5 kg, with a typical lifespan of approximately 10 years [7,8,9]. Through its feeding behavior, this species helps regulate submerged macrophyte communities, enhances nutrient cycling via excretion, and serves as a primary prey species for top predators such as the Yangtze finless porpoise. In a recent survey from 2022 to 2023, M. skolkovii was identified as the most dominant fish species in the Poyang Lake Basin, indicating that its population abundance and biomass occupy a central position in the regional fishery ecosystem [10].
Over the past several decades, the Yangtze River Basin has been subjected to multiple anthropogenic stressors, including the construction of hydraulic engineering projects, overfishing, water pollution, and habitat fragmentation, leading to a marked decline in aquatic biological resources. Iconic species such as the Chinese paddlefish (Psephurus gladius) have been officially declared extinct [11], while the Yangtze River dolphin (Lipotes vexillifer) is considered functionally extinct, with no confirmed sightings since 2002 [12]. In response to the severe degradation of fishery resources and aquatic biodiversity, the Chinese government implemented a comprehensive ten-year fishing ban across the Yangtze River Basin, effective from 1 January 2020 to 1 January 2030 [13]. This policy is regarded as a forward-looking ecological restoration initiative aimed at halting further resource decline, protecting key life-history stages, and providing sufficient time for the natural recovery of fish populations and aquatic ecosystems [14,15]. Despite the lack of systematic baseline data and long-term monitoring in certain regions, the fishing moratorium reflects a precautionary and restorative governance strategy grounded in ecosystem-based management principles.
As a representative species in the lake, the conservation and recovery status of M. skolkovii is critical to the stability of the regional fishery ecosystem. However, in the Yangtze River Basin—particularly in the Poyang Lake region—studies on the population biology and stock dynamics of M. skolkovii remain notably limited. In particular, systematic assessments of its recovery status during the early stage of the fishing ban are still lacking. Addressing this research gap is essential not only for revealing the ecological responses of M. skolkovii to the fishing moratorium but also for providing a scientific basis and empirical support for future fisheries management strategies. Although positive ecological responses have been reported in some fishing ban regions, including signs of stock rebuilding [16] and improvements in fish community structure [17], in-depth analyses of the population recovery and stock dynamics of this key species remain insufficient. This limitation is largely due to the lack of long-term, species-specific historical catch and mortality data for M. skolkovii, as past fisheries statistics often aggregated such species under broad categories like “miscellaneous fishes” or “breams” [5].
Based on samples of M. skolkovii collected in 2024 in the Poyang Lake Basin, this study, for the first time, establishes a preliminary growth parameter matrix and stock dynamics model to assess the initial ecological responses of this species in the early stage of the ten-year fishing ban. By addressing critical gaps in the ecological understanding of M. skolkovii, the research contributes to filling important knowledge voids regarding post-ban recovery processes. These results contribute critical baseline data for future long-term monitoring efforts and provide empirical insights into the ecological outcomes of the Yangtze River fishing ban. They may also inform conservation and sustainable management strategies in similar freshwater ecosystems worldwide.

2. Materials and Methods

2.1. Sampling Design and Methodology

In the spring (April–May), summer (June–July), and autumn (September–November) of 2024, a total of 14 sampling sites were established along the Jiangxi section of the Yangtze River mainstem, northern Poyang Lake, the Boyang River, and the Xiu River (Figure 1). Due to the annual renewal process of fishing permits, no sampling was conducted during the winter months of January and February when permit renewal was in progress. Each site was sampled continuously for five consecutive days in each month. At each site, one set of floating gillnets and one set of sinking gillnets were deployed, while in riverine or flowing-water environments, two sets of sinking gillnets were placed nearshore (within 10–15 m of the bank). Gillnets had mesh sizes of 2.0 cm, 6.0 cm, 10.0 cm, and 14.0 cm; each net was 50 m in length and 2 m in height, resulting in a total length of 200 m. Nets were set at 18:00 each evening and then retrieved at 06:00 the following morning.
Each M. skolkovii specimen was assigned a unique identifier and measured for standard length (to the nearest 0.1 cm) and body weight (to the nearest 0.1 g). Age was estimated using the method described by Beamish and McFarlane [18], applying a three-tier classification: scales with a closed marginal annulus were designated as n; those with an additional outer growth zone were labeled as n+; and juvenile specimens with no closed annuli but visible growth rings were denoted as 0+. Age classification followed a stepwise mathematical interval model, where age was defined as the ceiling value of the annulus count, using a left-closed, right-open convention: [n+, (n + 1)) → age (n + 1).

2.2. Data Analysis

2.2.1. Length–Weight Relationship Estimation

The length–weight relationship of M. skolkovii was described using a power function, as proposed by Froese [19]:
W = a L b
where W (g) denotes body weight, L (cm) is standard length, a is the condition factor, and b is the allometric growth exponent. A one-sample t-test was used to assess whether the estimated b value significantly differed from the theoretical value of 3.00, thereby evaluating whether the growth of M. skolkovii conforms to an isometric pattern.

2.2.2. Growth Model

The growth of M. skolkovii was characterized using the von Bertalanffy Growth Function (VBGF), which models growth patterns across developmental stages. Parameter fitting was conducted using the nonlinear least squares (nls) function in the base stats package in R 4.3.3 [20]:
L t = L [ 1 e k ( t t 0 ) ]
where t is the age (years), Lt is the standard length at age t (cm), L is the asymptotic length (cm), t0 is the hypothetical age when length is zero (usually a negative value, indicating nonzero initial length at hatching), and k (year−1) is the growth coefficient indicating how rapidly the fish approaches L. Based on the magnitude of k, growth rate categories are defined as follows: k > 0.2 indicates fast growth, 0.1 < k < 0.2 indicates moderate growth, and 0.05 < k < 0.1 indicates slow growth [21].
By substituting the length–weight equation W = aLb into the VBGF, the body weight growth function is derived as
W t = W [ 1 e k ( t t 0 ) ] b
where Wt is the body weight at age t (g), W is the asymptotic body weight (g), and b is the allometric exponent from the length–weight relationship.
The growth performance index (φ′) is a dimensionless indicator used to compare growth performance across species or populations [22]:
φ = lg k + 2 lg L
Standard length and body weight growth rate equations:
d L / d t = L k e k ( t t 0 )
d W / d t = b W k e k ( t t 0 ) [ 1 e k ( t t 0 ) ] b 1
Growth acceleration equations:
d 2 L / d t 2 = L k 2 e k ( t t 0 )
d 2 W / d t 2 = b W k 2 e k ( t t 0 ) [ 1 e k ( t t 0 ) ] b 2 [ b e k ( t t 0 ) 1 ]
Inflection age ti (year):
t i = ln b / k + t 0

2.2.3. Mortality Coefficients and Exploitation Rate

Length class intervals were determined by averaging the results obtained from the Snedecor and Sturges methods [23,24]:
I ( Snedecor ) = Range / ( Range / SD × 4 )
I ( Sturges ) = Range / ( 1 + 3.322 × lg N )
where I is the class interval width, Range is the difference between the maximum and minimum lengths, SD is the standard deviation of length, and N is the total number of individuals.
Mortality parameters include total mortality (Z), natural mortality (M), and fishing mortality (F), which are related by the following equation: Z = M + F. Due to the lack of species-specific catch or fishing mortality data for M. skolkovii prior to the fishing ban, the model does not incorporate pre-ban F estimates. All parameters and assessments are based on empirical data collected in 2024. Consequently, total mortality (Z) was estimated using the length-converted catch curve module in FiSAT II [25]. To minimize estimation bias, individuals not yet fully recruited to the stock and those approaching the asymptotic length (L) were excluded. This exclusion helped avoid potential bias caused by incomplete recruitment in juveniles and growth retardation in older fish. The remaining data were transformed into relative age using the VBGF, and a linear regression of the natural logarithm of catch per unit time [ln(N/dt)] against relative age was conducted. The slope of the regression line corresponds to the value of Z. Natural mortality (M) was estimated using the empirical formula proposed by Pauly [26]:
lg M = 0.0066 0.279 lg L + 0.6543 lg k + 0.4634 lg T
where T is the mean annual water temperature of Poyang Lake, assumed to be 18 °C [27,28,29,30,31].
The fishing mortality (F) and exploitation rate (E) were calculated as follows [32]:
F = Z M
E = F / Z
The length at optimal yield (Lopt) was estimated based on Beverton’s formula [33]:
L o p t = L [ 3 / ( 3 + M / k ) ]

2.2.4. Length-Based Indicators (LBIs)

Three length-based indicators of fishery sustainability—Pmat, Popt, and Pmega—were estimated following the method of Froese [34].
P m a t = L m a t L max P L
P o p t = 0.9 L o p t 1.1 L o p t P L
P m e g a = 1.1 L o p t L max P L
where PL is the proportion of individuals in a given length range. Pmat indicates the proportion of fish longer than the length at maturity (Lm), reflecting the degree of protection afforded to mature individuals. Popt indicates the proportion of fish within ± 10% of the optimal length (Lopt), representing favorable conditions for both growth and harvest. Pmega denotes the percentage of individuals exceeding 1.1 Lopt, also known as “mega spawners” due to their high reproductive capacity [34]. Effective management requires Pmega to remain below 20% to avoid the overharvesting of highly fecund individuals, while Pmat and Popt should ideally reach 100% to maintain a mature and sustainable population structure [34,35].
To enhance the integrative assessment of LBIs, Pmat, Popt, and Pmega were combined into a single composite metric, Pobj, reflecting stock status under varying management scenarios. The composite indicator was developed based on a decision tree framework proposed by Cope and Punt [36], which uses deterministic population dynamics simulations under fixed biological parameters (e.g., birth rate, mortality, and growth) to assess the influence of selectivity patterns, compensation capacities, and life-history traits on LBI outputs. Through simulation of stock responses under different strategies, Pobj provides a robust reference for fishery assessment and decision support.

2.2.5. Selectivity and Yield-per-Recruit Analysis

Capture probabilities were estimated in FiSAT II using logistic selectivity curves based on length–frequency data. The lengths at 25%, 50%, and 75% capture probabilities were defined as L0.25, L0.5, and L0.75 [25]. Among them, L0.5 is often used to represent the length at first capture (Lc).
The relative yield per recruit (Y′/R) was analyzed using the Beverton–Holt model to explore the theoretical effects of different exploitation levels and size limits. This analysis operates under a simplified knife-edge selectivity assumption, a standard approach in which fishing mortality is assumed to be zero below Lc and constant for all fish at or above Lc [33]. The relevant equations are
Y / R = E U ( M / K ) [ 1 3 U / ( 1 + m ) + 3 U 2 / ( 1 + 2 m ) U 3 ( 1 + 3 m ) ]
U = 1 L c / L
m = ( 1 E ) / ( M / k ) = k / Z
where Y′/R is the relative yield per recruit, representing the amount of yield an average recruit can contribute over its entire lifetime. The biological parameters (L, k, M), mortality rate (Z), and selectivity (Lc) were empirically estimated from our 2024 data. The exploitation rate (E) was derived from the parameters of our hypothetical low-intensity fishing scenario. The model was then used to simulate Y′/R values over a range of theoretical E and Lc values to generate a yield isopleth diagram for evaluating different exploitation scenarios.
Y′/R and B′/R values in this study are calculated per recruit and do not require an estimate of the absolute number of recruits. These values are interpreted as relative indicators for comparative and management purposes.

2.3. Terminology and Definitions

In this study, we use the terms population recovery and stock rebuilding to describe different aspects of the recovery process. Population recovery refers to biological and demographic improvements, such as increased growth rates, a more balanced age structure, and enhanced reproductive capacity. Stock rebuilding denotes structural signs of improvement and reduced exploitation pressure that suggest the potential for future increases in biomass, but without implying a confirmed rise in absolute abundance.
This distinction facilitates more accurate evaluation of recovery trajectories in data-limited contexts, thereby enhancing interpretive clarity.

3. Results

3.1. Population Structure

3.1.1. Standard Length, Body Weight, and Age

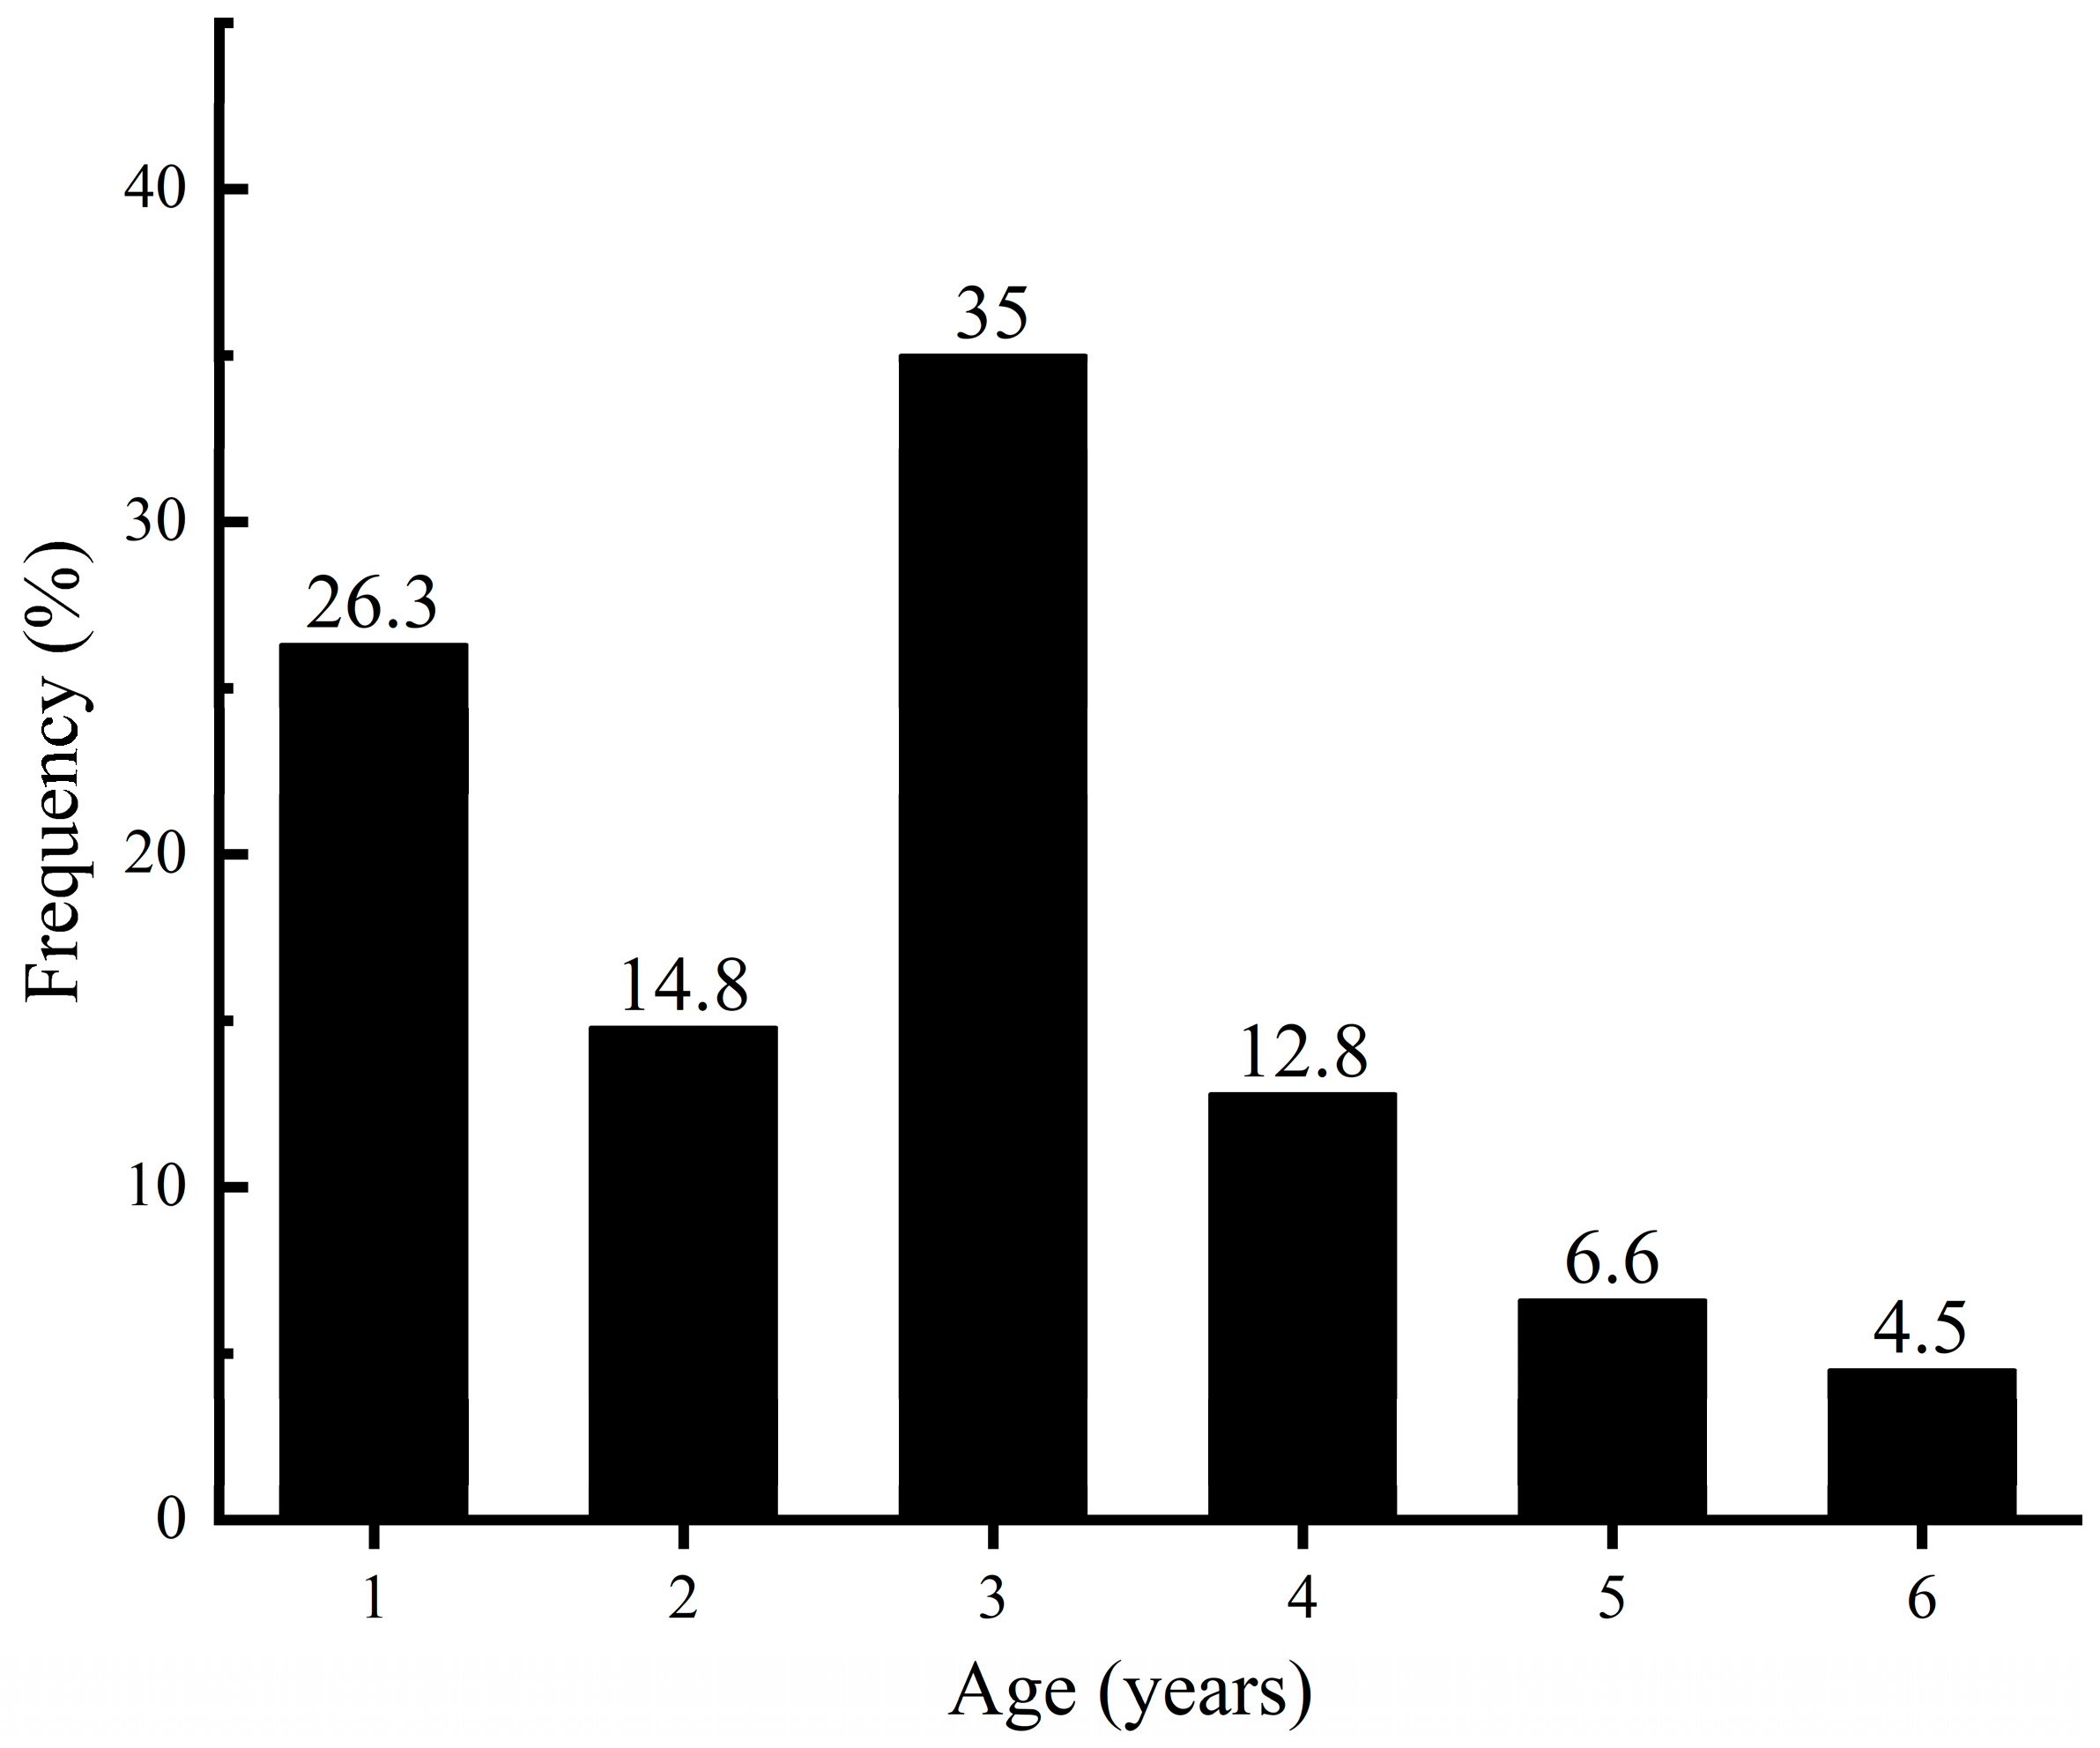
In 2024, a total of 1597 specimens of M. skolkovii were collected, with a combined body weight of 614.19 kg (see Table 1 for sample distribution by season and region). Among them, 243 individuals were randomly selected for age determination. To reduce potential bias in age estimation, the subset of 243 individuals selected for age determination was systematically stratified to encompass the entire observed range of standard lengths. This approach ensured proportional representation of all length classes, thereby enhancing the robustness and reliability of growth parameter estimation and subsequent population structure analyses. The specimens were aged from 1 to 6 years (Figure 2). Individuals aged 3 were the dominant group, accounting for 85 individuals or 35.0% of the total. Individuals aged 1 accounted for 26.3%, whereas individuals aged 2 constituted only 14.8%, indicating a marked decrease. The proportion of individuals aged 4 to 6 years decreased progressively.
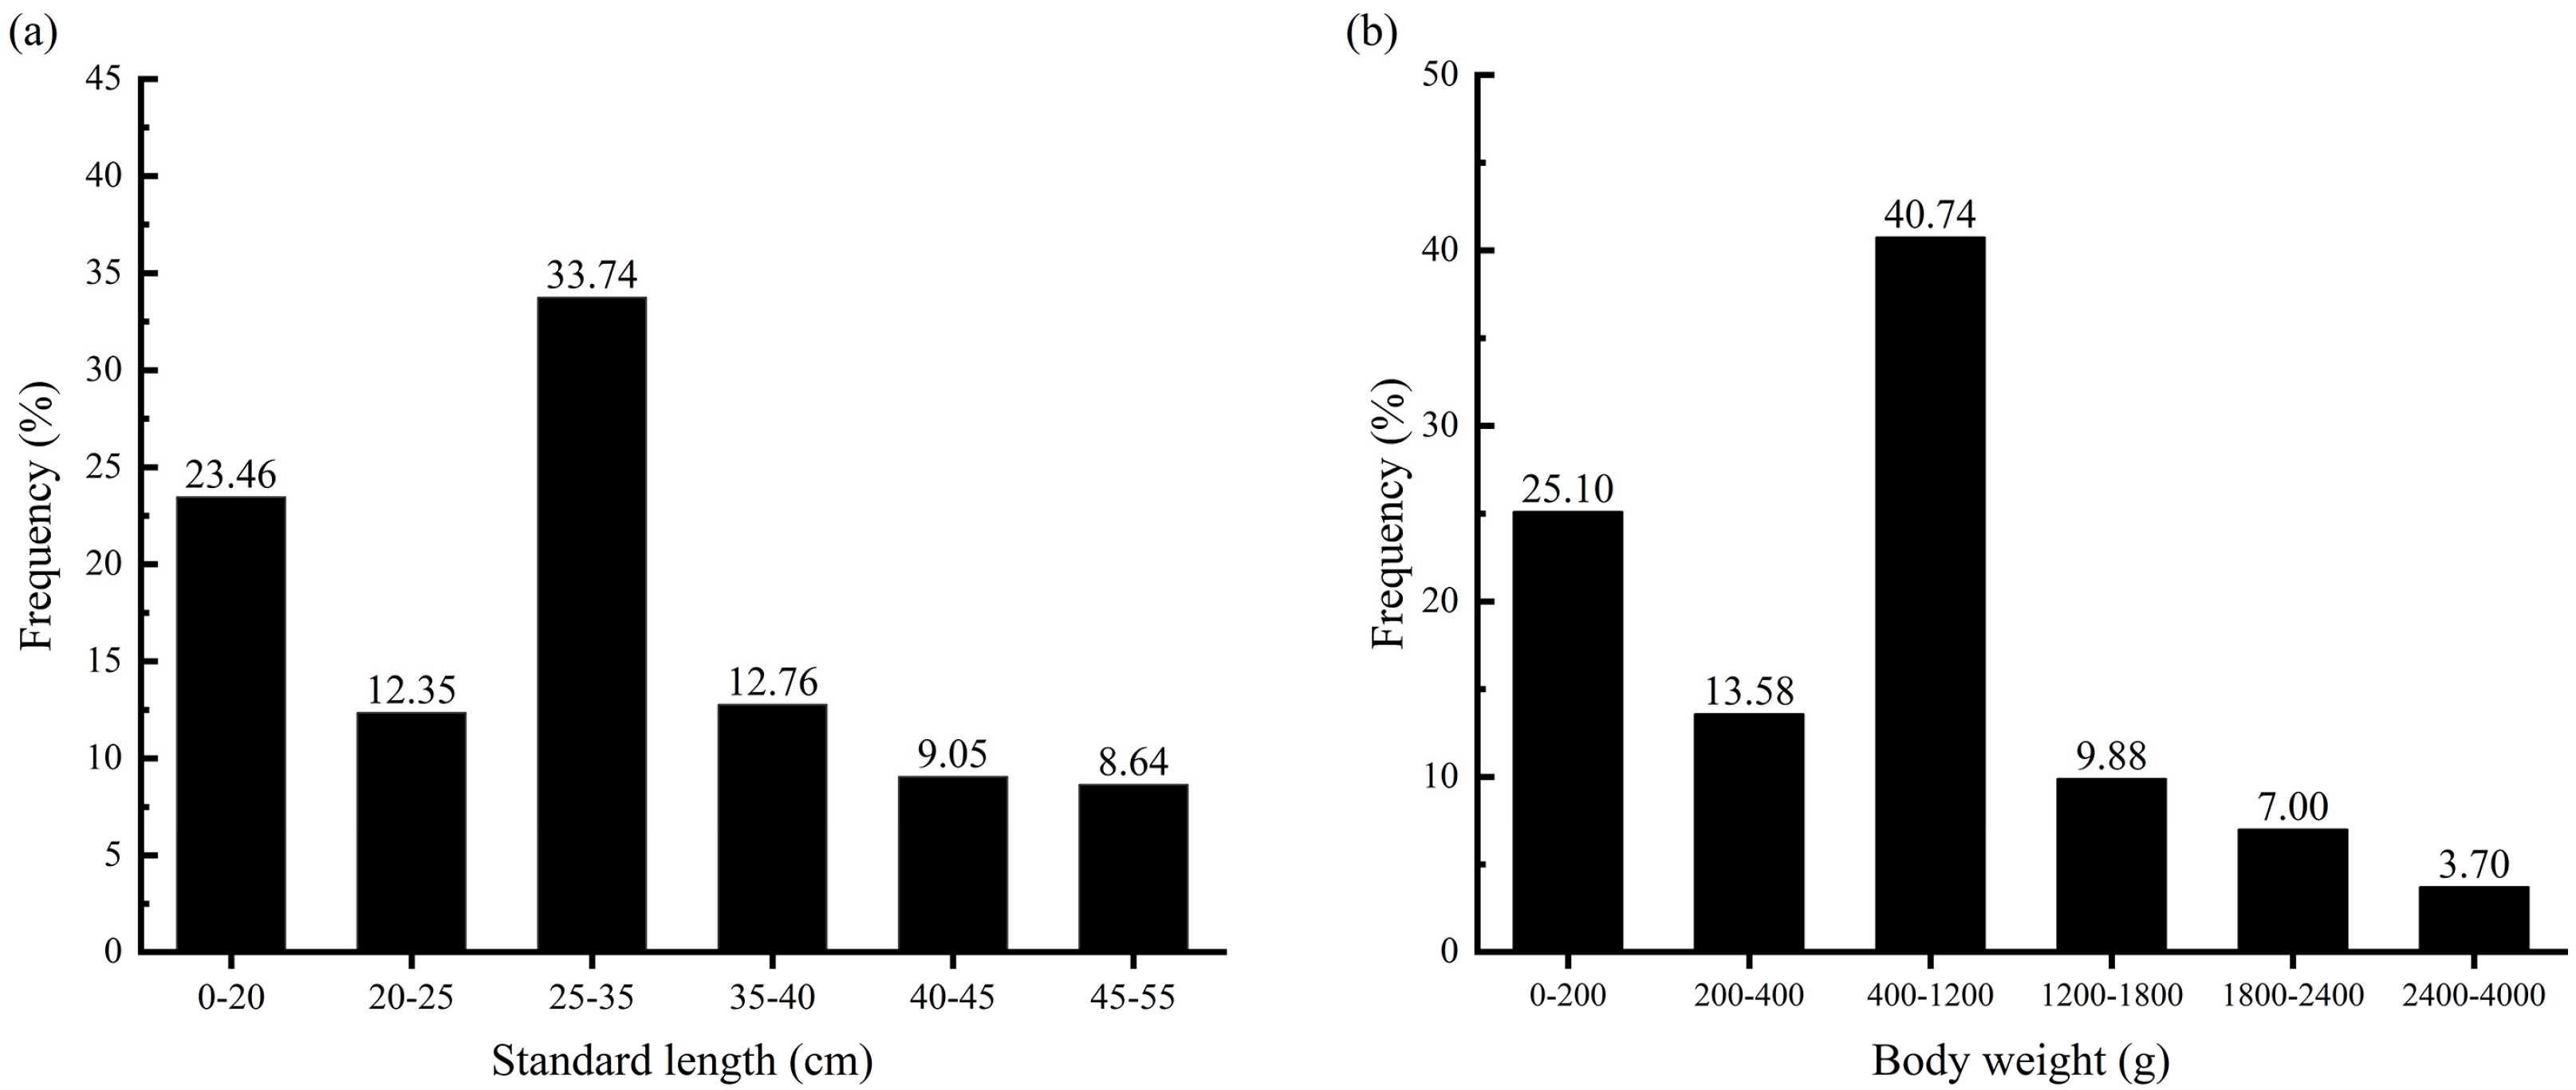
Based on the age structure and age-specific abundance (Figure 2), the standard length and body weight of the specimens were categorized accordingly. The standard length of M. skolkovii in 2024 ranged from 3.72 to 53.51 cm, with a mean ± SD of 20.58 ± 11.82 cm. The dominant length class was 25–35 cm, accounting for 33.74% of the total sample (Figure 3a). Body weight ranged from 1.30 to 3777.20 g, with a mean ± SD of 383.61 ± 611.77 g. The dominant body weight class was 400–1200 g, comprising 40.74% of all samples (Figure 3b).
In addition, analysis of covariance (ANCOVA) was performed to examine differences in body weight among sampling regions after controlling for the effect of standard length. The results indicated a significant effect of region on body weight after adjusting for standard length (p < 0.001). Pairwise comparisons showed that individuals from the Jiangxi section of the Yangtze River mainstem and northern Poyang Lake had significantly higher body weight than those from the Xiu River (p < 0.01), while no significant differences were observed among the Jiangxi section of the Yangtze River mainstem, northern Poyang Lake, and the Boyang River (p > 0.3). The difference in body weight between the Xiu River and the Boyang River approached significance (p = 0.104). These findings suggest that fish growth characteristics vary among regions, potentially reflecting spatial heterogeneity in habitat conditions.

3.1.2. Length–Weight Relationship

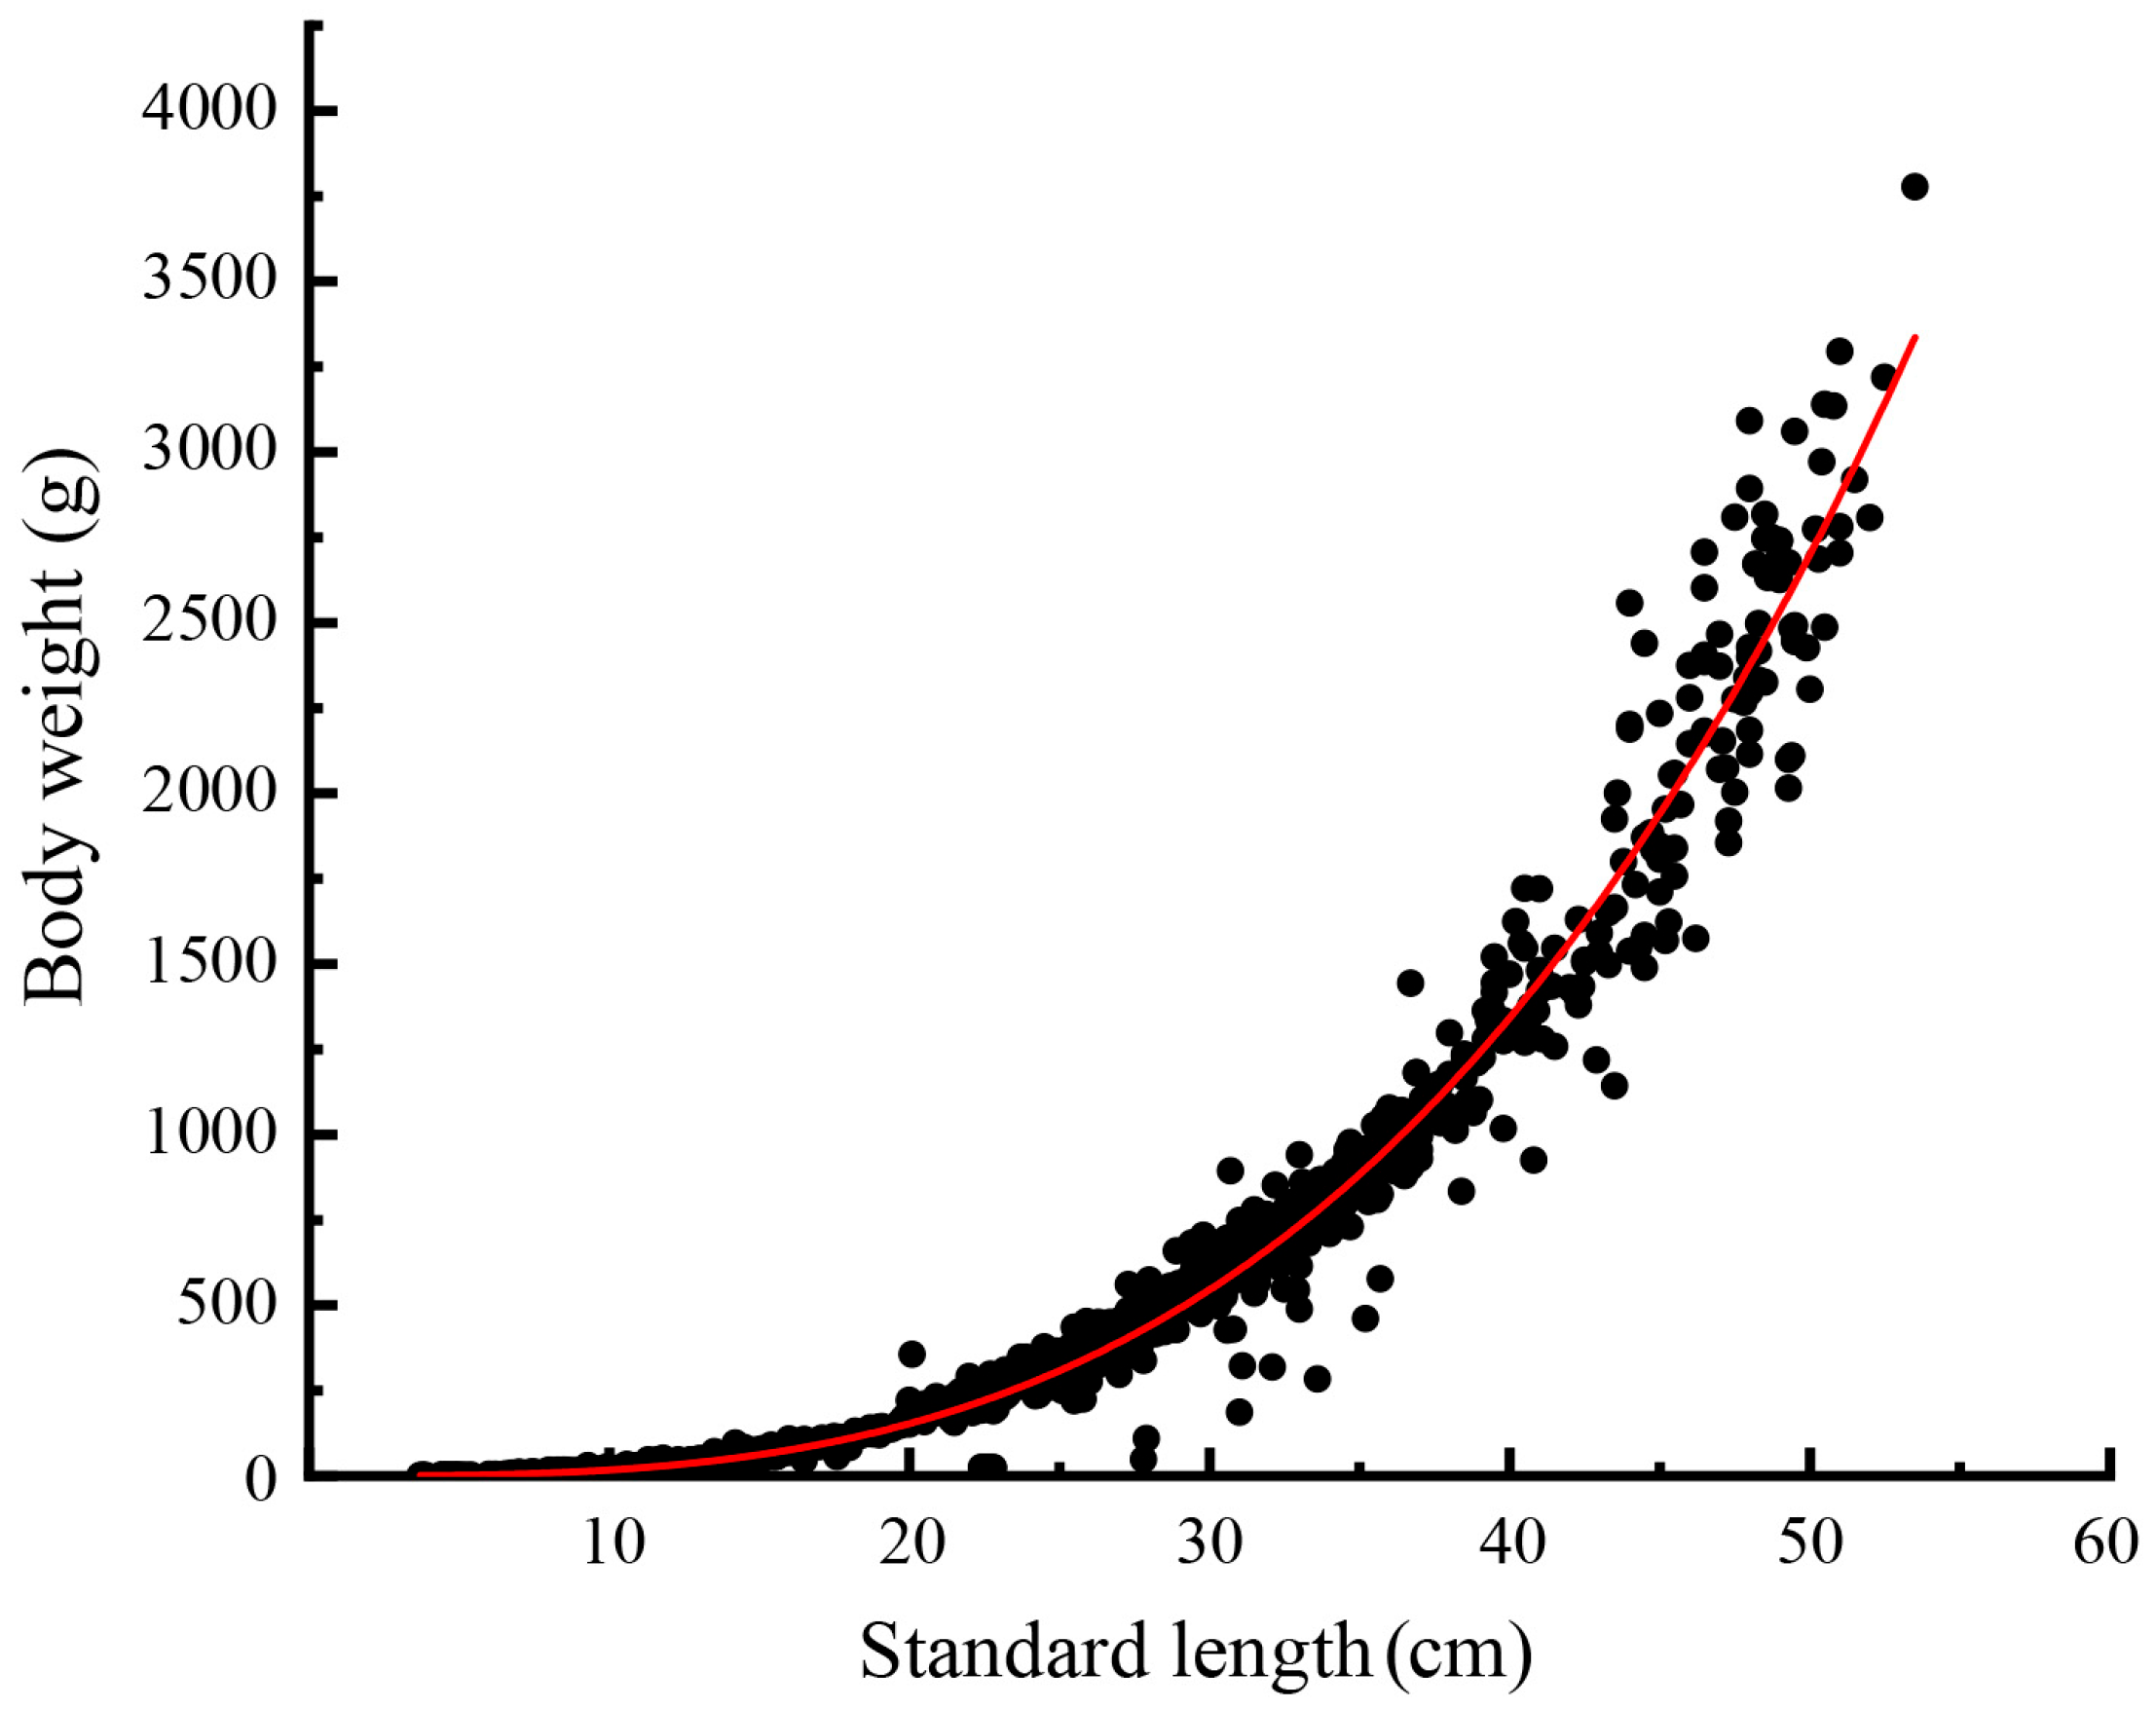
The relationship between standard length (L, cm) and body weight (W, g) in M. skolkovii was described by a power function (Figure 4). The derived regression equation was as follows: W = 1.46 × 10⁻²L3.094 (R2 = 0.982, n = 1597). In this equation, the condition factor a was 1.46 × 10⁻², and the allometric growth exponent b was 3.094. The high coefficient of determination (R2 = 0.982) indicated a strong fit, suggesting that the equation reliably reflects the length–weight relationship. A one-sample t-test indicated no significant difference between the estimated b value and the theoretical isometric value of 3.0 (p = 0.61 > 0.05), suggesting that M. skolkovii exhibits isometric growth. This result supports the applicability of both the von Bertalanffy growth model and the Beverton–Holt yield-per-recruit model [37,38].

3.1.3. Growth Parameters and Model Results

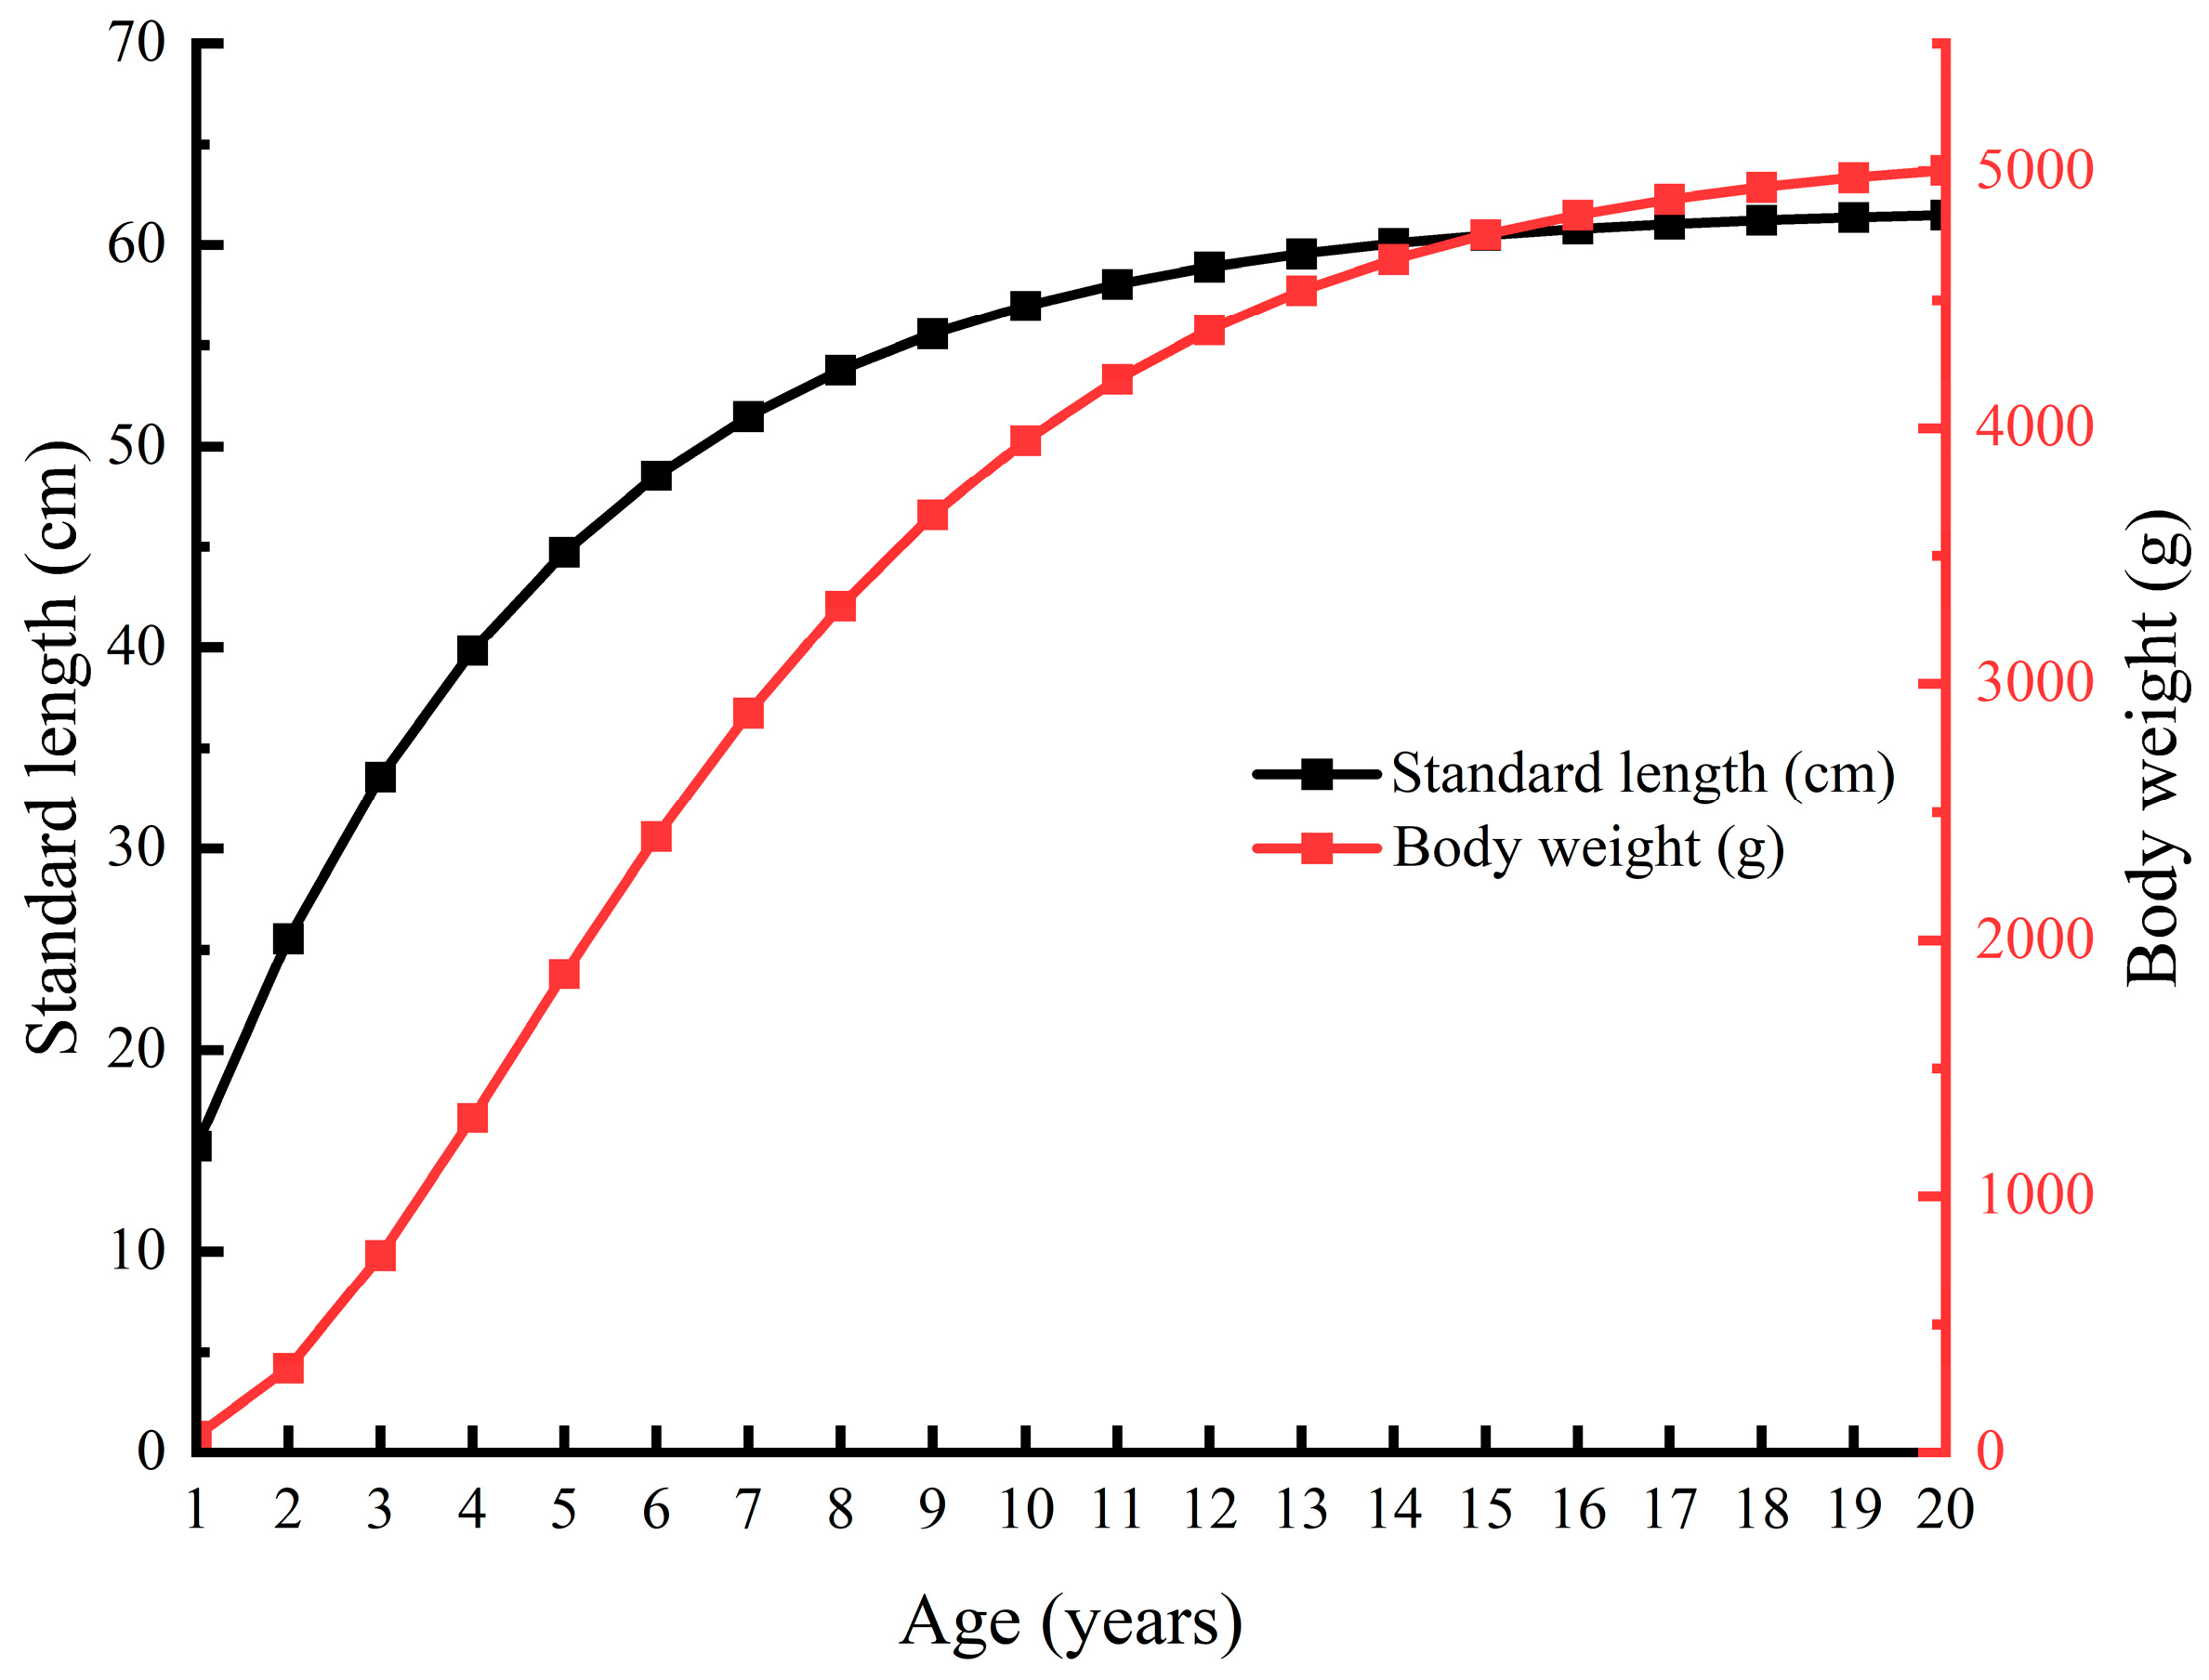
The growth of M. skolkovii was modeled using the VBGF, based on standard length and body weight data (Figure 5). The derived equations were as follows:
Length growth equation: Lt = 61.89[1 − e−0.25(t+0.129)]
Weight growth equation: Wt = 5106.07[1 − e−0.25(t+0.129)]3.094
The fitted parameters indicated an asymptotic length (L) of 61.89 cm and an asymptotic weight (W) of 5106.07 g. The theoretical age at zero length (t0) was estimated at −0.129 year, and the growth coefficient (k) was 0.25 year−1. The growth performance index (φ′), derived from L and k, was estimated at 2.98.
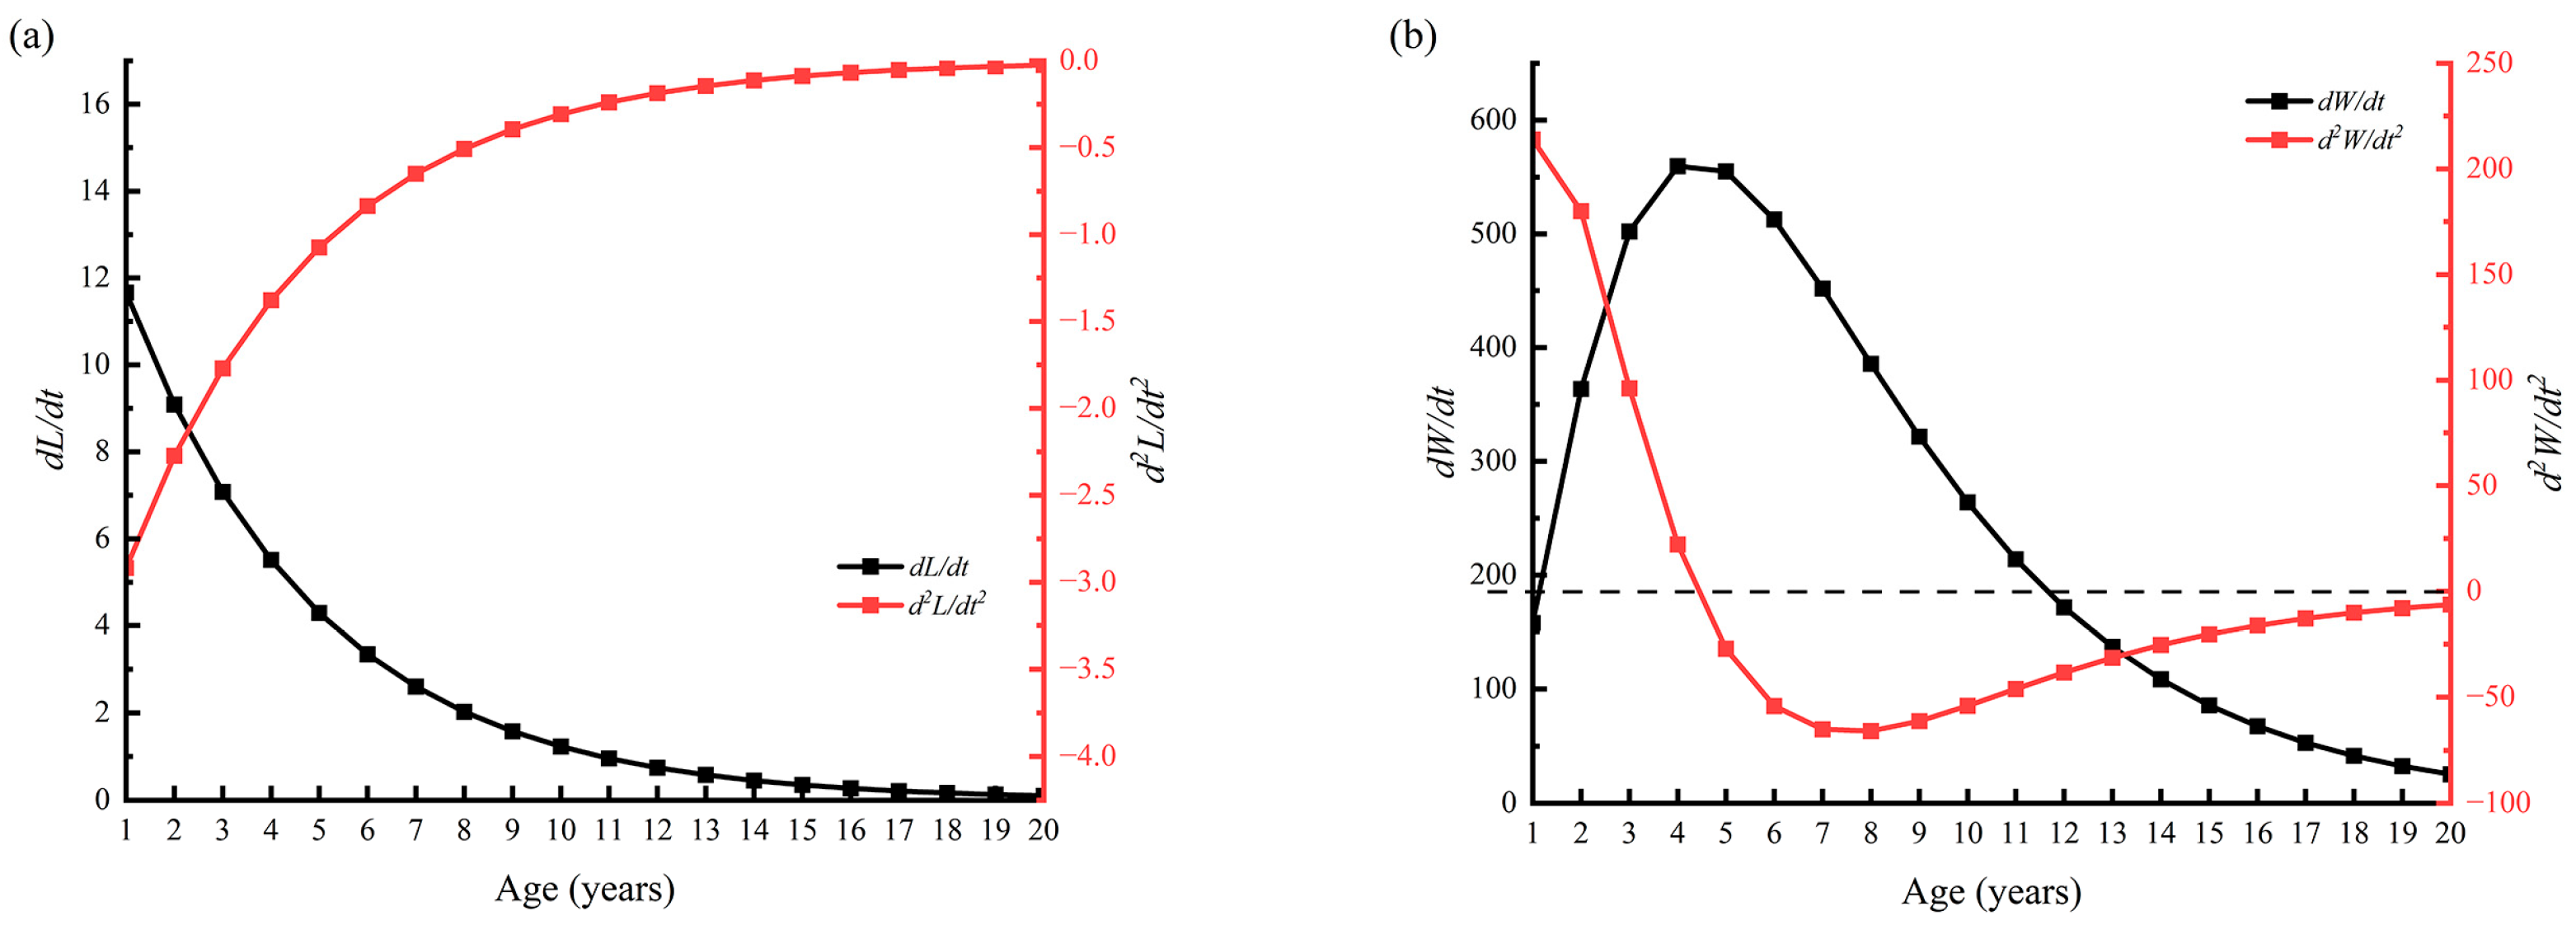
Growth rate and acceleration equations for both standard length and body weight are presented in Figure 6.
Growth rate:
dL/dt = 15.47e−0.25(t+0.129), dW/dt = 3949.55e−0.25(t+0.129)[1 − e−0.25(t+0.129)]2.094
Growth acceleration:
d2L/dt2 = −3.87e−0.25(t+0.129), d2W/dt2 = 987.39e−0.25(t+0.129)[1 − e−0.25(t+0.129)]1.094[3.094e−0.25(t+0.129) − 1]
No inflection point was observed in the standard length growth rate or acceleration curves (Figure 6a). The acceleration of length growth was negative at onset and increased with age, while the growth rate declined continuously. Both metrics approached zero as fish aged. In contrast, the body weight growth curve exhibited a typical sigmoid (S-shaped) pattern (Figure 6b). During the early growth stages, the acceleration was 214.4 g/year2 and the growth rate was 157.8 g/year. With increasing age, acceleration decreased, while the growth rate increased, reaching a maximum at the inflection point (ti = 4.4 years) (Figure 6b). At this point, body weight was 1515.01 g, and the corresponding standard length was 41.79 cm. Beyond this point, acceleration became negative, and the growth rate began to decline, with the rate of decline progressively increasing. At age 7.6 years, the standard length reached 52.82 cm, and body weight was 3125.47 g, at which point growth acceleration reached its minimum. With further aging, both length and weight gradually approached their respective asymptotic values, while the growth rate and acceleration tended toward zero.

3.2. Mortality Parameters

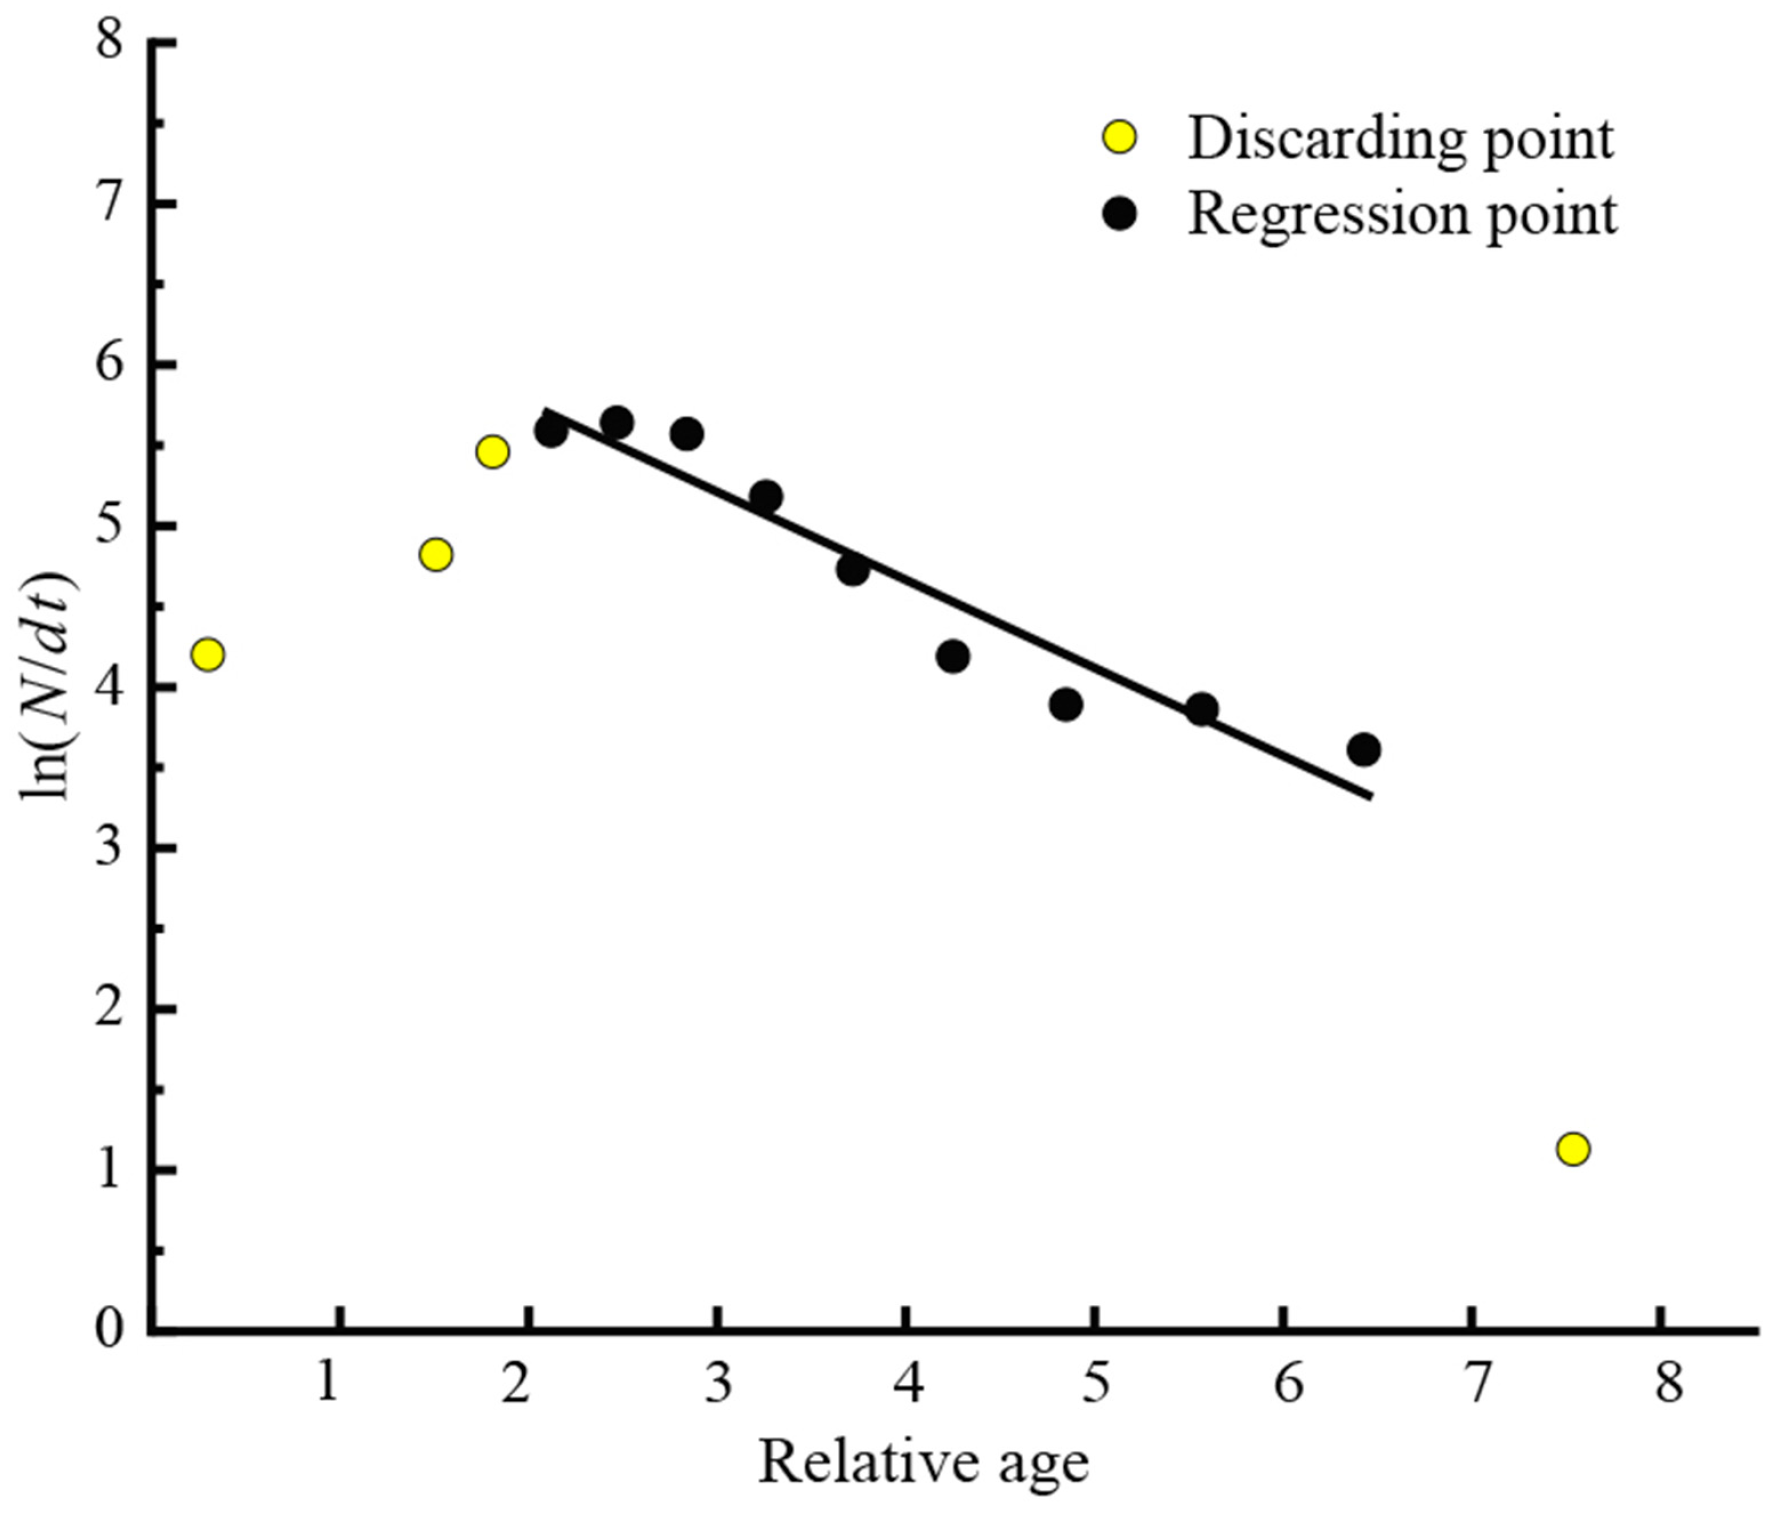
A 3 cm length class interval, derived as the average of the Snedecor and Sturges methods, was adopted for subsequent population analyses. Length frequency data were subsequently entered into FiSAT II, and linear regression was performed using the length-converted catch curve module (Figure 7). The fitted regression equation was ln(N/dt) = 6.85 − 0.55t (R2 = 0.924); the slope of the regression line (−0.55) indicated a total mortality coefficient (Z) of 0.55 year−1, with a 95% confidence interval of 0.406–0.686. Natural mortality (M = 0.48 year−1) was estimated using Pauly’s temperature-based empirical formula, based on inputs of 18 °C, L = 61.89 cm, and k = 0.25. Crucially, the 95% confidence interval of Z fully encompasses the point estimate of M, meaning that fishing mortality (F) is statistically indistinguishable from zero. However, assuming F = 0 would be ecologically unrealistic in a system where residual fishing activities (e.g., illegal catch) are known to occur. To provide a more precautionary assessment, we therefore conducted an exploratory analysis of a hypothetical low-intensity fishing scenario. For this purpose, we used an illustrative F value of 0.07 year−1 (the difference between the point estimates of Z and M) to parameterize this scenario, yielding a conceptual exploitation rate (E) of 0.13. We emphasize that these values are hypothetical modeling inputs only, and not empirical estimates.
Based on the growth parameters and natural mortality, the optimal length at first capture (Lopt) was estimated at 37.78 cm using Equation (15), offering a theoretical biological benchmark under model assumptions.

3.3. Population Assessment Based on Length-Based Indicators (LBIs)

According to previous studies, the age at first maturity for M. skolkovii in Poyang Lake has been reported as approximately 2 to 3 years [8,9]. Based on this initial maturity age, the length at first maturity (Lm) was calculated using Equation (2) as approximately 25.53 cm. This value was used to estimate three length-based indicators: Pmat, Popt, and Pmega (Table 2).
Immature individuals (<Lm) made up 53.95% of the catch, while mature individuals (Pmat) constituted 46.05%. The proportion of fish within the optimal length at first capture ±10% (Popt) was 9.51%, and large spawners (Pmega) accounted for only 6.88% (Figure 8). Based on the decision tree evaluation (Table 2), the length structure of the M. skolkovii population in Poyang Lake was generally considered to be healthy. However, there remained a 4% probability of falling below the target reference point (TRP) and a 2% probability of falling below the limit reference point (LRP). To support future explorations of size-based management, the Lopt range (estimated at 34–42 cm) may serve as a theoretical reference point for assessing optimal capture lengths under sustainable harvest scenarios.

3.4. Stock Dynamics Modeling

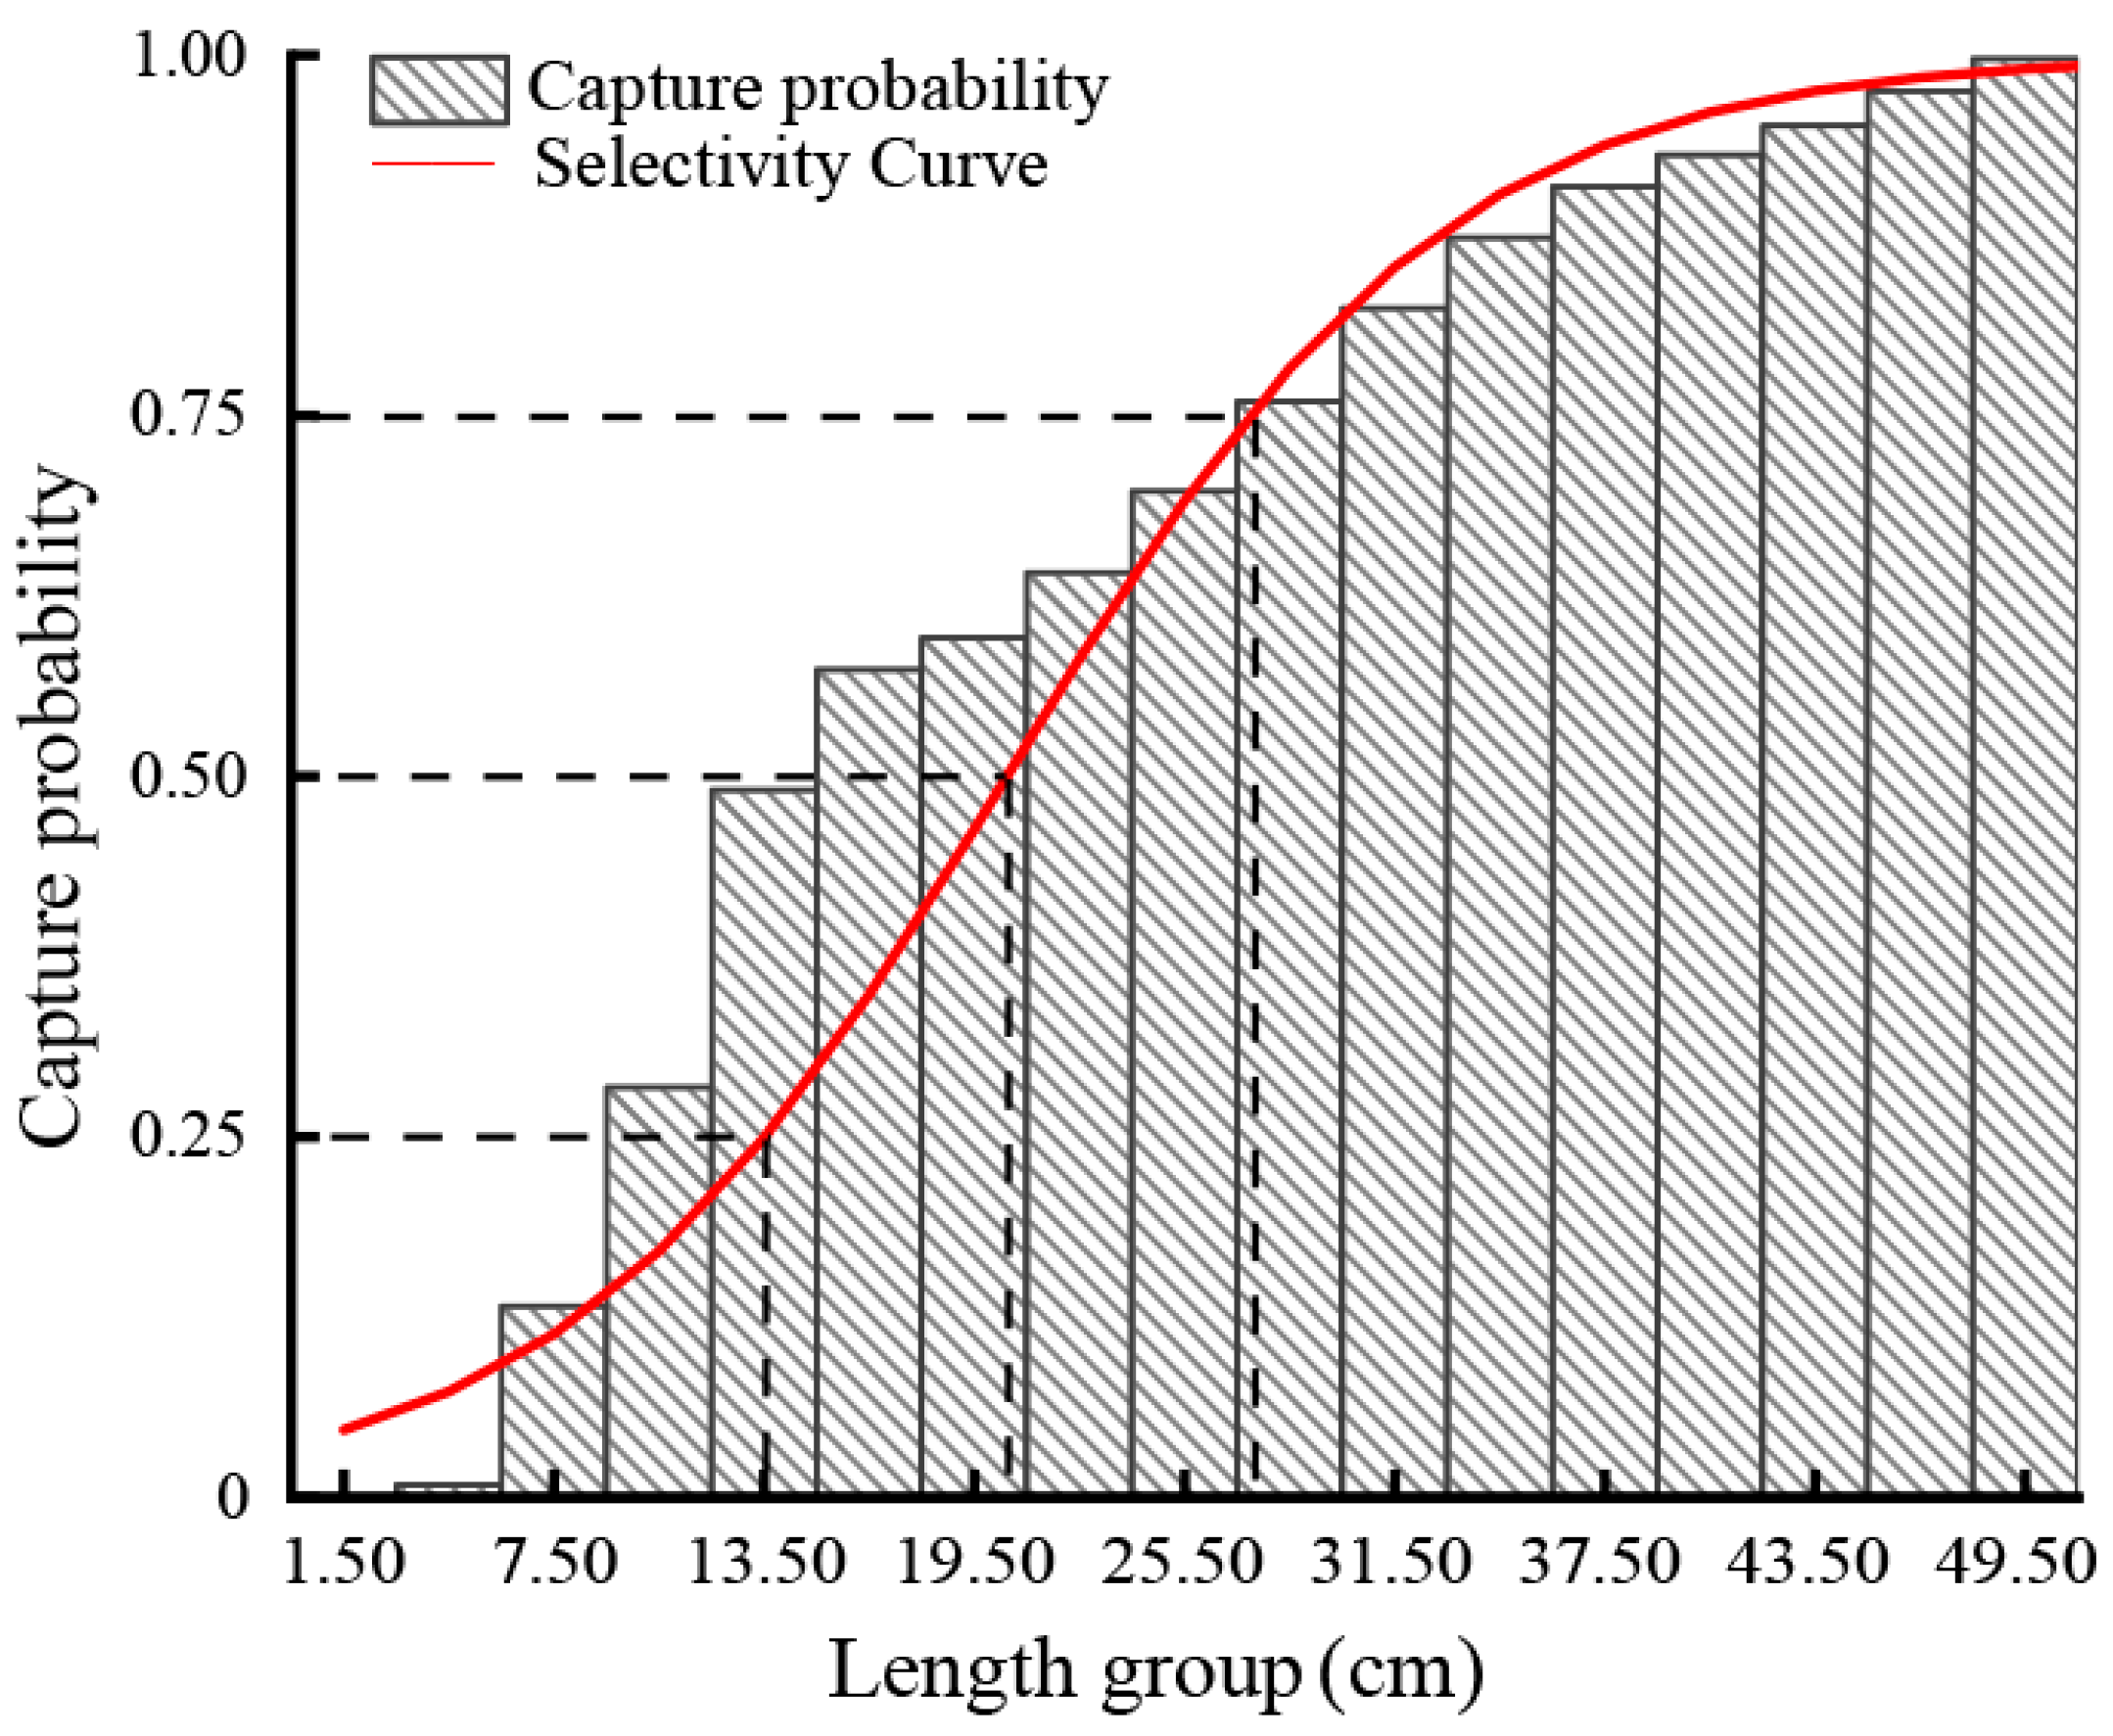
Based on the length-at-capture probability curve (Figure 9), the length at 50% probability of capture (L0.5) for M. skolkovii was estimated at 20.43 cm, corresponding to a body weight of 165.36 g. The lengths at 25% and 75% probability of capture (L0.25 and L0.75) were 13.52 cm and 27.34 cm, corresponding to body weights of 46.08 g and 407.32 g, respectively.
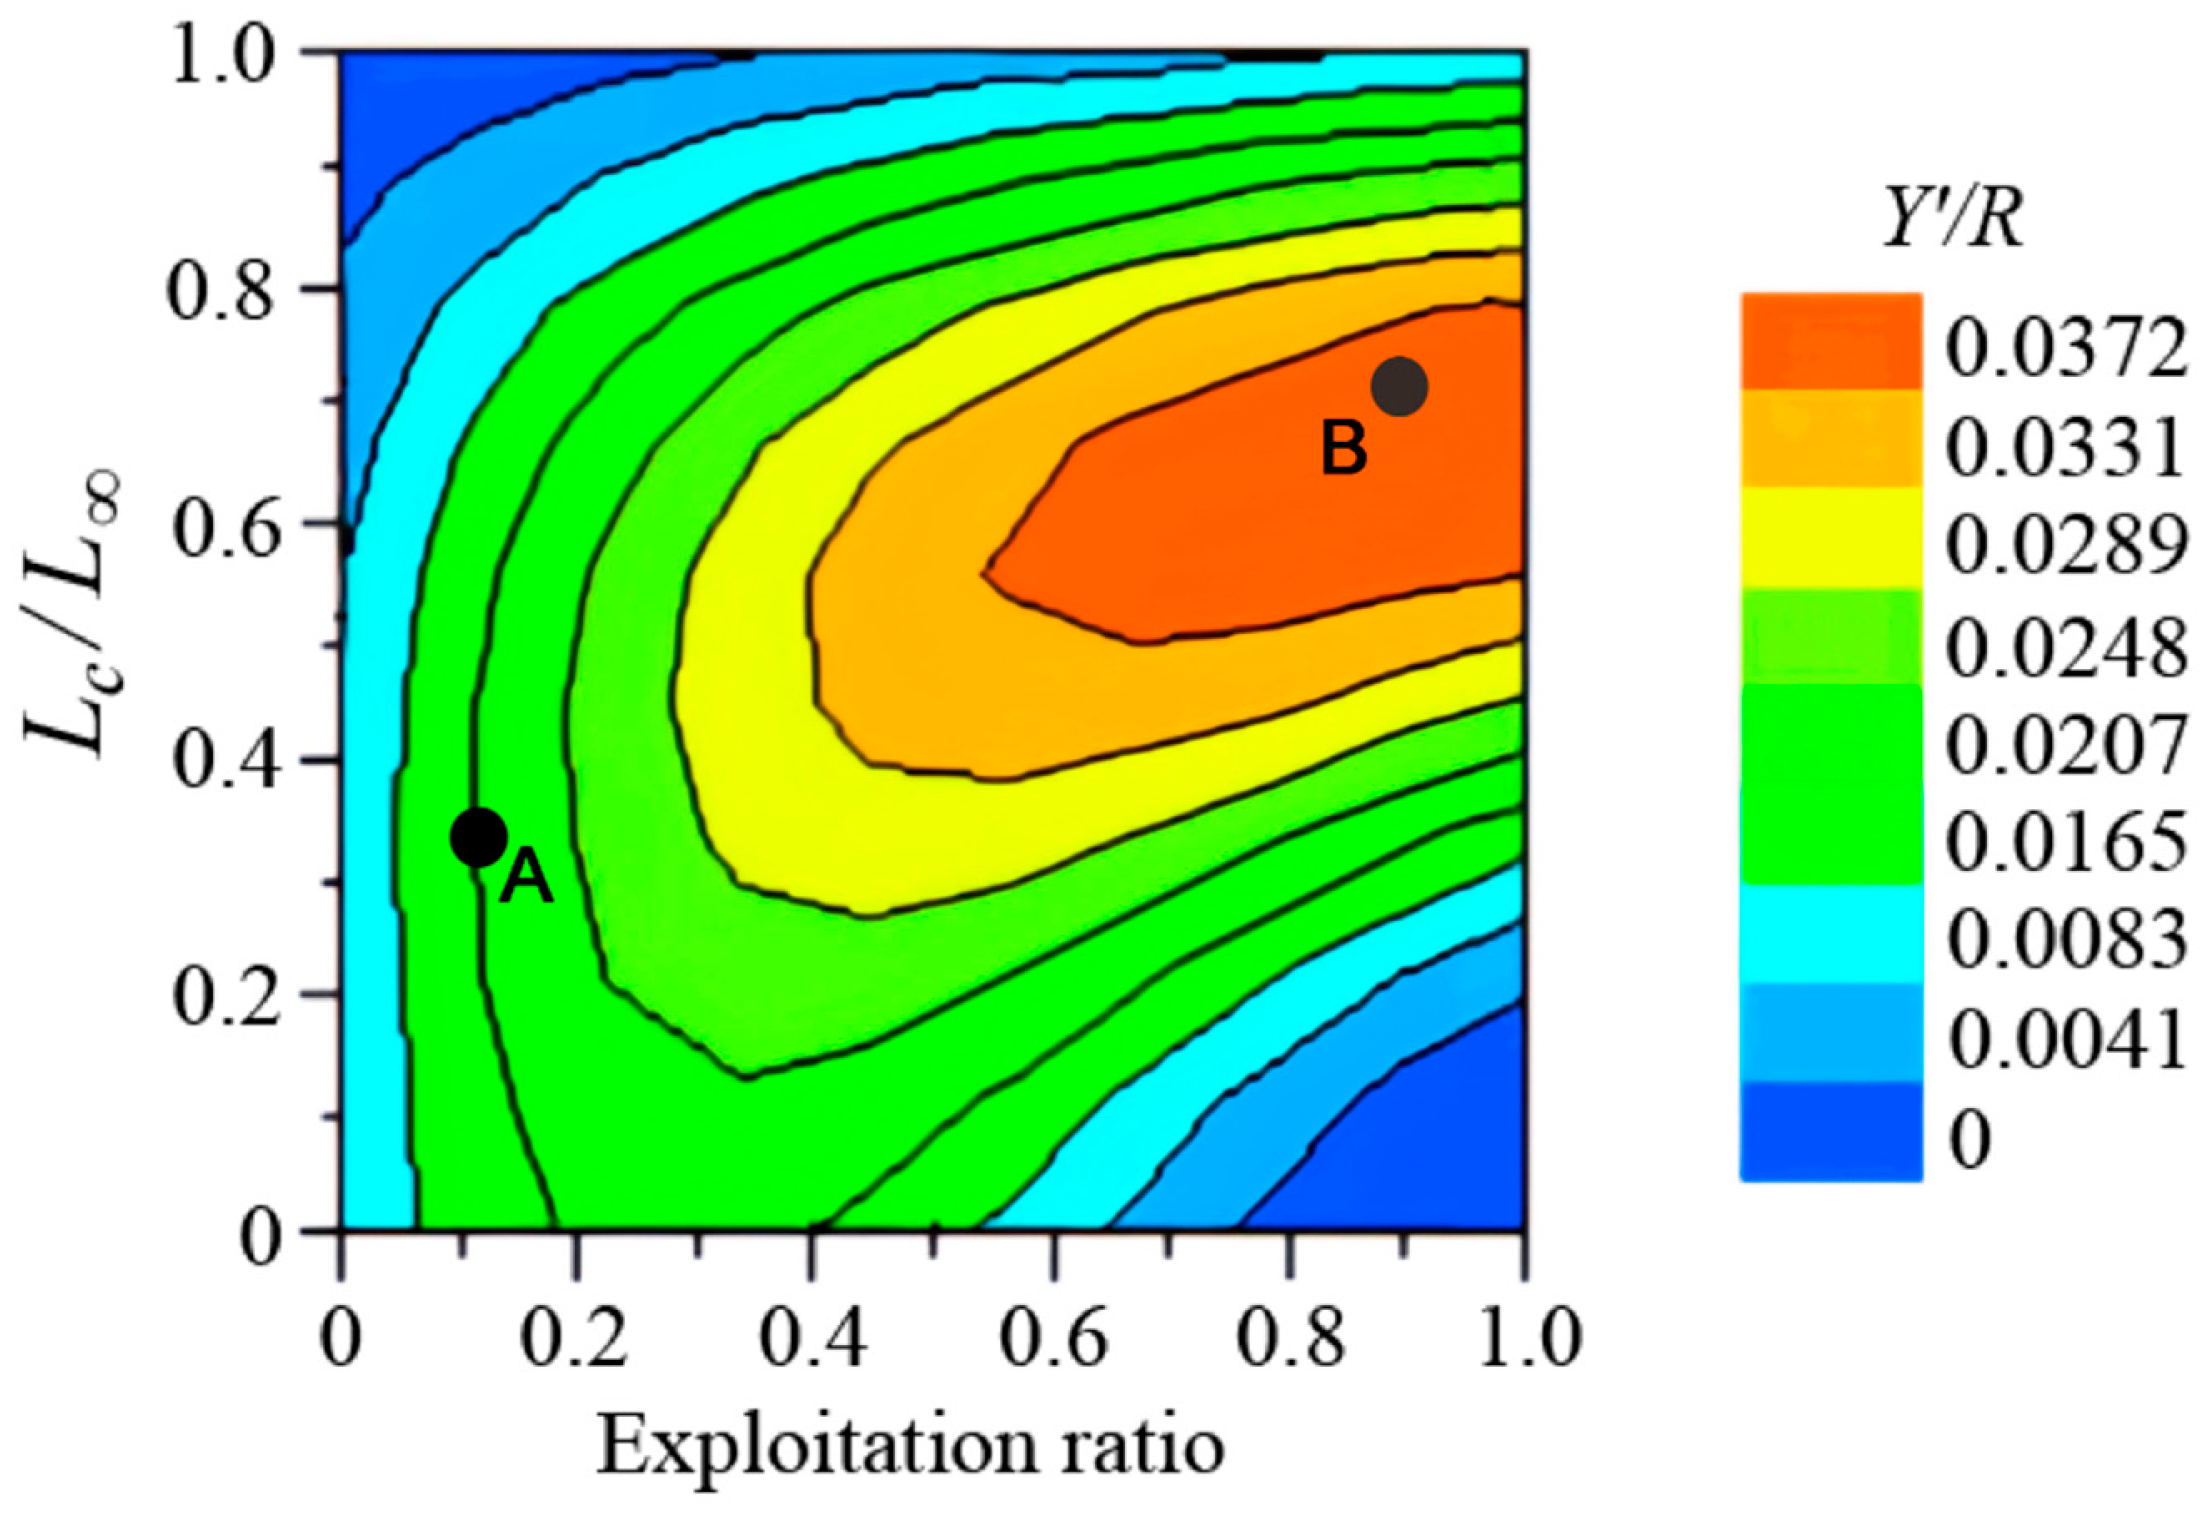
A knife-edge selectivity model under the Beverton–Holt framework was used to examine the relationship among the exploitation rate (E), the ratio of length at capture to asymptotic length (Lc/L), and the relative yield per recruit (Y′/R) (Figure 10). Under the assumption of M/k = 1.92, contour lines depict the response of Y′/R to variations in both E and Lc/L. Point A illustrates a hypothetical low-exploitation scenario, parameterized with E ≈ 0.13 (derived from an illustrative F of 0.07). We emphasize that this point represents a modeling scenario only and does not reflect an empirical estimate of the current stock status. Under the same M/k assumption, point B corresponds to the theoretical maximum Y′/R (0.037), achieved at Lc/L ≈ 0.7 and E ≈ 0.9, reflecting a heavily exploited status not aligned with current conservation goals. These comparative simulations highlight the trade-offs between size-at-capture and exploitation intensity within the theoretical yield landscape. Based on biological parameters, the optimal length at first capture (Lopt) was estimated at approximately 34–42 cm (Lopt ± 10%). This may serve as a theoretical reference point for future stock assessments or simulation-based evaluations. However, given the absence of pre-ban data and inherent model assumptions, these outputs should not be interpreted as prescriptive management recommendations, but rather as exploratory tools to support ongoing scientific inquiry into post-ban recovery dynamics.

4. Discussion

4.1. Appropriate Population Structure and Assessment Methods

A healthy fish population should exhibit a complete spectrum of age and size classes, characterized by a balanced distribution across cohorts and a sufficient proportion of sexually mature and large individuals. Such a structure is essential for supporting natural recruitment and maintaining key ecological functions [34,39]. In well-structured populations, biomass typically declines across age classes due to cumulative natural mortality and energy allocation trade-offs [37,40]. By contrast, an excessive proportion of juveniles or a deficiency of large individuals may signal overfishing or environmental stress, potentially impairing reproductive capacity and causing structural discontinuities within the population [41]. Therefore, accurate assessment of population structure is fundamental to effective fisheries management and the long-term sustainability of aquatic resources [42,43].
Methods for evaluating population structure include length–frequency and age composition analyses [32,44], whereas stock dynamics are typically assessed using length-based indicators (LBIs) and other data-limited approaches [45,46]. These complementary methods integrate structural assessment with dynamic modeling to establish a multidimensional evaluation framework. When applied in conjunction with key biological parameters (e.g., L, k, φ′) and mortality rates (e.g., Z, M), they enable the quantification of exploitation intensity, recovery trajectories, and stock resilience [36]. Under the fishing ban, this integrative approach substantially improves the precision of stock assessments and is particularly effective for long-lived, economically important species such as M. skolkovii. It provides a robust scientific basis for adaptive management aimed at achieving long-term fishery sustainability.

4.2. Age Structure and Growth Characteristics of M. skolkovii

Following the implementation of the Yangtze River’s “ten-year fishing ban”, the M. skolkovii population in Poyang Lake has exhibited early signs of recovery; however, the population structure remains incomplete. A high proportion of individuals aged 1 and 2 reflects a strong recruitment capacity, which supports both population growth and stabilization of the age structure. However, the scarcity of individuals aged four years and older suggests a persistent structural discontinuity. Similar patterns have been observed in Atlantic salmon (Salmo salar), where prolonged overfishing reduced the abundance of older, larger fish, leading to disruptions in population structure [47]. Similar structural discontinuities have also been reported in other long-lived commercial species, such as Atlantic cod (Gadus morhua) [48] and Pacific halibut (Hippoglossus stenolepis) [49], underscoring the long-term impacts of historical overexploitation. Commercial fishing often targets individuals with large-bodied genotypes, typically late-maturing and vital for population sustainability [50]. The removal of these individuals results in juvenile-dominated populations, reduced recruitment, and long-term instability in the population structure. This aligns with the observed structural discontinuity in the current study, representing a typical legacy of historical overfishing pressure [39].
Despite this structural gap, the M. skolkovii population shows substantial recovery potential. Compared with data from 2017 to 2019 and 2021 to 2022 [51], the 2024 data show increases in both the standard length range and mean length (Table 3), suggesting a mitigation of previous dwarfing trends. The estimated growth coefficient (k = 0.25 year−1) and growth performance index (φ′ = 2.98), along with other growth parameters, exceeded those reported for most conspecific populations in other habitats (Table 4), indicating strong somatic growth in the early post-ban period. This growth advantage may result from a combination of favorable environmental conditions in Poyang Lake, including high primary productivity, abundant benthic resources, and elevated cumulative thermal units [20]. Moreover, the condition factor a derived from the length–weight relationship was significantly higher than that of conspecifics in the Beijiang River, Xujiahe Reservoir, and Nanshui Reservoir, further reflecting improved nutritional status and habitat quality (Table 4).
The inflection age (ti = 4.4 years) was notably later than the age at sexual maturity (2–3 years), indicating continued somatic growth after maturation. This trait may confer adaptive advantages, enabling individuals to accumulate energy reserves and maintain resilience following initial reproduction [52]. However, the long-term stability of the population also depends on successful recruitment. The extreme drought in 2022, which caused sharply reduced water levels, degraded water quality, and lower primary productivity, likely suppressed spawning success and larval survival. This may explain the markedly lower abundance of individuals aged 2 relative to those aged 1, suggesting that extreme climatic events have emerged as a significant constraint on stock rebuilding [53].
This emerging ecological dominance of M. skolkovii may represent a compensatory response to the moratorium, driven by a combination of ecological mechanisms. Specifically, the release from harvest pressure [54], competitive advantage over slower-recovering species [55], and increased macrophyte availability [56] may have jointly facilitated its population expansion. These findings highlight the species’ ecological responsiveness and reflect broader community-level shifts following the fishing ban.
Table 4. Comparison of growth parameters of Megalobrama species across different water bodies.
SpeciesSampling Siteak
(Year−1)
ti
(Year)
L
(cm)
W
(g)
Inflection Length
(cm)
Inflection Weight
(g)
Apparent
Growth Index
M. skolkoviiPoyang Lake1.46 × 10−20.254.4061.895106.0741.801515.002.98
M. skolkoviiNanshui Reservoir
[57]
1.14 × 10−20.215.4049.292875.6333.81902.152.71
M. skolkoviiBeijiang River
[58]
4.00 × 10−50. 234.3848.053052.9231.76900.222.73
M. skolkoviiXujiahe Reservoir
[9]
2.23 × 10−50.185.9045.832197.3030.47665.682.58
M. terminalisPearl River
[59]
1.55 × 10−20.185.9147.202388.1231.70712.212.60
M. terminalisXijiang River
[60]
7.00 × 10−50.224.7042.011602.7628.03476.162.59

4.3. Stock Dynamics and Resource Status of M. skolkovii

In the absence of long-term species-specific data, population dynamics were assessed using mortality estimates and length–frequency information as proxies for stock status.
Understanding population dynamics is fundamental to effective fisheries management, with accurate estimation of mortality rates and stock status serving as a core components [25]. In this study, natural mortality (M = 0.48 year−1) was obtained from Pauly’s temperature-based empirical formula. The resulting M/K ratio (1.92) lies within the generally accepted range of 1.5–2.5, supporting the biological plausibility of the estimate [37]. Under the current fishing ban on the Yangtze River, natural mortality remains the dominant driver of population change. A key consideration is that the point estimate of M falls within the 95% confidence interval of total mortality Z (0.406–0.686), meaning that the fishing mortality (F) cannot be statistically distinguished from zero. Despite this statistical uncertainty, assuming F = 0 would be ecologically unrealistic given documented reports of illegal or incidental fishing [61,62]. Therefore, we used the value of F ≈ 0.07 year−1 to parameterize an exploratory, low-intensity fishing scenario. This scenario is intended to illustrate the potential implications of residual fishing pressure, rather than to inform direct management decisions. Similar patterns have been documented in other closed fishing systems, such as Kaptai Lake in Bangladesh and the Azores in Portugal [63,64], suggesting that even minimal fishing activity may still hinder full stock rebuilding and should be considered when evaluating post-ban recovery dynamics.
A crucial aspect of our scenario analysis is the practical interpretation of the hypothetical fishing mortality. An instantaneous rate, such as the illustrative F = 0.07 year−1, cannot be converted to the absolute catch (in tonnes) without a reliable estimate of the total stock biomass (B). Obtaining such a biomass estimate for a large, dynamic, and open ecosystem like Poyang Lake is a monumental challenge that requires extensive, dedicated surveys (e.g., large-scale hydroacoustic or mark–recapture studies) and was beyond the scope of this study [65]. Furthermore, quantitative data on illegal or incidental catches are notoriously difficult to obtain [66]. Therefore, a more scientifically sound and feasible approach is to interpret the potential impact through relative metrics. The F/M ratio for our hypothetical scenario is approximately 0.15, indicating a relatively low level of fishing pressure compared to natural mortality under the model assumptions. This provides a scale-independent perspective for considering the implications of even minimal residual fishing on the stock’s recovery trajectory.
Complementing the mortality analysis, length-based indicators (LBIs) offer a rapid, age-independent means of assessing the stock status [67,68]. The decision tree model based on LBIs in this study indicated a general trend of stock rebuilding in M. skolkovii. Nonetheless, the continued scarcity of large individuals points to a risk of structural truncation. Compared with traditional assessment approaches, LBIs reveal deeper structural issues—specifically, a demographic shift toward smaller and younger fish—which may reduce the long-term resilience and ecological functionality of the population [35]. The incorporation of uncertainty analysis further strengthens the precautionary value of these findings, highlighting the value of continued stock monitoring and scientific observation to support future understanding of recovery trajectories, even during moratoria.

4.4. Management Strategies

The “ten-year fishing ban” policy has provided a crucial opportunity for the recovery of M. skolkovii stocks in Poyang Lake. However, fishing bans alone cannot fully reverse resource degradation or restore ecosystem functions [13], especially in the face of ongoing stressors such as illegal fishing, habitat fragmentation, declining hydrological connectivity, and climate variability [13,61]. Thus, follow-up policy design is crucial to avoid premature harvesting [69].
To support sustainable population recovery, an integrated management approach is needed. While this study does not propose direct management actions, theoretical benchmarks—such as length at maturity (Lm) and optimal length at first capture (Lopt)—can serve as biological reference points for informing future discussions. These parameters highlight the importance of protecting reproductive cohorts and maintaining structural integrity within fish populations. However, their application requires validation through comprehensive stock assessments and monitoring.
Habitat restoration, particularly of spawning grounds, is equally critical to support the species’ full life cycle and enhance reproductive success and early survival [70]. Additionally, establishing effective enforcement mechanisms to ensure compliance. Beyond local actions, the establishment of a regional, ecosystem-based co-management framework is recommended to foster cross-scale governance and enhance the long-term resilience of aquatic ecosystems [71].
Finally, strengthening ecological monitoring systems is imperative. Integrating indicators such as genetic diversity, reproductive behavior, and energy allocation efficiency will allow a shift from conventional abundance-based assessments to evaluations focused on functional recovery. This multidimensional, multi-scale management approach offers a scientifically grounded and operationally feasible foundation for the sustainable utilization of freshwater fishery resources.

5. Conclusions

This study provides the first integrated assessment of the population structure, growth dynamics, and mortality profile of M. skolkovii in the Poyang Lake Basin during the initial phase of the Yangtze River fishing ban. While preliminary signs of recovery were observed—including improved growth potential, reduced fishing pressure, and a younger age structure—the population has yet to regain structural integrity and full reproductive capacity. The continued scarcity of large individuals, heightened ecological vulnerability, and environmental uncertainty reveal a characteristic “two-phase recovery” pattern, in which individual physiological improvement precedes population-level structural restoration.
It should be noted, however, that the present findings are based solely on data from a single year (2024) and lack historical baseline information prior to the fishing ban. Therefore, the results should be interpreted as preliminary. Sustaining the observed recovery trajectory will require timely scientific intervention and adaptive management informed by ongoing monitoring. Future efforts should incorporate multi-year and spatially extensive sampling, along with complementary methods such as hydroacoustic surveys, tagging studies, and genetic assessments, to build a more comprehensive understanding of population dynamics.
By combining ecological, biological, and environmental analyses, this study emphasizes the critical need to restore functional population integrity. A transition from static protection to dynamic, evidence-based regulation—grounded in long-term data and multi-scale assessment—will be essential to ensure the sustainable management of freshwater fishery resources in Poyang Lake and the broader Yangtze River Basin.

Author Contributions

X.H.: writing—original draft, visualization, investigation, formal analysis, and data curation. Q.X.: writing—review and editing, data curation, and visualization. B.Z.: writing—review and editing—and resources. C.K.: writing—review and editing—and resources. L.F.: writing—review and editing—and resources. X.G. (Xiaoping Gao): writing—review and editing—and resources. L.S.: writing—review and editing—and resources. L.L.: writing—review and editing, resources, funding acquisition, and methodology. X.G. (Xiaoling Gong): writing—review and editing, supervision, project administration, methodology, funding acquisition, and conceptualization. All authors have read and agreed to the published version of the manuscript.

Funding

This research was supported by the Special Funding for the Survey and Monitoring System of Aquatic Biological Resources in Jiangxi Province (No. JXSSJC-2024-03) and the Special Research Funding for the Fish Diversity and Ecological Niches in Priority Waters of Jiujiang City (No. D-8006-24-0452).

Institutional Review Board Statement

The animal study protocol was approved by the Committee on Laboratory Animal Welfare and Ethics of Shanghai Ocean University (protocol code: SHOU-DW-2022-012; date of approval: 4 January 2022).

Informed Consent Statement

Not applicable.

Data Availability Statement

The original contributions presented in this study are included in the article. Further inquiries can be directed to the corresponding authors.

Conflicts of Interest

The authors declare no conflicts of interest.

References

  1. Fu, C.; Wu, J.H.; Chen, J.K.; Wu, Q.H.; Lei, G.C. Freshwater Fish Biodiversity in the Yangtze River Basin of China: Patterns, Threats and Conservation. Biodivers. Conserv. 2003, 12, 1649–1685. [Google Scholar] [CrossRef]
  2. Xie, P. Three-Gorges Dam: Risk to Ancient Fish. Science 2003, 302, 1149–1151. [Google Scholar] [CrossRef]
  3. Jiangxi Provincial Local Chronicles Compilation Committee. Physical Geography of Jiangxi Province; Local Gazetteers Press: Beijing, China, 2003; ISBN 978-7-80122-914-4. [Google Scholar]
  4. Feng, L.; Hu, C.; Chen, X.; Cai, X.; Tian, L.; Gan, W. Assessment of Inundation Changes of Poyang Lake Using MODIS Observations between 2000 and 2010. Remote Sens. Environ. 2012, 121, 80–92. [Google Scholar] [CrossRef]
  5. Zhang, T.L.; Li, Z.J. Fish Resources and Fishery Utilization of Lake Poyang. J. Lake Sci. 2007, 19, 434–444. [Google Scholar] [CrossRef]
  6. Froese, R.; Pauly, D. FishBase. Available online: https://www.fishbase.se (accessed on 22 May 2025).
  7. Chen, J.; Liu, H.; Gooneratne, R.; Wang, Y.; Wang, W. Population Genomics of Megalobrama Provides Insights into Evolutionary History and Dietary Adaptation. Biology 2022, 11, 186. [Google Scholar] [CrossRef]
  8. Huang, D.M.; Lin, Y.T.; Wan, C.Y.; Liu, Y.J. Reproductive Biology of the Fish, Megalobrama skolkovii, in Fuqiaohe Reservoir. Acta Hydrobiol. Sin. 1997, 21, 15–23. [Google Scholar] [CrossRef]
  9. Xu, W.; Xiong, B.X.; Cheng, Z.X.; Wang, D.W.; Ying, C.G. Growth and Fecundity of Megalobrama skolkovii in the Xujiahe Reservoir of Hubei, China. Chin. J. Appl. Environ. Biol. 2010, 16, 91–95. [Google Scholar] [CrossRef]
  10. Kong, C.; Luo, Y.; Xu, Q.; Zhang, B.; Gao, X.; Wang, X.; Luo, Z.; Luo, Z.; Li, L.; Gong, X. Post-Fishing Ban Period: The Fish Diversity and Community Structure in the Poyang Lake Basin, Jiangxi Province, China. Animals 2025, 15, 433. [Google Scholar] [CrossRef] [PubMed]
  11. Zhang, H.; Jarić, I.; Roberts, D.L.; He, Y.; Du, H.; Wu, J.; Wang, C.; Wei, Q. Extinction of One of the World’s Largest Freshwater Fishes: Lessons for Conserving the Endangered Yangtze Fauna. Sci. Total Environ. 2020, 710, 136242. [Google Scholar] [CrossRef] [PubMed]
  12. Turvey, S.T.; Pitman, R.L.; Taylor, B.L.; Barlow, J.; Akamatsu, T.; Barrett, L.A.; Zhao, X.; Reeves, R.R.; Stewart, B.S.; Wang, K.; et al. First Human-Caused Extinction of a Cetacean Species? Biol. Lett. 2007, 3, 537–540. [Google Scholar] [CrossRef] [PubMed]
  13. Du, J.; Tian, H.; Xiang, Z.; Zhao, K.; Yu, L.; Duan, X.; Chen, D.; Xu, J.; Liu, M. Impact of the Fishing Ban on Fish Diversity and Population Structure in the Middle Reaches of the Yangtze River, China. Front. Environ. Sci. 2025, 12, 1530716. [Google Scholar] [CrossRef]
  14. Chen, T.; Wang, Y.; Gardner, C.; Wu, F. Threats and Protection Policies of the Aquatic Biodiversity in the Yangtze River. J. Nat. Conserv. 2020, 58, 125931. [Google Scholar] [CrossRef]
  15. Wang, H.; Chen, J.; Wang, P.; Jeppesen, E.; Xie, P. How to Manage Fish within and after the 10-Year Fishing Ban. Innovation 2024, 5, 100694. [Google Scholar] [CrossRef]
  16. Han, Y.Q.; He, A.Y.; Shi, J.; Wang, D.P.; Wu, W.J.; Lei, J.J.; Li, Y.S. Effect Evaluation of Three-Year Fishing Ban in Pearl River Waters (Guangxi Section). Fish. Sci. Technol. Inf. 2015, 42, 135–139. [Google Scholar] [CrossRef]
  17. Xia, Z.J.; Liu, F.; Yu, F.D.; Tang, R.; Wang, J.W. Species, Functional and Taxonomic Diversity of Fish in the Chishui River Basin. J. Hydroecol. 2022, 43, 89–98. [Google Scholar] [CrossRef]
  18. Beamish, R.J.; McFarlane, G.A. The Forgotten Requirement for Age Validation in Fisheries Biology. Trans. Am. Fish. Soc. 1983, 112, 735–743. [Google Scholar] [CrossRef]
  19. Froese, R. Cube Law, Condition Factor and Weight-Length Relationships: History, Meta-Analysis and Recommendations. J. Appl. Ichthyol. 2006, 22, 241–253. [Google Scholar] [CrossRef]
  20. Munro, J.L.; Pauly, D. A Simple Method for Comparing the Growth of Fishes and Invertebrates. Fishbyte 1983, 1, 5–6. [Google Scholar]
  21. Branstetter, S. Age and Growth Estimates for Blacktip, Carcharhinus Limbatus, and Spinner, C. Brevipinna, Sharks from the Northwestern Gulf of Mexico. Copeia 1987, 1987, 964. [Google Scholar] [CrossRef]
  22. Pauly, D.; Munro, J.L. Once More on the Comparison of Growth in Fishes and Invertebrates. Fishbyte 1984, 2, 21. [Google Scholar]
  23. Snedecor, G.W.; Cochran, W.G. Statistical Methods, 8th ed.; Iowa State University Press: Ames, IA, USA, 1996; ISBN 978-0-8138-1561-9. [Google Scholar]
  24. Sturges, H.A. The Choice of a Class Interval. J. Am. Stat. Assoc. 1926, 21, 65–66. [Google Scholar] [CrossRef]
  25. Gayanilo, F.C.; Sparre, P.; Pauly, D. FAO-ICLARM Stock Assessment Tools II: User’s Guide; FAO Computerized Information Series Fisheries; Rev. Version; Worldfish Center: Rome, Italy, 2005; ISBN 978-92-5-105300-3. [Google Scholar]
  26. Pauly, D. On the Interrelationships between Natural Mortality, Growth Parameters, and Mean Environmental Temperature in 175 Fish Stocks. ICES J. Mar. Sci. 1980, 39, 175–192. [Google Scholar] [CrossRef]
  27. Wu, B.; Fang, C.L.; Zhang, Y.P.; Fu, P.F.; Chen, W.J.; Xiong, X.Y.; Zhou, H.M.; He, G.; Wang, S.; Wang, Q.P. The Assessment of Biological Parameters and Stock Biomass of Siniperca Chuatsi in the Poyang Lake. Prog. Fish. Sci. 2015, 36, 21–26. [Google Scholar]
  28. Chen, M.; Zeng, S.; Jiang, B.; Wen, Z.; Wu, J.; Xia, J. The Comprehensive Evaluation of How Water Level Fluctuation and Temperature Change Affect Vegetation Cover Variations at a Lake of Ecological Importance (Poyang Lake), China. Ecol. Indic. 2023, 148, 110041. [Google Scholar] [CrossRef]
  29. Tian, M.; Mao, J.; Wang, K.; Xu, D. Spatio-Temporal Heterogeneity of Ecological Water Level in Poyang Lake, China. Ecol. Inform. 2024, 82, 102694. [Google Scholar] [CrossRef]
  30. Peng, Y.; Chen, G.; Chao, N.; Wang, Z.; Wu, T.; Luo, X. Detection of Extreme Hydrological Droughts in the Poyang Lake Basin during 2021–2022 Using GNSS-Derived Daily Terrestrial Water Storage Anomalies. Sci. Total Environ. 2024, 919, 170875. [Google Scholar] [CrossRef] [PubMed]
  31. Tian, C.; Zhong, J.; You, Q.; Fang, C.; Hu, Q.; Liang, J.; He, J.; Yang, W. Land Use Modeling and Habitat Quality Assessment under Climate Scenarios: A Case Study of the Poyang Lake Basin. Ecol. Indic. 2025, 172, 113292. [Google Scholar] [CrossRef]
  32. Gulland, J.A. Fish Stock Assessment: A Manual of Basic Methods; FAO/Wiley Series on Food and Agriculture; Wiley: Chichester, NY, USA, 1983; ISBN 978-0-471-90027-6. [Google Scholar]
  33. Beverton, R.J.H. Patterns of Reproductive Strategy Parameters in Some Marine Teleost Fishes. J. Fish Biol. 1992, 41, 137–160. [Google Scholar] [CrossRef]
  34. Froese, R. Keep It Simple: Three Indicators to Deal with Overfishing. Fish Fish. 2004, 5, 86–91. [Google Scholar] [CrossRef]
  35. Herrón, P.; Mildenberger, T.K.; Díaz, J.M.; Wolff, M. Assessment of the Stock Status of Small-Scale and Multi-Gear Fisheries Resources in the Tropical Eastern Pacific Region. Reg. Stud. Mar. Sci. 2018, 24, 311–323. [Google Scholar] [CrossRef]
  36. Cope, J.M.; Punt, A.E. Length-Based Reference Points for Data-Limited Situations: Applications and Restrictions. Mar. Coast. Fish. 2009, 1, 169–186. [Google Scholar] [CrossRef]
  37. Beverton, R.J.H.; Holt, S.J. On the Dynamics of Exploited Fish Populations; Springer: Dordrecht, The Netherlands, 1993; ISBN 978-94-010-4934-4. [Google Scholar]
  38. Gheshlaghi, P.; Vahabnezhad, A.; Taghavi Motlagh, S.A. Growth Parameters, Mortality Rates, Yield per Recruit, Biomass, and MSY of Rutilus Frisii Kutum, Using Length Frequency Analysis in the Southern Parts of the Caspian Sea. Iran. J. Fish. Sci. 2012, 11, 48–62. [Google Scholar]
  39. Ohlberger, J.; Langangen, Ø.; Stige, L.C. Age Structure Affects Population Productivity in an Exploited Fish Species. Ecol. Appl. 2022, 32, e2614. [Google Scholar] [CrossRef] [PubMed]
  40. Hixon, M.A.; Johnson, D.W.; Sogard, S.M. BOFFFFs: On the Importance of Conserving Old-Growth Age Structure in Fishery Populations. ICES J. Mar. Sci. 2014, 71, 2171–2185. [Google Scholar] [CrossRef]
  41. Pauly, D.; Christensen, V.; Guénette, S.; Pitcher, T.J.; Sumaila, U.R.; Walters, C.J.; Watson, R.; Zeller, D. Towards Sustainability in World Fisheries. Nature 2002, 418, 689–695. [Google Scholar] [CrossRef]
  42. Abecasis, D.; Ogden, R.; Winkler, A.C.; Gandra, M.; Khallahi, B.; Diallo, M.; Cabrera-Castro, R.; Weiller, Y.; Erzini, K.; Afonso, P.; et al. Multidisciplinary Estimates of Connectivity and Population Structure Suggest the Use of Multiple Units for the Conservation and Management of Meagre, Argyrosomus regius. Sci. Rep. 2024, 14, 873. [Google Scholar] [CrossRef] [PubMed]
  43. Pikitch, E.K.; Santora, C.; Babcock, E.A.; Bakun, A.; Bonfil, R.; Conover, D.O.; Dayton, P.; Doukakis, P.; Fluharty, D.; Heneman, B.; et al. Ecosystem-Based Fishery Management. Science 2004, 305, 346–347. [Google Scholar] [CrossRef]
  44. Miranda, L.E. Fish Size Structure Analysis via Ordination: A Visualization Aid. N. Am. J. Fish. Manag. 2024, 44, 763–775. [Google Scholar] [CrossRef]
  45. Barua, S.; Liu, Q.; Rabby, A.F.; Al-Mamun, M.A.; Chen, X.; Sultana, R.; Baloch, A. Stock Appraisal for Atlantic Tripletail (Lobotes surinamensis; Bloch, 1790) in the Bay of Bengal, Bangladesh. J. Ocean. Limnol. 2024, 42, 1683–1694. [Google Scholar] [CrossRef]
  46. Barua, S.; Liu, Q.; Alam, M.S.; Kanak, M.K.; Ali, M.M. Population Dynamics and Stock Assessment of Red Snapper (Lutjanus johnii) in the Bay of Bengal Bangladesh Waters. Reg. Stud. Mar. Sci. 2023, 63, 102983. [Google Scholar] [CrossRef]
  47. Hard, J.J.; Gross, M.R.; Heino, M.; Hilborn, R.; Kope, R.G.; Law, R.; Reynolds, J.D. Evolutionary Consequences of Fishing and Their Implications for Salmon. Evol. Appl. 2008, 1, 388–408. [Google Scholar] [CrossRef]
  48. Hutchings, J.A. Life History Consequences of Overexploitation to Population Recovery in Northwest Atlantic Cod (Gadus morhua). Can. J. Fish. Aquat. Sci. 2005, 62, 824–832. [Google Scholar] [CrossRef]
  49. Clark, W.G.; Hare, S.R. Assessment and Management of Pacific Halibut: Data, Methods, and Policy; International Pacific Halibut Commission: Seattle, WA, USA, 2006. [Google Scholar]
  50. Kuparinen, A.; Merilä, J. Detecting and Managing Fisheries-Induced Evolution. Trends Ecol. Evol. 2007, 22, 652–659. [Google Scholar] [CrossRef] [PubMed]
  51. Shao, H.W.; Lu, W.K.; Li, M.Z.; Liu, H.Z. Evaluation of Fishing Ban Effect in the Poyang Lake Based on Fish Body Length Structure Analysis. Acta Hydrobiol. Sin. 2025, 49, 052502. [Google Scholar] [CrossRef]
  52. Quince, C.; Abrams, P.A.; Shuter, B.J.; Lester, N.P. Biphasic Growth in Fish I: Theoretical Foundations. J. Theor. Biol. 2008, 254, 197–206. [Google Scholar] [CrossRef]
  53. Feng, K.; Deng, W.; Li, H.; Guo, Q.; Tao, K.; Yuan, J.; Liu, J.; Li, Z.; Lek, S.; Hugueny, B.; et al. Direct and Indirect Effects of a Fishing Ban on Lacustrine Fish Community Do Not Result in a Full Recovery. J. Appl. Ecol. 2023, 60, 2210–2222. [Google Scholar] [CrossRef]
  54. Lester, S.; Halpern, B.; Grorud-Colvert, K.; Lubchenco, J.; Ruttenberg, B.; Gaines, S.; Airamé, S.; Warner, R. Biological Effects within No-Take Marine Reserves: A Global Synthesis. Mar. Ecol. Prog. Ser. 2009, 384, 33–46. [Google Scholar] [CrossRef]
  55. Pauly, D.; Christensen, V.; Dalsgaard, J.; Froese, R.; Torres, F. Fishing Down Marine Food Webs. Science 1998, 279, 860–863. [Google Scholar] [CrossRef]
  56. Sass, G.G.; Kitchell, J.F.; Carpenter, S.R.; Hrabik, T.R.; Marburg, A.E.; Turner, M.G. Fish Community and Food Web Responses to a Whole-Lake Removal of Coarse Woody Habitat. Fisheries 2006, 31, 321–330. [Google Scholar] [CrossRef]
  57. Cao, L.W.; Chen, X.L.; Zhao, J. Studies on Age and Growth of Megalobrama skolkovii in the Nanshui Reservoir. Fish. Sci. 2001, 20, 11–14. [Google Scholar] [CrossRef]
  58. Wang, Y.Z.; Song, W.; Zhu, D.M.; Ren, L.; Wang, W.M. Age and Growth Characteristic of Megalobrama skolkovii in Beijiang River. Freshw. Fish. 2013, 43, 35–39. [Google Scholar] [CrossRef]
  59. Zhu, S.L.; Li, X.H.; Li, Y.F.; Liu, Y.Q.; Wu, Z.; Xia, Y.G.; Li, J. Population Structure and Growth Differences of Megalobrama terminalis from Different Water Areas in Middle and Lower Reaches of Pearl River. J. Huazhong Agric. Univ. 2023, 42, 75–81. [Google Scholar] [CrossRef]
  60. He, M.F.; Li, X.H.; Tan, X.C.; Li, J.; Wang, C.; Luo, J.R.; Lin, J.Z. Age Determination and the Growth of Megalobrama hoffmanni in Xijiang River. Freshw. Fish. 2007, 37, 54–58. [Google Scholar] [CrossRef]
  61. Shao, X.Y. Research on the Legal System for Sustainable Development of Aquatic Species in the Yangtze River under the Background of the Yangtze River Protection Law. OJLS 2024, 12, 1359–1367. [Google Scholar] [CrossRef]
  62. Amezcua, F.; Madrid-Vera, J.; Aguirre, H. Incidental Capture of Juvenile Fish from an Artisanal Fishery in a Coastal Lagoon in the Gulf of California. N. Am. J. Fish. Manag. 2009, 29, 245–255. [Google Scholar] [CrossRef]
  63. Shalehin, M.S.; Parvez, M.T.; Lucas, M.C.; Galib, S.M. A Case Study of Illegal Fishing Causes during Seasonal Fishery Closure in Kaptai Lake, Bangladesh. Fish. Manag. Ecol. 2022, 29, 542–551. [Google Scholar] [CrossRef]
  64. Martins, G.M.; Jenkins, S.R.; Hawkins, S.J.; Neto, A.I.; Medeiros, A.R.; Thompson, R.C. Illegal Harvesting Affects the Success of Fishing Closure Areas. J. Mar. Biol. Assoc. UK 2011, 91, 929–937. [Google Scholar] [CrossRef]
  65. Hilborn, R.; Walters, C.J. Quantitative Fisheries Stock Assessment; Springer: Boston, MA, USA, 1992; ISBN 978-1-4020-1845-9. [Google Scholar]
  66. Agnew, D.J.; Pearce, J.; Pramod, G.; Peatman, T.; Watson, R.; Beddington, J.R.; Pitcher, T.J. Estimating the Worldwide Extent of Illegal Fishing. PLoS ONE 2009, 4, e4570. [Google Scholar] [CrossRef] [PubMed]
  67. Alam, M.S.; Liu, Q.; Nabi, M.R.-U.; Chowdhury, M.Z.R.; Duc-Hieu, N.T. Length-Based Indicators for the Sustainability of Small-Scale Fisheries in the Northern Bay of Bengal Coast, Bangladesh. Reg. Stud. Mar. Sci. 2022, 51, 102177. [Google Scholar] [CrossRef]
  68. Kell, L.T.; Minto, C.; Gerritsen, H.D. Evaluation of the Skill of Length-Based Indicators to Identify Stock Status and Trends. ICES J. Mar. Sci. 2022, 79, 1202–1216. [Google Scholar] [CrossRef]
  69. Vasilakopoulos, P.; O’Neill, F.G.; Marshall, C.T. Misspent Youth: Does Catching Immature Fish Affect Fisheries Sustainability? ICES J. Mar. Sci. 2011, 68, 1525–1534. [Google Scholar] [CrossRef]
  70. Taylor, J.J.; Rytwinski, T.; Bennett, J.R.; Smokorowski, K.E.; Lapointe, N.W.R.; Janusz, R.; Clarke, K.; Tonn, B.; Walsh, J.C.; Cooke, S.J. The Effectiveness of Spawning Habitat Creation or Enhancement for Substrate-Spawning Temperate Fish: A Systematic Review. Environ. Evid. 2019, 8, 19. [Google Scholar] [CrossRef]
  71. Pomeroy, R.S.; Berkes, F. Two to Tango: The Role of Government in Fisheries Co-Management. Mar. Policy 1997, 21, 465–480. [Google Scholar] [CrossRef]
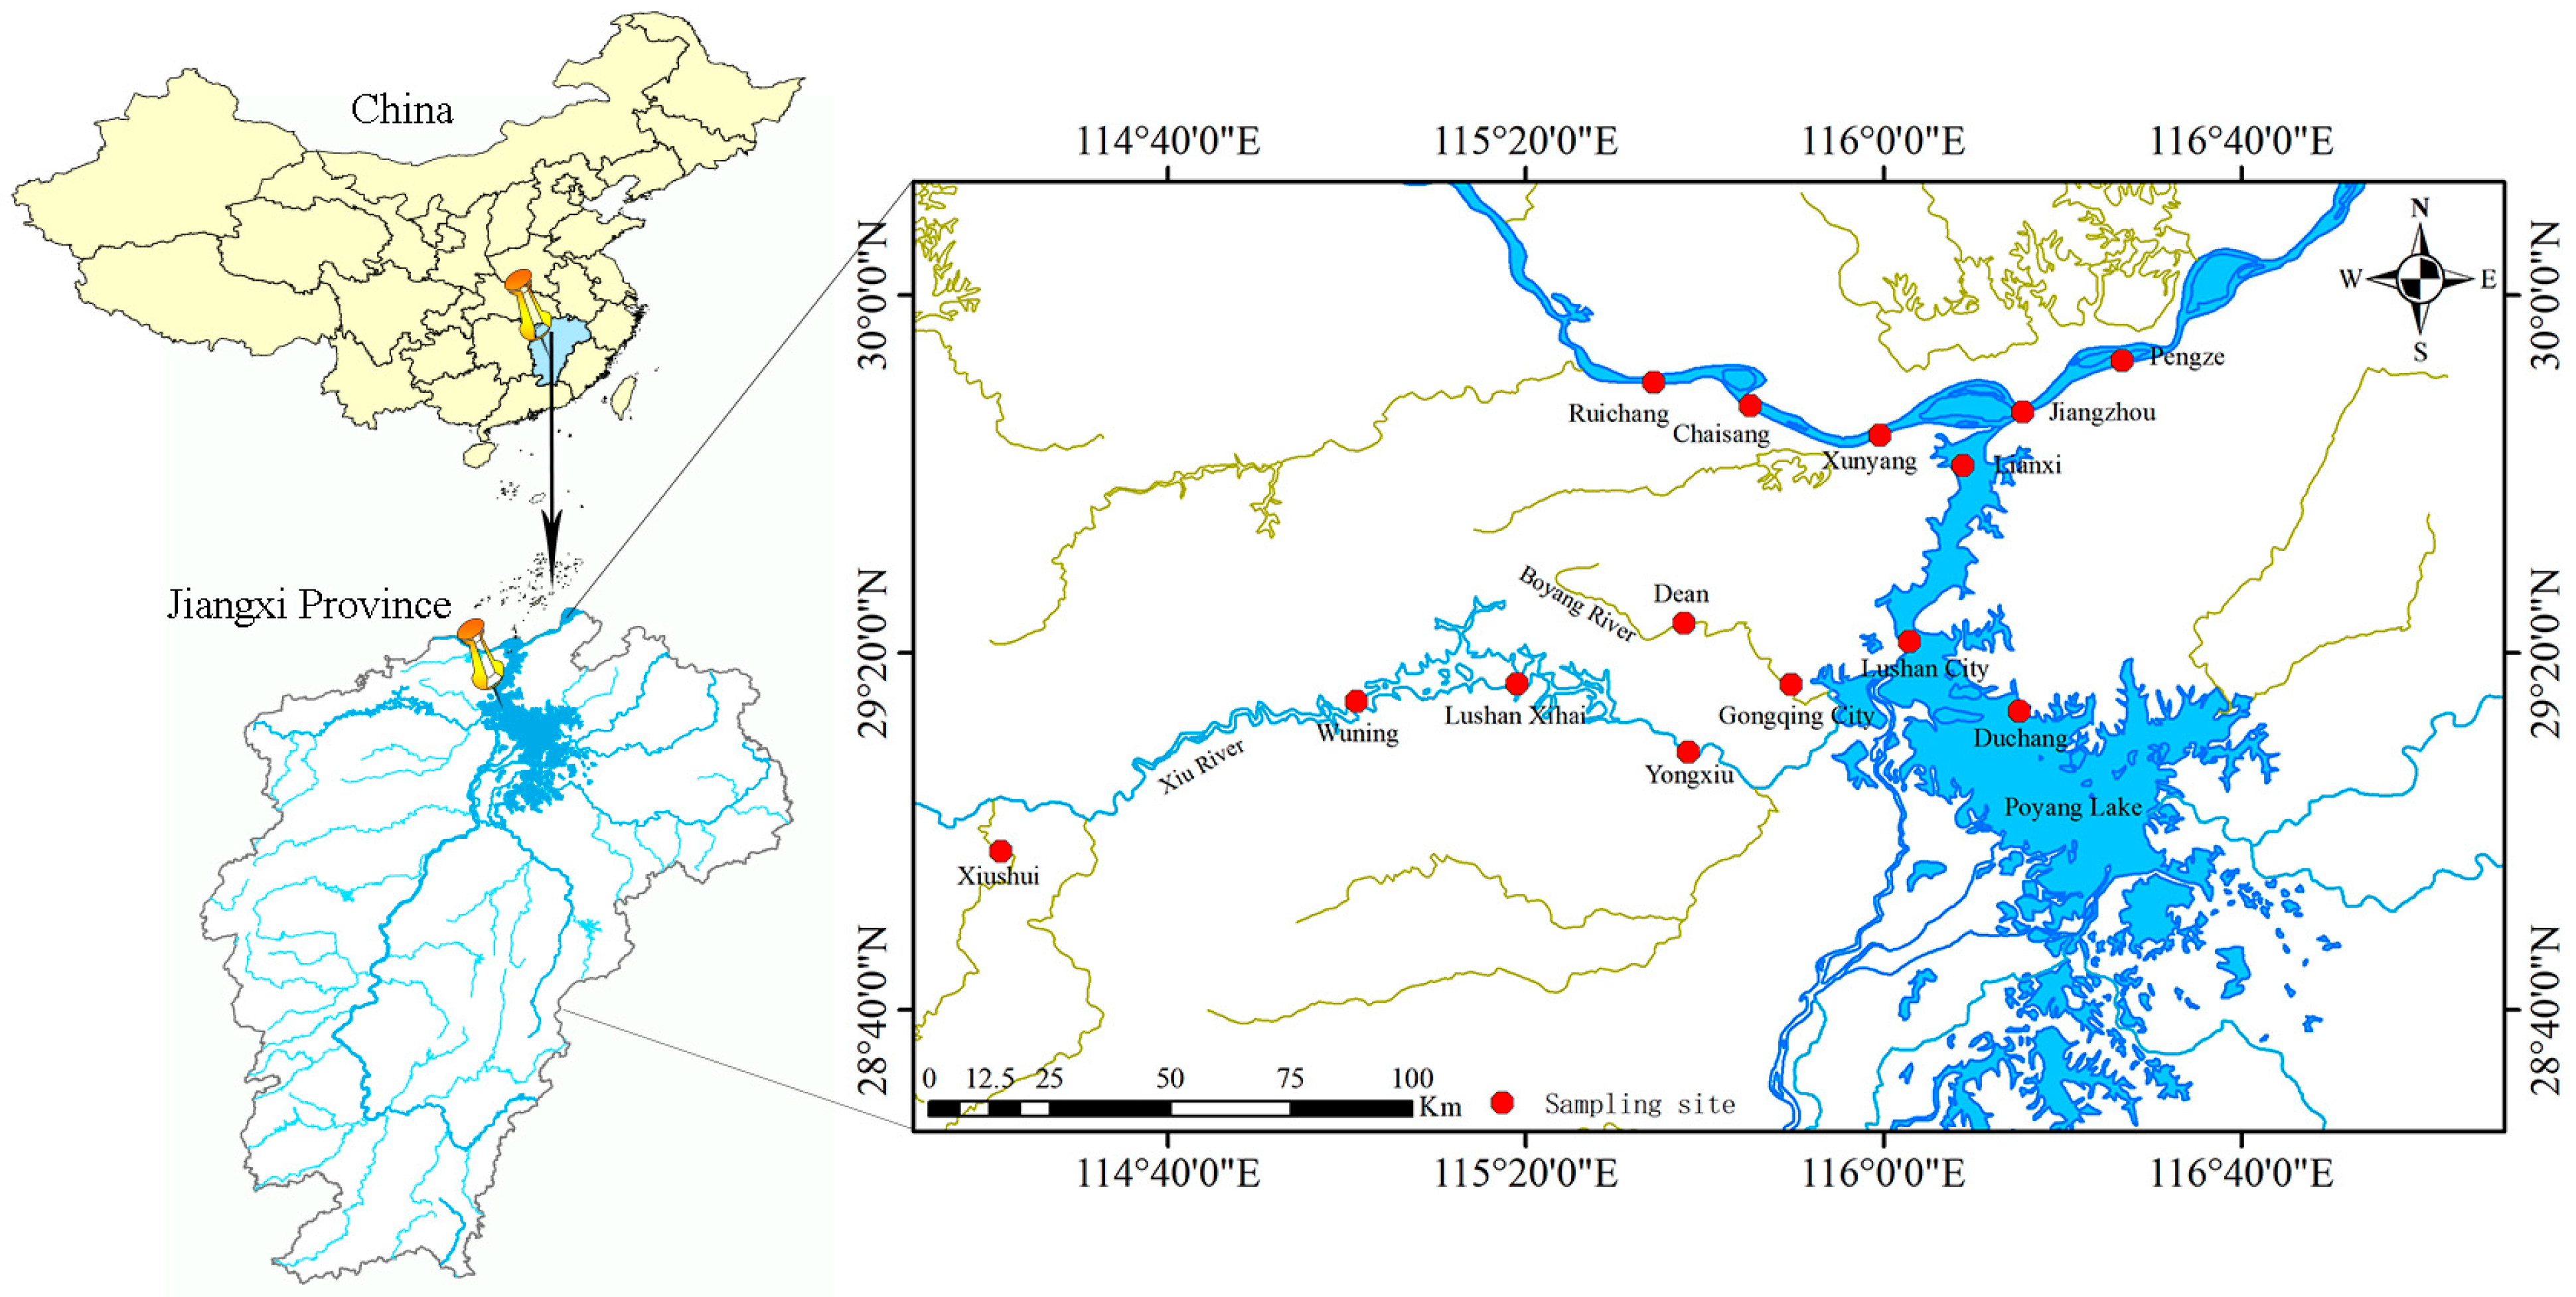
Figure 1. Sampling locations for fish collection in 2024 across the Poyang Lake Basin. Red dots indicate sampling sites.
Fishes 10 00378 g001
Figure 2. Age composition of M. skolkovii specimens collected from the Poyang Lake Basin in 2024.
Fishes 10 00378 g002
Figure 3. Standard length (a) and body weight (b) distributions of M. skolkovii in the Poyang Lake Basin in 2024.
Fishes 10 00378 g003
Figure 4. Length–weight relationship of M. skolkovii in the Poyang Lake Basin in 2024.
Fishes 10 00378 g004
Figure 5. Von Bertanlanffy growth curves of M. skolkovii in the Poyang Lake Basin in 2024. The black line represents the standard length growth curve, while the red line represents the body weight growth curve.
Fishes 10 00378 g005
Figure 6. Growth rate and acceleration curves of standard length (a) and body weight (b) for M. skolkovii in the Poyang Lake Basin in 2024. (a) The black line represents the growth rate of standard length, and the red line represents the growth acceleration of standard length. (b) The black line represents the growth rate of body weight, and the red line represents the growth acceleration of body weight.
Fishes 10 00378 g006
Figure 7. Estimation of total mortality using the length-converted catch curve. Relative age refers to the age values converted from length data, rather than actual observed ages.
Fishes 10 00378 g007
Figure 8. Length frequency distribution and Froese length-based indicators for M. skolkovii in the Poyang Lake Basin in 2024. Lm indicates the length at first maturity; Lopt denotes the length range associated with optimal yield; Lmax represents the maximum observed size among the sampled individuals.
Fishes 10 00378 g008
Figure 9. Logistic selectivity curve for M. skolkovii in the Poyang Lake Basin in 2024, showing the relationship between probability of capture and standard length.
Fishes 10 00378 g009
Figure 10. Relationship among relative yield per recruit (Y′/R), exploitation rate (E), and length at first capture (Lc) for M. skolkovii in the Poyang Lake Basin in 2024. Point A is an illustrative reference point for the hypothetical low-exploitation scenario (E ≈ 0.13) and does not depict an empirical estimate of the current status, point B indicates the theoretical maximum Y′/R under high exploitation. These model outputs are intended for conceptual reference only.
Fishes 10 00378 g010
Table 1. Sample distribution of M. skolkovii collected in different seasons and regions in the Poyang Lake Basin in 2024.
CategorySubcategorySample Size (n)
SeasonSpring312
Summer496
Autumn789
RegionJiangxi section of the Yangtze River mainstem699
Northern Poyang Lake706
Xiu River79
Boyang River113
Total\1597
Table 2. Length-based stock status indicators and risk-based reference point evaluation for M. skolkovii.
Lm (cm)Lopt (cm)PmatPoptPmegaPobjStock ConditionProbability of BeingSB < RP
25.5337.7846.05%9.51%6.88%62.44%SB > RP4% for TRP and 2% for LRP
Note: SB: spawning biomass; RP: reference point; TRP: target reference point, defined as RP = 0.4 SB0; LRP: limit reference point, defined as RP = 0.25 SB0; SB0: unfished (virgin) spawning biomass.
Table 3. Changes in standard length of M. skolkovii population in the Poyang Lake Basin.
YearStandard Length Range (cm)Mean Standard Length ± SD (cm)
2017–20194.1–78.917.8 ± 10.9
2021–20225.8–56.320.0 ± 6.3
20243.7–53.520.6 ± 11.9
Disclaimer/Publisher’s Note: The statements, opinions and data contained in all publications are solely those of the individual author(s) and contributor(s) and not of MDPI and/or the editor(s). MDPI and/or the editor(s) disclaim responsibility for any injury to people or property resulting from any ideas, methods, instructions or products referred to in the content.