Article

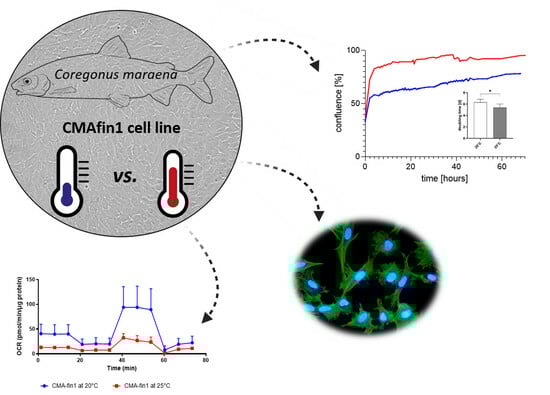
Morphological and Metabolic Adaptations to Increasing Temperature: Insights from the In Vitro Model of Maraena Whitefish

1
Workgroup Fish Growth Physiology, Research Institute for Farm Animal Biology (FBN), 18196 Dummerstorf, Germany
2
Workgroup Endocrinology of Farm Animals, Research Institute for Farm Animal Biology (FBN), 18196 Dummerstorf, Germany
3
Institute of Physiology, University Medicine Greifswald, 17489 Greifswald, Germany
*
Authors to whom correspondence should be addressed.
Fishes 2025, 10(7), 352; https://doi.org/10.3390/fishes10070352
Submission received: 30 May 2025 / Revised: 11 July 2025 / Accepted: 14 July 2025 / Published: 16 July 2025
(This article belongs to the Section Physiology and Biochemistry)

Abstract

Physiological changes in animals induced by environmental shifts in aquatic ecosystems can be studied using fish cell lines derived from vulnerable species. Therefore, we investigated how environmental shifts—specifically, an increase of 5 °C in temperature—impact the physiology of the cell line CMAfin1 derived from maraena whitefish (Coregonus maraena). Cellular growth, morphology, and metabolic responses were examined under two growth conditions: a control temperature of 20 °C and an elevated temperature of 25 °C. Using trypan blue staining, automated cell counting, phase contrast microscopy, and actin staining, we observed morphological changes in the cells. Metabolic functions were assessed using a Seahorse XFe96 Flux Analyzer, focusing on the bioenergetic capacities of mitochondrial respiration and glycolytic activity. Hyperthermia resulted in faster growth rates but reduced cell size in the CMAfin1 cell line. The cells’ metabolic activity (mitochondrial respiration and glycolytic activity) was inhibited, leading to a quiescent energy state. Our findings indicate reduced motility and altered intercellular communication at higher temperatures. The results highlight the potential of in vitro models to study environmental stress on fish physiology and emphasize the value of fish cell lines for understanding metabolic responses.
Key Contribution: CMAfin1 cells can serve as a suitable in vitro model for Coregonus maraena with the potential of using in vitro models in fish research.

Graphical Abstract

1. Introduction

Global warming has become one of the most pressing issues of our time [1]. Climate change leads to negative ecosystem effects, particularly evident in aquatic ecosystems due to increased water temperatures and reduced oxygen levels [2,3]. One area affected by the impacts of climate change is the Baltic Sea, a marginal sea and therefore unique and fragile marine ecosystem [4]. Baltic Sea temperature increase is of special interest because the rate of warming is three times higher than in other oceans and can be used as a model for other marine ecosystems [5]. Furthermore, this marginal sea has been threatened by multiple stressors such as pollution, acidification, and migration of invasive species that lead to rapid habitat changes and degradation [5,6]. It is common knowledge that the prevailing conditions in the Baltic Sea include, besides the increasing temperatures, a sharp decrease in size of fish populations due to intensive fishing, the fragmentation of habitats by shipping, and the eutrophication of the Baltic Sea and its tributaries [4,7]. One of these fish species is the economically important maraena whitefish (Coregonus maraena), which was listed as vulnerable for many years and, since 2024, has been classified as least concern on the IUCN Red List [8,9]. Water pollution, alterations of natural systems, climate change, as well as fishing and harvesting, continue to pose serious threats [9]. The C. maraena, a salmonid, lives along the coast of the Baltic Sea with spawning areas in estuaries and rivers. As demonstrated in several experiments, for whitefish, a water temperature of 26 °C is lethal [10,11,12,13,14]. The direct contact of marine animals with altered water temperature leads to physiological changes in the different species, especially in fish [15,16]. In previous studies, C. maraena was considered highly susceptible to thermal stress and high stock density [14,17,18]. Rebl et al. (2018), who investigated the gradual and acute hyperthermia tolerance of adult fish in aquaculture facilities, confirmed the low resistance of this salmonid to environmental stressors [10]. This sensitivity is further underscored by the fact that alterations in metabolism depend on environmental temperature [19]. As demonstrated by Kim and colleagues (2005), ectothermic animals like fish respond with altered metabolic activities to low or high temperatures, which lead to lethal limits [20]. These thermal changes have been reported to bring shifts in locomotive activity [21], swimming speed [22], osmotic balance [23], growth rate [24,25,26], as well as the oxygen consumption rate (OCR) [20,27,28]. The impact of rising temperatures, as a model for global warming, on aquatic species has rarely been studied at the level of cellular physiology and therefore remains poorly understood. For example, previous studies on cell lines from species such as rainbow trout (Oncorhynchus mykiss) [29], grass carp (Ctenopharyngodon idella) [30], American eel (Anguilla rostrata) [31], and Atlantic sturgeon (Acipenser oxyrinchus) [32] have demonstrated that cell models are invaluable tools for investigating the physiological characteristics of fish and to understand species-specific responses to temperature change in more detail. To address this on C. maraena, we utilized the fin derived cell line CMAfin1 [8,33,34]. Fish cell lines serve as essential tools in aquaculture-related research, helping to reduce the number of in vivo experiments and ex vivo cell cultures for necessary experimental approaches, thereby adhering to the 3Rs (Replace, Reduce, Refine) principle [35,36]. Additionally, fish-derived cell cultures were employed as an animal-free alternative to traditional ecotoxicological assessments, replacing invasive tests conducted on live fish [37,38].
Espinosa-Ruiz et al. (2022) used Seahorse technology to assess mitochondrial status and plasticity of four fish cell lines, highlighting their bioenergetic potential and the importance of selecting appropriate cell models for in vitro studies [39]. Building on established approaches in human medicine that use human and murine cell models to study hyperthermia [40,41,42,43], the CMAfin1 cell model enables investigation of heat-induced cellular effects. Characterized by stem cell properties and the ability to differentiate into cells of all three germ layers [34], CMAfin1 cells offer high stability, ease of handling, and suitability for standardized assays. This study aimed to examine the impact of elevated water temperatures on cell growth and energy metabolism in C. maraena. To this end, CMAfin1 cells were cultured under two defined conditions: at 20 °C (control) and 25 °C (heat-stress), the latter approaching the species’ lethal threshold (26 °C). To assess the impact of thermal stress on cellular functions of this cell model, we examined cellular growth using trypan blue staining and automated cell counting, morphological changes using phase-contrast microscopy, and immunofluorescence staining. The metabolic functions were evaluated by Seahorse technology, focusing on mitochondrial respiration and glycolytic capacity. This study underscores the importance of understanding species responses to increasing water temperatures and illustrates the potential of such cell lines for applications in fish biology research and aquaculture.

2. Materials and Methods

2.1. Cell Cultivation

CMAfin1 cells derived from the dorsal fin of a 26-month-old female C. maraena were cultivated in growth medium containing Gibco® Leibovitz-15 Medium (L-15, Thermo Fisher, Darmstadt, Germany), 10% foetal bovine serum (FBS, PAN-Biotech, Aidenbach, Germany) and 1% (v/v) Gibco® penicillin/streptomycin (Thermo Fisher, Darmstadt, Germany) at 20 °C [34]. Previous studies have demonstrated that this cell line contains stem cells and possesses the potential to differentiate into cell types derived from all three germ layers [33,34]. A cultivation temperature of 20 °C proved optimal for the CMAfin1 cell lines, as indicated by the results on cell growth, viability, and metabolic activity [33,34]. When the cells reached a high density of 90%, they were washed with Dulbecco’s Phosphate-buffered Saline (PBS, PAN-Biotech, Aidenbach, Germany) and subcultured at a ratio of 1:2 with 0.1% Gibco® trypsin/EDTA (Thermo Fisher, Darmstadt, Germany) solution for 2 min at room temperature [34,44]. For cryopreservation, CMAfin1 cells were trypsinized and approximately 1.2 million cells were resuspended in a freezer container in 1 mL of ice-cold freezing medium (Dimethyl sulphoxide (DMSO, Merck-Sigma, Taufkirchen, Germany):FBS in a ratio of 1:9), stored at −80 °C and after at least 24 h in liquid nitrogen [45].

2.2. Temperature Adaptation

Starting from cultured cells at 20 °C, adaptation to hyperthermic conditions was not feasible through a direct temperature shift to 25 °C, as the cells died immediately under these conditions. Therefore, the cells used in this study were adjusted by increasing the temperature by 1 °C per week to 25 °C. Over the five-week timeframe, the cells were subcultured as described above from passage P27 to P31. There were no differences in cell handling or culture medium between the two temperature conditions. Only cells that had undergone long-term adaptation—defined as being cultured at 25 °C for a minimum of three passages (P32 to P35; at least 30 days)—were used in this study. The adaptation showed that freezing and thawing at both temperatures was feasible, with no observable differences in cell viability. The viability of the cells was 97.89 ± 1.31% at 20 °C and 97.35 ± 1.33% at 25 °C. Long-term temperature-adapted CMAfin1 cells, ranging from passages P35 to P53 and subjected to freeze–thaw cycles, were used for the subsequent experiments. Following thawing, cells were routinely passaged twice before being used in the experiment.

2.3. Phase Contrast Pictures

To analyze the morphology of the CMAfin1 cells at 20 °C and 25 °C, phase-contrast microscopic pictures (AE2000, Motic®, Barcelona, Spain) of cells cultivated in a T75 flask (TPP, Trasadingen, Schweiz) were taken after 24 h and at day seven directly from the flask. Pictures were taken with the Moticam 5 Plus in combination with Motic Images Plus 3.0 Software (Motic®, Barcelona, Spain) and further processed with Adobe Photoshop CC 2019 (Adobe Inc., San Jose, CA, USA) for brightness and contrast adjustments.

2.4. Immunofluorescent Staining

Further morphological cell changes were visualized by actin staining with Phalloidin-iFluor 488 Reagent (ab176753, Abcam, Cambridge, UK) in 3 well chamber slides (Ibidi, Gräfelfing, Germany), according to the manufacturer’s instruction. The seeding density was 50,000 cells per chamber in 1.1 mL growth medium for each culture condition with an additional negative control. CMAfin1 cells did not attach directly to chamber slides. Therefore, a 1% gelatin coating was applied using standard protocol. After a 24 h cultivation, the cells were washed with PBS (PAN-Biotech, Aidenbach, Germany) and fixed with 3.5% paraformaldehyde (Roth, Karlsruhe, Germany). Before staining, the permeability of cells was increased by using 0.1% Saponin (Merck-Sigma, Taufkirchen, Germany). The double staining was carried out for 20 min with Phalloidin-iFluor 488 Reagent (ab176753, Abcam, Cambridge, UK) and 4′,6-diamidino-2-phenylindole (DAPI, Roth, Karlsruhe, Germany) at a dilution of 1:1000 in PBS (PAN-Biotech, Aidenbach, Germany). Pictures were acquired with a Leica DM400B fluorescence microscope (Leica, Wetzlar, Germany) with a 40× objective (Ex/Em = 590/618 nm).

2.5. Growth Analysis

Endpoint analyses were performed at both temperatures to study the proliferation, cell size, and viability of the CMAfin1 cells after temperature adaptation. For this, 250,000 cells per well were seeded in 6-well plates (TPP, Trasadingen, Switzerland) with 2 mL growth medium (each n = 6) and cultivated for six days. Media exchange was conducted once, after three days. Proliferation, viability, and cell size were determined in two replicate readings using trypan blue staining in combination with the image-based EVE Plus automatic cell counter (NanoEnTek, Seoul, Republic of Korea) following the company’s instructions. The doubling time was calculated by Formula (1) [44]. In this formula, Time is the incubation time of 6 days, Xstart is the cell number at seeding, and Xend is the cell number at the endpoint of the experiment.
Doubling Time = [Time × (ln2)]/[ln (Xend/Xstart)]

2.6. Analysis of Metabolic Function

The metabolic function of the CMAfin1 cells incubated at 20 °C (n = 16 replicates) and 25 °C (n = 14 replicates) was determined using the Seahorse XFe96 Cell Analyzer from Agilent Technologies (Waldbronn, Germany) [46]. The mitochondrial function of the CMAfin1 cells was analyzed by measuring oxygen consumption rates (OCR) by performing the XF Cell Mito Stress Test Kit (#103015-100, Agilent, Waldbronn, Germany) [47,48]. Therefore, 15,000 well-adapted cells in 100 µL growth medium per well at 20 °C and 25 °C were seeded in a Seahorse XF96 cell culture microplate (#103793-100, Agilent, Waldbronn, Germany) and further cultivated for 24 h for attachment. Then, after removing the growth medium, cells were washed twice with XF Base Assay medium containing 1 mM glucose, 1 mM pyruvate, and 2 mM L-glutamine, and subsequently incubated in this medium for one hour. In the meantime, the cartridge hydrated with Calibrant (Agilent, Waldbronn, Germany) the previous day was loaded with oligomycin, FCCP, rotenone, and antimycin A. Following the manufacturer’s instruction, during the assay performance, the OCR values were recorded under basal conditions (value a) and after sequential injections of oligomycin (final concentration 2 µM, minutes 18–36; value b) to inhibit mitochondrial adenosine triphosphate (ATP) synthesis, carbonyl cyanide-p-trifluoromethoxyphenylhydrazone (FCCP, final concentration 1 µM, minutes 36–54; value c) to uncouple ATP synthesis, and a combination of rotenone and antimycin A (each 0.5 µM, minutes 54–72; value d) to completely block oxidative phosphorylation [49]. During the 18 min following each injection, three OCR and extracellular acidification rate (ECAR) measurements were taken. The obtained OCR data were normalized to the protein content determined per well after the analysis of the Seahorse experiments, as described by Wanka et al. (2018) and displayed as OCR (pmol/min/µg protein ± SD) [50]. The mitochondrial basal respiration (=a − d), ATP-linked respiration or mitochondrial ATP production rate (=a − b), maximal respiration (=c − d), and spare respiratory capacity (=maximal respiration − mitochondrial basal respiration) were calculated using Wave Software 2.9 (Agilent, Waldbronn, Germany).
The metabolic potential or stress phenotype, defined as the percentage increase in stressed OCR over baseline OCR and stressed ECAR over baseline ECAR, is a measure of cells’ ability to meet an energy demand via respiration and glycolysis. For visualization of the metabolic stress response, the OCR and ECAR measurements at basal conditions and after injection of oligomycin and FCCP (stressed OCR resp. ECAR) were plotted (=stressed values/baseline values × 100) to determine the stress phenotype, whether oxidative or glycolytic [46,48].
For XF Glycolysis Stress Test Kit (#103020-100, Agilent, Waldbronn, Germany), adapted CMAfin1 cells were seeded onto Seahorse cell culture plates as described above and incubated for 24 h at both temperature (20 °C: n = 16 replicates, 25 °C: n = 14 replicates) to ensure proper attachment. The protocol followed the manufacturer’s instruction [51] by washing the cells with the XF Base Assay Medium containing only 2 mM L-glutamine but no glucose or pyruvate, and loading the hydrated cartridge with glucose, oligomycin, and 2-DG. After one hour of incubation with that starvation media, three ECAR measurements of the cells were taken under basal conditions (first 18 min; value a), and after the addition of glucose (final concentration 10 mM, minutes 18–36; value b) to induce glycolysis, oligomycin (final concentration 2 µM, minutes 36–54; value c) to inhibit mitochondrial ATP synthesis and increase glycolysis, and 2-deoxyglucose (final concentration 50 mM, value d) to block glycolysis [52]. ECAR measurements were normalized to protein content and displayed as ECAR (mpH/min/µg protein ± SD). Normalized data were used to calculate glycolysis (=b − a), glycolytic capacity (=c − a), glycolytic reserve (=glycolytic capacity − glycolysis), and non-glycolytic acidification (=value d) using Wave Software 2.9 (Agilent, Waldbronn, Germany), as recommended.

2.7. Gene Expression Analyses

For gene expression analysis, per experimental condition, the 20 °C and 25 °C adapted CMAfin1 cells were subcultured in six-well plates at two different passages and 72 h later harvested as cell pellets (each n = 12). The total RNA of cell pellets was isolated using the RNeasy Micro Kit (#74004, Qiagen, Hilden, Germany) according to the manufacturer’s instruction. The isolated RNA was quantified using a NanoDrop ND-1000 spectrophotometer (Peqlab via Thermo Fisher, Darmstadt, Germany). Only samples meeting the established quality criteria (260/280 values: ratio of ~2.0; 260/230 values: ratio of 1.8–2.2) were included in the experiment. The iScript cDNA Synthesis Kit (#1708891, Bio-Rad, Hercules, CA, USA) was used to reverse transcribe 1 µg of RNA into cDNA. The genes of interest (GOI) included heat shock transcription factors 1 and 2 (Hsf1 and Hsf2), heat shock 70kD protein 1A (Hsp70), heat shock protein 90α-family-class A member 1 (Hsp90), and citrate synthase (Cs). The coding sequences of the GOI for Salmonidae were obtained from the NCBI public database (https://www.ncbi.nlm.nih.gov/) for the primer design with Primer3web version 4.1.0 (https://primer3.ut.ee/). Additionally, they were checked for specificity against other fish species in silico. The amplicon length of the species-specific primers ranged from 163 to 488 bp (Table 1). Final gene expression was measured in duplicates of 25 ng cDNA template (each n = 9) using the LightCycler® 96 System (Roche, Basel, Switzerland) and FastStart Essential DNA Green Master (#6402712001, Roche, Basel, Switzerland) according to the manufacturer’s instruction. After preincubation, a three-step run at 95 °C for 10 s, 60 °C for 10 s, and 72 °C for 18 s was performed following melting curve analysis. In all experiments, nuclease-free water (#129114, Qiagen, Hilden, Germany) was used as the negative control. For normalization, in compliance with MIQE guidelines [53], the three reference genes Eukaryotic translation elongation factor 1 alpha 1b (Eef1a1b), Ribosomal protein L9 (Rpl9), and Glyceraldehyde-3-phosphate dehydrogenase (Gapdh) were used [54]. Initially, the group means were normalized, reducing the variability and improving GOI analysis accuracy [55]. Heat stress probably disrupted cellular homeostasis and affected the stability of the reference genes. Consequently, normalization attenuated or masked the absolute effects of heat stress on GOI expression in the present study. To minimize bias, gene expression in CMAfin1 cells cultivated at 20 °C and 25 °C was displayed as absolute expression values, calculated using the formula (2−CT)(×108) of 25 ng cDNA [56,57].

2.8. Statistical Analysis

All data are presented as arithmetic mean ± standard deviation (SD), and statistical analyses were performed using GraphPad Prism software, version 10.2.3. (GraphPad Software, Inc., Boston, MA, USA). The statistical differences between the two groups were proved by a Student’s t-test or a one-way ANOVA with the Welch test of variances. The normality of the variables was demonstrated by the Shapiro–Wilk test. Differences were considered significant if p ≤ 0.05.

3. Results

3.1. Morphology Changes and Growth Analysis of Temperature-Adapted CMAfin1 Cells

After 24 h of incubation, attachment of CMAfin1 cells was completed. Phase contrast microscopy images showed that the morphology of CMAfin1 cells under control conditions was more compact with protrusions, whereas at 25 °C, the cells were more spindle-shaped (Figure 1a,b). Over time, both groups exhibited an increase in cell density. After one week, the cells reached confluence in both temperature conditions (Figure 1c,d). However, at 25 °C (Figure 1d), the cells were notably smaller and displayed a higher cell density than those at 20 °C (Figure 1c).
To determine cytoskeletal details of the observed morphological changes, we stained filamentous actin (F-actin). The distribution of F-actin varied in the cells based on the cultivation temperature. Under control conditions of 20 °C, CMAfin1 cells exhibited uniformly distributed actin filaments (Figure 1e). In contrast, a smaller and more elongated morphology was present under hyperthermic conditions. Consequently, the F-actin structures within these cells were also organized in an elongated configuration with a higher intensity of actin in the cell periphery (Figure 1f).
A growth analysis further validated this morphological observation, which confirmed the impact of elevated temperatures on cell morphology and proliferation rates. The higher proliferation rates at 25 °C resulted in significantly higher cell density (Figure 2a) and significantly reduced doubling time (Figure 2b). The higher proliferation rate had no significant effect on the cell viability (Figure 2c). At the same time, the size of the attached CMAfin1 cells grown at 25 °C significantly decreased (Figure 2d).

3.2. Mitochondrial Oxidative Respiration

In addition to these cell growth and morphological parameters, we characterized the cells for their metabolic functions. We determined mitochondrial oxidative respiration by measuring OCR in cells cultured at 20 °C and 25 °C. In contrast to the cells incubated at 20 °C, we observed reduced basal OCR (Figure 3a, first 18 min), a lower oligomycin-induced OCR reduction (18–36 min), and a lower FCCP-mediated OCR increase (36–54 min). Therefore, our data show that CMAfin1 cells exhibited reduced mitochondrial respiration at 25 °C, evidenced by significant reduction in basal respiration, mitochondrial ATP production, maximal respiration, and reserve capacity for oxygen consumption compared to those grown at 20 °C (Figure 3b). Non-mitochondrial respiration is driven by processes outside the mitochondria. It was significantly higher in CMAfin1 cells cultured at 20 °C than at 25 °C (Figure 3b).

3.3. Metabolic Phenotype

Simultaneous measurements of aerobic respiration, indicated by OCR, and glycolytic activity, reflected by ECAR, under basal conditions and after blocking and uncoupling mitochondrial ATP synthesis, enable the characterization of the cells’ baseline phenotype, stressed phenotype, and metabolic potential to respond to changes in energy demand (Figure 4a–c). In general, 20 °C-incubated CMAfin1 cells displayed a stronger metabolic potential to respond to cellular energy demand than those incubated at 25 °C (Figure 4a–c). A temperature increase of 5 °C significantly decreased basal oxidative activity and utilization of both pathways in response to mitochondrial stressors (Figure 4b,c). However, stress-induced OCR increased by the same factor in both cell groups (Figure 4a). In contrast, treatment of the cells with higher temperatures reduced their glycolytic potential, as shown by the difference between basal (not significant) and stressed ECAR at 20 °C and 25 °C (Figure 4b,c). While the ECAR of control CMAfin1 cells increased significantly fourfold by the stressors, the ECAR of cells under hyperthermic conditions increased only 3.3-fold (not significant; Figure 4b).

3.4. Glycolytic Activity

Since CMAfin1 cells incubated at 25 °C showed less glycolytic potential for ATP production under stressed conditions, glycolytic activity was also determined. However, the addition of glucose hardly induced glycolysis in one-hour starved CMAfin1 cells, as evidenced by the lack of increase in medium acidification (Figure 5a, 18–36 min). Only cells cultured under standard conditions (20 °C) exhibited a slightly increased ECAR, indicating the onset of glycolysis. Oligomycin-induced inhibition of mitochondrial ATP production increased the ECAR significantly in 20 °C-treated and barely in 25 °C-treated cells (36–54 min). Consequently, glycolysis, glycolytic capacity, and reserve were significantly higher in 20 °C-incubated than in 25 °C-incubated cells (Figure 5b). However, the non-glycolytic acidification was higher in 25 °C-cultivated CMAfin1 cells (Figure 5b).

3.5. Gene Expression

To further assess the temperature-induced alterations in CMAfin1 cells, we analyzed the expression of genes related to heat stress response, cell cycle progression, and energy metabolism. A 5 °C temperature increase consistently downregulated all tested genes. Although the reference genes (Eef1a1b, Rpl9, Gapdh) fulfil different physiological roles, their absolute expression levels were uniformly lower in CMAfin1 cells incubated at 25 °C (Figure 6a–c). Therefore, the normalization of GOI could not be applied [59,60], and absolute mRNA expression levels were compared instead (Figure 6d–f). The results revealed that the transcript levels of heat shock 70kD protein 1A (Hsp70) and heat shock protein 90α-family-class A member 1 (Hsp90) were reduced in CMAfin1 cells cultured at 25 °C (Figure 6d,e) compared to control cells maintained at 20 °C. Notably, expression of citrate synthase (Cs), a key enzyme in the citric acid cycle, was strongly downregulated under heat stress conditions at 25 °C (Figure 6f).
Heat shock transcription factors 1 and 2 (Hsf1 and Hsf2) demonstrated extremely low absolute expression levels, with strong variations in the technical and biological replicates. When using 25 ng of RNA from CMAfin1 cells, the cycle threshold (CT) values were between 33.5 and 34.3 at 20 °C and between 37.6 and 35.8 at 25 °C for Hsf1 and Hsf2. Consequently, no reliable gene expression analysis of these two genes was obtained.

4. Discussion

In the context of global warming, the physiological, metabolic, and behavioural effects of increasing sea surface water temperatures on fish populations, aquatic ecosystems, and aquaculture are enormous [15]. In regard to elevated temperatures, one central hypothesis is that mitochondrial dysfunction is a primary driver of heat-induced physiological failure, particularly in the heart [28,61]. Numerous in vivo and ex vivo studies on fish have examined acclimation potential and species-specific responses to acute and chronic thermal stress [62]. A direct comparison between in vivo and ex vivo data with stem cell-based cellular models presented here, is limited, as the complex systemic factors and physiological contexts inherent to in vivo systems can significantly influence the interpretation of cellular changes. For targeted investigation of purely cellular adaptations and, more importantly, to reduce reliance on animal experimentation and euthanasia, stem cell-based models offer a scientifically sound and ethically preferable alternative [35,36].
The salmonid C. maraena, native to the Baltic Sea, is particularly affected by elevated temperature stress and dies at 26 °C [10,11,14]. A previous study on adult C. maraena showed that growth rate, muscle properties, and energy metabolism differ in a species-specific manner [63]. However, direct links between the effects of global warming on fish and the investigation of cell physiology are still limited. According to the thermal sensitivity quotient (Q10), reactions occur twice as fast for every 10 °C increase within a species’ temperature tolerance range [64], which also applies to fish growth [65]. Warmer waters accelerate metabolism, causing animals to grow faster due to increased energy conversion [66]. Instead of using in vivo studies, we aimed to investigate these temperature-induced changes in growth and metabolism using an in vitro fish model. To characterise the effects of elevated temperature, we analyzed cell proliferation after thermal adaptation to 25 °C. Our CMAfin1 cell line exhibited increased proliferation activity, as reflected by higher cell density (Figure 1d and Figure 2a) and a shorter doubling time (Figure 2b). In a previous study, A. oxyrhinchus cells demonstrated increased proliferation, higher ATP demand, and rapid metabolic adaptation to elevated temperatures [32]. Although the C. maraena cells did not survive a rapid temperature increase of 5 °C, the present study revealed that CMAfin1 cells adapt to 25 °C when the change occurs gradually over a longer period. This shows that the present in vitro model, like the cells of the A. oxyrinchus, exhibit adaptive strategies for maintaining viability and ensuring survival even after freezing and thawing.
To gain insights into these possible adaptive strategies of cells, triggered by a temperature increase of 5 °C, we compared growth performance and displayed morphological characteristics. However, CMAfin1 cells at 25 °C were smaller (Figure 2d). Smaller cell volume reduces metabolic demands and limits protein synthesis, offering protection against heat-induced protein misfolding [67,68]. Furthermore, cells at 25 °C were spindle-shaped. They showed an increased intensity of parallel-aligned actin filaments at the cell periphery (Figure 1f) compared to the widely spread cells at 20 °C, which exhibited evenly distributed actin filaments (Figure 1e). Actin filaments are important components of the cytoskeleton and drive cell motility [69,70,71], enabling cells to interact with their environment, the extracellular matrix, signaling molecules, and other cells [72]. The process of cell spreading requires adapted cytoskeletal rearrangement to ensure the attachment to substrates via anchoring. Actin filaments altered by temperature increases can, therefore, lead to reduced cell motility and cell communication [70,73] and thus reflect cellular stress [74,75].
The expression of heat-inducible genes (Hsp70 and Hsp90), markers of thermal stress in vertebrates, including C. maraena [76,77,78,79], emphasizes the connection between temperature-induced cytoskeletal changes and cellular stress responses, which were induced in 25 °C-cultured CMAfin1 cells. Typically, higher temperatures lead to increased expression of Hsp70 [76,80]. However, when the tolerance limit is nearly reached, a decrease in heat shock protein expression is observed [80,81,82], as also shown in our study (Figure 6d,f). Our study provides the first indication that this may also apply to fish cells. Further investigation of the detailed processes behind this is required. Increased energy conversion associated with the rise in temperature [66] was not observed in the CMAfin1 cells.
Under optimal conditions (20 °C), mitochondrial respiration dominates, whereby the cells are able to switch to anaerobic glycolysis to produce ATP when energy is demanded, and oxidative respiration is blocked (Figure 3a,b). This reactivity is no longer present in cells cultivated at 25 °C. Since no increase in acidification of the culture medium by protons secreted in support with lactate could be detected at 25 °C (Figure 3a,b), it suggests that anaerobic glycolysis does not occur [49]. This holds true even when mitochondrial respiration is blocked. A further indication against anaerobic glycolysis in CMAfin1 cells at 25 °C (Figure 4b,c) could be the much higher non-glycolytic acidification of the medium than in 20 °C-cultured cells, which we could observe using Seahorse technology (Figure 5b). This acidification of the medium could be attributed to proton production during the citric acid cycle [83]. However, at hyperthermic temperatures, CMAfin1 cells also exhibited reduced respiratory activity, indicating high metabolic stress for the cells. This assumption is also confirmed by the significantly lower gene expression of Cs at 25 °C (Figure 6f), which encodes citrate synthase, a citric acid cycle enzyme, and can therefore be considered a marker of aerobic metabolism [84,85].
Ectothermic animals such as fish respond to temperature changes with altered metabolic activities due to shifts in various physiological aspects [22,86,87]. Previous studies at the cellular level in O. mykiss and A. oxyrinchus [29,32] confirmed that the physiological characteristics of these species can be reproduced in corresponding fish cell lines. In the present study, this relationship was also confirmed for C. maraena using the CMAfin1 cell line. Compared to cell lines of other fish species [32], CMAfin1 cells show lower metabolic tolerance to elevated temperatures. These cellular observations are consistent with organismal level data [10,11,14], suggesting that the underlying causes are likely due to reduced overall gene expression, lower basal respiration rates and oxygen capacities, and the inability to utilize anaerobic glycolysis. Analysis of the metabolic phenotype also highlights the metabolically quiescent CMAfin1 cells under heat stress (Figure 4c). Overall, these results indicate that CMAfin1 cells can serve as a suitable in vitro model for C. maraena and highlight the potential of using in vitro models in fish research.
Using this model, along with others, cellular mechanisms such as metabolic activities, systemic functions, and adaptive responses can be investigated to understand climate change-induced effects. This enhances our understanding of fish species and contributes to their protection and conservation.

5. Conclusions

The present study revealed that CMAfin1 cells growing at 25 °C were operating at their energy limit. This hypothesis was supported by the reduced overall gene expression, the lower basal respiration and oxygen capacity, as well as the inability to perform anaerobic glycolysis. The analysis of the metabolic phenotype showed that the CMAfin1 cell line assumed a metabolically quiescent state under heat stress. Additionally, the increased intensity of parallel-aligned actin filaments at the cell periphery and the reduction in cell size suggested structural adaptations to these energy-limiting conditions. In terms of the 3R principle, this analysis represents a suitable in vitro model for C. maraena and highlights the potential for research using such cell lines in fisheries, conservation, and aquaculture.
Future studies should extend these findings by exploring key metabolic and molecular pathways and applying approaches such as long-term thermal stress experiments, multi-omics analyses, and stress resilience studies to obtain a deeper understanding of the species’ adaptive potential under environmental stressors.

Author Contributions

Conceptualization, B.G. and J.B.; methodology and validation, K.T., J.B., H.W. and B.G.; formal analysis, investigation, and data curation, K.T., J.B. and H.W.; writing—original draft preparation, K.T.; writing—review and editing, K.T., J.B., H.W. and B.G.; visualization, K.T.; supervision and project administration, B.G. All authors have read and agreed to the published version of the manuscript.

Funding

This research was funded by the Research Institute for Farm Animal Biology (FBN).

Institutional Review Board Statement

This study does not contain any animal experiments (Animal Welfare Directive 2010/63/EU and German TierSchG § 4(3)).

Informed Consent Statement

Not applicable.

Data Availability Statement

We confirm that all the data in this manuscript is original, stored with us, and available for sharing upon a reasonable request.

Acknowledgments

We thank Anne Berndt for her support in maintaining and caring for the cell cultures. Moreover, we would like to thank the Referees for their helpful comments and suggestions, which have contributed to the improvements of manuscript’s quality.

Conflicts of Interest

The authors declare no conflicts of interest.

Abbreviations

The following abbreviations are used in this manuscript:
ATPAdenosine triphosphate
CTCycle threshold
DAPI4′,6-diamidino-2-phenylindole
ECARExtracellular acidification rate
FBS Foetal Bovine Serum
FCCPCarbonyl cyanide-p-trifluoromethoxyphenylhydrazone
GOIGenes of interest
L-15 Leibovitz-15
IUCNInternational Union for Conservation of Nature and Natural Resources
OCROxygen consumption rate
PBSDulbecco’s Phosphate-buffered Saline
Ro/AARotenone and antimycin A

References

  1. IPCC. Climate Change 2023: Synthesis Report; Contribution of Working Groups I, II and III to the Sixth Assessment Report of the Intergovernmental Panel on Climate Change; IPCC: Geneva, Switzerland, 2023; 184p. [Google Scholar] [CrossRef]
  2. Morée, A.L.; Clarke, T.M.; Cheung, W.W.L.; Frölicher, T.L. Impact of deoxygenation and warming on global marine species in the 21st century. Biogeosciences 2023, 20, 2425–2454. [Google Scholar] [CrossRef]
  3. Nimma, D.; Devi, O.R.; Laishram, B.; Ramesh, J.V.N.; Boddupalli, S.; Ayyasamy, R.; Tirth, V.; Arabil, A. Implications of climate change on freshwater ecosystems and their biodiversity. Desalin. Water Treat. 2025, 321, 100889. [Google Scholar] [CrossRef]
  4. Meier, H.E.M.; Kniebusch, M.; Dieterich, C.; Gröger, M.; Zorita, E.; Elmgren, R.; Myrberg, K.; Ahola, M.P.; Bartosova, A.; Bonsdorff, E.; et al. Climate change in the Baltic Sea region: A summary. Earth Syst. Dynam. 2022, 13, 457–593. [Google Scholar] [CrossRef]
  5. Reusch, T.B.H.; Dierking, J.; Andersson, H.C.; Bonsdorff, E.; Carstensen, J.; Casini, M.; Czajkowski, M.; Hasler, B.; Hinsby, K.; Hyytiäinen, K.; et al. The Baltic Sea as a time machine for the future coastal ocean. Sci. Adv. 2018, 4, eaar8195. [Google Scholar] [CrossRef] [PubMed]
  6. Hellmann, J.J.; Byers, J.E.; Bierwagen, B.G.; Dukes, J.S. Five Potential Consequences of Climate Change for Invasive Species. Conserv. Biol. 2008, 22, 534–543. [Google Scholar] [CrossRef] [PubMed]
  7. Viitasalo, M.; Bonsdorff, E. Global climate change and the Baltic Sea ecosystem: Direct and indirect effects on species, communities and ecosystem functioning. Earth Syst. Dynam. 2022, 13, 711–747. [Google Scholar] [CrossRef]
  8. Freyhof, J. Coregonus maraena. In The IUCN Red List of Threatened Species 2013; IUCN: Gland, Switzerland, 2013. [Google Scholar] [CrossRef]
  9. Ford, M. Coregonus maraena. In The IUCN Red List of Threatened Species 2024; IUCN: Gland, Switzerland, 2024. [Google Scholar] [CrossRef]
  10. Rebl, A.; Verleih, M.; Nipkow, M.; Altmann, S.; Bochert, R.; Goldammer, T. Gradual and Acute Temperature Rise Induces Crossing Endocrine, Metabolic, and Immunological Pathways in Maraena Whitefish (Coregonus maraena). Front. Genet. 2018, 9, 241. [Google Scholar] [CrossRef] [PubMed]
  11. Bochert, R.; Luft, P.; Gebhard, R. Temperature preferences of three maraena whitefish (Coregonus maraena) size classes under aquaculture conditions. Aquac. Res. 2020, 51, 2160–2163. [Google Scholar] [CrossRef]
  12. Edsall, T.A.; Rottiers, D.V.; Brown, E.H. Temperature tolerance of bloater (Coregonus hoyi). J. Fish. Res. Board Can. 1970, 27, 2047–2052. [Google Scholar] [CrossRef]
  13. Edsall, T.A.; Rottiers, D.V. Temperature tolerance of young-of-the-year lake whitefish, Coregonus clupeaformis. J. Fish. Res. Board Can. 1976, 33, 177–180. [Google Scholar] [CrossRef]
  14. McCormick, J.H.; Jones, B.R.; Syrett, R.F. Temperature Requirements for Growth and Survival of Larval Ciscos (Coregonus artedii). J. Fish. Board Can. 1971, 28, 924–927. [Google Scholar] [CrossRef]
  15. Alfonso, S.; Gesto, M.; Sadoul, B. Temperature increase and its effects on fish stress physiology in the context of global warming. J. Fish Biol. 2021, 98, 1496–1508. [Google Scholar] [CrossRef] [PubMed]
  16. Little, A.G.; Loughland, I.; Seebacher, F. What do warming waters mean for fish physiology and fisheries? J. Fish Biol. 2020, 97, 328–340. [Google Scholar] [CrossRef] [PubMed]
  17. Cingi, S.; Keinänen, M.; Vuorinen, P.J. Elevated water temperature impairs fertilization and embryonic development of whitefish Coregonus lavaretus. J. Fish Biol. 2010, 76, 502–521. [Google Scholar] [CrossRef] [PubMed]
  18. Korytar, T.; Nipkow, M.; Altmann, S.; Goldammer, T.; Kollner, B.; Rebl, A. Adverse Husbandry of Maraena Whitefish Directs the Immune System to Increase Mobilization of Myeloid Cells and Proinflammatory Responses. Front. Immunol. 2016, 7, 631. [Google Scholar] [CrossRef] [PubMed]
  19. Kern, P.; Cramp, R.L.; Franklin, C.E. Physiological responses of ectotherms to daily temperature variation. J. Exp. Biol. 2015, 218, 3068–3076. [Google Scholar] [CrossRef] [PubMed]
  20. Kim, W.S.; Yoon, S.-J.; Kim, J.M.; Gil, J.W.; Lee, T.W. Effects of temperature changes on the endogenous rhythm of oxygen consumption in the Japanese flounder Paralichthys olivaceus. Fish. Sci. 2005, 71, 471–478. [Google Scholar] [CrossRef]
  21. Hildebrandt, J.-P.; Bleckmann, H.; Homberg, U. Penzlin—Lehrbuch der Tierphysiologie, 9th ed.; Springer Spektrum: Berlin/Heidelberg, Germany, 2021. [Google Scholar]
  22. Brett, J.R. Energetic Responses of Salmon to Temperature. A Study of Some Thermal Relations in the Physiology and Freshwater Ecology of Sockeye Salmon (Oncorhynchus nerkd). Am. Zool. 1971, 11, 99–113. [Google Scholar] [CrossRef]
  23. Reynolds, W.W.; Casterlin, M.E. The Role of Temperature in the Environmental Physiology of Fishes; Springer: Boston, MA, USA, 1980. [Google Scholar]
  24. Morgan, M.J. Low-Temperature Tolerance of American Plaice in Relation to Declines in Abundance. Trans. Am. Fish. Soc. 1992, 121, 399–402. [Google Scholar] [CrossRef]
  25. Morgan, M.J.; Rideout, R.M.; Colbourne, E.B. Impact of environmental temperature on Atlantic cod Gadus morhua energy allocation to growth, condition and reproduction. Mar. Ecol. Progress. Ser. 2010, 404, 185–195. [Google Scholar] [CrossRef]
  26. Van Dijk, P.L.M.; Tesch, C.; Hardewig, I.; Pörtner, H.O. Physiological disturbances at critically high temperatures: A comparison between stenothermal antarctic and eurythermal temperate eelpouts (Zoarcidae). J. Exp. Biol. 1999, 202, 3611–3621. [Google Scholar] [CrossRef] [PubMed]
  27. Evans, D.O. Metabolic Thermal Compensation by Rainbow Trout: Effects on Standard Metabolic Rate and Potential Usable Power. Trans. Am. Fish. Soc. 1990, 119, 585–600. [Google Scholar] [CrossRef]
  28. Gerber, L.; Clow, K.A.; Gamperl, A.K. Acclimation to warm temperatures has important implications for mitochondrial function in Atlantic salmon (Salmo salar). J. Exp. Biol. 2021, 224, jeb236257. [Google Scholar] [CrossRef] [PubMed]
  29. Bols, N.C.; Mosser, D.D.; Steels, G.B. Temperature studies and recent advances with fish cells in vitro. Comp. Biochem. Physiol. Part A Physiol. 1992, 103, 1–14. [Google Scholar] [CrossRef]
  30. Cui, Y.; Liu, B.; Xie, J.; Xu, P.; Tsion, H.M.H.; Zhang, Y. The effect of hyperthermia on cell viability, oxidative damage, and heat shock protein expression in hepatic cells of grass carp (Ctenopharyngodon idellus). J. Therm. Biol. 2013, 38, 355–361. [Google Scholar] [CrossRef]
  31. Bloch, S.R.; Vo, N.T.K.; Walsh, S.K.; Chen, C.; Lee, L.E.J.; Hodson, P.V.; Bols, N.C. Development of a cell line from the American eel brain expressing endothelial cell properties. In Vitr. Cell. Dev. Biol.-Anim. 2016, 52, 395–409. [Google Scholar] [CrossRef] [PubMed]
  32. Lutze, P.; Brenmoehl, J.; Tesenvitz, S.; Ohde, D.; Wanka, H.; Meyer, Z.; Grunow, B. Effects of Temperature Adaptation on the Metabolism and Physiological Properties of Sturgeon Fish Larvae Cell Line. Cells 2024, 13, 269. [Google Scholar] [CrossRef] [PubMed]
  33. Grunow, B.; Franz, G.P.; Tönißen, K. In Vitro Fish Models for the Analysis of Ecotoxins and Temperature Increase in the Context of Global Warming. Toxics 2021, 9, 286. [Google Scholar] [CrossRef] [PubMed]
  34. Kaya, Y.; Tönißen, K.; Verleih, M.; Rebl, H.; Grunow, B. Establishment of an in vitro model from the vulnerable fish species Coregonus maraena (maraena whitefish): Optimization of growth conditions and characterization of the cell line. Cell Biol. Int. 2022, 47, 548–559. [Google Scholar] [CrossRef] [PubMed]
  35. Goswami, M.; Yashwanth, B.S.; Trudeau, V.; Lakra, W.S. Role and relevance of fish cell lines in advanced in vitro research. Mol. Biol. Rep. 2022, 49, 2393–2411. [Google Scholar] [CrossRef] [PubMed]
  36. Grunow, B.; Strauch, S.M. Status assessment and opportunities for improving fish welfare in animal experimental research according to the 3R-Guidelines. Rev. Fish Biol. Fish. 2023, 33, 1075–1093. [Google Scholar] [CrossRef]
  37. Rehberger, K.; Kropf, C.; Segner, H. In vitro or not in vitro: A short journey through a long history. Environ. Sci. Eur. 2018, 30, 23. [Google Scholar] [CrossRef] [PubMed]
  38. Nguyen, T.V.; Kumar, A.; Trang, P.N. The use of fish cell lines as in-vitro ecotoxicological tools: A cellular solution to aquaculture sustainability. Aquaculture 2024, 593, 741302. [Google Scholar] [CrossRef]
  39. Espinosa-Ruiz, C.; Mayor-Lafuente, J.; Esteban, M.Á. Mitochondrial Metabolism Characterization of Four Different Fish Cell Lines. Fishes 2022, 7, 354. [Google Scholar] [CrossRef]
  40. Robins, H.I.; Steeves, R.A.; Clark, A.W.; Martin, P.A.; Miller, K.; Dennis, W.H. Differential sensitivity of AKR murine leukemia and normal bone marrow cells to hyperthermia. Cancer Res. 1983, 43, 4951–4955. [Google Scholar] [CrossRef] [PubMed]
  41. Lian, P.; Braber, S.; Varasteh, S.; Wichers, H.J.; Folkerts, G. Hypoxia and heat stress affect epithelial integrity in a Caco-2/HT-29 co-culture. Sci. Rep. 2021, 11, 13186. [Google Scholar] [CrossRef] [PubMed]
  42. Serano, M.; Pietrangelo, L.; Paolini, C.; Guarnier, F.A.; Protasi, F. Oxygen Consumption and Basal Metabolic Rate as Markers of Susceptibility to Malignant Hyperthermia and Heat Stroke. Cells 2022, 11, 2468. [Google Scholar] [CrossRef] [PubMed]
  43. Suzuki, M.; Liu, C.; Oyama, K.; Yamazawa, T. Trans-scale thermal signaling in biological systems. J. Biochem. 2023, 174, 217–225. [Google Scholar] [CrossRef] [PubMed]
  44. Gstraunthaler, G.; Lindl, T. Zell- und Gewebekultur, Allgemeine Grundlagen und spezielle Anwendungen; Springer Spektrum: Berlin/Heidelberg, Germany, 2021. [Google Scholar] [CrossRef]
  45. Grunow, B.; Noglick, S.; Kruse, C.; Gebert, M. Isolation of cells from Atlantic sturgeon Acipenser oxyrinchus oxyrinchus and optimization of culture conditions. Aquat. Biol. 2011, 14, 67–75. [Google Scholar] [CrossRef]
  46. Ferrick, D.A.; Neilson, A.; Beeson, C. Advances in measuring cellular bioenergetics using extracellular flux. Drug Discov. Today 2008, 13, 268–274. [Google Scholar] [CrossRef] [PubMed]
  47. Gu, X.; Ma, Y.; Liu, Y.; Wan, Q. Measurement of mitochondrial respiration in adherent cells by Seahorse XF96 Cell Mito Stress Test. STAR Protoc. 2021, 2, 100245. [Google Scholar] [CrossRef] [PubMed]
  48. Leung, D.T.H.; Chu, S. Measurement of Oxidative Stress: Mitochondrial Function Using the Seahorse System. In Preeclampsia: Methods and Protocols; Murthi, P., Vaillancourt, C., Eds.; Springer: New York, NY, USA, 2018; pp. 285–293. [Google Scholar]
  49. Divakaruni, A.S.; Paradyse, A.; Ferrick, D.A.; Murphy, A.N.; Jastroch, M. Analysis and interpretation of microplate-based oxygen consumption and pH data. Methods Enzymol. 2014, 547, 309–354. [Google Scholar] [CrossRef] [PubMed]
  50. Wanka, H.; Lutze, P.; Staar, D.; Grunow, B.; Peters, B.S.; Peters, J. An alternative renin isoform is cardioprotective by modulating mitochondrial metabolism. J. Cell Mol. Med. 2018, 22, 5991–6001. [Google Scholar] [CrossRef] [PubMed]
  51. Vangapandu, H.V.; Gandhi, V. Extracellular Flux Assays to Determine Oxidative Phosphorylation and Glycolysis in Chronic Lymphocytic Leukemia Cells. In Chronic Lymphocytic Leukemia: Methods and Protocols; Malek, S.N., Ed.; Springer: New York, NY, USA, 2019; pp. 121–128. [Google Scholar]
  52. Wu, M.; Neilson, A.; Swift, A.L.; Moran, R.; Tamagnine, J.; Parslow, D.; Armistead, S.; Lemire, K.; Orrell, J.; Teich, J.; et al. Multiparameter metabolic analysis reveals a close link between attenuated mitochondrial bioenergetic function and enhanced glycolysis dependency in human tumor cells. Am. J. Physiol. Cell Physiol. 2007, 292, C125–C136. [Google Scholar] [CrossRef] [PubMed]
  53. Bustin, S.A.; Benes, V.; Garson, J.A.; Hellemans, J.; Huggett, J.; Kubista, M.; Mueller, R.; Nolan, T.; Pfaffl, M.W.; Shipley, G.L.; et al. The MIQE guidelines: Minimum information for publication of quantitative real-time PCR experiments. Clin. Chem. 2009, 55, 611–622. [Google Scholar] [CrossRef] [PubMed]
  54. Altmann, S.; Rebl, A.; Kuhn, C.; Goldammer, T. Identification and de novo sequencing of housekeeping genes appropriate for gene expression analyses in farmed maraena whitefish (Coregonus maraena) during crowding stress. Fish Physiol. Biochem. 2015, 41, 397–412. [Google Scholar] [CrossRef] [PubMed]
  55. Vandesompele, J.; De Preter, K.; Pattyn, F.; Poppe, B.; Van Roy, N.; De Paepe, A.; Speleman, F. Accurate normalization of real-time quantitative RT-PCR data by geometric averaging of multiple internal control genes. Genome Biol. 2002, 3, research0034.1. [Google Scholar] [CrossRef] [PubMed]
  56. Morrison, T.B.; Weis, J.J.; Wittwer, C.T. Quantification of low-copy transcripts by continuous SYBR Green I monitoring during amplification. Biotechniques 1998, 24, 954–958, 960, 962. [Google Scholar] [PubMed]
  57. Freeman, W.M.; Walker, S.J.; Vrana, K.E. Quantitative RT-PCR: Pitfalls and potential. BioTechniques 1999, 26, 112–125. [Google Scholar] [CrossRef] [PubMed]
  58. Martorell-Ribera, J.; Nipkow, M.; Viergutz, T.; Brunner, R.M.; Bochert, R.; Koll, R.; Goldammer, T.; Gimsa, U.; Rebl, A. Early response of salmonid head-kidney cells to stress hormones and toll-like receptor ligands. Fish Shellfish Immunol. 2020, 98, 950–961. [Google Scholar] [CrossRef] [PubMed]
  59. Bustin, S.A.; Nolan, T. Pitfalls of quantitative real-time reverse-transcription polymerase chain reaction. J. Biomol. Tech. 2004, 15, 155–166. [Google Scholar] [PubMed]
  60. Hendriks-Balk, M.C.; Michel, M.C.; Alewijnse, A.E. Pitfalls in the normalization of real-time polymerase chain reaction data. Basic. Res. Cardiol. 2007, 102, 195–197. [Google Scholar] [CrossRef] [PubMed]
  61. Gerber, L.; Clow, K.A.; Mark, F.C.; Gamperl, A.K. Improved mitochondrial function in salmon (Salmo salar) following high temperature acclimation suggests that there are cracks in the proverbial ‘ceiling’. Sci. Rep. 2020, 10, 21636. [Google Scholar] [CrossRef] [PubMed]
  62. Hickey, A.J.R.; Harford, A.R.; Blier, P.U.; Devaux, J.B. What causes cardiac mitochondrial failure at high environmental temperatures? J. Exp. Biol. 2024, 227, jeb247432. [Google Scholar] [CrossRef] [PubMed]
  63. Grunow, B.; Stange, K.; Bochert, R.; Tönißen, K. Histological and biochemical evaluation of skeletal muscle in the two salmonid species Coregonus maraena and Oncorhynchus mykiss. PLoS ONE 2021, 16, e0255062. [Google Scholar] [CrossRef] [PubMed]
  64. Willmer, P.; Stone, G.; Johnston, I. Environmental Physiology of Animals; John Wiley & Sons: Hoboken, NJ, USA, 2009. [Google Scholar]
  65. Regier, H.A.; Holmes, J.A.; Pauly, D. Influence of Temperature Changes on Aquatic Ecosystems: An Interpretation of Empirical Data. Trans. Am. Fish. Soc. 1990, 119, 374–389. [Google Scholar] [CrossRef]
  66. Pörtner, H.O.; Peck, M.A. Climate change effects on fishes and fisheries: Towards a cause-and-effect understanding. J. Fish Biol. 2010, 77, 1745–1779. [Google Scholar] [CrossRef] [PubMed]
  67. Dolfi, S.C.; Chan, L.L.-Y.; Qiu, J.; Tedeschi, P.M.; Bertino, J.R.; Hirshfield, K.M.; Oltvai, Z.N.; Vazquez, A. The metabolic demands of cancer cells are coupled to their size and protein synthesis rates. Cancer Metab. 2013, 1, 20. [Google Scholar] [CrossRef] [PubMed]
  68. Muranova, L.K.; Shatov, V.M.; Gusev, N.B. Role of Small Heat Shock Proteins in the Remodeling of Actin Microfilaments. Biochemistry 2022, 87, 800–811. [Google Scholar] [CrossRef] [PubMed]
  69. Mitchison, T.J.; Cramer, L.P. Actin-Based Cell Motility and Cell Locomotion. Cell 1996, 84, 371–379. [Google Scholar] [CrossRef] [PubMed]
  70. Pollard, T.D.; Borisy, G.G. Cellular Motility Driven by Assembly and Disassembly of Actin Filaments. Cell 2003, 112, 453–465. [Google Scholar] [CrossRef] [PubMed]
  71. Svitkina, T. The Actin Cytoskeleton and Actin-Based Motility. Cold Spring Harb. Perspect. Biol. 2018, 10, a018267. [Google Scholar] [CrossRef] [PubMed]
  72. Ng, I.C.; Pawijit, P.; Tan, J.; Yu, H. Anatomy and Physiology for Biomaterials Research and Development. In Encyclopedia of Biomedical Engineering; Narayan, R., Ed.; Elsevier: Oxford, UK, 2019; pp. 225–236. [Google Scholar]
  73. Buracco, S.; Claydon, S.; Insall, R. Control of actin dynamics during cell motility. F1000Research 2019, 8, 1977. [Google Scholar] [CrossRef] [PubMed]
  74. Tojkander, S.; Gateva, G.; Lappalainen, P. Actin stress fibers—Assembly, dynamics and biological roles. J. Cell Sci. 2012, 125, 1855–1864. [Google Scholar] [CrossRef] [PubMed]
  75. Rottner, K.; Faix, J.; Bogdan, S.; Linder, S.; Kerkhoff, E. Actin assembly mechanisms at a glance. J. Cell Sci. 2017, 130, 3427–3435. [Google Scholar] [CrossRef] [PubMed]
  76. Rupik, W.; Jasik, K.; Bembenek, J.; Widłak, W. The expression patterns of heat shock genes and proteins and their role during vertebrate’s development. Comp. Biochem. Physiol. Part A Mol. Integr. Physiol. 2011, 159, 349–366. [Google Scholar] [CrossRef] [PubMed]
  77. Stefanovic, D.I.; Manzon, L.A.; McDougall, C.S.; Boreham, D.R.; Somers, C.M.; Wilson, J.Y.; Manzon, R.G. Thermal stress and the heat shock response in embryonic and young of the year juvenile lake whitefish. Comp. Biochem. Physiol. Part A Mol. Integr. Physiol. 2016, 193, 1–10. [Google Scholar] [CrossRef] [PubMed]
  78. Nipkow, M.; Wirthgen, E.; Luft, P.; Rebl, A.; Hoeflich, A.; Goldammer, T. Characterization of igf1 and igf2 genes during maraena whitefish (Coregonus maraena) ontogeny and the effect of temperature on embryogenesis and igf expression. Growth Horm. IGF Res. 2018, 40, 32–43. [Google Scholar] [CrossRef] [PubMed]
  79. Manzon, L.A.; Zak, M.A.; Agee, M.; Boreham, D.R.; Wilson, J.Y.; Somers, C.M.; Manzon, R.G. Thermal acclimation alters both basal heat shock protein gene expression and the heat shock response in juvenile lake whitefish (Coregonus clupeaformis). J. Therm. Biol. 2022, 104, 103185. [Google Scholar] [CrossRef] [PubMed]
  80. Kern, K.; Mertineit, C.L.; Brinkmann, R.; Miura, Y. Expression of heat shock protein 70 and cell death kinetics after different thermal impacts on cultured retinal pigment epithelial cells. Exp. Eye Res. 2018, 170, 117–126. [Google Scholar] [CrossRef] [PubMed]
  81. Heydari, A.R.; Takahashi, R.; Gutsmann, A.; You, S.; Richardson, A. Hsp70 and aging. Experientia 1994, 50, 1092–1098. [Google Scholar] [CrossRef] [PubMed]
  82. Gabriel, J.E.; Ferro, J.A.; Stefani, R.M.; Ferro, M.I.; Gomes, S.L.; Macari, M. Effect of acute heat stress on heat shock protein 70 messenger RNA and on heat shock protein expression in the liver of broilers. Br. Poult. Sci. 1996, 37, 443–449. [Google Scholar] [CrossRef] [PubMed]
  83. Pike Winer, L.S.; Wu, M. Rapid Analysis of Glycolytic and Oxidative Substrate Flux of Cancer Cells in a Microplate. PLoS ONE 2014, 9, e109916. [Google Scholar] [CrossRef] [PubMed]
  84. Dohm, G.L.; Huston, R.L.; Askew, E.W.; Fleshood, H.L. Effects of exercise, training, and diet on muscle citric acid cycle enzyme activity. Can. J. Biochem. 1973, 51, 849–854. [Google Scholar] [CrossRef] [PubMed]
  85. McClelland, G.B.; Craig, P.M.; Dhekney, K.; Dipardo, S. Temperature- and exercise-induced gene expression and metabolic enzyme changes in skeletal muscle of adult zebrafish (Danio rerio). J. Physiol. 2006, 577, 739–751. [Google Scholar] [CrossRef] [PubMed]
  86. Peterson, R.H.; Anderson, J.M. Influence of Temperature Change on Spontaneous Locomotor Activity and Oxygen Consumption of Atlantic Salmon, Salmo salar, Acclimated to Two Temperatures. J. Fish. Res. Board Can. 1969, 26, 93–109. [Google Scholar] [CrossRef]
  87. Volkoff, H.; Rønnestad, I. Effects of temperature on feeding and digestive processes in fish. Temperature 2020, 7, 307–320. [Google Scholar] [CrossRef] [PubMed]
Figure 1. Phase-contrast microscope (Motic® AE2000, 20× objective) and immunofluorescence microscope (Leica DM400B, 40× objective) pictures of CMAfin1 cells. Images were taken (a) after 24 h of incubation at the control temperature of 20 °C, and (b) at an elevated temperature of 25 °C, and (c) after seven days at control conditions of 20 °C, and (d) at 25 °C. Double-stained CMAfin1 cells with Phalloidin-iFluor 488 Reagent against actin (green) and DAPI used to stain nuclei (blue) (e) under control conditions at 20 °C, and (f) under hyperthermic conditions at 25 °C after 24 h of cultivation. The scale bar represents 100 µm (ad) and 50 µm (e,f), respectively.
Fishes 10 00352 g001
Figure 2. Endpoint analyses were performed in culture after six days under control (20 °C, blue) and high-temperature (25 °C, orange) conditions. (a) cell density, (b) doubling time, (c) cell viability, (d) viable cell size. The data come from duplicate readings, n = 6 (20 °C) and n = 6 (25 °C), and are presented as mean ± SD. * p ≤ 0.05, **** p ≤ 0.0001 (Student’s t-test).
Fishes 10 00352 g002
Figure 3. Mitochondrial respiration of CMAfin1 cells analyzed using the Seahorse XFe96 Cell Analyzer. Measurement of oxygen consumption rates (OCR) by XF Cell Mito Stress Test Kit. (a) OCR of CMAfin1 cells cultured under control conditions of 20 °C (blue) and high-temperature conditions of 25 °C (orange) were measured basally and after the addition (black arrows) of oligomycin, FCCP, rotenone and antimycin A and (b) non-mitochondrial respiration, basal respiration, maximal respiration, ATP synthase-coupled respiration and reserve capacity of CMAfin1 cells cultured at 20 °C (blue) and 25 °C (orange) were calculated. The data come from triplicate readings, n = 16 (20 °C) and n = 14 (25 °C), and are presented as mean ± SD, * p ≤ 0.05, **** p ≤ 0.0001 (multiple unpaired t-tests). ATP: adenosine triphosphate, FCCP: Carbonyl cyanide-p-trifluoromethoxyphenylhydrazone, Ro/AA: rotenone and antimycin A.
Fishes 10 00352 g003
Figure 4. Energy phenotype of CMAfin1 cells incubated at 20 °C and 25 °C. (a) Visualization of OCR measurements (mitochondrial respiration) and (b) visualization of ECAR measurements (glycolysis) under baseline and after blocking and uncoupling mitochondrial ATP synthesis under stressed conditions. (c) Based on the OCR and ECAR measurements, the baseline phenotype (open marker) and stressed phenotype (filled marker) at control conditions of 20 °C (blue) and a high-temperature condition (25 °C; orange) are shown, as well as the cellular metabolic potential to respond to induced energy demand (dashed line). The data come from triplicate readings, n = 16 (20 °C) and n = 14 (25 °C), and are presented as mean ± SD. * p ≤ 0.05, **** p ≤ 0.0001 (one-way ANOVA).
Fishes 10 00352 g004
Figure 5. Glycolytic function of CMAfin1 cells analyzed using Seahorse technology. Measurement of extracellular acidification rate (ECAR) using XF Glycolysis Stress Test Kit. (a) Comparison of the normalized ECAR of CMAfin1 cells cultivated under a control condition of 20 °C (blue) and under a high-temperature condition of 25 °C (orange), measured basally and after the addition (black arrows) of glucose, oligomycin, and 2-deoxy-glucose (2-DG), and (b) calculated stress test parameters: glycolysis, glycolytic capacity, glycolytic reserve, and non-glycolytic acidification of CMAfin1 cells. The data come from triplicate readings, n = 16 (20 °C) and n = 14 (25 °C), and are presented as mean ± SD. ** p ≤ 0.01 **** p ≤ 0.0001 (multiple unpaired t-tests).
Fishes 10 00352 g005
Figure 6. Gene expression in CMAfin1 cells. Gene expressions based on 25 ng RNA equivalent of cells cultured under control (20 °C, blue) and high-temperature (25 °C, orange) conditions analyzed via LightCycler® 96. Absolute expression values (2−CT)(×108) of reference genes (a) Eukaryotic translation elongation factor 1 alpha 1b (Eef1a1b), (b) Ribosomal protein L9 (Rpl9), and (c) Glyceraldehyde-3-phosphate dehydrogenase (Gapdh), genes of interest (GOI) (d) heat shock 70kD protein 1A (Hsp70), (e) heat shock protein 90α-family-class A member 1 (Hsp90), and (f) citrate synthase (Cs). The data come from duplicate readings, and are presented as mean ± SD, n = 9 at both temperatures. * p ≤ 0.05, ** p ≤ 0.01, *** p ≤ 0.001 (Student’s t-test).
Fishes 10 00352 g006
Table 1. Overview of genes analyzed in this study by quantitative RT-PCR using LightCycler® 96 System (Roche, Basel, Switzerland). Heat stress-related genes of interest (GOI) include Hsf1 (heat shock transcription factor 1), Hsf2 (heat shock transcription factor 2), Hsp70 (heat shock 70kD protein 1A), and Hsp90 (heat shock protein 90α-family-class A member). Cs (citrate synthase) is associated with oxidative metabolism. Reference genes were Eef1a1b (Eukaryotic translation elongation factor 1 alpha 1b) Rpl9 (Ribosomal protein L9), and Gapdh (Glyceraldehyde-3-phosphate dehydrogenase).
Gene
Symbol
Amplicon Size [bp]Efficiency [E]Sense (5′-3′)
Antisense (5′-3′)
Source
Acc. No.
Species
Hsf11651.82GACTCTACACCTCAGACCTCACCXM_014142743.1Salmo salar
AATTCAGAACCAGGCAGGGA
Hsf23311.85AGTTGATAGGCCACAGAGGTTNM_001173904.1Salmo salar
CCAGACTTGCCTCCTTTGGA
Hsp701771.99CTCCTCTGGGTTGAAGGATTTGMartorell-Ribera et al., 2020 [58]Coregonus clupeaformis
GGCCATGAACCCCAACAACAC
Hsp902392.15AGATACGAGAGCTTGACAGACCMartorell-Ribera et al., 2020 [58]Coregonus clupeaformis
TGCCAGACTTGGCGATGGTTC
Cs1901.84CACCAACCTCCACCCTATGTMH744411.1Coregonus clupeaformis
GCGGTAAAGGTTGCGGTAAA
Eef1a1b1892.09CCTCCACTTGGTCGTTTCGAltmann et al., 2015 [54]Coregonus clupeaformis
CGCAGGATGTAGGGCAGCAGA
Rpl91631.99ACCACATCAACCTGGAACTCAAltmann et al., 2015 [54]Coregonus clupeaformis
CGCATCTTGTAACGGAAACC
Gapdh2662.03CAAGGCTGTGGGCAAGGTAltmann et al., 2015 [54]Coregonus clupeaformis
GATGGAGGGAGTGGGTGTCT
Disclaimer/Publisher’s Note: The statements, opinions and data contained in all publications are solely those of the individual author(s) and contributor(s) and not of MDPI and/or the editor(s). MDPI and/or the editor(s) disclaim responsibility for any injury to people or property resulting from any ideas, methods, instructions or products referred to in the content.

