Article

Integrated Transcriptome and Microbiome Analyses Reveal Growth- and Stress-Response-Related Genes and Microbes in Mandarin Fish (Siniperca chuatsi)

1
Zhejiang Fisheries Technical Extension Center, Hangzhou 310023, China
2
College of Life Sciences, Huzhou University, Huzhou 313000, China
*
Authors to whom correspondence should be addressed.
Fishes 2025, 10(7), 341; https://doi.org/10.3390/fishes10070341
Submission received: 8 June 2025 / Revised: 3 July 2025 / Accepted: 8 July 2025 / Published: 10 July 2025
(This article belongs to the Special Issue Fish Nutrition and Immunology)

Abstract

Mandarin fish (Siniperca chuatsi) are known to exhibit distinct physiological and immunological adaptations to environmental stressors, but the underlying molecular and microbial mechanisms remain unclear. In this study, we integrated transcriptome and microbiome analyses to investigate adaptations across three geographically distinct mandarin fish groups: Guangdong (G), Qiupu (Q), and native Taihu (T). Liver RNA sequencing revealed 5339 differentially expressed genes (DEGs) between T and G and 1531 DEGs between T and Q. Functional enrichment analysis revealed group-specific responses. Specifically, DEGs from T vs. G were linked to small-molecule metabolism and innate immunity whereas the DEGs from T vs. Q were related to immune regulation and chromatin organization. The concurrent 16S rRNA sequencing of the intestinal microbiota identified 2680 amplicon sequence variants, with principal coordinate analysis showing distinct clustering (31.77% variance). Group T had higher Firmicutes abundance whereas groups G and Q had a higher relative abundance of Fusobacteriota. Correlation networks revealed key microbe–gene interactions, including positive links between Lactobacillus and immune genes in group T and negative associations with Romboutsia. These findings suggest that enhanced immune homeostasis and metabolic flexibility in group T may result from coordinated host gene expression and Lactobacillus-driven microbiome modulation. We provide new insights into the mechanisms of adaptation in mandarin fish and identify potential biomarkers for enhancing aquaculture resilience.
Key Contribution: In this study, we employed an integrated approach combining transcriptome and microbiome analyses to explore adaptive mechanisms in three geographically distinct mandarin fish populations: Guangdong (G), Qiupu (Q), and native Taihu (T). Our findings provide new insights into the mechanisms of adaptation in mandarin fish and identify potential biomarkers for enhancing aquaculture resilience.

1. Introduction

Fish play a vital role in aquatic ecosystems and serve as a key protein source for humans [1,2]. Siniperca chuatsi, commonly known as the mandarin fish or Chinese perch, is a highly valued freshwater species in China, owing to its high-quality meat and economic importance [3,4]. This freshwater carnivorous fish has a streamlined body, large head, and sharp teeth used for capturing prey [5,6]. The flesh of the mandarin fish, with its flaky texture resembling garlic cloves, has a firm consistency and an exceptional flavor, making it highly regarded for its delicious taste. Its superior meat quality has made it a cornerstone of both commercial and subsistence aquaculture, with its production expanding to meet rising demand [7,8]. In China, the major regions of mandarin fish production are Guangdong, Hubei, Jiangsu, Zhejiang, and Anhui Provinces [9,10]. In 2022, China produced 0.4 million tons of mandarin fish, generating over USD 2.8 billion in output value [11].
Mandarin fish require specific environmental conditions and abundant food for rapid growth [12,13]. Juveniles grow quickly, but growth slows with maturity, prompting the use of developed feeds in aquaculture to support optimal development [14,15]. Over the past decade, Zhejiang Province has promoted breeding and selection programs to improve strains, focusing on domestication, compound feed use, facility-based systems, and disease prevention [16,17,18]. Despite various policy efforts, the availability of high-quality germplasm resources for mandarin fish is limited. In Zhejiang, the main cultured strains are Guangdong (G), Qiupu (Q), and the native Taihu (T) from Huzhou City [19]. Compared with the G and Q groups, the T group demonstrates distinct advantages in amino acid content, fatty acid composition, and the profile of flavor compounds in the basic nutritional components [19]. However, the molecular mechanisms driving these differences at the transcriptome and microbiome levels remain poorly understood.
RNA sequencing (RNA-Seq) is a powerful tool for transcriptome analysis, enabling the high-throughput identification of novel transcripts, alternative splicing events, and differentially expressed genes (DEGs) [20]. Over the past few decades, it has been extensively employed in diverse systems, ranging from investigations of plant stress responses to evaluations of animal nutritional status [21,22]. It has been shown that the microbiome plays a crucial role in the regulation of host physiology and health [23,24,25]. In aquatic species, the intestinal microbiota serves as a critical regulator for sustaining physiological homeostasis and bolstering resistance to environmental stressors [26,27]. Recently, 16S rRNA-based microbiome analysis has been used to explore the response mechanisms of aquatic species to environmental stimuli [28,29,30]. However, an integrated approach combining RNA-Seq and 16S rRNA microbiome analysis has not yet been performed on mandarin fish.
In this study, we analyzed liver transcriptomes using RNA-Seq and intestinal microbiota using 16S rRNA sequencing from three mandarin fish groups (G, Q, and T) using RNA-Seq and 16S rRNA sequencing. The goal of this study was to uncover molecular mechanisms underlying phenotypic divergence, providing a molecular foundation for breeding strains with enhanced feeding adaptability. The results could offer new insights into the transcriptomic and microbial responses of mandarin fish to varying aquaculture practices, improving our understanding of their adaptive strategies.

2. Materials and Methods

2.1. Animal Materials and Rearing Conditions

Three mandarin fish populations (G, Q, and T groups) were obtained from the Yudage Aquatic Farming Cooperative, Zhili, Huzhou City, Zhejiang Province, China. The average body weight was 402.0 ± 4.5 g. All fish (50 fish per group, and each group included five biological replicates) were acclimated to laboratory conditions for seven days to reduce stress and ensure uniformity as described previously [31]. All groups were maintained in a controlled, closed-circulating aquaculture system at a constant temperature of 25 °C with continuous aeration [32]. The water quality parameters (pH, dissolved oxygen, and ammonia) were regularly monitored to ensure optimal natural conditions [33]. Fish were fed a commercial diet twice daily with standardized portion sizes (approximately 2% of their body weight) to ensure consistent nutrition [34].

2.2. RNA Isolation, Library Construction, and Illumina Sequencing

For transcriptomic analysis, five biological replicates for each group were used. Briefly, total RNA was extracted from liver tissues using TRIzol™ reagent (Invitrogen, Carlsbad, CA, USA). RNA integrity was assessed using a 5300 Bioanalyzer (Agilent Technologies, Santa Clara, CA, USA) and concentrations were measured using an ND-2000 spectrophotometer (Thermo Fisher Scientific, Waltham, MA, USA). High-quality RNA was used to construct libraries using an Illumina TruSeq® Stranded mRNA Sample Prep Kit (Illumina, San Diego, CA, USA) according to the manufacturer’s protocol. After end repair, phosphorylation, and ‘A’ base addition, libraries were sequenced on the Illumina NovaSeq 6000 platform (Illumina, USA), as described previously [20].

2.3. Transcriptome Assembly and DEG Screening

Raw sequencing reads were processed using Fastp (v0.19.6) [35] to trim and filter low-quality sequences as described by Zhang et al. [36]. Clean reads were aligned to the mandarin fish reference genome (NCBI accession: GCF_020085105.1) using HISAT2 [37] in orientation mode. The read assembly was performed with StringTie2 [38], using the genome of mandarin fish as a reference. The transcript abundance was quantified using RSEM [39] and the expression levels were calculated as transcripts per million (TPM). Genes with |Log2 fold change| (|Log2 FC|) ≥ 1.0 and Benjamini–Hochberg (BH)—adjusted p-value (Padj) < 0.05 were considered significantly differentially expressed, as previously described [20,40].

2.4. Functional Annotation and Enrichment Analyses

Genes were annotated using multiple databases, including NCBI non-redundant protein sequences (NR), Swiss-Prot, Gene Ontology (GO), and Kyoto Encyclopedia of Genes and Genomes (KEGG) [41]. DEGs were categorized by their biological processes, cellular components, and molecular functions based on GO and KEGG annotations, as described previously [42]. Enrichment analyses of DEGs across different pairwise comparisons were performed using GOatools [43] and KOBAS-i [44], with visualizations generated on the Majorbio Cloud platform (https://cloud.majorbio.com/, accessed on 12 October 2024) [45].

2.5. DNA Extraction and 16S rRNA Gene Amplification

For microbiomic analysis, four biological replicates for each group were used. Briefly, total microbial DNA was extracted using the E.Z.N.A.® Bacterial DNA Kit (Omega Bio-Tek, Norcross, GA, USA) according to the manufacturer’s protocol. DNA quality and concentration were assessed using 1% agarose gel electrophoresis and quantified using a NanoDrop2000 spectrophotometer (Thermo Scientific, USA). The bacterial 16S rRNA gene was amplified using primer pairs 338F (5′-ACTCCTACGGGAGGCAGCAG-3′) and 806R (5′-GGACTACHVGGGTWTCTAAT-3′) on a T100 Thermal Cycler PCR system (Bio-Rad, Hercules, CA, USA). The 10 µL PCR reaction included 10 µL 2× Pro Taq, 0.8 µL of each primer—forward and reverse (5 µM), and 10 ng of template DNA, and ddH2O PCR amplification was performed under the following conditions: initial denaturation at 95 °C for 3 min; then 30 cycles of denaturation (95 °C, 30 s), annealing (55 °C, 30 s), and extension (72 °C, 45 s); followed by a final extension at 72 °C for 10 min and holding at 10 °C, as previously described [46,47].

2.6. Illumina MiSeq and Sequence Processing

PCR products were extracted from 2% agarose gels and purified using the PCR Clean-Up Kit (YuHua, Shanghai, China). Purified amplicons were pooled in equimolar amounts and paired-end sequenced on the Illumina Nextseq2000 platform (Illumina, San Diego, CA, USA) following standard protocols by Majorbio Bio-Pharm Technology Co., Ltd. (Shanghai, China). High-fidelity (HiFi) reads were generated via circular consensus sequencing using SMRT Link (v11.0), as previously described [48]. After demultiplexing, the reads were quality-filtered using Fastp (v0.19.6) [35] and merged using FLASH (v1.2.7) [49,50].

2.7. Bioinformatic Analysis of the 16S rRNA

High-quality sequences were then denoised using the DADA2 plugin in the Qiime2 pipeline (v2020.2) [50], applying default parameters to achieve single-nucleotide resolution. Amplicon sequence variants (ASVs) were taxonomically classified using the Naive Bayes classifier in Qiime2 [50] and the SILVA 16S rRNA reference database (v138) [51]. Rarefaction curves and alpha diversity indices (including observed ASVs, Chao1 richness, Shannon index, and Good’s coverage) were calculated using Mothur (v1.30.1) [52]. Microbial community similarity was assessed via principal coordinate analysis (PCoA) using Bray–Curtis dissimilarity in the vegan package for R (v3.3.1). The functional prediction of microbial communities was conducted based on KEGG annotations using PICRUSt2 (v2.2.0).

2.8. Association Analysis Between the Intestinal Microbiota and DEGs

Pearson correlation coefficients between microbial taxa and DEGs were calculated using tools on the Majorbio Cloud platform (https://cloud.majorbio.com/, accessed on 18 December 2024) [45]. Network analysis identified significant associations between differentially abundant microbes and immune-related gene expression.

2.9. Statistical Analysis

All data were analyzed using a one-way analysis of variance, followed by Tukey’s post hoc test in SPSS Statistics software (v27.0; SPSS Inc., Chicago, IL, USA). Results are presented as means ± standard deviations (SDs) from at least four biological replicates, with p < 0.05 considered statistically significant.

3. Results

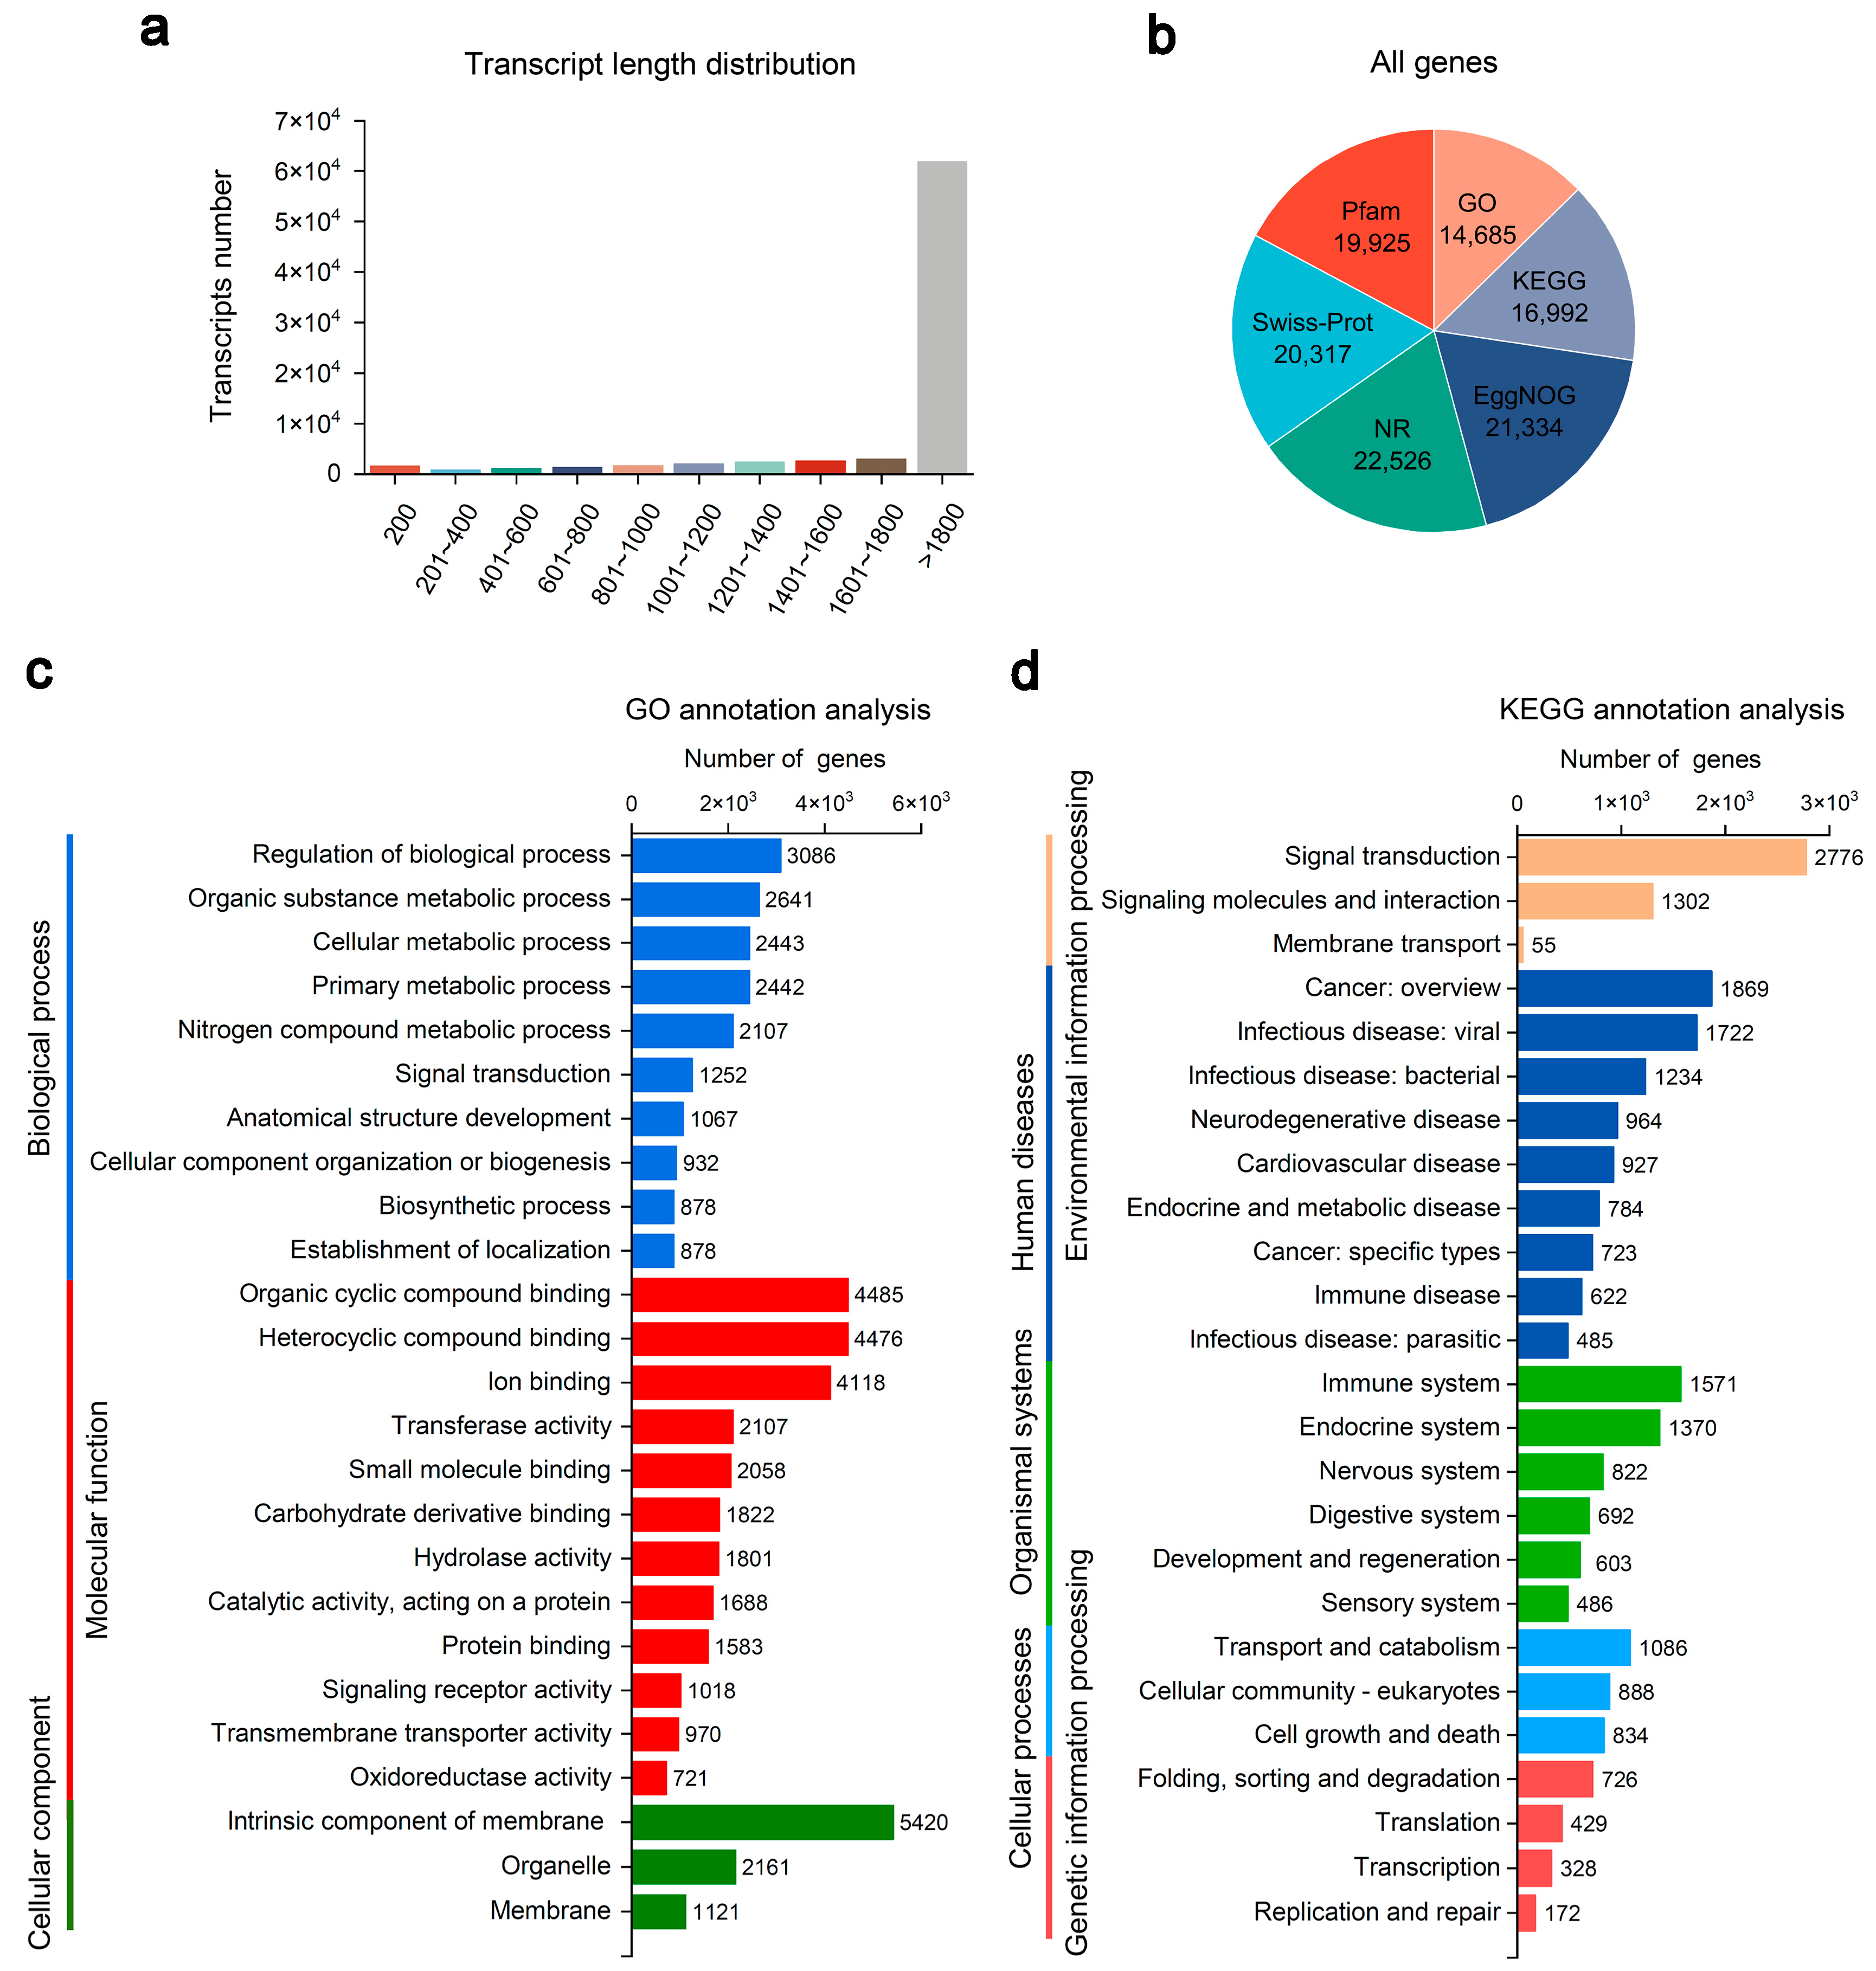
3.1. Transcriptome Overview of Mandarin Fish from Different Groups

To identify growth- and stress-related genes among mandarin fish groups, liver transcriptomes were analyzed. A total of 106.29 Gb of raw data was generated from the 15 samples across all three groups (five biological replicates per group), with each sample yielding over 6.32 Gb of clean data. After filtering, clean reads showed high quality, with Q30 scores above 95.78% (Table S1). The total and unique mapping rates to the reference genome ranged from 95.15% to 96.09% and from 88.96% to 90.73%, respectively (Table S2). As shown in Figure 1a, most transcripts exceeded 1800 bp, with the remaining transcripts ranging from 200 to 1800 bp. Many of these genes were successfully annotated using the protein databases (Figure 1b). The most significant number of mandarin fish genes were annotated in the NCBI non-redundant protein (NR) database (22,526 genes), the EggNOG database (21,334 genes), and the Swiss-Prot database (20,317 genes) (Figure 1b).
To gain further insight into the genes of mandarin fish, we performed a functional classification based on GO and KEGG annotations. As shown in Figure 1c, 14,685 genes were assigned to at least one GO term. Among the biological processes, “regulation of biological process,” “organic substance metabolic process,” and “cellular metabolic process” were the three most abundant terms (Figure 1c). Regarding molecular function, “organic cyclic compound binding,” “heterocyclic compound binding,” and “ion binding” were the three represented terms (Figure 1c). For the cellular component, “intrinsic component of membrane,” “organelle,” and “membrane” were the three most enriched terms (Figure 1c). Additionally, 16,992 genes were mapped to KEGG pathways, covering categories such as “environmental information processing,” “human diseases,” “organismal systems,” “cellular processes,” and “genetic information processing” (Figure 1d). These results collectively indicate a substantial number of DEGs across the mandarin fish groups.

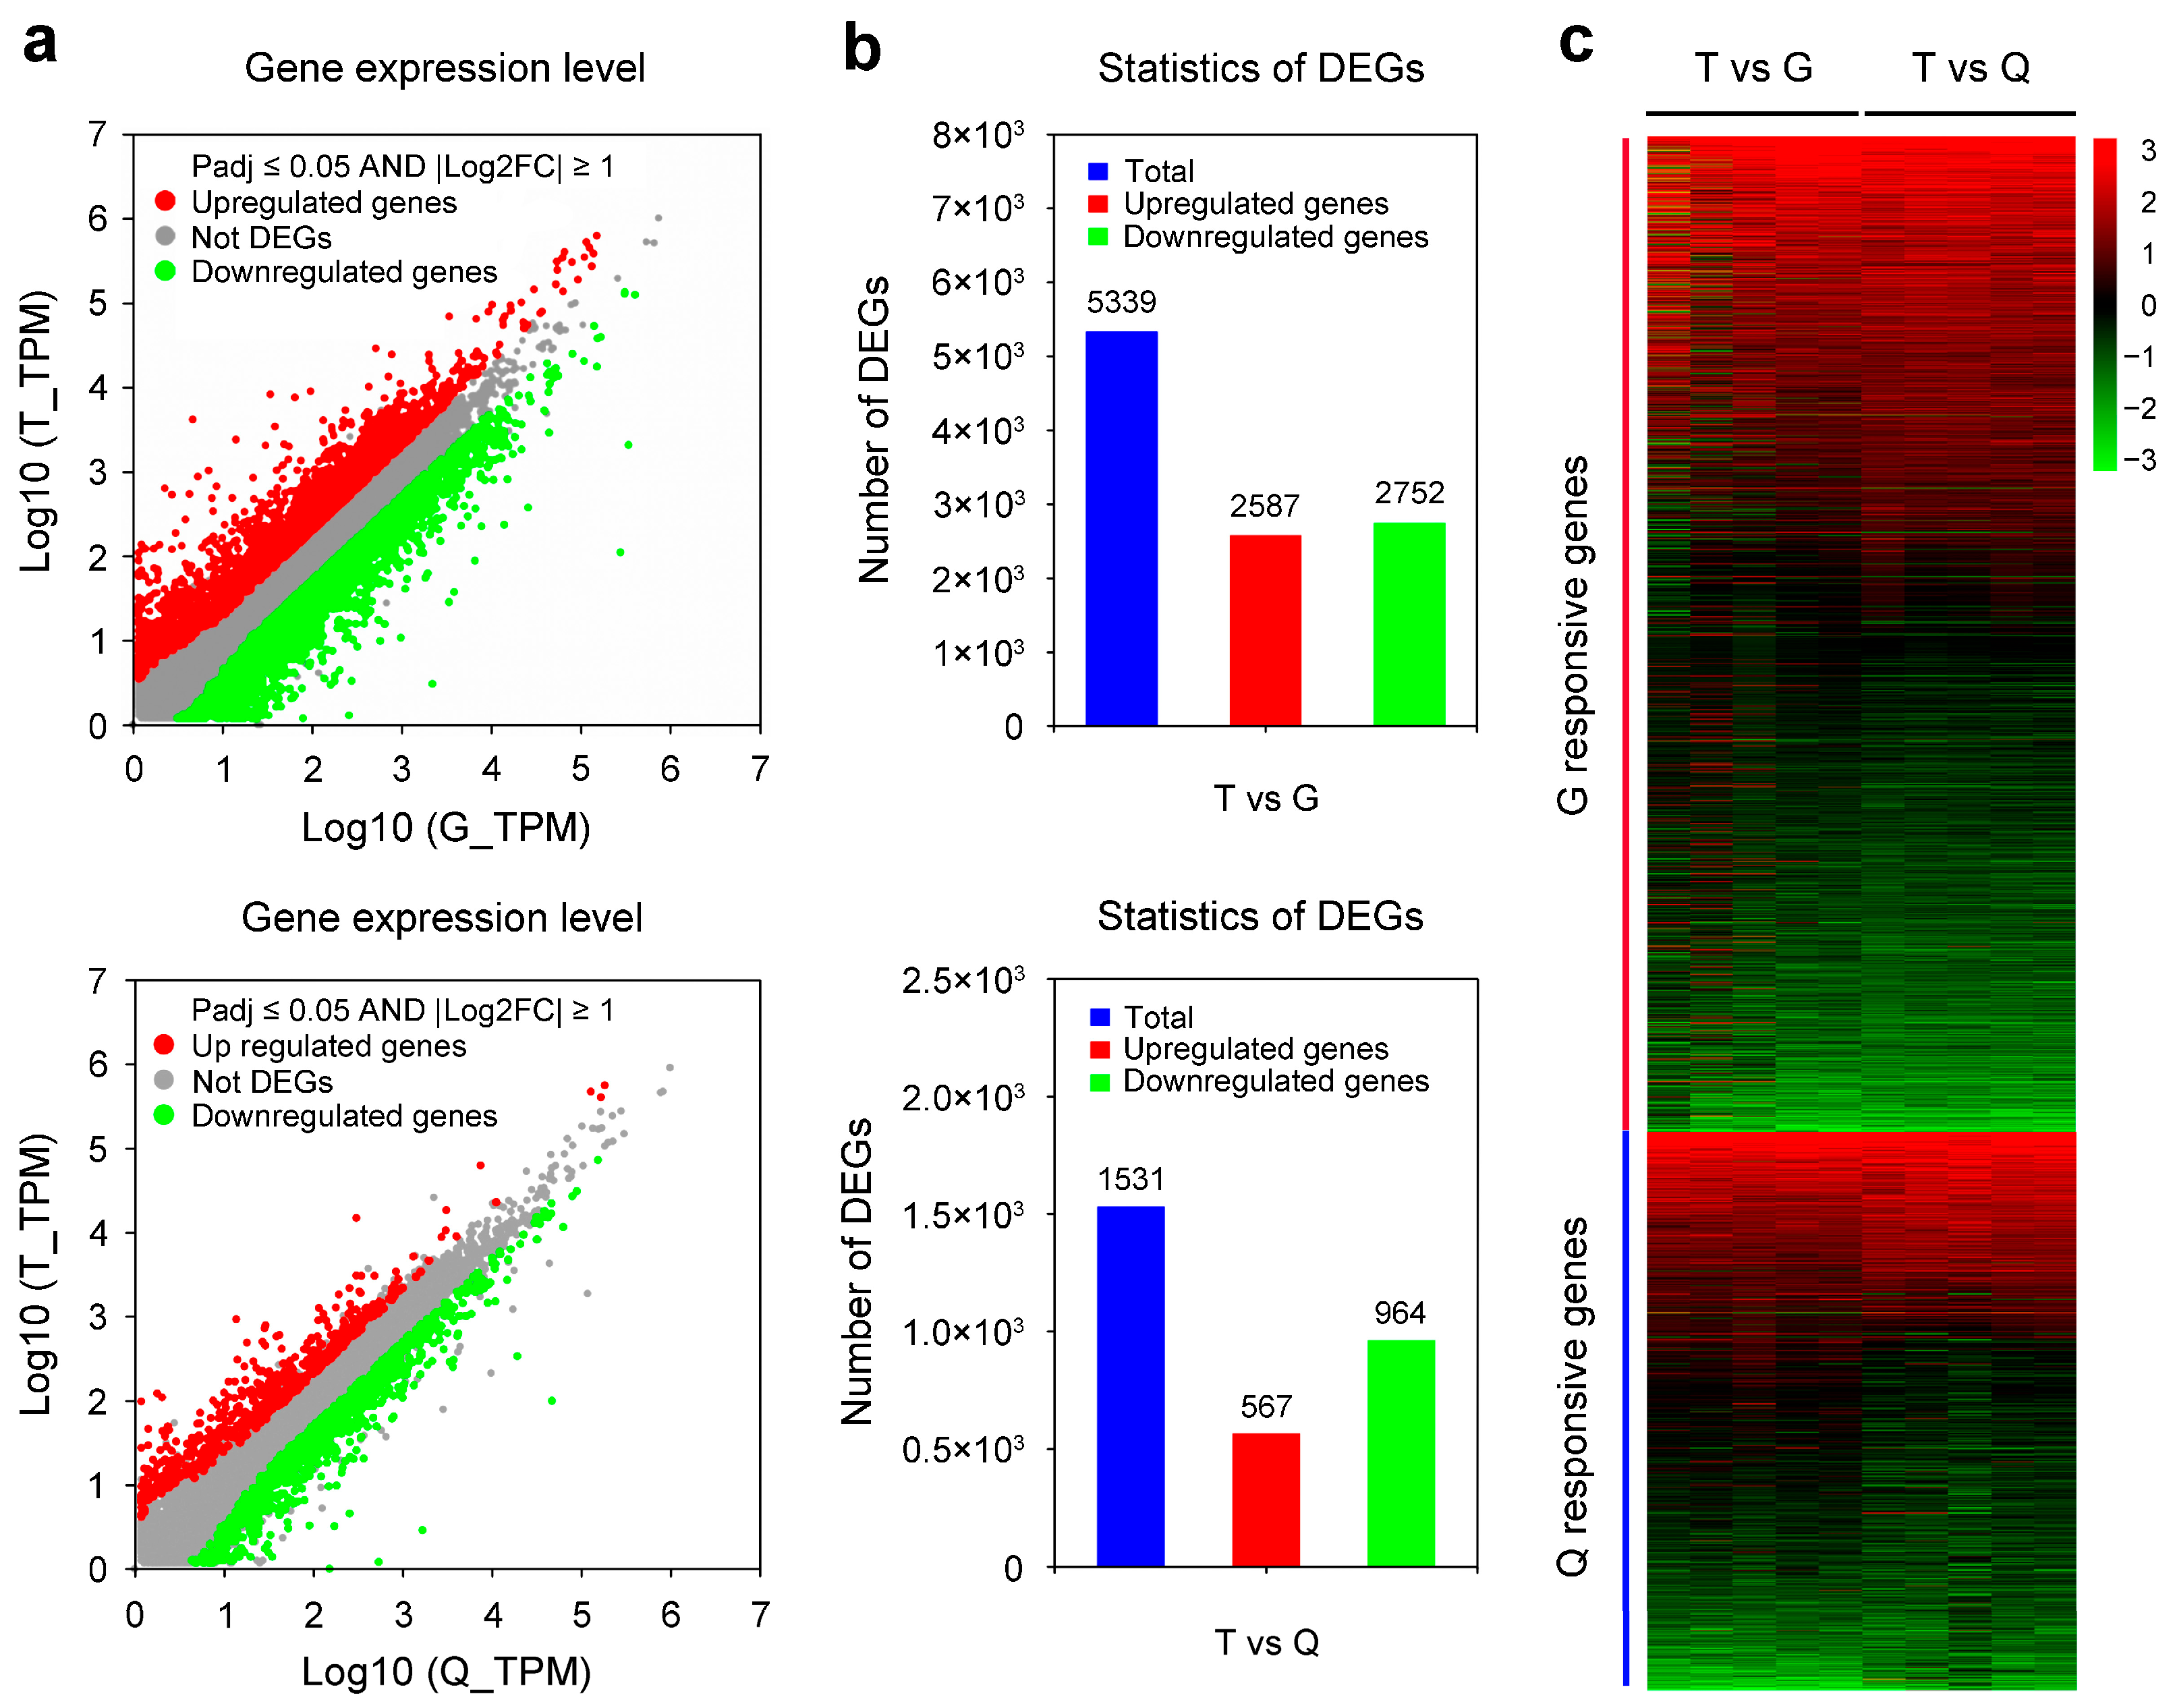
3.2. Scanning of DEGs in T Group Compared with the G and Q Groups

To identify DEGs in the T vs. G and T vs. Q comparisons, TPM values were used to calculate gene expression levels as described previously [36]. In this study, a strict criterion of 2-fold differences and Padj < 0.05 at the gene level was used as described in previous studies [20,42]. Scatter plots were used to visualize the differential expression of DEGs across comparisons of T vs. G and T vs. Q (Figure 2a). As shown in Figure 2b, a total of 5339 DEGs were identified in T vs. G, with 2587 upregulated and 2752 downregulated genes. In contrast, 1531 DEGs were detected in T vs. Q, including 567 upregulated and 964 downregulated genes. Notably, the numbers of upregulated and downregulated genes were nearly equal in the T vs. G comparison whereas downregulated genes were predominant in the T vs. Q comparison (Figure 2b). Furthermore, the hierarchical clustering analysis of these DEGs was also performed using a heatmap. As shown in Figure 2c, the DEGs in the T vs. G and T vs. Q comparisons displayed distinct expression patterns in mandarin fish livers across different groups.

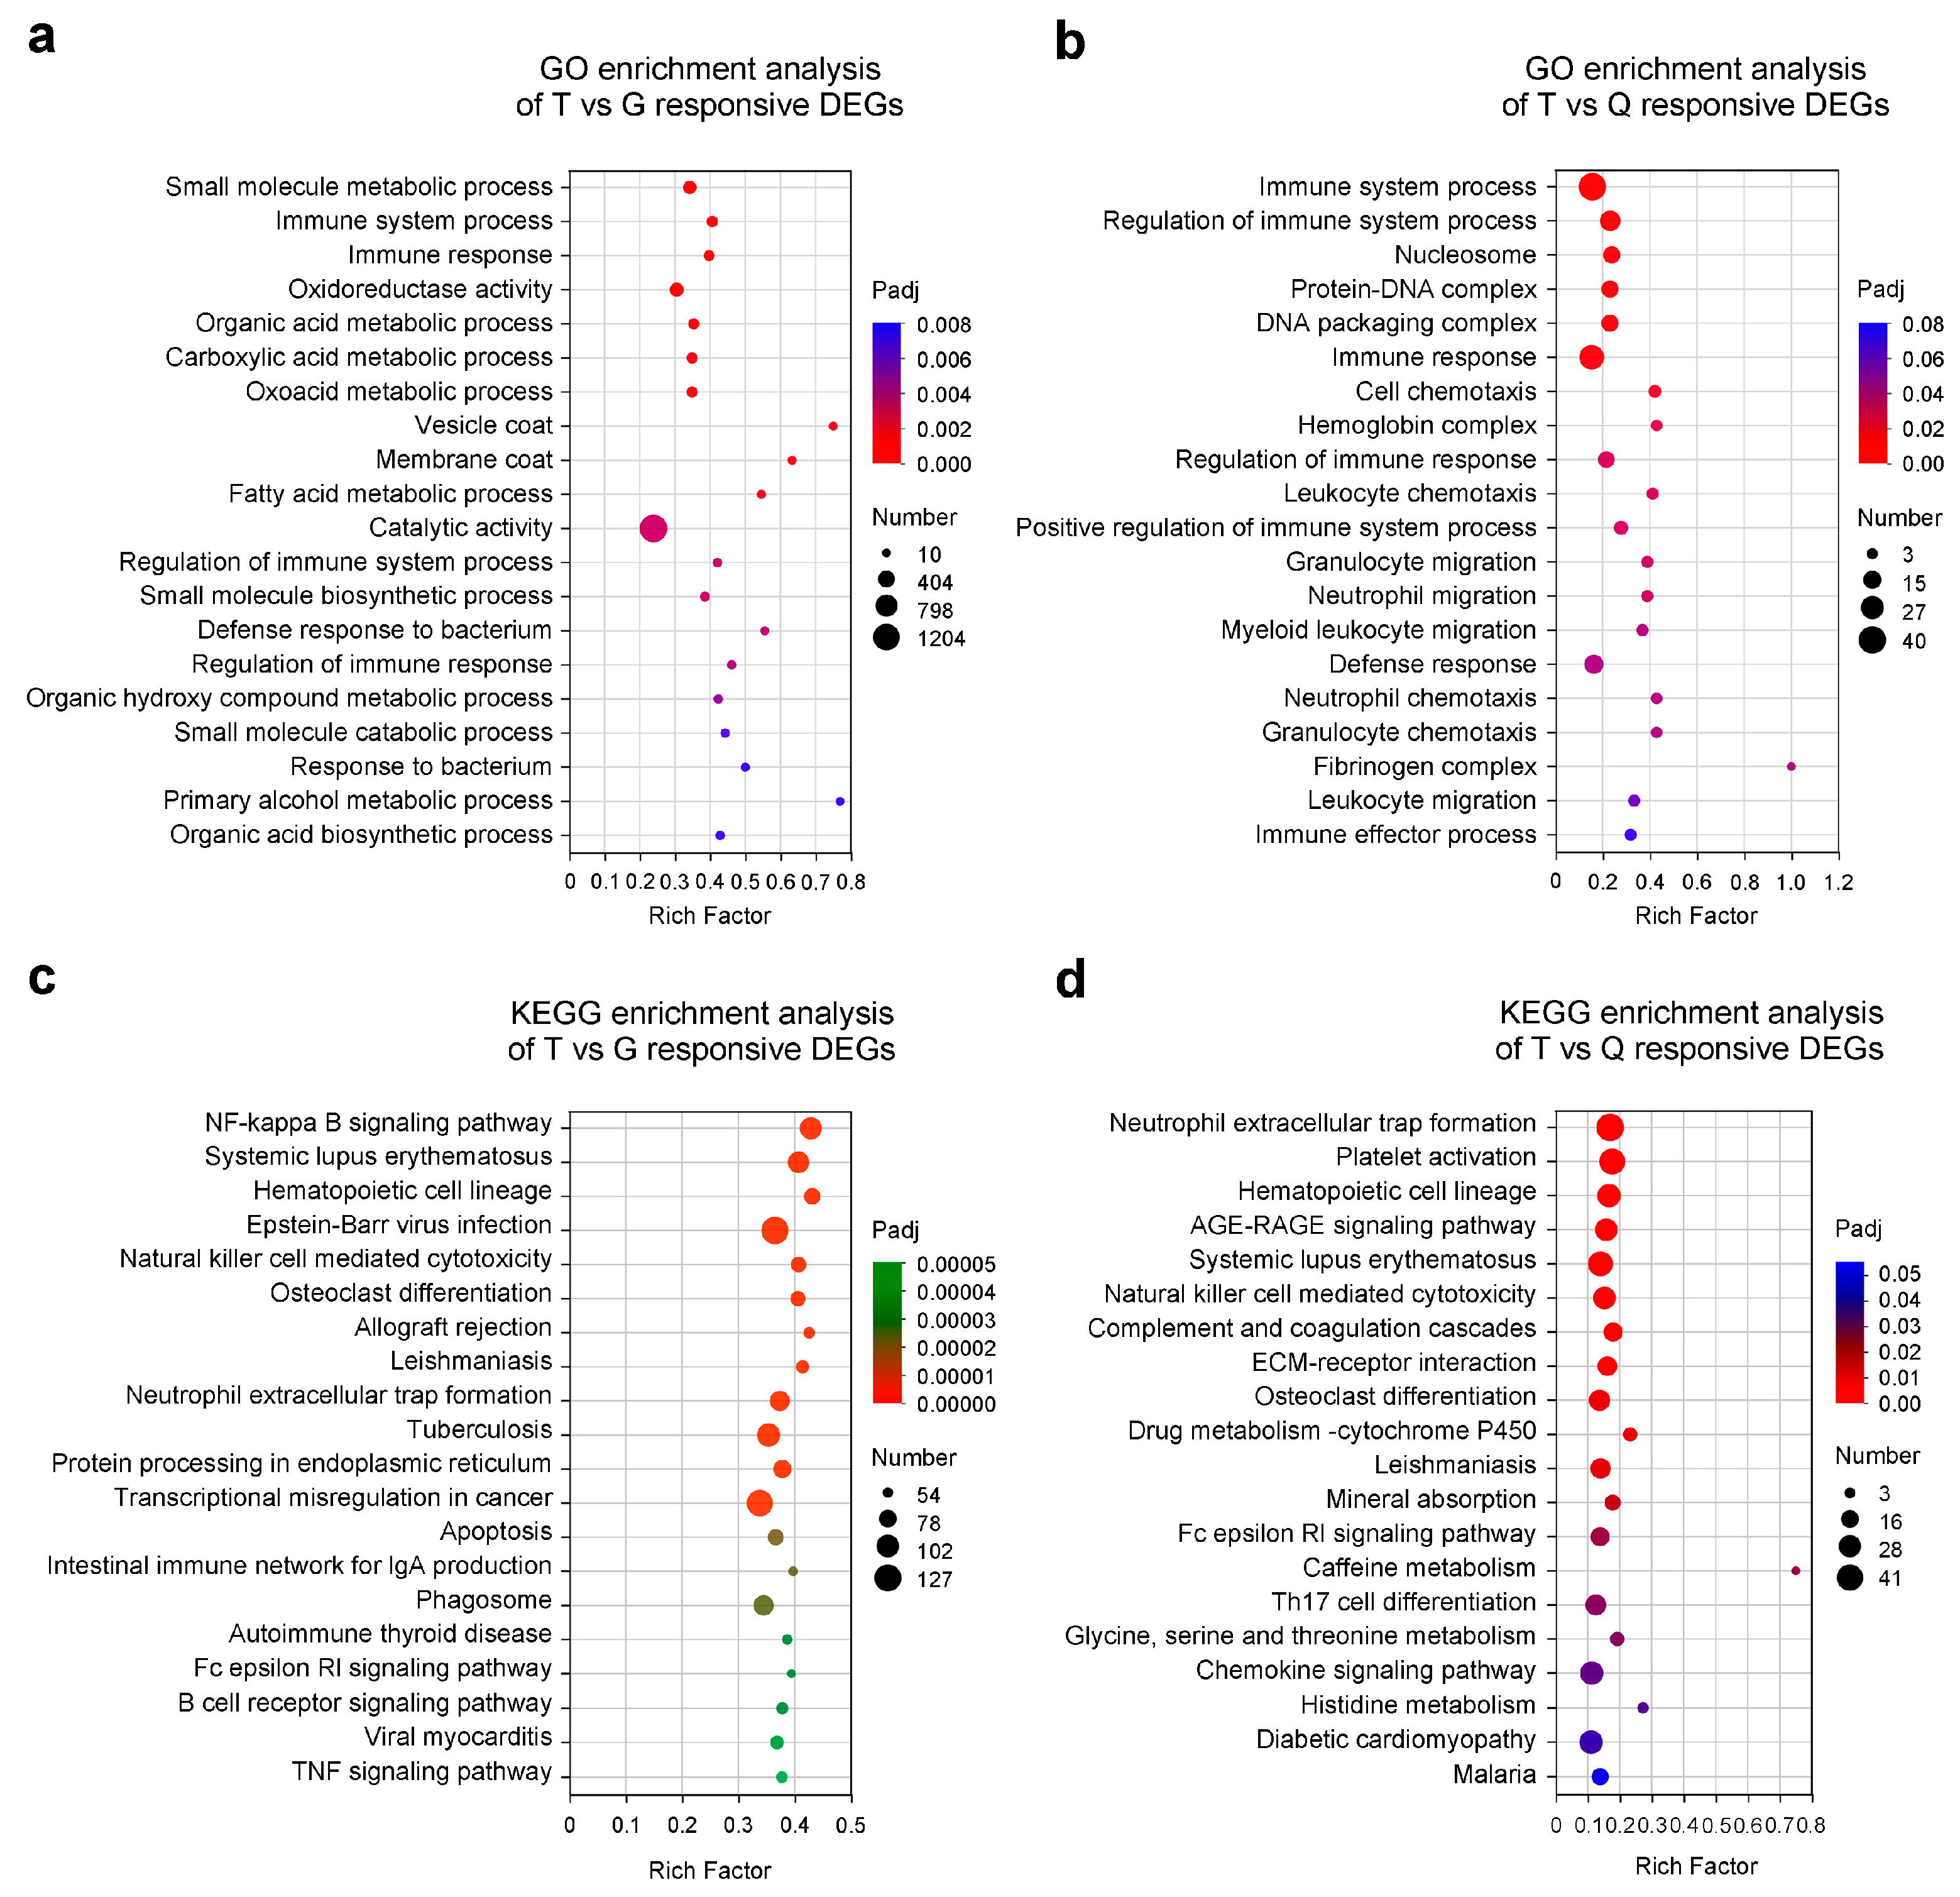
3.3. GO and KEGG Enrichment Analyses of the DEGs

To gain more information about the potential functions of these DEGs in mandarin fish, GO and KEGG enrichment analyses of 6870 DEGs from the T vs. G and T vs. Q comparisons were performed using GOatools and KOBAS-i, respectively. The DEGs were significantly enriched into 67 and 18 predicted GO terms for the T vs. G and T vs. Q comparisons, respectively (Tables S3 and S4). In the T vs. G comparison, the DEGs were mainly enriched in GO terms related to “small molecule metabolic process,” “immune system process,” “immune response,” “oxidoreductase activity,” “organic acid metabolic process,” “carboxylic acid metabolic process,” “oxoacid metabolic process,” and “vesicle coat” (Figure 3a). In contrast, in the T vs. Q comparison, the DEGs showed significant enrichment in GO terms such as “immune system process,” “regulation of immune system process,” “nucleosome,” “protein-DNA complex,” “DNA packaging complex,” “immune response,” “cell chemotaxis,” and “hemoglobin complex” (Figure 3b). Furthermore, KEGG enrichment analysis revealed that T vs. G DEGs were significantly enriched in pathways such as the “NF-kappa B signaling pathway,” “systemic lupus erythematosus,” “hematopoietic cell lineage,” “Epstein-Barr virus infection,” “natural killer cell-mediated cytotoxicity,” “osteoclast differentiation,” “allograft rejection,” and “leishmaniasis” (Figure 3c). Meanwhile, the T vs. Q DEGs showed marked enrichment in pathways including “neutrophil extracellular trap formation,” “platelet activation,” “hematopoietic cell lineage,” “AGE-RAGE signaling pathway,” “systemic lupus erythematosus,” “natural killer cell-mediated cytotoxicity,” “complement and coagulation cascades,” and “ECM-receptor interaction” (Figure 3d). Overall, DEGs in the T vs. G were mainly linked to small molecule metabolism and innate immune processes whereas those in the T vs. Q were more associated with immune system regulation and chromatin organization, suggesting that the T group may have possessed a greater ability to regulate their immune homeostasis and disease resistance.

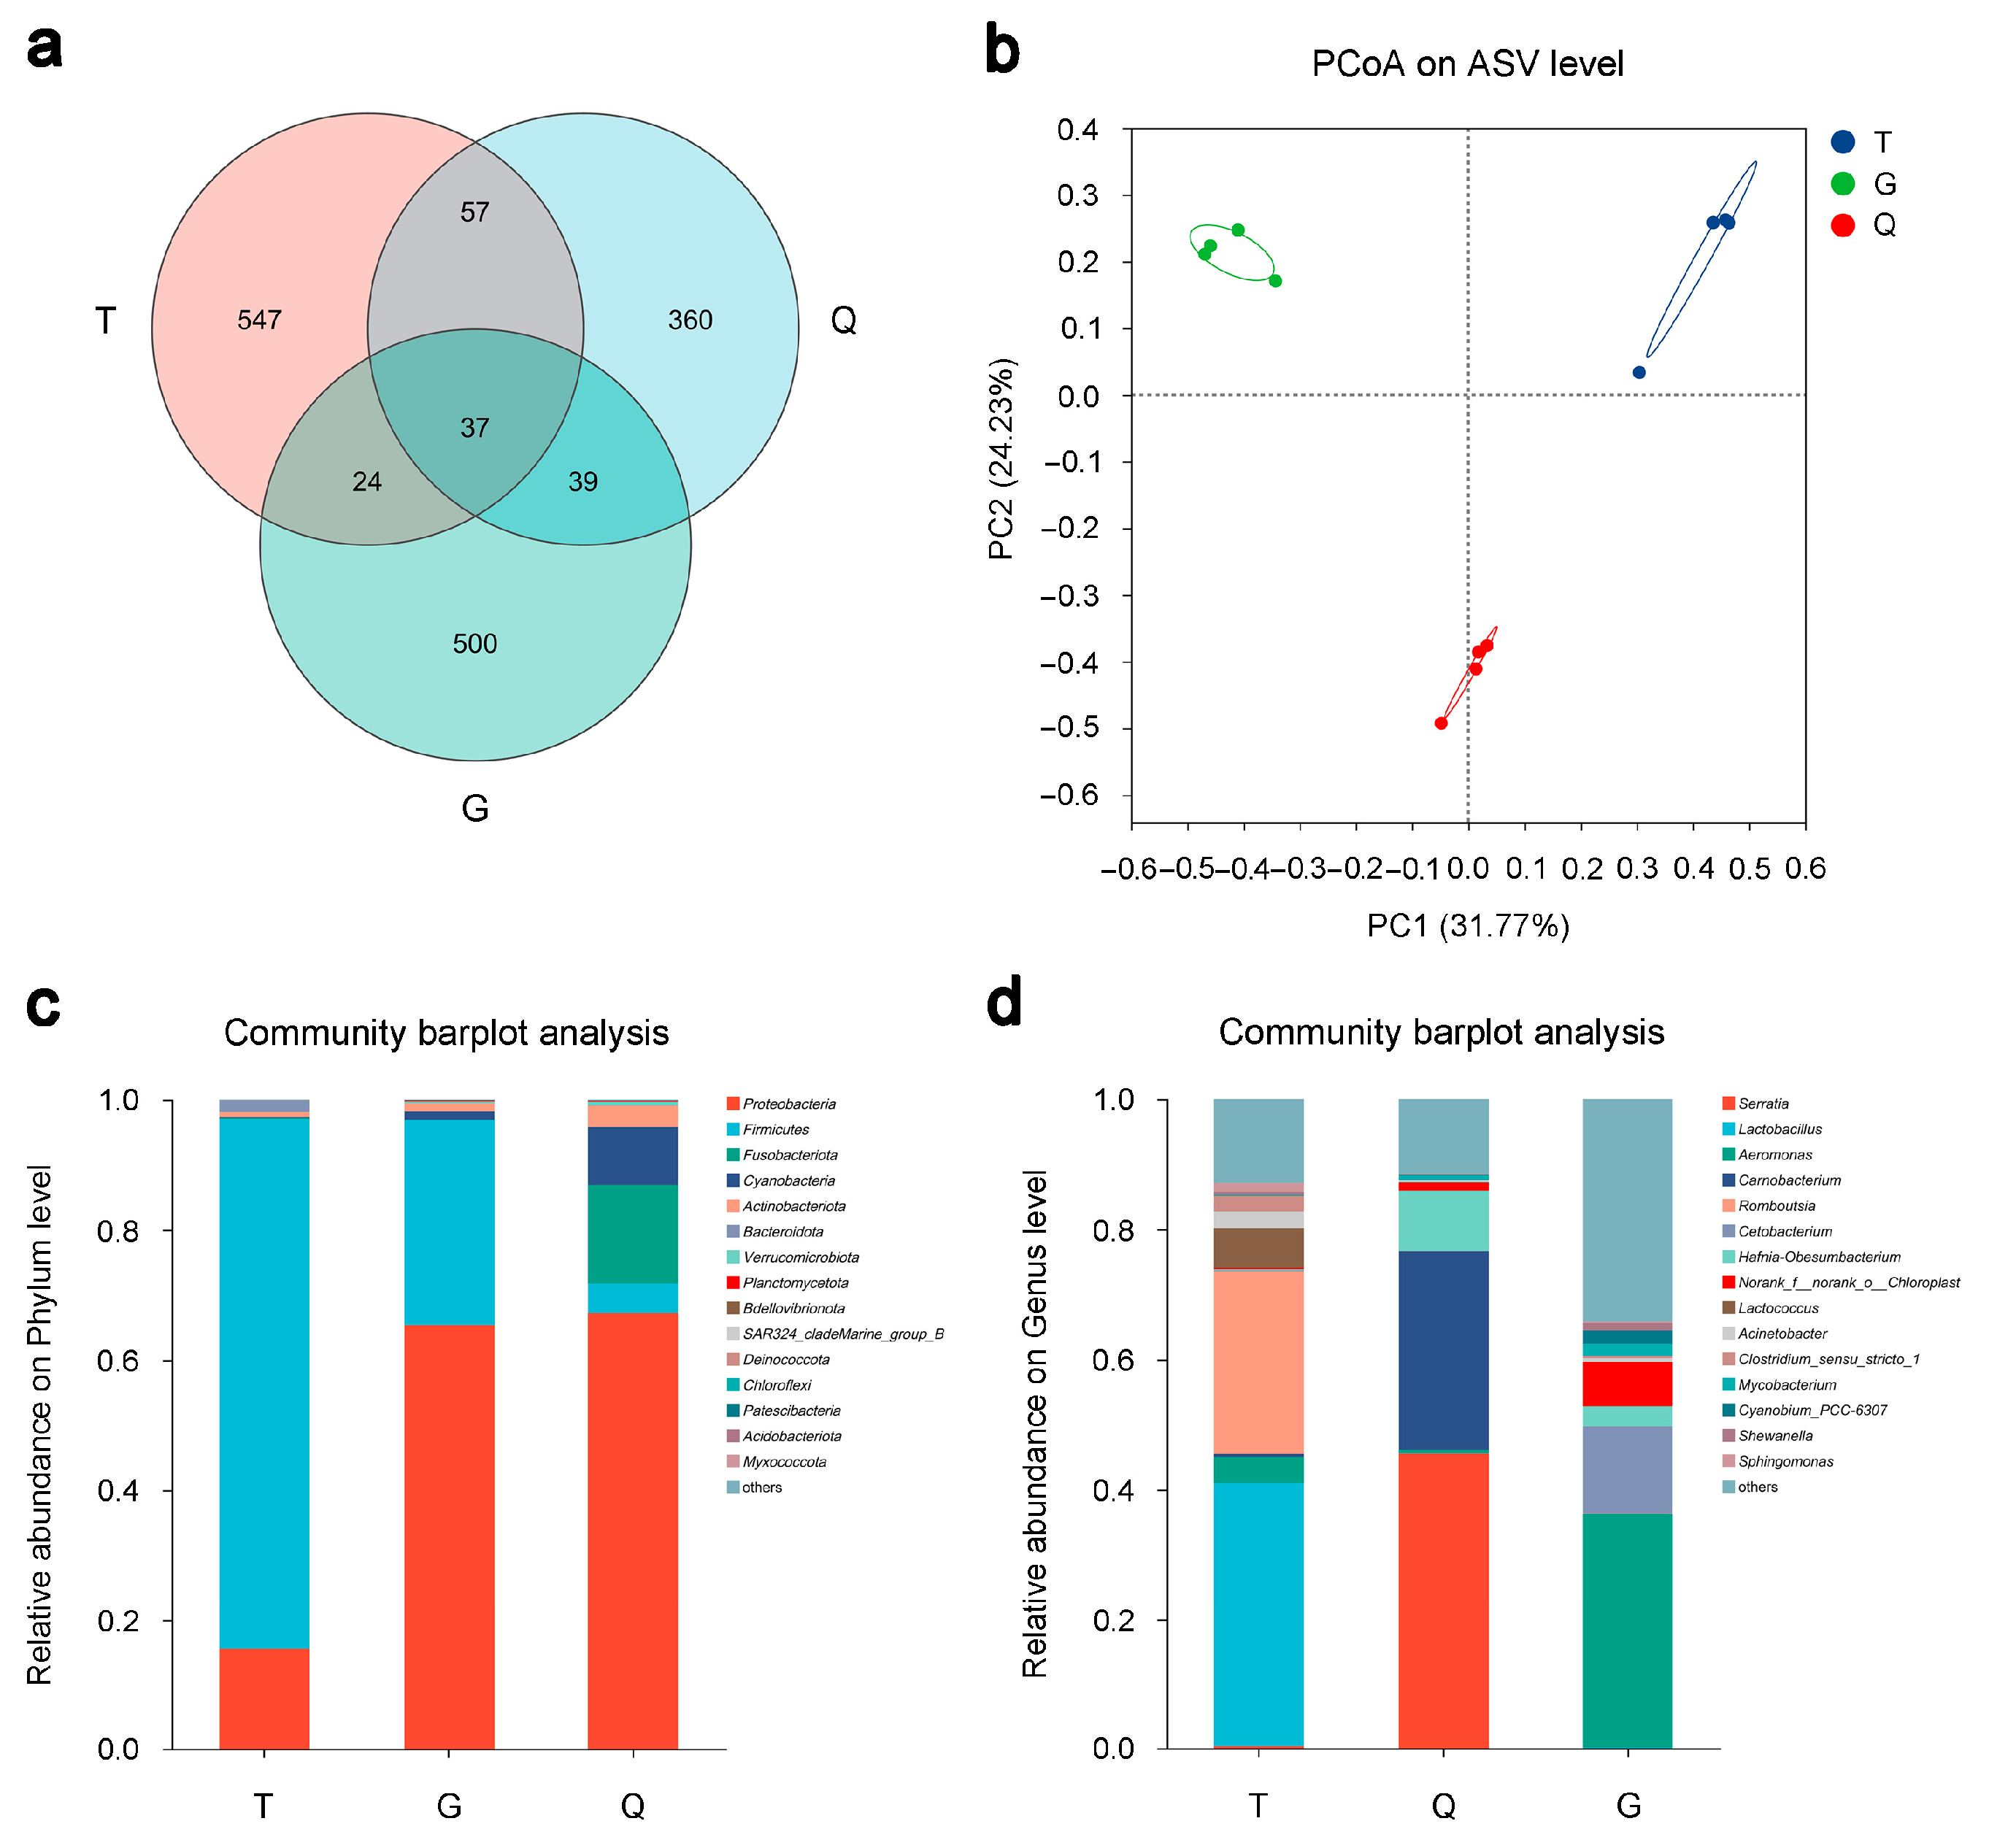
3.4. Overview of the Intestinal Microbiomes of Mandarin Fish from the T, G, and Q Groups

To investigate the differences in the intestinal microbiota of mandarin fish across the T, G, and Q groups, the V3–V4 region of the 16S rRNA gene was amplified and sequenced. As a result, a total of 886.33 kb reads were yielded across all samples, collectively representing 3.75 Gb of data (Table S5). After quality filtering, 2680 ASVs were identified, with 547, 500, and 360 unique to the T, G, and Q groups, respectively (Figure 4a). Among these, 37 ASVs were common to all three groups, and 61, 94, and 76 ASVs were shared between the T-G, T-Q, and G-Q pair comparisons, respectively (Figure 4a), indicating both group-specific and shared microbial profiles. PCoA analysis revealed clear separation among the different groups, with PC1 and PC2 explaining 31.77% and 24.23% of the total variance, respectively (Figure 4b), indicating distinct compositional differences in the intestinal microbiota across the three mandarin fish groups. Bar plot analysis revealed a predominance at the phylum level: Proteobacteria dominated across all groups, followed by Firmicutes and Fusobacteriota, with a lower abundance of Actinobacteriota, Planctomycetota, and Verrucomicrobiota (Figure 4). The T group had a higher proportion of Firmicutes whereas the G and Q groups showed an increased proportion of Fusobacteriota (Figure 4c). At the genus level, Serratia, Lactobacillus, and Aeromonas were the most abundant overall (Figure 4d), with Lactobacillus enriched in the T group, Serratia in the G group, and Aeromonas in the Q group. Additional taxa such as Romboutsia and Cetobacterium contributed to the group-specific microbial signatures (Figure 4d). Together, these findings demonstrated distinct compositional differences in the intestinal microbiota among the three mandarin fish groups at both the phylum and genus levels, likely shaped by geographic or environmental factors.

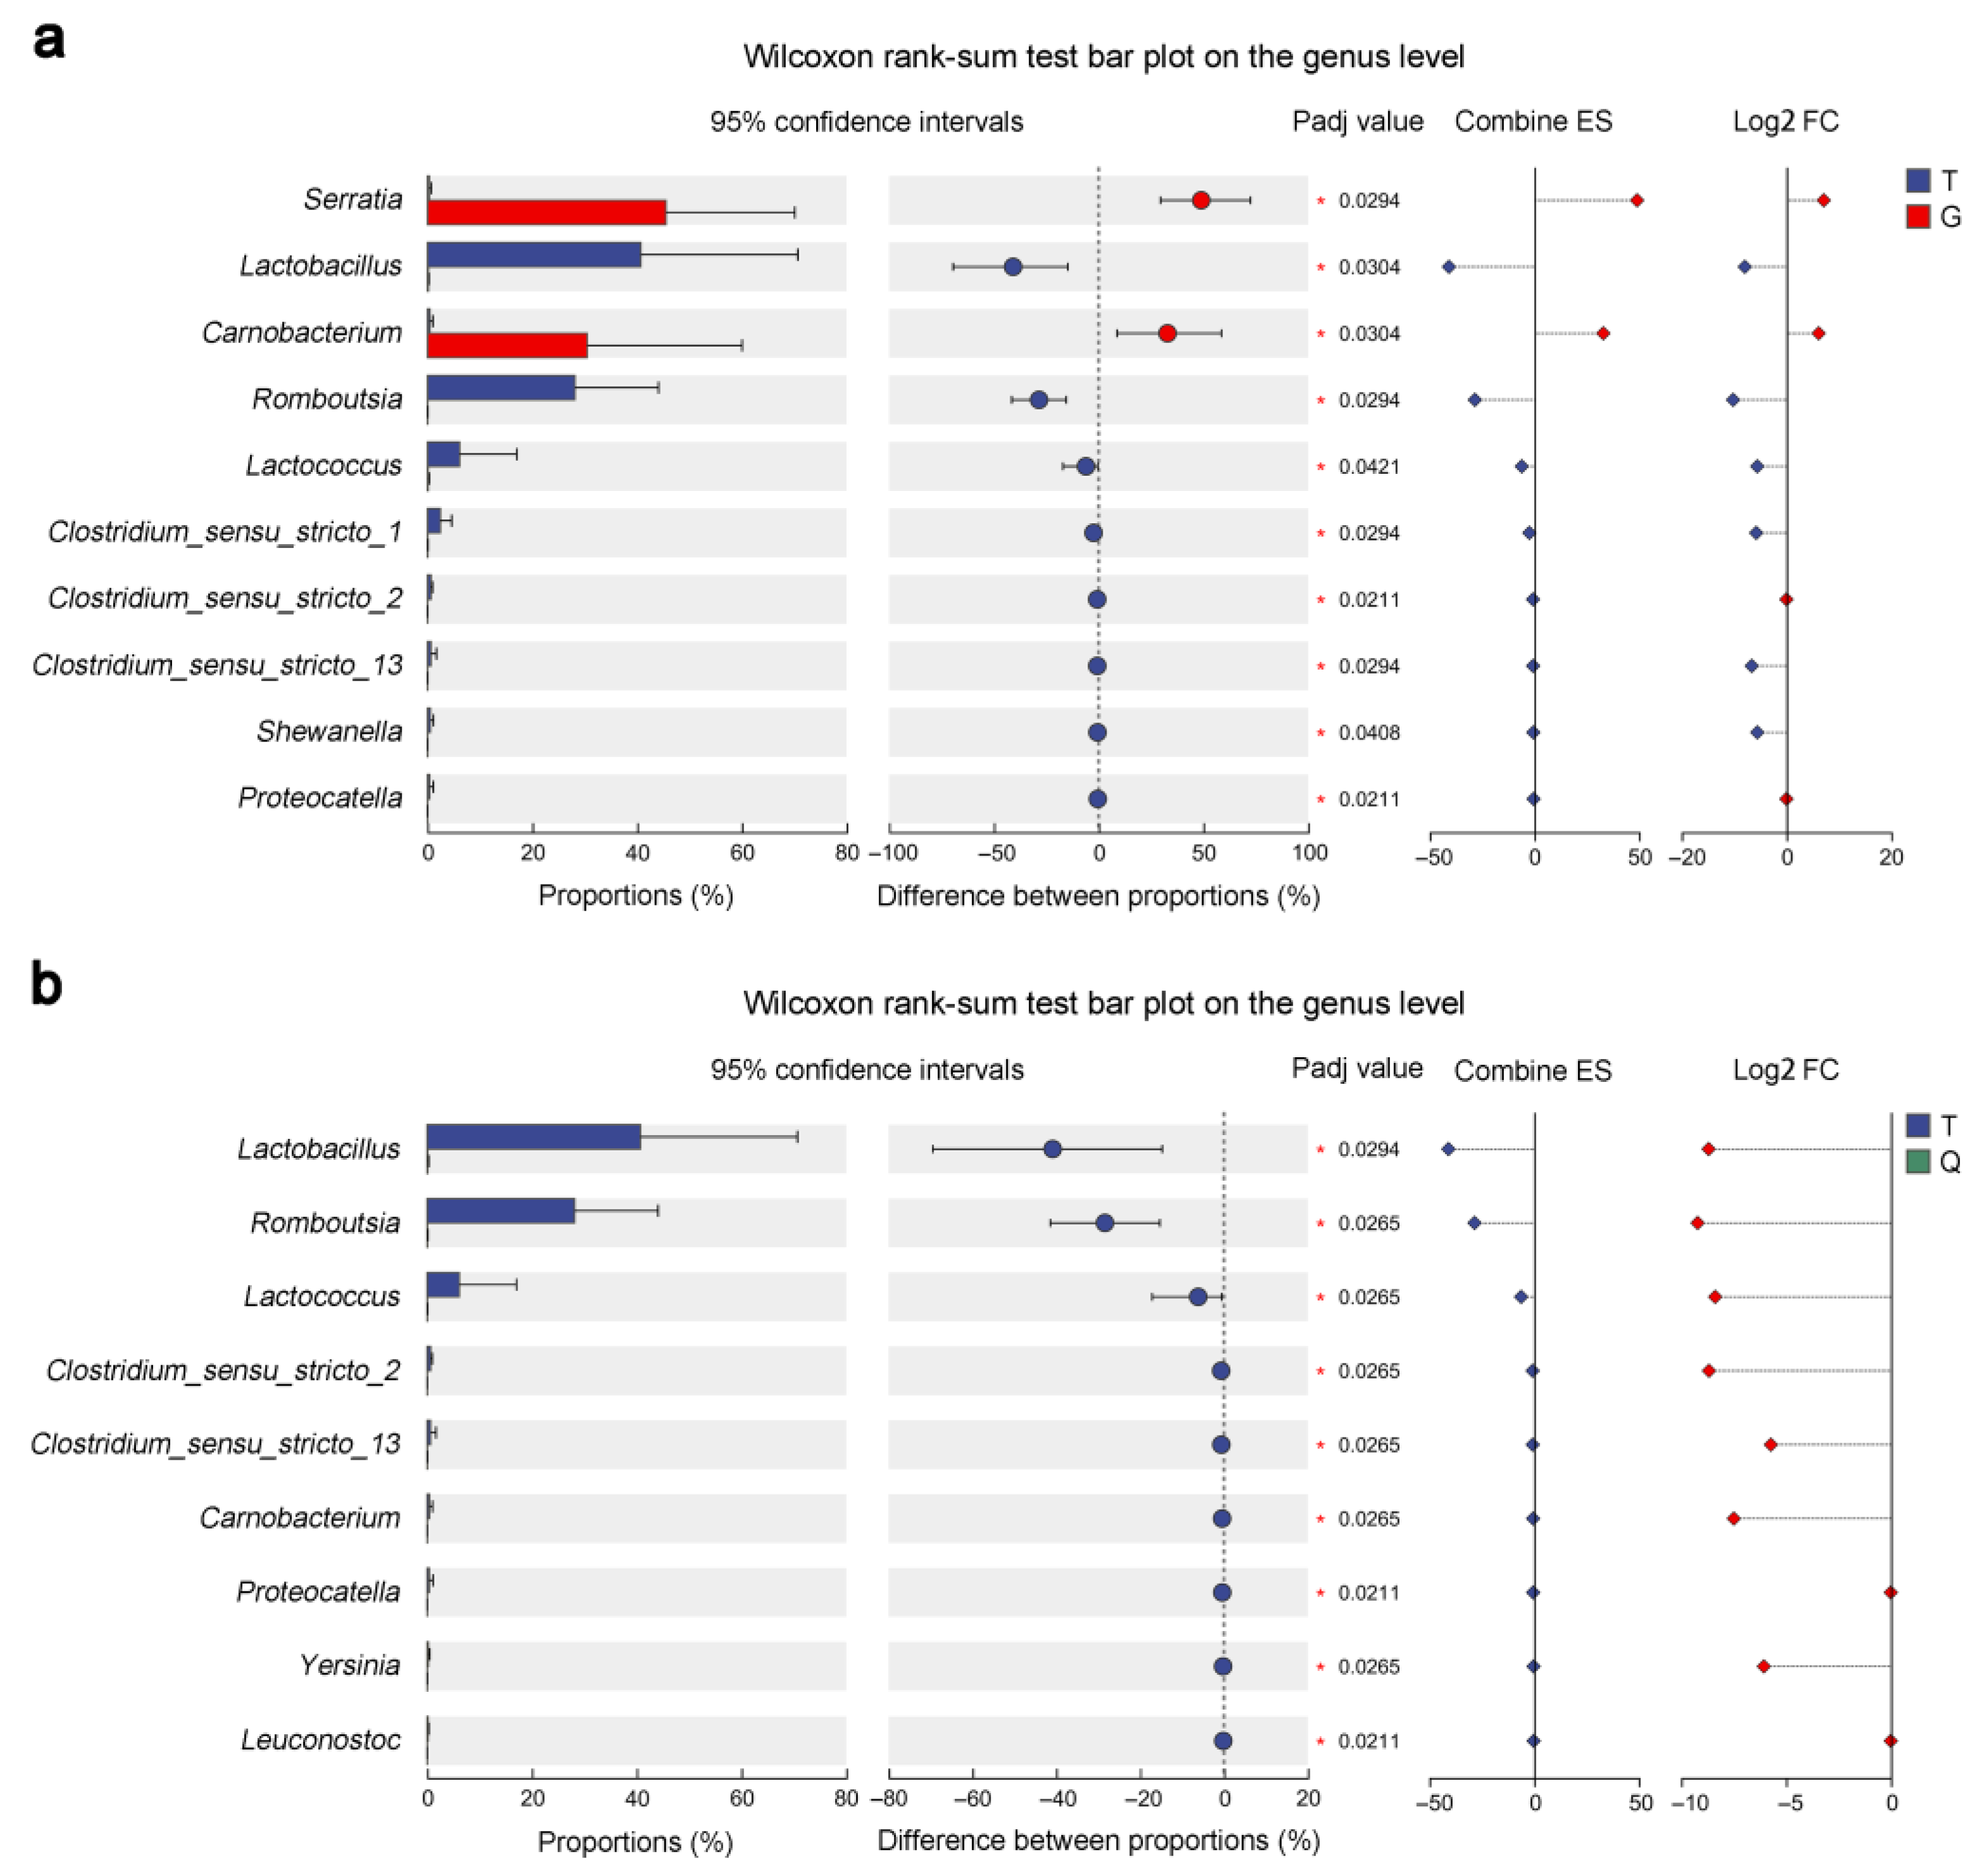
3.5. Compositional Changes in the Intestinal Microbiota of Mandarin Fish from the T, G, and Q Groups

To further explore taxonomic differences, we performed a comparative analysis of genus-level bacterial abundance profiles across the T, G, and Q mandarin fish groups. As shown in Figure 5a, in T vs. G, Lactobacillus and Romboutsia were significantly enriched in the T group, whereas Serratia and Carnobacterium were enriched in the G group (p < 0.05). Furthermore, Clostridium_sensu_stricto_1 and Clostridium_sensu_stricto_2 were also more abundant in the T group (p < 0.05). Log2FC (fold change) analysis further confirmed Serratia as the most enriched in the G group (Figure 5a). In T vs. Q, the T group showed significantly higher levels of Lactobacillus, Romboutsia, and Lactococcus (p < 0.05) (Figure 5b), with Log2FC analysis highlighting Lactobacillus as the most enriched genus (Figure 5b). These genus-level differences suggest that geographic separation and local environmental variation play key roles in shaping the intestinal microbiota of mandarin fish.

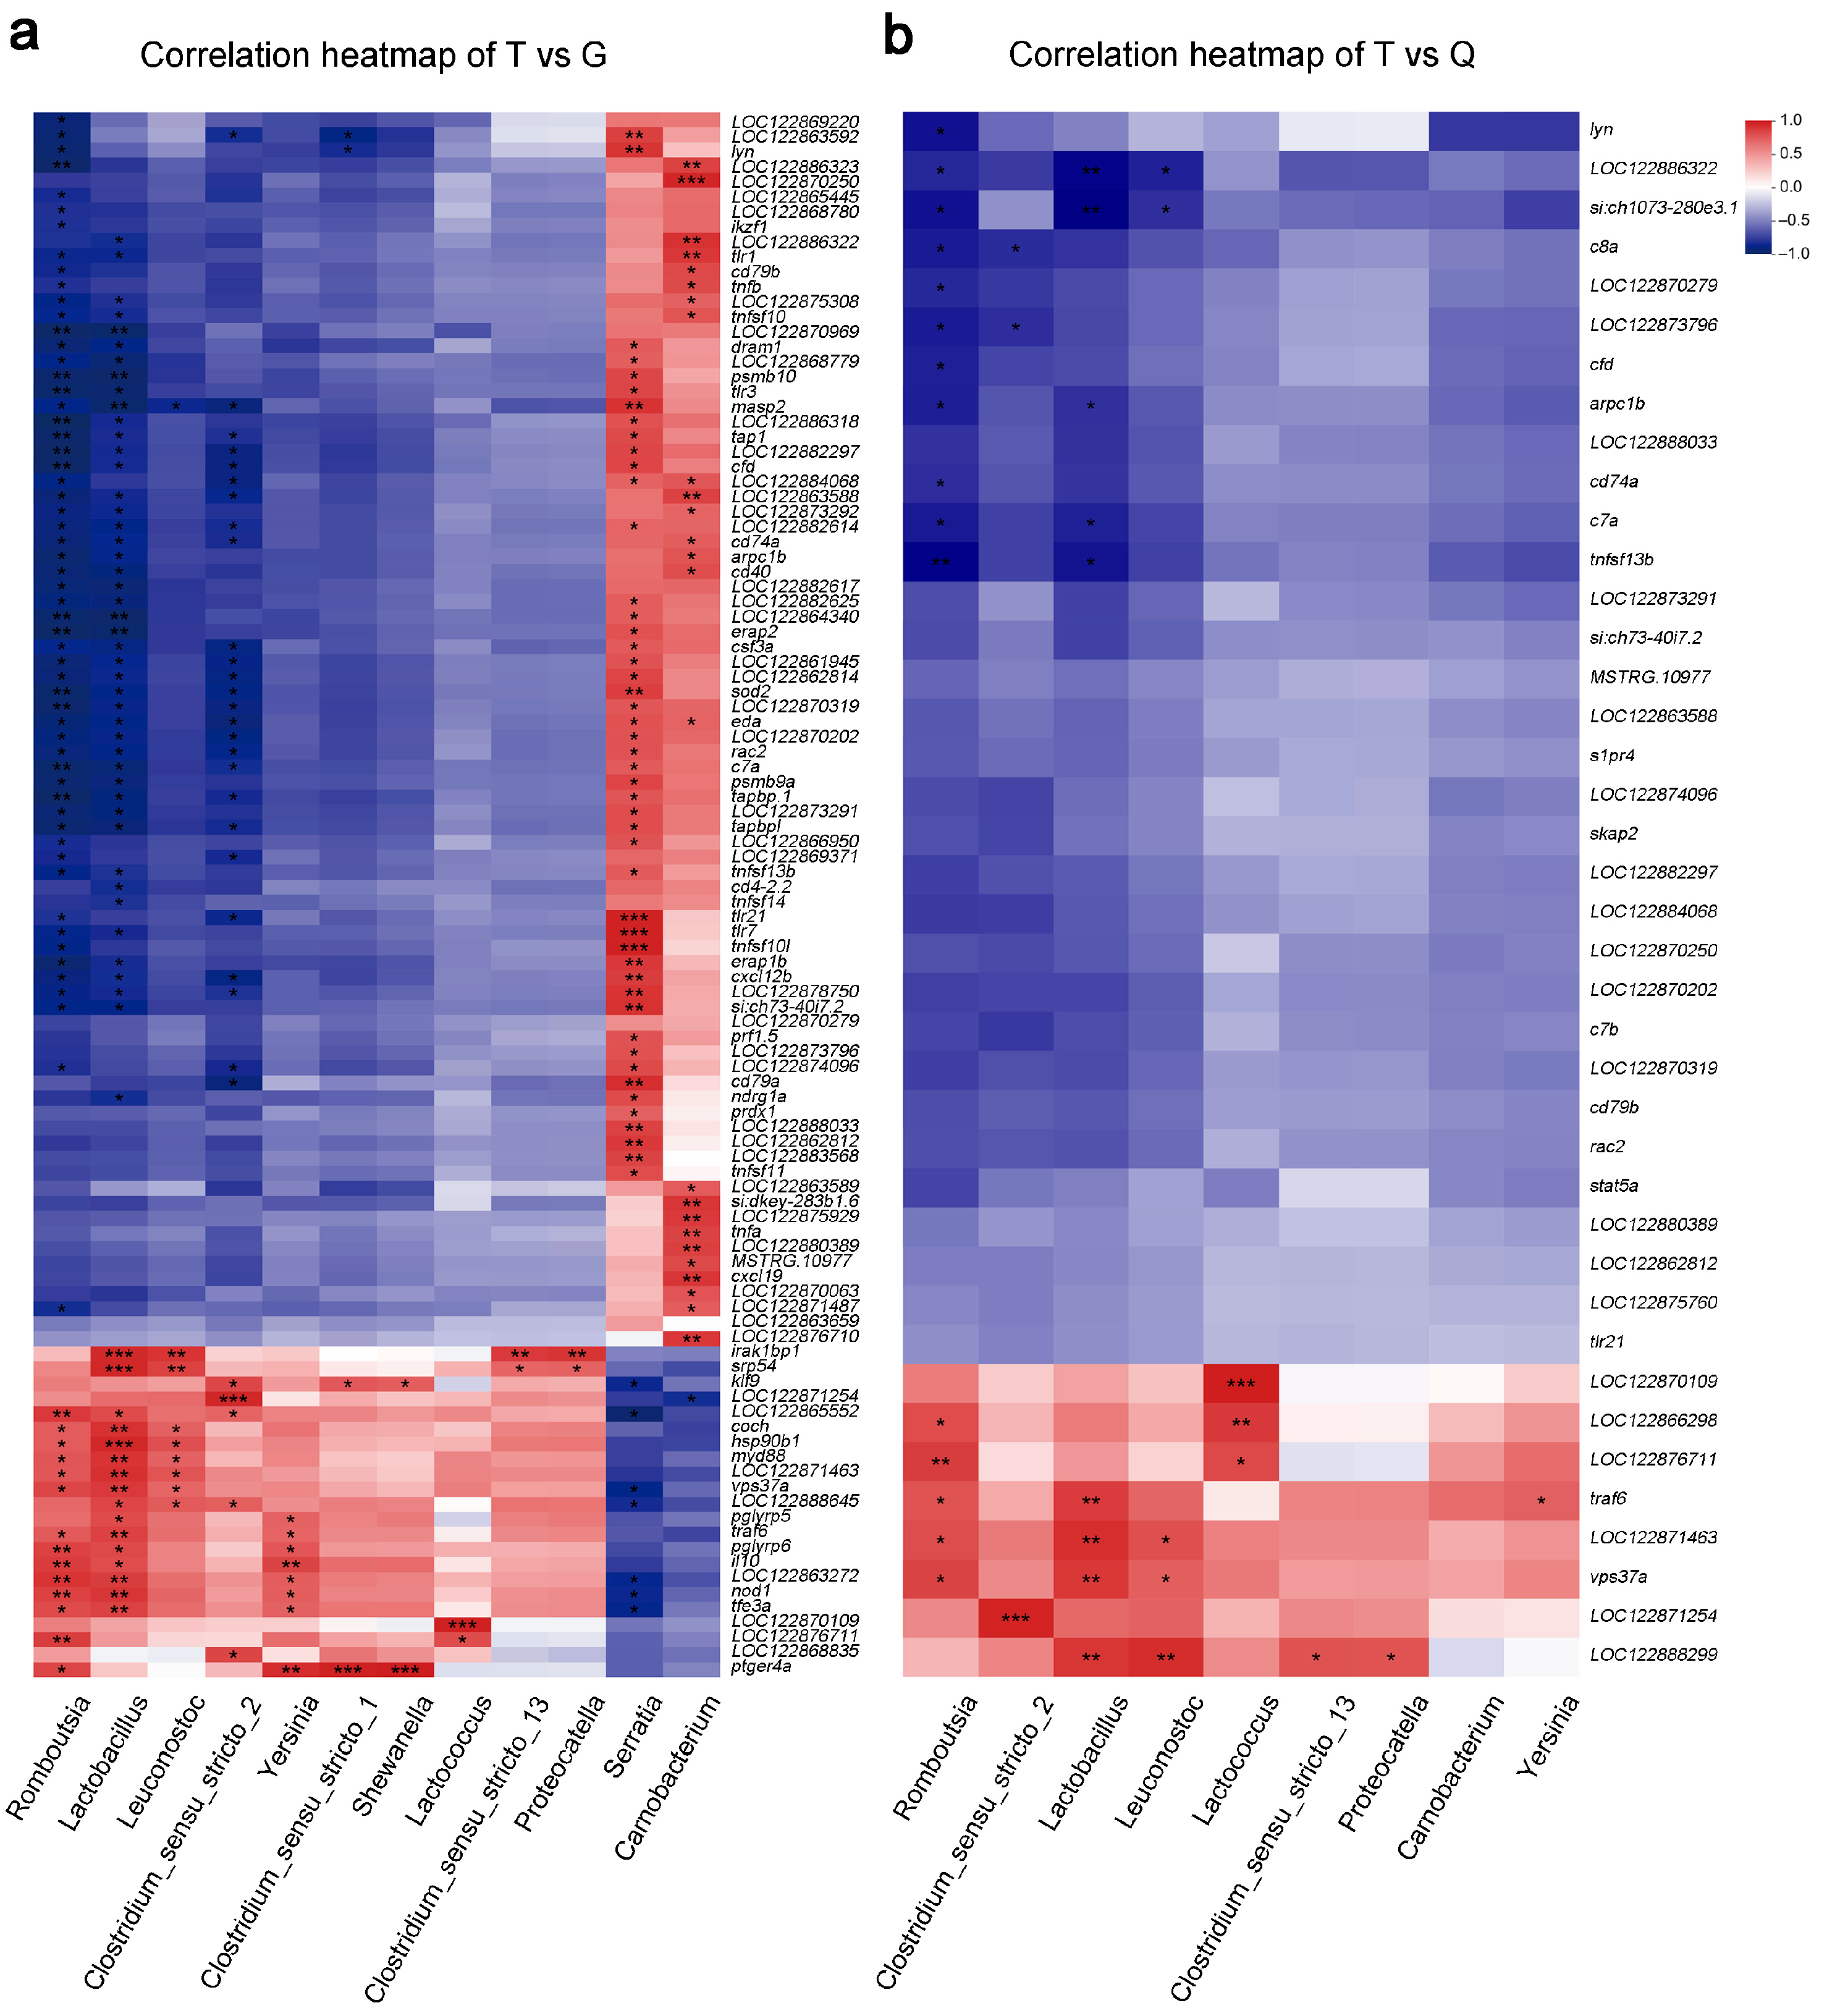
3.6. Bipartite Network of Microbe–Gene Interactions in T, G, and Q Groups

To explore the functional relationships between intestinal microbiota and host immune regulation, Pearson correlation analysis was conducted using genes annotated under the GO biological pathway of the “immune system process.” In the T vs. G comparison, several immune-related genes, including tlr21, tlr7, and tnfsf10l, showed significant positive correlations with Serratia and negative correlations with Romboutsia (Figure 6a). Likewise, genes such as tfrc, tnfsf10, stat5a, and psmb10 exhibited strong negative associations with Romboutsia and Lactobacillus (Figure 6a and Table S6). In the T vs. Q comparison, the immune-related gene LOC122888299 was positively correlated with Lactobacillus, Leuconostoc, Clostridium_sensu_stricto_13, and Proteocatella, but LOC122886322 was negatively correlated with Romboutsia, Lactobacillus, and Leuconostoc (Figure 6b). In addition, other immune-related genes, such as si:ch1073-280e3.1, vps37a, and LOC122871463, displayed complex interaction patterns, exhibiting both positive and negative correlations with distinct microbial taxa in a group-dependent manner (Figure 6b and Table S7). These findings were consistent with those of previous microbiomic studies that identified a specific set of pathogenic bacteria, such as Serratia, and beneficial bacteria, including Romboutsia, Lactobacillus, and Clostridium_sensu_stricto_13, as key contributors to the health and growth performance of various fish species [53,54,55]. Collectively, the heatmap analyses demonstrated distinct microbiota–gene correlation patterns, suggesting a nuanced regulatory role of the intestinal microbiota in immune function across mandarin fish groups.

4. Discussion

Previous studies had shown that the combined approach combining RNA-Seq and 16S rRNA microbiome analysis was a powerful tool for investigating the response mechanisms of aquatic species such as Micropterus salmoides, Oryzias latipes, and Lateolabrax maculatus to environmental stimuli [56,57,58]. In this study, we employed this integrated approach to provide a comprehensive analysis of the transcriptome and microbiome differences among mandarin fish from three distinct groups (T, G, and Q), uncovering substantial variations in gene expression profiles and microbial communities. These differences likely stem from a combination of genetic, environmental, and microbial influences, which have important implications for understanding fish physiology, immunity, and potential applications in aquaculture.
Over the past decade, RNA-Seq has been widely used to investigate tissue-specific transcriptomic responses in mandarin fish under various biotic and abiotic stresses. For instance, Zhou et al. [59] identified 1019 DEGs in head kidneys following Flavobacterium columnare infection. Huang et al. [60] reported 3095 and 1854 DEGs in kidney tissue at 24 and 60 h post infection with S. chuatsi rhabdovirus. Zhang et al. [61] identified 309 DEGs in the spleen in response to red sea bream iridovirus. Gao et al. [62] reported 15 antimicrobial DEGs in the blood after exposure to Aeromonas hydrophila. Ding et al. [63] detected 97 DEGs in the liver under hypoxic stress and later identified 141 and 552 DEGs in the gills and brain, respectively, under similar conditions [64]. Despite these advances, transcriptomic data exploring the adaptive mechanisms of mandarin fish remain limited.
In this study, an RNA-Seq-based comparative transcriptomic analysis of three mandarin fish groups was conducted to reveal the molecular mechanisms underlying their adaptive strategies to different culture environments (Figure 1). The transcriptomic analysis revealed substantial differences in gene expression patterns across the three groups, with 5339 DEGs identified in the T vs. G comparison and 1531 DEGs in the T vs. Q comparison (Figure 2a,b). High mapping rates (>95%) and extensive gene annotations (e.g., 22,526 genes in the NR database) further validated the reliability of our sequencing data (Figure 1 and Figure 2). Notably, the enrichment of metabolic processes such as the “small molecule metabolic process” and “organic acid metabolic process” in the T group (Figure 3a,b) suggests enhanced energy efficiency, possibly contributing to superior growth under specific conditions. KEGG pathway analysis further showed the enrichment of immune-related pathways such as “NF-kappa B signaling pathway” and “natural killer cell-mediated cytotoxicity” in the T group (Figure 3c,d), indicating stronger immune capacity. These findings support those of previous studies showing that localized culture environments promote immune gene expression and enhance immune homeostasis throughout the mandarin fish lifespan [65,66]. Such transcriptomic differences likely reflect environmental adaptation and have important implications for selective breeding to improve disease resistance and growth in mandarin fish aquaculture.
Previous studies had shown that alterations in the structural composition and abundance of intestinal microbiota could affect host immunity, metabolism, and gut integrity [30,67]. Our results revealed distinct microbiota among the three mandarin fish groups, with Proteobacteria, Firmicutes, and Fusobacteriota as the dominant phyla (Figure 4 and Figure 5). The T group had a higher abundance of Firmicutes, particularly Lactobacillus, whereas the G and Q groups showed an increased abundance of Fusobacteriota and Proteobacteria (Figure 4c and Figure 5a). These findings were consistent with those in previous studies showing that the fish intestinal microbiota composition is affected by both host genetics and environmental factors [68,69]. Notably, the observed predominance of Lactobacillus in the T group holds significant biological relevance given the well-established probiotic functions of this genus across diverse fish species [70,71]. The presence of beneficial microbes like Lactobacillus may have contributed to improved gut health, nutrient absorption, and immune function in the T group (Figure 4c and Figure 5b). In contrast, the higher abundance of potential pathogens such as Aeromonas in the Q group may suggest increased disease susceptibility, given the well-established pathogenicity of this genus in aquaculture [72,73]. These microbiota differences represent environmental adaptations with consequences for fish health and productivity.
It has been demonstrated that the correlation analysis between microbial taxa and immune-related genes reveals complex interactions that affect host physiology and immunity [74,75]. In the T vs. G comparison, Serratia was positively correlated with immune genes such as tlr21 and tlr7 (Figure 6a), implying the possible stimulation of immune signaling pathways. This finding aligned with studies showing that intestinal bacteria can modulate fish immunity via pattern recognition receptor signaling [76,77]. In contrast, Romboutsia showed negative correlations with several immune genes, such as tfrc and tnfsf10 in the T group (Figure 6a), suggesting potential immunomodulatory effects. Lactobacillus showed both positive and negative associations with different immune genes (Figure 5 and Figure 6), underscoring the complexity of these interactions. Overall, our results reinforce the role of the intestinal microbiome in regulating fish immune function [77,78,79] and suggest that targeted modulation of microbial communities could enhance fish health in aquaculture.
Notably, the enhanced immune gene expression and beneficial microbiome profile of the T group suggest it may serve as a valuable genetic resource for aquaculture improvement. The high abundance of Lactobacillus in the T group is noteworthy as this genus has been widely used as a probiotic to boost growth performance and disease resistance in various fish species [78,79]. These findings support the potential for microbiome-based strategies, such as probiotic supplementation or dietary interventions, to promote similar beneficial microbial communities in cultured mandarin fish [80,81,82]. Additionally, immune-related gene expression patterns in the T group could serve as molecular markers for selective breeding to enhance disease resistance. However, as these traits may be adaptations to local environments, further research is needed to assess their stability in different environments. Although the precise functions of these genes and microbiota remain to be fully delineated, our findings offer valuable insights into the mechanisms of adaptation in mandarin fish at the transcriptome and microbiome levels.

5. Conclusions

In conclusion, our integrative transcriptome and microbiome analyses revealed significant intergroup variation in mandarin fish, likely driven by localized environmental pressures. The T group showed a strong immune-metabolic profile and a Lactobacillus-enriched microbiome, highlighting its potential as a model for developing stress-resilient aquaculture lines. By contrast, the microbial dysbiosis observed in the G and Q groups calls for targeted interventions. Future research should explore probiotic applications and environmental factors shaping host–microbe dynamics.

Supplementary Materials

The following supporting information can be downloaded at: https://www.mdpi.com/article/10.3390/fishes10070341/s1, Table S1: Summary of RNA-sequencing of the livers of mandarin fish (Siniperca chuatsi) across three different groups; Table S2: Summary of alignment statistics for RNA-sequencing data from mandarin fish (Siniperca chuatsi); Table S3: Significantly enriched growth- and stress-responsive GO terms identified in mandarin fish (Siniperca chuatsi) through comparative analysis of T and G groups; Table S4: Significantly enriched growth- and stress-responsive GO terms identified in mandarin fish (Siniperca chuatsi) through comparative analysis of T and Q groups; Table S5: Summary of statistics for microbiome sequencing data from mandarin fish (Siniperca chuatsi); Table S6: Summary of Padj-values for T vs. G Pearson correlation analysis in mandarin fish (Siniperca chuatsi); Table S7: Summary of Padj-values for T vs. Q Pearson correlation analysis in mandarin fish (Siniperca chuatsi).

Author Contributions

Conceptualization, F.Z. and Z.W.; methodology, W.L., M.Q., Q.L. and G.Y.; software, C.M. and Z.Y.; validation, W.L., M.Q. and C.M.; formal analysis, Q.L., G.Y. and C.M.; investigation, F.Z., X.D. and Z.W.; resources, F.Z., G.Y. and X.D.; data curation, Q.L. and X.L.; writing—original draft preparation, F.Z., W.L. and M.Q.; writing—review and editing, F.Z. and Z.W.; visualization, Z.Y. and X.L.; supervision, F.Z. and Z.W.; project administration, F.Z. and Z.W.; funding acquisition, F.Z. and Z.W. All authors have read and agreed to the published version of the manuscript.

Funding

This research was funded by the Project of the Zhejiang Provincial Department of Agriculture and Rural Affairs (Nos. 2024SNJF056 and 2025SNJF090).

Institutional Review Board Statement

This study was conducted according to the Guide for Laboratory Animals developed by the Ministry of Science and Technology (Beijing, China). The animal utilization protocol was approved by the Institutional Animal Care and Use Committee of the Zhejiang Fisheries Technical Extension Center, Hangzhou, China, on 26 May 2020 (approval number SYXK-ZHE-2020-0009).

Informed Consent Statement

Not applicable.

Data Availability Statement

All supporting data have been included within the main article and its Supplementary Files. The raw data reported in this study have been deposited in the NCBI Sequence Read Archive (SRA) database (https://www.ncbi.nlm.nih.gov/sra/, accessed on 11 June 2025) (accession number: PRJNA1275047).

Conflicts of Interest

The authors declare no conflicts of interest.

References

  1. Fiorella, K.J.; Okronipa, H.; Baker, K.; Heilpern, S. Contemporary aquaculture: Implications for human nutrition. Curr. Opin. Biotechnol. 2021, 70, 83–90. [Google Scholar] [CrossRef] [PubMed]
  2. Boyd, C.E.; McNevin, A.A.; Davis, R.P. The contribution of fisheries and aquaculture to the global protein supply. Food Secur. 2022, 14, 805–827. [Google Scholar] [CrossRef]
  3. Ding, W.; Zhang, X.; Zhao, X.; Jing, W.; Cao, Z.; Li, J.; Huang, Y.; You, X.; Wang, M.; Shi, Q.; et al. A chromosome-level genome assembly of the mandarin fish (Siniperca chuatsi). Front. Genet. 2021, 12, 671650. [Google Scholar] [CrossRef] [PubMed]
  4. Li, C.; Qin, X.; Liang, M.; Luo, Z.; Zhan, Z.; Weng, S.; Guo, C.; He, J. Genome-wide identification, characterization, and expression analysis of the transient receptor potential gene family in mandarin fish Siniperca chuatsi. BMC Genom. 2024, 25, 848. [Google Scholar] [CrossRef] [PubMed]
  5. Bi, S.; Lai, H.; Wang, G.; Guo, D.; Liu, S.; Chen, X.; Zhao, X.; Liu, X.; Li, G. Triploidy induction by hydrostatic pressure shock in mandarin fish (Siniperca chuatsi). Aquaculture 2020, 520, 734979. [Google Scholar] [CrossRef]
  6. Wang, Y.; Nie, S.; Li, C.; Xiang, H.; Zhao, Y.; Chen, S.; Li, L.; Wu, Y. Application of untargeted metabolomics to reveal the taste-related metabolite profiles during mandarin fish (Siniperca chuatsi) fermentation. Foods 2022, 11, 944. [Google Scholar] [CrossRef]
  7. Wu, P.; Chen, L.; Cheng, J.; Pan, Y.; Zhu, X.; Bao, L.; Chu, W.; Zhang, J. The miRNA expression profile directly reflects the energy metabolic differences between slow and fast muscle with nutritional regulation of the Chinese perch (Siniperca chuatsi). Comp. Biochem. Physiol. Mol. Integr. Physiol. 2021, 259, 111003. [Google Scholar] [CrossRef]
  8. Wu, P.; Zeng, Y.; Qin, Q.; Ji, W.; Wu, C.; Zhou, Y.; Zhao, R.; Tao, M.; Zhang, C.; Tang, C.; et al. Formation and identification of artificial gynogenetic mandarin fish (Siniperca chuatsi) induced by inactivated sperm of largemouth bass (Micropterus salmoides). Aquaculture 2023, 577, 739969. [Google Scholar] [CrossRef]
  9. Yao, G.C.; Li, W. Mandarin fish culture: Status and development prospects. In Aquaculture in China: Success Stories and Modern Trends, 1st ed.; Gui, J.F., Tang, Q., Li, Z., Liu, J., De Silva, S.S., Eds.; John Wiley & Sons Inc.: Hoboken, NJ, USA, 2018; pp. 256–269. [Google Scholar]
  10. Liu, X.; Shao, Z.; Cheng, G.; Lu, S.; Gu, Z.; Zhu, H.; Shen, H.; Wang, J.; Chen, X. Ecological engineering in pond aquaculture: A review from the whole-process perspective in China. Rev. Aquac. 2021, 13, 1060–1076. [Google Scholar] [CrossRef]
  11. Gu, J.; Li, S.; Shen, X.; Liang, Q.; Xu, T.; Shi, W. Effects of different fermenters on the quality and flavour of fermented mandarin fish (Siniperca chuatsi). Int. J. Food Sci. Technol. 2024, 59, 4992–5007. [Google Scholar] [CrossRef]
  12. Huang, J.; Liao, S.; Su, Y.; Li, M.; Hu, J.; Han, L.; Jiang, Y.; Yang, M.; Zhang, Y.; Li, S.; et al. Effects of temperature on ovarian development of mandarin fish (Siniperca chuatsi) and hormone therapy to induce its ovulation out of breeding season. Aquacult. Rep. 2024, 37, 102271. [Google Scholar] [CrossRef]
  13. Cui, R.; Huang, J.; Wang, S.; Zhang, X. Whole-genome resequencing reveals genetic diversity and selection signatures in five populations of mandarin fish (Siniperca chuatsi). Aquacult. Rep. 2024, 39, 102406. [Google Scholar] [CrossRef]
  14. Li, W.; Lin, M.; Ye, S.; Liu, J.; Gozlan, R.E.; Li, Z.; Zhang, T. Comparative growth, feeding and reproduction of hatchery-reared and wild mandarin fish Siniperca chuatsi in a shallow Yangtze lake, China. Aquacult. Environ. Interact. 2021, 13, 413–423. [Google Scholar] [CrossRef]
  15. Ding, L.; Zhang, Y.; Chen, J.; Chen, W.; Xie, S.; Chen, Q. Growth, muscle nutrition composition, and digestive enzyme activities of the juvenile and adult Siniperca chuatsi fed on live baits and a formulated diet. Fishes 2022, 7, 379. [Google Scholar] [CrossRef]
  16. Hu, F.; Zhong, H.; Wu, C.; Wang, S.; Guo, Z.; Tao, M.; Zhang, C.; Gong, D.; Gao, X.; Tang, C.; et al. Development of fisheries in China. Reprod. Breed. 2021, 1, 64–79. [Google Scholar] [CrossRef]
  17. Gong, J.; Pan, X.; Lin, L.; Zhu, Y.; Yao, J.; Wang, C.; Yin, W.; Huang, L.; Liu, Y.; Chen, F.; et al. Establishment and characterization of a spinal cord tissue cell line from mandarin fish, Siniperca chuatsi and its susceptibility to several viruses. J. Fish Dis. 2022, 45, 1419–1427. [Google Scholar] [CrossRef] [PubMed]
  18. Zhuo, N.; Li, B.; Zhu, Q.; Ji, C. Smartphone-based agricultural extension services and farm incomes: Evidence from Zhejiang Province in China. Rev. Dev. Econ. 2023, 27, 1383–1402. [Google Scholar] [CrossRef]
  19. Li, S.M.; Zhou, Q.; Liu, W.; Hu, D.Y.; Qi, M.; Yao, G.H.; Wu, R.F.; Wang, Y.; Ding, X.Y.; Zhou, F. Evaluation of muscle nutritional quality of 3 kinds of different geographic groups of Siniperca chuatsi. J. Food Saf. Qual. 2024, 15, 124–133. [Google Scholar]
  20. Wang, Z.; Yang, L.; Zhou, F.; Li, J.; Wu, X.; Zhong, X.; Lv, H.; Yi, S.; Gao, Q.; Yang, Z.; et al. Integrated comparative transcriptome and weighted gene co-expression network analysis provide valuable insights into the response mechanisms of crayfish (Procambarus clarkii) to copper stress. J. Hazard. Mater. 2023, 448, 130820. [Google Scholar] [CrossRef]
  21. Rasheed, A.; Al-Huqail, A.A.; Ali, B.; Alghanem, S.M.S.; Shah, A.A.; Azeem, F.; Rizwan, M.; Al-Qthanin, R.N.; Soudy, F.A. Molecular characterization of genes involved in tolerance of cadmium in Triticum aestivum (L.) under Cd stress. J. Hazard. Mater. 2024, 464, 132955. [Google Scholar] [CrossRef]
  22. Liu, Y.; Zhang, X.; Wang, K.; Li, Q.; Yan, S.; Shi, H.; Liu, L.; Liang, S.; Yang, M.; Su, Z.; et al. RNA-Seq reveals pathways responsible for meat quality characteristic differences between two Yunnan indigenous chicken breeds and commercial broilers. Foods 2024, 13, 2008. [Google Scholar] [CrossRef]
  23. Muehlbauer, A.L.; Richards, A.L.; Alazizi, A.; Burns, M.B.; Gomez, A.; Clayton, J.B.; Petrzelkova, K.; Cascardo, C.; Resztak, J.; Wen, X.; et al. Interspecies variation in hominid gut microbiota controls host gene regulation. Cell Rep. 2021, 37, 110057. [Google Scholar] [CrossRef]
  24. He, H.; Fan, X.; Shen, H.; Gou, H.; Zhang, C.; Liu, Z.; Zhang, B.; Wuri, N.; Zhang, J.; Liao, M.; et al. Butyrate limits the replication of porcine epidemic diarrhea virus in intestine epithelial cells by enhancing GPR43-mediated IFN-III production. Front. Microbiol. 2023, 14, 1091807. [Google Scholar] [CrossRef]
  25. Zheng, J.; Yao, Y.; Rui, Q.; Zhou, Y.; Li, F.; Jiang, W.; Chi, M.; Liu, S.; Cheng, S.; Chen, J.; et al. Effect of different feeding regimens on physiological indicators, intestinal transcriptome, and bacterial flora of mandarin fish (Siniperca chuatsi). Comp. Biochem. Physiol. Part D Genom. Proteom. 2024, 52, 101301. [Google Scholar] [CrossRef] [PubMed]
  26. Kohl, K.D.; Yahn, J. Effects of environmental temperature on the gut microbial communities of tadpoles. Environ. Microbiol. 2016, 18, 1561–1565. [Google Scholar] [CrossRef] [PubMed]
  27. Williams, C.E.; Kueneman, J.G.; Nicholson, D.J.; Rosso, A.A.; Folfas, E.; Casement, B.; Gallegos-Koyner, M.A.; Neel, L.K.; Curlis, J.D.; McMillan, W.O.; et al. Sustained drought, but not short-term warming, alters the gut microbiomes of wild Anolis lizards. Appl. Environ. Microbiol. 2022, 88, e0053022. [Google Scholar] [CrossRef] [PubMed]
  28. Akbar, S.; Gu, L.; Sun, Y.; Zhang, L.; Lyu, K.; Huang, Y.; Yang, Z. Understanding host-microbiome-environment interactions: Insights from Daphnia as a model organism. Sci. Total Environ. 2022, 808, 152093. [Google Scholar] [CrossRef]
  29. Morshed, S.M.; Lee, T.H. The role of the microbiome on fish mucosal immunity under changing environments. Fish Shellfish Immunol. 2023, 139, 108877. [Google Scholar] [CrossRef]
  30. Wang, Z.; Li, J.; Zhao, P.; Yu, Z.; Yang, L.; Ding, X.; Lv, H.; Yi, S.; Sheng, Q.; Zhang, L.; et al. Integrated microbiome and metabolome analyses reveal the effects of low pH on intestinal health and homeostasis of crayfish (Procambarus clarkii). Aquat. Toxicol. 2024, 270, 106903. [Google Scholar] [CrossRef]
  31. Zhou, J.; Li, Q.; Huang, Z.; Zhang, L.; Mou, C.; Zhao, Z.; Zhao, H.; Du, J.; Yang, X.; Liang, X.; et al. Study on the adaptive regulation of light on the stress response of mandarin fish (Siniperca chuatsi) with re-feeding after starvation. Animals 2023, 13, 2610. [Google Scholar] [CrossRef]
  32. Lv, L.; Liang, X.F.; Huang, K.; He, S. Effect of agmatine on food intake in mandarin fish (Siniperca chuatsi). Fish Physiol. Biochem. 2019, 45, 1709–1716. [Google Scholar] [CrossRef]
  33. Nagothu, S.K.; Bindu Sri, P.; Anitha, G.; Vincent, S.; Kumar, O.P. Advancing aquaculture: Fuzzy logic-based water quality monitoring and maintenance system for precision aquaculture. Aquacult. Int. 2025, 33, 32. [Google Scholar] [CrossRef]
  34. Luo, J.X.; Gao, X.T.; Rong, Z.; Zhang, L.H.; Sun, Y.F.; Qi, Z.L.; Yu, Q.; Waiho, K.; Zhao, W.X.; Xu, Y.H.; et al. Transcriptome sequencing reveals effects of artificial feed domestication on intestinal performance and gene expression of carnivorous mandarin fish (Siniperca chuatsi) and related mechanisms. Mar. Biotechnol. 2025, 27, 41. [Google Scholar] [CrossRef]
  35. Chen, S.; Zhou, Y.; Chen, Y.; Gu, J. Fastp: An ultra-fast all-in-one FASTQ preprocessor. Bioinformatics 2018, 34, i884–i890. [Google Scholar] [CrossRef] [PubMed]
  36. Zhang, L.; Yang, Z.; Yang, M.; Yang, F.; Wang, G.; Liu, D.; Li, X.; Yang, L.; Wang, Z. Copper-induced oxidative stress, transcriptome changes, intestinal microbiota, and histopathology of common carp (Cyprinus carpio). Ecotoxicol. Environ. Saf. 2022, 246, 114136. [Google Scholar] [CrossRef]
  37. Kim, D.; Paggi, J.M.; Park, C.; Bennett, C.; Salzberg, S.L. Graph-based genome alignment and genotyping with HISAT2 and HISAT-genotype. Nat. Biotechnol. 2019, 37, 907–915. [Google Scholar] [CrossRef] [PubMed]
  38. Kovaka, S.; Zimin, A.V.; Pertea, G.M.; Razaghi, R.; Salzberg, S.L.; Pertea, M. Transcriptome assembly from long-read RNA-Seq alignments with StringTie2. Genome Biol. 2019, 20, 278. [Google Scholar] [CrossRef]
  39. Li, B.; Dewey, C.N. RSEM: Accurate transcript quantification from RNA-Seq data with or without a reference genome. BMC Bioinform. 2011, 12, 323. [Google Scholar] [CrossRef]
  40. Batista, S.J.; Still, K.M.; Johanson, D.; Thompson, J.A.; O’Brien, C.A.; Lukens, J.R.; Harris, T.H. Gasdermin-D-dependent IL-1α release from microglia promotes protective immunity during chronic Toxoplasma gondii infection. Nat. Commun. 2020, 11, 3687. [Google Scholar] [CrossRef]
  41. Li, C.; Jiang, J.; Xie, J.; Yang, W.; Wang, Y. Transcriptome profiling and differential expression analysis of the immune-related genes during the acute phase of infection with Mycobacterium marinum in the goldfish (Carassius auratus L.). Aquaculture 2021, 533, 736198. [Google Scholar] [CrossRef]
  42. Zhou, F.; Qi, M.; Li, J.; Huang, Y.; Chen, X.; Liu, W.; Yao, G.; Meng, Q.; Zheng, T.; Wang, Z.; et al. Comparative transcriptomic analysis of largemouth bass (Micropterus salmoides) livers reveals response mechanisms to high temperatures. Genes 2023, 14, 2096. [Google Scholar] [CrossRef] [PubMed]
  43. Klopfenstein, D.V.; Zhang, L.; Pedersen, B.S.; Ramírez, F.; Warwick Vesztrocy, A.; Naldi, A.; Mungall, C.J.; Yunes, J.M.; Botvinnik, O.; Weigel, M.; et al. GOATOOLS: A python library for gene ontology analyses. Sci. Rep. 2018, 8, 10872. [Google Scholar] [CrossRef] [PubMed]
  44. Bu, D.; Luo, H.; Huo, P.; Wang, Z.; Zhang, S.; He, Z.; Wu, Y.; Zhao, L.; Liu, J.; Guo, J.; et al. KOBAS-i: Intelligent prioritization and exploratory visualization of biological functions for gene enrichment analysis. Nucleic Acids Res. 2021, 49, W317–W325. [Google Scholar] [CrossRef] [PubMed]
  45. Ren, Y.; Yu, G.; Shi, C.; Liu, L.; Guo, Q.; Han, C.; Zhang, D.; Zhang, L.; Liu, B.; Gao, H.; et al. Majorbio Cloud: A one-stop, comprehensive bioinformatic platform for multiomics analyses. iMeta 2022, 1, e12. [Google Scholar] [CrossRef]
  46. Qi, R.; Zhang, Z.; Wang, J.; Qiu, X.; Wang, Q.; Yang, F.; Huang, J.; Liu, Z. Introduction of colonic and fecal microbiota from an adult pig differently affects the growth, gut health, intestinal microbiota and blood metabolome of newborn piglets. Front. Microbiol. 2021, 12, 623673. [Google Scholar] [CrossRef]
  47. Lin, X.; Zhang, C.; Cao, K.; Li, Z.; Zhao, Z.; Li, X.; Leng, X. Dietary sodium butyrate changed intestinal histology and microbiota of rainbow trout (Oncorhynchus mykiss), but did not promote growth and nutrient utilization. Aquac. Nutr. 2023, 2023, 3706109. [Google Scholar] [CrossRef]
  48. Zheng, J.; Guo, N.; Wagner, A. Mistranslation reduces mutation load in evolving proteins through negative epistasis with DNA mutations. Mol. Biol. Evol. 2021, 38, 4792–4804. [Google Scholar] [CrossRef]
  49. Magoč, T.; Salzberg, S.L. FLASH: Fast length adjustment of short reads to improve genome assemblies. Bioinformatics 2011, 27, 2957–2963. [Google Scholar] [CrossRef]
  50. Wang, Q.; Garrity, G.M.; Tiedje, J.M.; Cole, J.R. Naive Bayesian classifier for rapid assignment of rRNA sequences into the new bacterial taxonomy. Appl. Environ. Microbiol. 2007, 73, 5261–5267. [Google Scholar] [CrossRef]
  51. Quast, C.; Pruesse, E.; Yilmaz, P.; Gerken, J.; Schweer, T.; Yarza, P.; Peplies, J.; Glöckner, F.O. The SILVA ribosomal RNA gene database project: Improved data processing and web-based tools. Nucleic Acids Res. 2013, 41, D590–D596. [Google Scholar] [CrossRef]
  52. Schloss, P.D.; Westcott, S.L.; Ryabin, T.; Hall, J.R.; Hartmann, M.; Hollister, E.B.; Lesniewski, R.A.; Oakley, B.B.; Parks, D.H.; Robinson, C.J.; et al. Introducing mothur: Open-source, platform-independent, community-supported software for describing and comparing microbial communities. Appl. Environ. Microbiol. 2009, 75, 7537–7541. [Google Scholar] [CrossRef] [PubMed]
  53. Zhao, R.; Symonds, J.E.; Walker, S.P.; Steiner, K.; Carter, C.G.; Bowman, J.P.; Nowak, B.F. Relationship between gut microbiota and Chinook salmon (Oncorhynchus tshawytscha) health and growth performance in freshwater recirculating aquaculture systems. Front. Microbiol. 2023, 14, 1065823. [Google Scholar] [CrossRef]
  54. Zhu, Z.; Xu, Y.M.; Liang, J.H.; Huang, W.; Chen, J.D.; Wu, S.T.; Huang, X.H.; Huang, Y.H.; Zhang, X.Y.; Sun, H.Y.; et al. Relationship of environmental factors in pond water and dynamic changes of gut microbes of sea bass Lateolabrax japonicus. Front. Microbiol. 2023, 14, 1086471. [Google Scholar] [CrossRef] [PubMed]
  55. Zhang, Y.; Liu, Y.; Li, Z.; Li, X.; Xing, L.; Wang, S.; Sun, X.; Zhang, D. Evaluation of enrofloxacin in the Chinese soft-shelled turtle (Pelodiscus sinensis) based on the biochemical, histopathological and intestinal microbiota responses. Aquaculture 2024, 590, 741062. [Google Scholar] [CrossRef]
  56. Yuan, X.Y.; Zhang, X.T.; Xia, Y.T.; Zhang, Y.Q.; Wang, B.; Ye, W.W.; Ye, Z.F.; Qian, S.C.; Huang, M.M.; Yang, S.; et al. Transcriptome and 16S rRNA analyses revealed differences in the responses of largemouth bass (Micropterus salmoides) to early Aeromonas hydrophila infection and immunization. Aquaculture 2021, 541, 736759. [Google Scholar] [CrossRef]
  57. Yoon, J.B.; Hwang, S.; Yang, J.H.; Lee, S.; Bang, W.Y.; Moon, K.H. Dynamics of the gut microbiome and transcriptome in Korea native ricefish (Oryzias latipes) during chronic antibiotic exposure. Genes 2022, 13, 1243. [Google Scholar] [CrossRef]
  58. Pan, C.; Zhu, Y.; Cao, K.; Li, J.; Wang, S.; Zhu, J.; Zeng, X.; Zhang, H.; Qin, Z. Transcriptome, intestinal microbiome and histomorphology profiling of differences in the response of Chinese sea bass (Lateolabrax maculatus) to Aeromonas hydrophila infection. Front. Microbiol. 2023, 14, 1103412. [Google Scholar] [CrossRef] [PubMed]
  59. Zhou, W.; Zhang, Y.; Wen, Y.; Ji, W.; Zhou, Y.; Ji, Y.; Liu, X.; Wang, W.; Asim, M.; Liang, X.; et al. Analysis of the transcriptomic profilings of mandarin fish (Siniperca chuatsi) infected with Flavobacterium columnare with an emphasis on immune responses. Fish Shellfish Immunol. 2015, 43, 111–119. [Google Scholar] [CrossRef]
  60. Huang, Y.; Wang, R.; Gao, T.; Wu, T.; Zhang, Q.; Shi, Y.; Ding, S.; Zhao, Z. Transcriptome analysis of immune response against Siniperca chuatsi rhabdovirus infection in mandarin fish Siniperca chuatsi. J. Fish Dis. 2021, 44, 675–687. [Google Scholar] [CrossRef]
  61. Zhang, Y.; Zhang, C.; Zhang, Z.; Sun, W.; Zhang, X.; Liu, X. Analysis of the transcriptomic profiles of mandarin fish (Siniperca chuatsi) infected with red sea bream iridovirus (RSIV). Microb. Pathog. 2023, 174, 105921. [Google Scholar] [CrossRef]
  62. Gao, J.H.; Zhao, J.L.; Yao, X.L.; Tola, T.; Zheng, J.; Xue, W.B.; Wang, D.W.; Xing, Y. Identification of antimicrobial peptide genes from transcriptomes in mandarin fish (Siniperca chuatsi) and their response to infection with Aeromonas hydrophila. Fish Shellfish Immunol. 2024, 144, 109247. [Google Scholar] [CrossRef] [PubMed]
  63. Ding, W.; Cao, L.; Cao, Z.; Bing, X. Transcriptomic responses of the liver of mandarin fish (Siniperca chuatsi) under hypoxic stress. J. Fish Biol. 2023, 103, 44–58. [Google Scholar] [CrossRef]
  64. Ding, W.; Cao, L.; Cao, Z.; Bing, X. Gill and brain transcriptomic analysis of mandarin fish (Siniperca chuatsi) reveals hypoxia-induced mitochondrial dysfunction and modulation of metabolism. Comp. Biochem. Physiol. Part D Genom. Proteom. 2025, 53, 101367. [Google Scholar] [CrossRef]
  65. He, J.; Yu, Y.; Qin, X.W.; Zeng, R.Y.; Wang, Y.Y.; Li, Z.M.; Mi, S.; Weng, S.P.; Guo, C.J.; He, J.G. Identification and functional analysis of the mandarin fish (Siniperca chuatsi) hypoxia-inducible factor-1α involved in the immune response. Fish Shellfish Immunol. 2019, 92, 141–150. [Google Scholar] [CrossRef] [PubMed]
  66. Ouyang, H.; Deng, N.; Xu, J.; Huang, J.; Han, C.; Liu, D.; Liu, S.; Yan, B.; Han, L.; Li, S.; et al. Effects of hyperosmotic stress on the intestinal microbiota, transcriptome, and immune function of mandarin fish (Siniperca chuatsi). Aquaculture 2023, 563, 738901. [Google Scholar] [CrossRef]
  67. Gasaly, N.; de Vos, P.; Hermoso, M.A. Impact of bacterial metabolites on gut barrier function and host immunity: A focus on bacterial metabolism and its relevance for intestinal inflammation. Front. Immunol. 2021, 12, 658354. [Google Scholar] [CrossRef] [PubMed]
  68. Sullam, K.E.; Essinger, S.D.; Lozupone, C.A.; O’Connor, M.P.; Rosen, G.L.; Knight, R.; Kilham, S.S.; Russell, J.A. Environmental and ecological factors that shape the gut bacterial communities of fish: A meta-analysis. Mol. Ecol. 2012, 21, 3363–3378. [Google Scholar] [CrossRef]
  69. Gao, Q.; Liu, P.; Li, Y.; Song, D.; Long, W.; Wang, Z.; Yi, S.; Jiang, L. Gut microbiota, host genetics and phenotypes in aquatic animals: A review. Aquacult. Rep. 2023, 31, 101648. [Google Scholar] [CrossRef]
  70. Jaramillo-Torres, A.; Rawling, M.D.; Rodiles, A.; Mikalsen, H.E.; Johansen, L.H.; Tinsley, J.; Forberg, T.; Aasum, E.; Castex, M.; Merrifield, D.L. Influence of dietary supplementation of probiotic Pediococcus acidilactici MA18/5M during the transition from freshwater to seawater on intestinal health and microbiota of atlantic salmon (Salmo salar L.). Front. Microbiol. 2019, 10, 2243. [Google Scholar] [CrossRef]
  71. Borges, N.; Keller-Costa, T.; Sanches-Fernandes, G.M.M.; Louvado, A.; Gomes, N.C.M.; Costa, R. Bacteriome structure, function, and probiotics in fish larviculture: The good, the bad, and the gaps. Annu. Rev. Anim. Biosci. 2021, 9, 423–452. [Google Scholar] [CrossRef]
  72. Fečkaninová, A.; Koščová, J.; Mudroňová, D.; Popelka, P.; Toropilová, J. The use of probiotic bacteria against Aeromonas infections in salmonid aquaculture. Aquaculture 2017, 469, 1–8. [Google Scholar] [CrossRef]
  73. Li, T.; Raza, S.H.A.; Yang, B.; Sun, Y.; Wang, G.; Sun, W.; Qian, A.; Wang, C.; Kang, Y.; Shan, X. Aeromonasveronii infection in commercial freshwater fish: A potential threat to public health. Animals 2020, 10, 608. [Google Scholar] [CrossRef]
  74. Zhou, Q.; Zhu, X.; Li, Y.; Yang, P.; Wang, S.; Ning, K.; Chen, S. Intestinal microbiome-mediated resistance against vibriosis for Cynoglossus semilaevis. Microbiome 2022, 10, 153. [Google Scholar] [CrossRef] [PubMed]
  75. Priya, S.; Burns, M.B.; Ward, T.; Mars, R.A.T.; Adamowicz, B.; Lock, E.F.; Kashyap, P.C.; Knights, D.; Blekhman, R. Identification of shared and disease-specific host gene-microbiome associations across human diseases using multi-omic integration. Nat. Microbiol. 2022, 7, 780–795. [Google Scholar] [CrossRef]
  76. Yu, Y.Y.; Ding, L.G.; Huang, Z.Y.; Xu, H.Y.; Xu, Z. Commensal bacteria-immunity crosstalk shapes mucosal homeostasis in teleost fish. Rev. Aquac. 2021, 13, 2322–2343. [Google Scholar] [CrossRef]
  77. Zhang, B.; Yang, H.; Cai, G.; Nie, Q.; Sun, Y. The interactions between the host immunity and intestinal microorganisms in fish. Appl. Microbiol. Biotechnol. 2024, 108, 30. [Google Scholar] [CrossRef]
  78. Yukgehnaish, K.; Kumar, P.; Sivachandran, P.; Marimuthu, K.; Arshad, A.; Paray, B.A.; Arockiaraj, J. Gut microbiota metagenomics in aquaculture: Factors influencing gut microbiome and its physiological role in fish. Rev. Aquacult. 2020, 12, 1903–1927. [Google Scholar] [CrossRef]
  79. Diwan, A.D.; Harke, S.N.; Panche, A.N. Host-microbiome interaction in fish and shellfish: An overview. Fish Shellfish Immunol. Rep. 2023, 4, 100091. [Google Scholar] [CrossRef]
  80. Zhu, C.Z.; Li, D.; Chen, W.J.; Ban, S.N.; Liu, T.; Wen, H.; Jiang, M. Effects of dietary host-associated Lactococcus lactis on growth performance, disease resistance, intestinal morphology and intestinal microbiota of mandarin fish (Siniperca chuatsi). Aquaculture 2021, 540, 736702. [Google Scholar] [CrossRef]
  81. Wang, J.; Hao, Y.; Zhang, L.; Gao, X.; Xu, Y.; Wang, J.; Hanafiah, F.; Khor, W.; Sun, Y.; Wu, C. Profiling the gut structure and microbiota, and identifying two dominant bacteria belonging to the Weissella genus in mandarin fish (Siniperca chuatsi) fed an artificial diet. Front. Microbiol. 2024, 15, 1486501. [Google Scholar] [CrossRef]
  82. Zhang, Z.; Yang, Q.; Liu, H.; Jin, J.; Yang, Y.; Zhu, X.; Han, D.; Zhou, Z.; Xie, S. Potential functions of the gut microbiome and modulation strategies for improving aquatic animal growth. Rev. Aquacult. 2025, 17, e12959. [Google Scholar] [CrossRef]
Figure 1. RNA-sequencing analysis of the livers of mandarin fish (Siniperca chuatsi). (a) Length distribution of assembled transcripts. (b) Number of genes annotated across different databases, including NCBI non-redundant protein (NR), Swiss-Prot, Gene Ontology (GO), Kyoto Encyclopedia of Genes and Genomes (KEGG), protein family (Pfam), and eggNOG. (c) The GO classification of 14,685 annotated genes was divided into three major categories: biological process (10 subclasses), molecular function (12 subclasses), and cellular component (2 subclasses). (d) KEGG classification of 16,992 annotated genes into five main categories: environmental information processing (3 subclasses), human diseases (9 subclasses), organismal systems (6 subclasses), cellular processes (3 subclasses), and genetic information processing (4 subclasses).
Fishes 10 00341 g001
Figure 2. Transcriptional variations in mandarin fish (Siniperca chuatsi) from different culture groups. (a) Scatter plots showing differentially expressed genes (DEGs) between Taihu (T) and Guangdong (G) and between the T and Qiupu (Q) groups. (b) Numbers of the total, upregulated, and downregulated DEGs in the T vs. G and T vs. Q comparisons. (c) Heatmap of DEG expression profiles of the T vs. G and T vs. Q comparisons. The red block represents T- vs. G-responsive genes while the blue block represents T- vs. Q-responsive genes.
Fishes 10 00341 g002
Figure 3. Enrichment analyses of differentially expressed genes (DEGs) in the hepatopancreas of mandarin fish (Siniperca chuatsi). (a) Gene Ontology (GO) enrichment analysis of DEGs between the Taihu (T) and Guangdong (G) groups. (b) GO enrichment analysis of DEGs between the T and Qiupu (Q) groups. (c) Kyoto Encyclopedia of Genes and Genomes (KEGG) enrichment analysis of DEGs between the T and G groups. (d) KEGG enrichment analysis of DEGs between the T and Q groups. For all panels (ad), the top 20 significantly enriched GO terms or KEGG pathways are shown.
Fishes 10 00341 g003
Figure 4. Microbial composition of the intestinal microbiota of mandarin fish (Siniperca chuatsi) from three different groups. (a) Venn diagram showing the numbers of shared and unique amplicon sequence variants (ASVs) among the Taihu (T), Guangdong (G), and Qiupu (Q) groups. (b) Principal coordinate analysis (PCoA) of the microbial community based on Bray–Curtis dissimilarity. (c) Bar plot showing the relative abundance of intestinal microbiota at the phylum level. (d) Bar plot showing the relative abundance of intestinal microbiota at the genus level.
Fishes 10 00341 g004
Figure 5. Comparative analysis of intestinal microbiota differences among three different mandarin fish (Siniperca chuatsi) groups. (a) Average relative fold change (FC) in microbial genera between the Taihu (T) and Guangdong (G) groups was analyzed using the Wilcoxon rank-sum test (* Padj ≤ 0.05). (b) Average relative FC in microbial genera between the T and Qiupu (Q) groups was analyzed using the Wilcoxon rank-sum test (* Padj ≤ 0.05).
Fishes 10 00341 g005
Figure 6. Correlation between intestinal microbiota and immune-related differentially expressed genes (DEGs) in mandarin fish (Siniperca chuatsi) from three different groups. (a) Correlation heatmap of microbial taxa and immune-related DEGs between the Taihu (T) and Guangdong (G) groups. (b) Correlation heatmap of microbial taxa and immune-related DEGs between the T and Qiupu (Q) groups. Red and blue indicate positive and negative correlations, respectively. Significance levels: * (Padj < 0.05), ** (Padj < 0.01), and *** (Padj < 0.001).
Fishes 10 00341 g006
Disclaimer/Publisher’s Note: The statements, opinions and data contained in all publications are solely those of the individual author(s) and contributor(s) and not of MDPI and/or the editor(s). MDPI and/or the editor(s) disclaim responsibility for any injury to people or property resulting from any ideas, methods, instructions or products referred to in the content.

