Article

Effects of Co-Feeding Dry and Live Feed from the Onset of Exogenous Feeding on Red Seabream Pagrus major Larviculture and Pre-Growing

by
Sofia Brinkmann Bougali
1,
Nafsika Karakatsouli
1,*,
Kostas Ntomalis
2,
Anemos Kastelis
3,
Vasiliki-Anna Alexopoulou
1,
Alkisti Batzina
1 and
Isidoros Markakis
1
1
Laboratory of Applied Hydrobiology, Department of Animal Science, Agricultural University of Athens, 11855 Athens, Greece
2
BioMar Hellenic SA, 2nd Industrial Zone of Volos, Block No 6, 37500 Velestino, Greece
3
Hellenic Fishfarming SA, 15234 Athens, Greece
*
Author to whom correspondence should be addressed.
Fishes 2025, 10(7), 324; https://doi.org/10.3390/fishes10070324
Submission received: 29 May 2025 / Revised: 23 June 2025 / Accepted: 30 June 2025 / Published: 3 July 2025
(This article belongs to the Section Nutrition and Feeding)

Abstract

Current feeding protocols used in commercial hatcheries of Mediterranean fish species are, for a species-dependent period after hatching, based on live feeds which have often raised issues of biosecurity, stability, availability, price and nutrients content. Instead, dry feeds can offer stability in nutritional value, price and supply. The aim of the present study was to evaluate an alternative feeding protocol by co-feeding live and dry feed at first feeding red seabream larvae (on 3 days post-hatching—3 dph, DF3) and to compare it to a standard feeding protocol (i.e., dry feed introduced on 22 dph, DF22). Larvae productivity and functional development of the digestive system were evaluated under actual production conditions in a commercial hatchery. Additionally, post-larvae efficiency during pre-growing was evaluated under controlled laboratory conditions. The results obtained showed that the experimental protocol (DF3) promoted larval growth without affecting larval survival and the efficiency of the digestion processes. After pre-growing, DF3-produced juveniles showed a decreased incidence of spinal cord malformations, while the initially gained growth advantage was maintained. The present study shows the feasibility of an alternative feeding protocol for red seabream intensive larviculture and points out the critical role that larval rearing may have for later production stages.
Key Contribution: Co-feeding dry and live feeds at first-feeding red seabream larvae promotes larval and post-larval growth performance. Larviculture benefits were obtained under actual production conditions. The proposed feeding protocol can be successfully applied in commercial hatcheries.

1. Introduction

The red seabream (Pagrus major) is a carnivorous fish species in the Sparidae family that is intensively farmed in the Mediterranean [1,2]. Even though red seabream production is lower than other species (approx. 5000 tonnes for EU-27 in 2022), it ranks in the top ten in terms of monetary value (approx. EUR 37 million for EU-27 in 2022), i.e., it is considered a highly valued fish species [2]. One of its main characteristics is its red-pink colour, with blue dots scattered on the dorsal sides of the body [1]. The red seabream is an altricial fish species, meaning that larvae enter the exogenous feeding phase before the digestive system is fully developed [1,3].
When captive-bred, altricial larvae are first fed live zooplanktonic species (e.g., rotifers, Artemia), which are provided at the mouth opening, a few days after hatching [4,5,6]. Even though live feed is an important aspect of larvae rearing, its high production costs together with its unpredictability (i.e., varied nutritional value, bacterial contamination) fuel the need for its substitution with composed diets [7,8]. For this purpose, dry feeds have been developed that consist of microparticles small enough to be ingested by the fish larvae, while covering their nutritional needs [8,9,10]. Despite this, a number of trials have shown that fish larvae provided exclusively with dry feed from mouth opening exhibited poor growth and high mortality [11,12,13]. For this reason, altricial larvae are usually fed live feed in the first days of their life and, after a period of co-feeding, they are weaned to dry feed [8]. During co-feeding, the supply of dry feed gradually increases while live feed decreases, until it has been completely substituted by dry feed [11,14]. Larvae are typically introduced to dry feed when their digestive system has sufficiently developed [12,15]. Co-feeding has been shown, in some cases, to increase digestive ability and, in turn, increase the digestibility of composed diets in larvae [16]. It has also been shown that, when the duration of the co-feeding period is longer, growth and survival are higher [7,12,16].
In an effort to improve larval production, a limited number of research projects have been carried out regarding larvae of different species where the co-feeding period starts as early as at mouth opening. More specifically, articles have been published about sea water species, namely, Senegalese sole (Solea senegalensis) [17,18,19,20,21] and gilthead seabream (Sparus aurata) [11,15], as well as about fresh water species, namely, loach (Misgurnus anguillicaudatus) [22,23], North African catfish Clarias gariepinus [14], wallago catfish Wallago attu [24] and driftwood catfish Trachelyopterus galeatus [25]. The results of the above studies are varied and are dependent on the experimental conditions, the feeding regimes, and the fish species used. More specifically, all freshwater species responded with better growth performance and either higher or equal survival as compared to the control treatment [14,22,23,24,25]. Regarding the sea water species, Senegalese sole larvae (pelagic phase) showed reduced [18,19,21] or equal [17] growth and similar survival [17,18,19,21] when co-fed live and dry feeds from mouth opening. Additionally, growth, survival and tail condition were improved at or after weaning [17,19,21], while protein and lipid metabolism did not seem to be compromised [18,20,21]. In the case of gilthead seabream, when similar amounts of live feed were offered to the larvae, the co-fed live and dry feed groups showed similar to control growth and survival up to 15 days post-hatching (dph) [11], or a clear growth advantage after 62 dph with equal survival and fewer deformities [15]. Despite the above-mentioned variations, it is certain that introducing dry feed in these early life stages of larvae can influence their growth, survival, and metabolism.
Typically, in commercial hatcheries, red seabream larvae start feeding on 3–4 dph and are introduced to a composed diet about 20 days after they hatch [26,27,28]. The aim of the current study is to evaluate, (a) the early introduction of dry feed on red seabream larvae growth performance and functional development of the digestive system (by analyzing the fluctuations of digestive enzymes), under actual production conditions, and (b) post-larvae growth performance and phenotypical deformities during pre-growing.

2. Materials and Methods

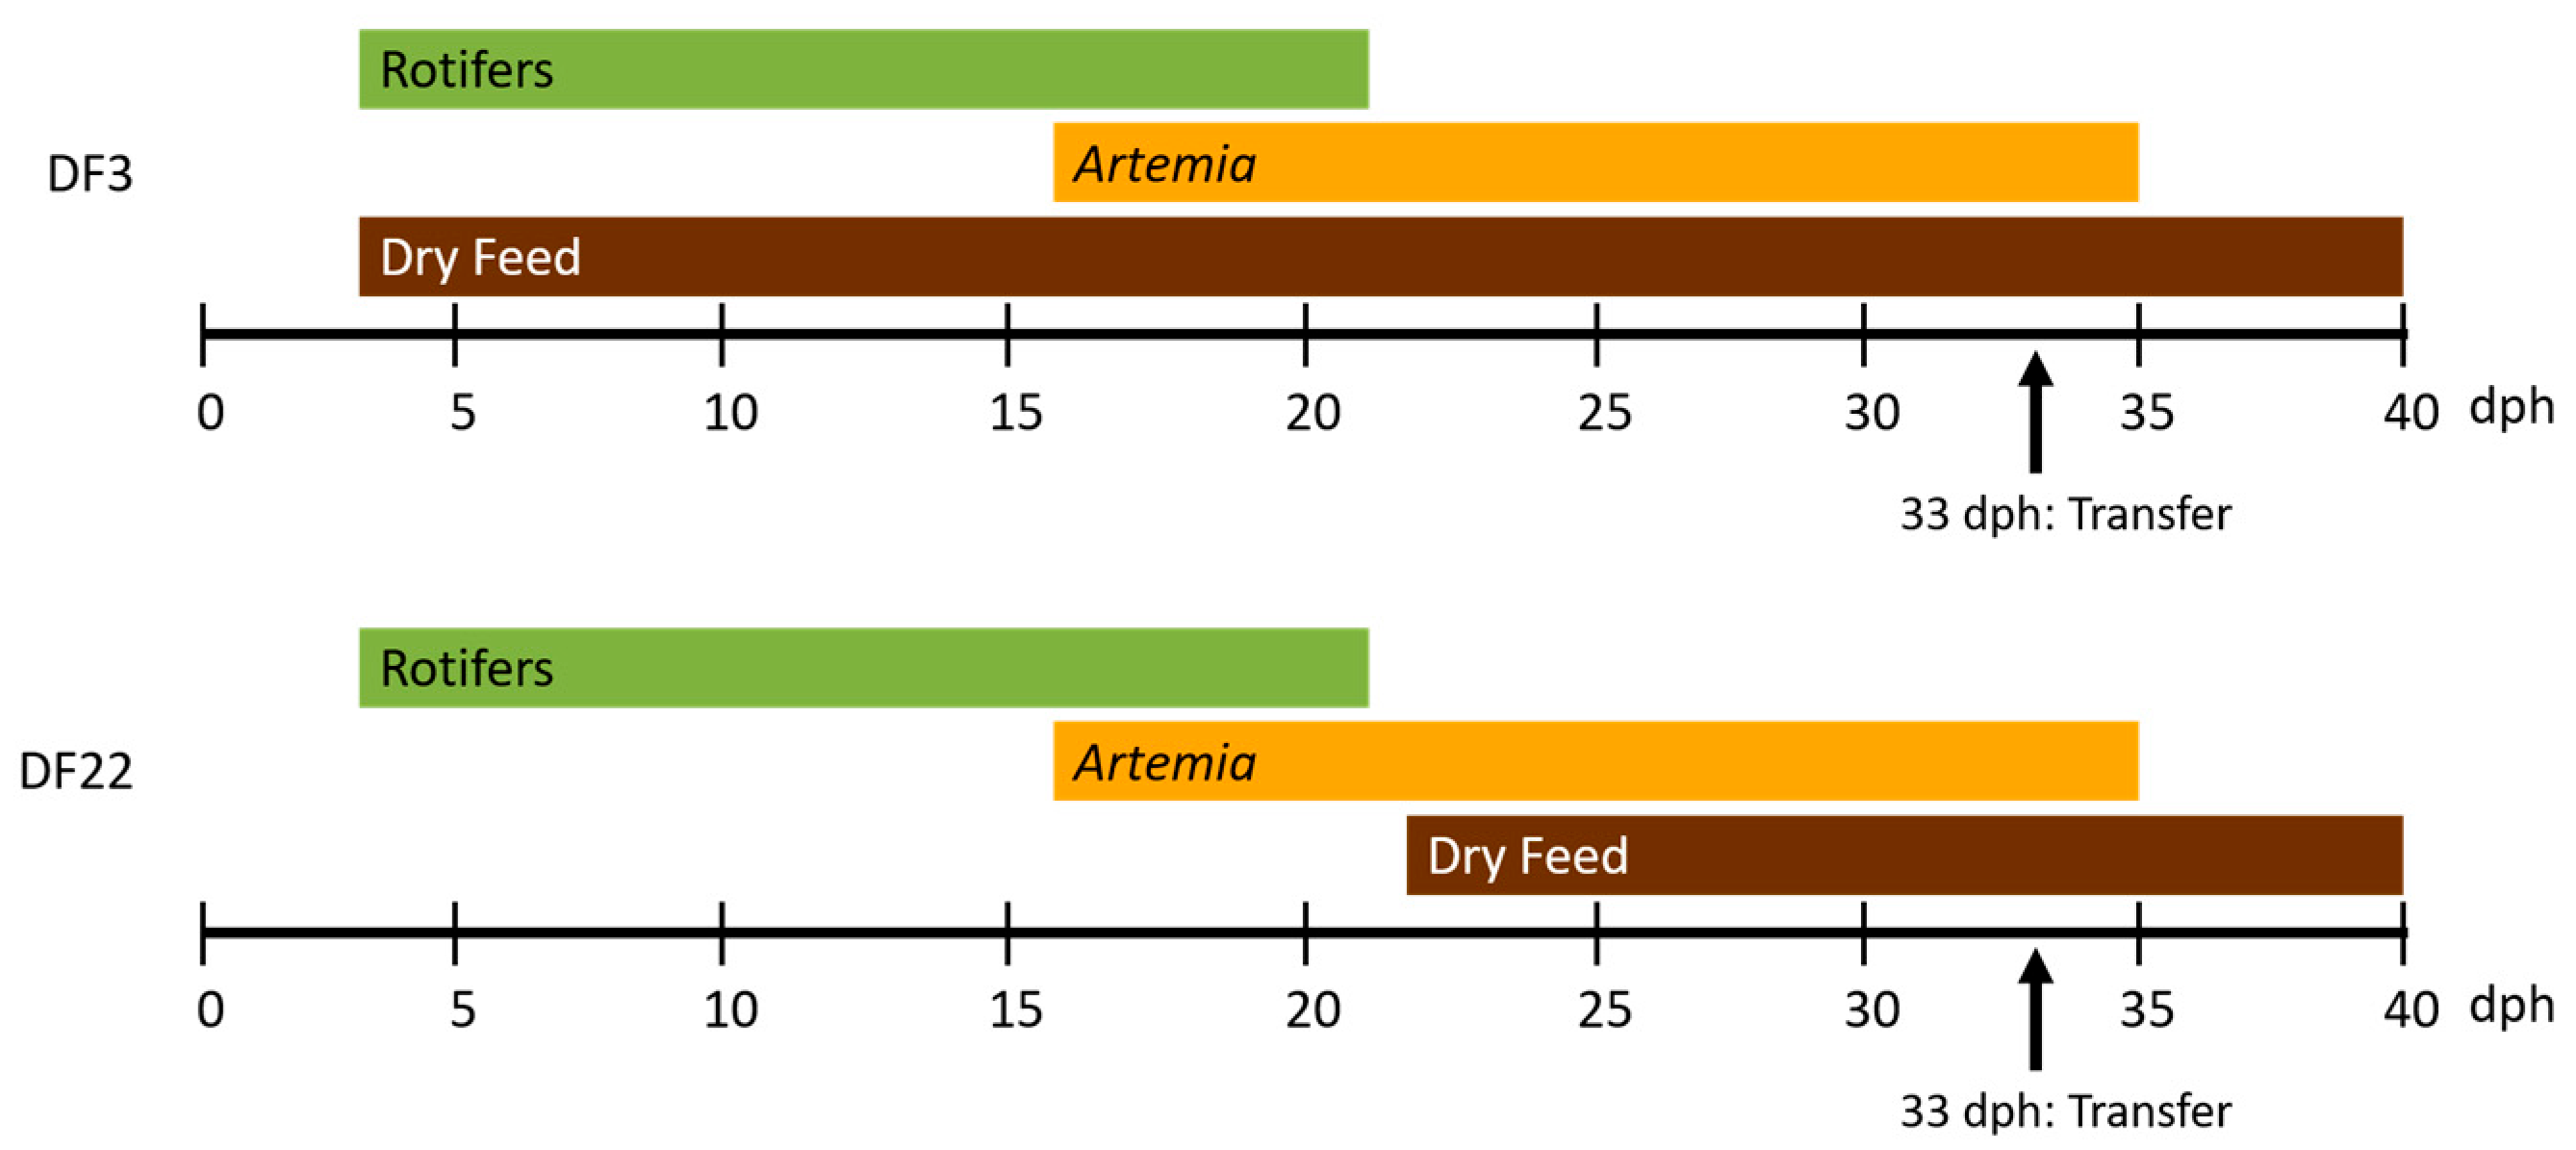
2.1. Experimental Design

The experiment consisted of two trials: (a) Trial 1 was conducted in a commercial hatchery and included the larviculture until weaning. (b) Trial 2 was conducted in laboratory conditions and assessed post-larvae growth performance. This part of this study was not conducted in actual production conditions because of the difficulties in maintaining the experimental groups as they are, due to frequent gradings.
The first trial (Trial 1; Hatchery rearing, Hr) took place in a commercial Greek marine fish hatchery (Hellenic Fish Farming, Tragana, Phthiotis) under actual production conditions. During Trial 1, the experimental treatments were assigned in duplicate tanks, since, for reasons of the hatchery management production needs, no more tanks were available at our disposal. Larvae’s performance was monitored from 3 to 40 dph. At the end of Trial 1, a small portion of larvae were randomly taken from each duplicated tank and were transported to a laboratory recirculating seawater system to monitor post-larval performance during pre-growing (Trial 2; Laboratory rearing, Lr).

2.1.1. Trial 1 (Hatchery Rearing, Hr)

Fertilized eggs from the same broodstock were purchased from a neighboring hatchery and were incubated in three cylindro-conical incubation tanks. At 2 dph, the larvae were stocked into four 9 m3 tanks at an average density of 25 larvae per litre. In two of the tanks, a commercial semi-floating dry feed (Larviva Prostart 100, Biomar, 80–125 μm) was introduced at 3 dph (DF3), whereas, in the two other tanks, dry feed was introduced at 22 dph (DF22) (until 28 dph dry feed was offered every hour from 9:00 to 23:00; from 29 to 40 dph dry feed was offered every half hour from 9:00 to 23:00). All tanks received rotifers (Brachionus plicatilis L-type) from 3 to 21 dph (at 09:00, 15:00 and 18:00) and Artemia nauplii/metanauplii from 16 to 35 dph (at 09:00, 12:00, 15:00 and 18:00) (Figure 1). From 36 dph, larvae were fed dry feed only. Larvae handling and live feed feeding followed the hatchery protocol (Table 1). Prey density offered was similar in both treatments, and it was not reduced in the DF3 treatment. Dry feed feeding and timing of changing feed particle size followed the manufacturer’s protocol (Table 1). Water quality was monitored twice daily (8:00 and 12:00 h) and was maintained as follows: [mean ± standard error (SEM)]: temperature, 19.1 ± 0.02 °C; salinity, 26 ± 0.0 g/L; dissolved oxygen, 9.5 ± 0.12 mg/L; pH, 7.57 ± 0.006; total ammonia nitrogen, NH4++NH3-N, 0.278 ± 0.0207 mg/L; unionized ammonia nitrogen, NH3-N, 0.002 ± 0.0001 mg/L; nitrites nitrogen, NO2-N, 0.006 ± 0.0006 mg/L. No differences were detected for water quality among the experimental tanks.
During the Hr Trial, larval samples were collected daily to monitor food consumption by use of a stereoscope (Figure 2). Duplicated larvae samples for length measurement were collected daily from 2 (before the onset of exogenous feeding) until 10 dph and then at 6-day intervals until 40 dph. Larvae for digestive enzyme analyses (duplicated samples) were collected on the same days, with the exception that whenever new food items were introduced (i.e., Artemia on 16 dph, dry feed on 22 dph for DF22), samples were collected for four consecutive days. Larvae were sampled at peak postprandial state, approximately at noon, following the morning feeding. Larvae used for length measurement were preserved in buffered formalin (duplicated samples from each tank, approximately 100 larvae per treatment per sampling). Larvae used for digestive enzyme analyses (duplicated samples from each tank, approximately a total of 200 larvae from 2 to 13 dph, 100 larvae from 16 to 31 dph, and 60 larvae from 34 to 40 dph) were gently netted, washed in fresh water, immediately frozen in dry ice and transferred to −80 °C until analyzed.
On 33 dph, all larvae from each hatchery tank were transferred to a separate outdoor tank for reasons of indoor tank maintenance. Prior to transfer, all larvae were deprived of from three to eight meals, depending on the time of transfer. Remaining samplings up to 40 dph took place from these outdoor tanks.

2.1.2. First Grading at Hatchery

The fish of each experimental tank were graded on 53 dph into two size classes (grader 4 mm). Hatchery management kindly provided data for the estimation of larvae survival, percentage and body weight of big and small fish, for each experimental tank.

2.1.3. Trial 2 (Laboratory Rearing, Lr)

On 43 dph, approximately 750 fish from each experimental hatchery tank (about 3000 fish in total) were transferred to the RAS of the Laboratory of Applied Hydrobiology (Agricultural University of Athens). Transfer was carried out using three bags per tank, each containing water hyper-saturated with dissolved oxygen. Upon arrival at the laboratory (43 dph), fish were gradually (approximately 2.5 h) acclimated to the water quality (temperature, salinity, pH) of the RAS. No significant mortality was observed during transport, water quality acclimation or during the following 7 days of acclimation to RAS tanks. During acclimation, all fish were fed to satiation (Biomar Prowean 300 and 500, 1:2).
At 50 dph, the three fish groups of the same hatchery tank were pooled, anaesthetized, weighed (group weighing, 4–6 fish per group) and randomly divided into five replicated tanks, with 120 fish in each tank. Post-larvae growth performance during Lr was monitored for 45 days (up to 95 dph).
The laboratory recirculating seawater system has a total water volume capacity of 9 m3 (renewal 3% make-up water). It is provided with mechanical (polyester filter pad) and biological filters (submerged gravel biofilter), UV sterilization, compressed air supply, water cooling apparatus and photoperiod control (12L:12D, L: 8:00–20:00 h, 220 lx at water surface).
The tanks used were rectangular glass tanks (41 × 49 × 44 cm; water volume: 88.4 L), with all sides, apart from the front and top ones, externally covered with light blue styrofoam. The water flow rate in each tank was 1.8 L/min, gradually raised to 2.2 L/min as fish grew. All tanks were thoroughly cleaned once a week. Twice daily (11:30 and 17:30 h), uneaten feed was removed. Water dissolved oxygen, temperature, pH and salinity were monitored twice daily (before feeding and noon). Twice per week, water samples were collected to monitor ammonia and nitrite levels (spectrophotometric determination; Greenberg et al. 1992a, 1992b). Water physicochemical characteristics were maintained as follows (mean ± SEM): temperature, 25.6 ± 0.03 °C; dissolved oxygen, 6.5 ± 0.01 mg/L (96.4 ± 0.05% saturation); pH, 7.89 ± 0.003; salinity, 33.3 ± 0.04 g/L; total ammonia nitrogen, NH4++NH3-N, 0.595 ± 0.0255 mg/L; un-ionized ammonia-nitrogen, NH3-N, 0.009 ± 0.0003 mg/L and nitrite-nitrogen, NO2-N, 0.483 ± 0.0165 mg/L.
Fish were fed to satiation, by hand, six (6) times daily (9:00, 11:00, 13:00, 15:00, 17:00, 19:00 h). Feed size was frequently changed as fish grew (2-day transition period with 1:1 mixture). Every 2 weeks, fish were group-weighed after anaesthetization (in groups of 3–5 fish) and counted. At the end of the experimental period (95 dph), all fish were anaesthetized and individually weighed. Total (TL) and standard length (SL) were measured for 20% of each fish group. Any kind of phenotypical deformity was also recorded.

2.2. Analyses and Calculations

2.2.1. Trial 1 (Hatchery Rearing, Hr)

Larvae from 2–40 dph were observed under a stereoscope, and TL was measured with a calibrated micrometer (Image-Pro Plus, v. 6.0). Total length was used to calculate total (3–40 dph) Specific Growth Rate (SGRTL), Thermal Growth Coefficient (TGCTL) and coefficient of total length variation (CVTL), according to the following formulas:
SGRTL = [(lnTLfn − lnTLin)] × 100/t
where TLfn represents the mean final total length (mm), TLin the mean initial total length (mm), and t is rearing days,
TGCTL = 1000 × [(Lfn1/3 − Lin1/3)]/dd
where dd represents degree days (745 dd):
CVTL = (100 × standard deviation)/(mean total length).
Also, the total length (on 40 dph) frequency distribution for each experimental treatment was tabulated.
For digestive enzymes analyses, whole larvae were homogenized in five volumes v/w of cold 50 mM Tris–HCl buffer with CaCl2, pH 8.0, followed by centrifugation (4500 rpm; 45 min, 4 °C). The supernatant was divided into different aliquots so that, for each analysis, only fresh, previously unthawed samples were used. All procedures were performed on ice, and samples were kept at −80 °C until analyzed. Trypsin and chymotrypsin activity was measured according to Lainé (1993) [29] using N-a-benzoyl-Arg-p-nitroanilide (L-BAPNA) and succinyl-Ala-Ala-Pro-Phe p-nitroanilide (Suc-AAPF-pNA) as the substrate, respectively. Pepsin was measured according to Anson (1938) [30] using haemoglobin as the substrate. Amylase was measured according to Somogyi (1960) [31] using potato starch as the substrate. Lipase was measured according to Choi et al. (2003) [32] using 2,3-dimercapto-1-propanol tributyrate (DMPTB) as the substrate. Enzymatic activities were expressed as specific activities (enzymatic units/mg protein). Protein was determined by the Bradford method [33].

2.2.2. Information Obtained upon First Grading

The first grading on 53 dph that was carried out in the hatchery permitted the following to be recorded and calculated for each experimental tank:
-
Survival (%) = [(final number of survived larvae)/(initial number of stocked larvae)] × 100;
-
Big larvae (%) = [(number of Big larvae)/(number of survived larvae)] × 100;
-
Small larvae (%) = [(number of Small larvae)/(number of survived larvae)] × 100;
-
Mean weight of Big and Small larvae (group weighted).

2.2.3. Trial 2 (Laboratory Rearing, Lr)

The parameters that were calculated for each fish group are: Specific Growth Rate (SGR), Thermal Growth Coefficient (TGC), Weight Gain (WG), Coefficient of weight Variation (CV) and Survival. The equations for these parameters are presented below.
SGR = [(lnWfn − lnWin)] × 100/t
where Wfn is the mean final body weight (g), Win is the mean initial body weight (g) and t is rearing days.
TGC = 1000 × [(Wfn1/3 − Win1/3)]/dd
where dd represents degree days (1118.6 dd).
WG = (Wfn − Win)/t, g/day
CV = (100 × standard deviation)/(mean body weight)
Survival (%) = [(final number of fish)/(initial number of fish)] × 100
For the 20% of each fish group, Condition Factor (CF) for total (CFTL) and standard (CFSL) length was individually calculated according to the following formula:
CF = 100 × (body weight, g)/(total or standard length, cm)3
Also, the weight frequency distribution for each experimental treatment was tabulated.
As fish grew, phenotypical deformities became increasingly obvious. Deformities identified were mainly gill operculum, jaw, fins and spinal cord malformations. Specific and total deformities were expressed as a percentage of the total number of observed fish.

2.3. Statistics

Data from Trial 1 (Hatchery rearing, Hr) were compared with Student’s t-test. Data from Trial 2 (Laboratory rearing, Lr) were analyzed by one-way analysis of variance (one-way ANOVA). The experimental tank was the experimental unit (i.e., n = 2 for data of the hatchery tanks in Hr, n = 5 for data of the laboratory tanks in Lr). When data did not satisfy the assumptions of ANOVA (i.e., normality, homogeneity of variance), non-parametric Kruskal–Wallis analyses were carried out. Where p values were significant (p < 0.05), multiple comparisons were carried out using the Duncan test. All values presented in the text and tables are means ± SEM (standard error of the mean). In the case of laboratory rearing (Lr), for SGR and TGC, initial weight was used as a covariate to account for differences in initial weight. The Kolmogorov–Smirnov test was used to compare larval length or juvenile weight distributions.

3. Results

3.1. Trial 1 (Hatchery Rearing, Hr)

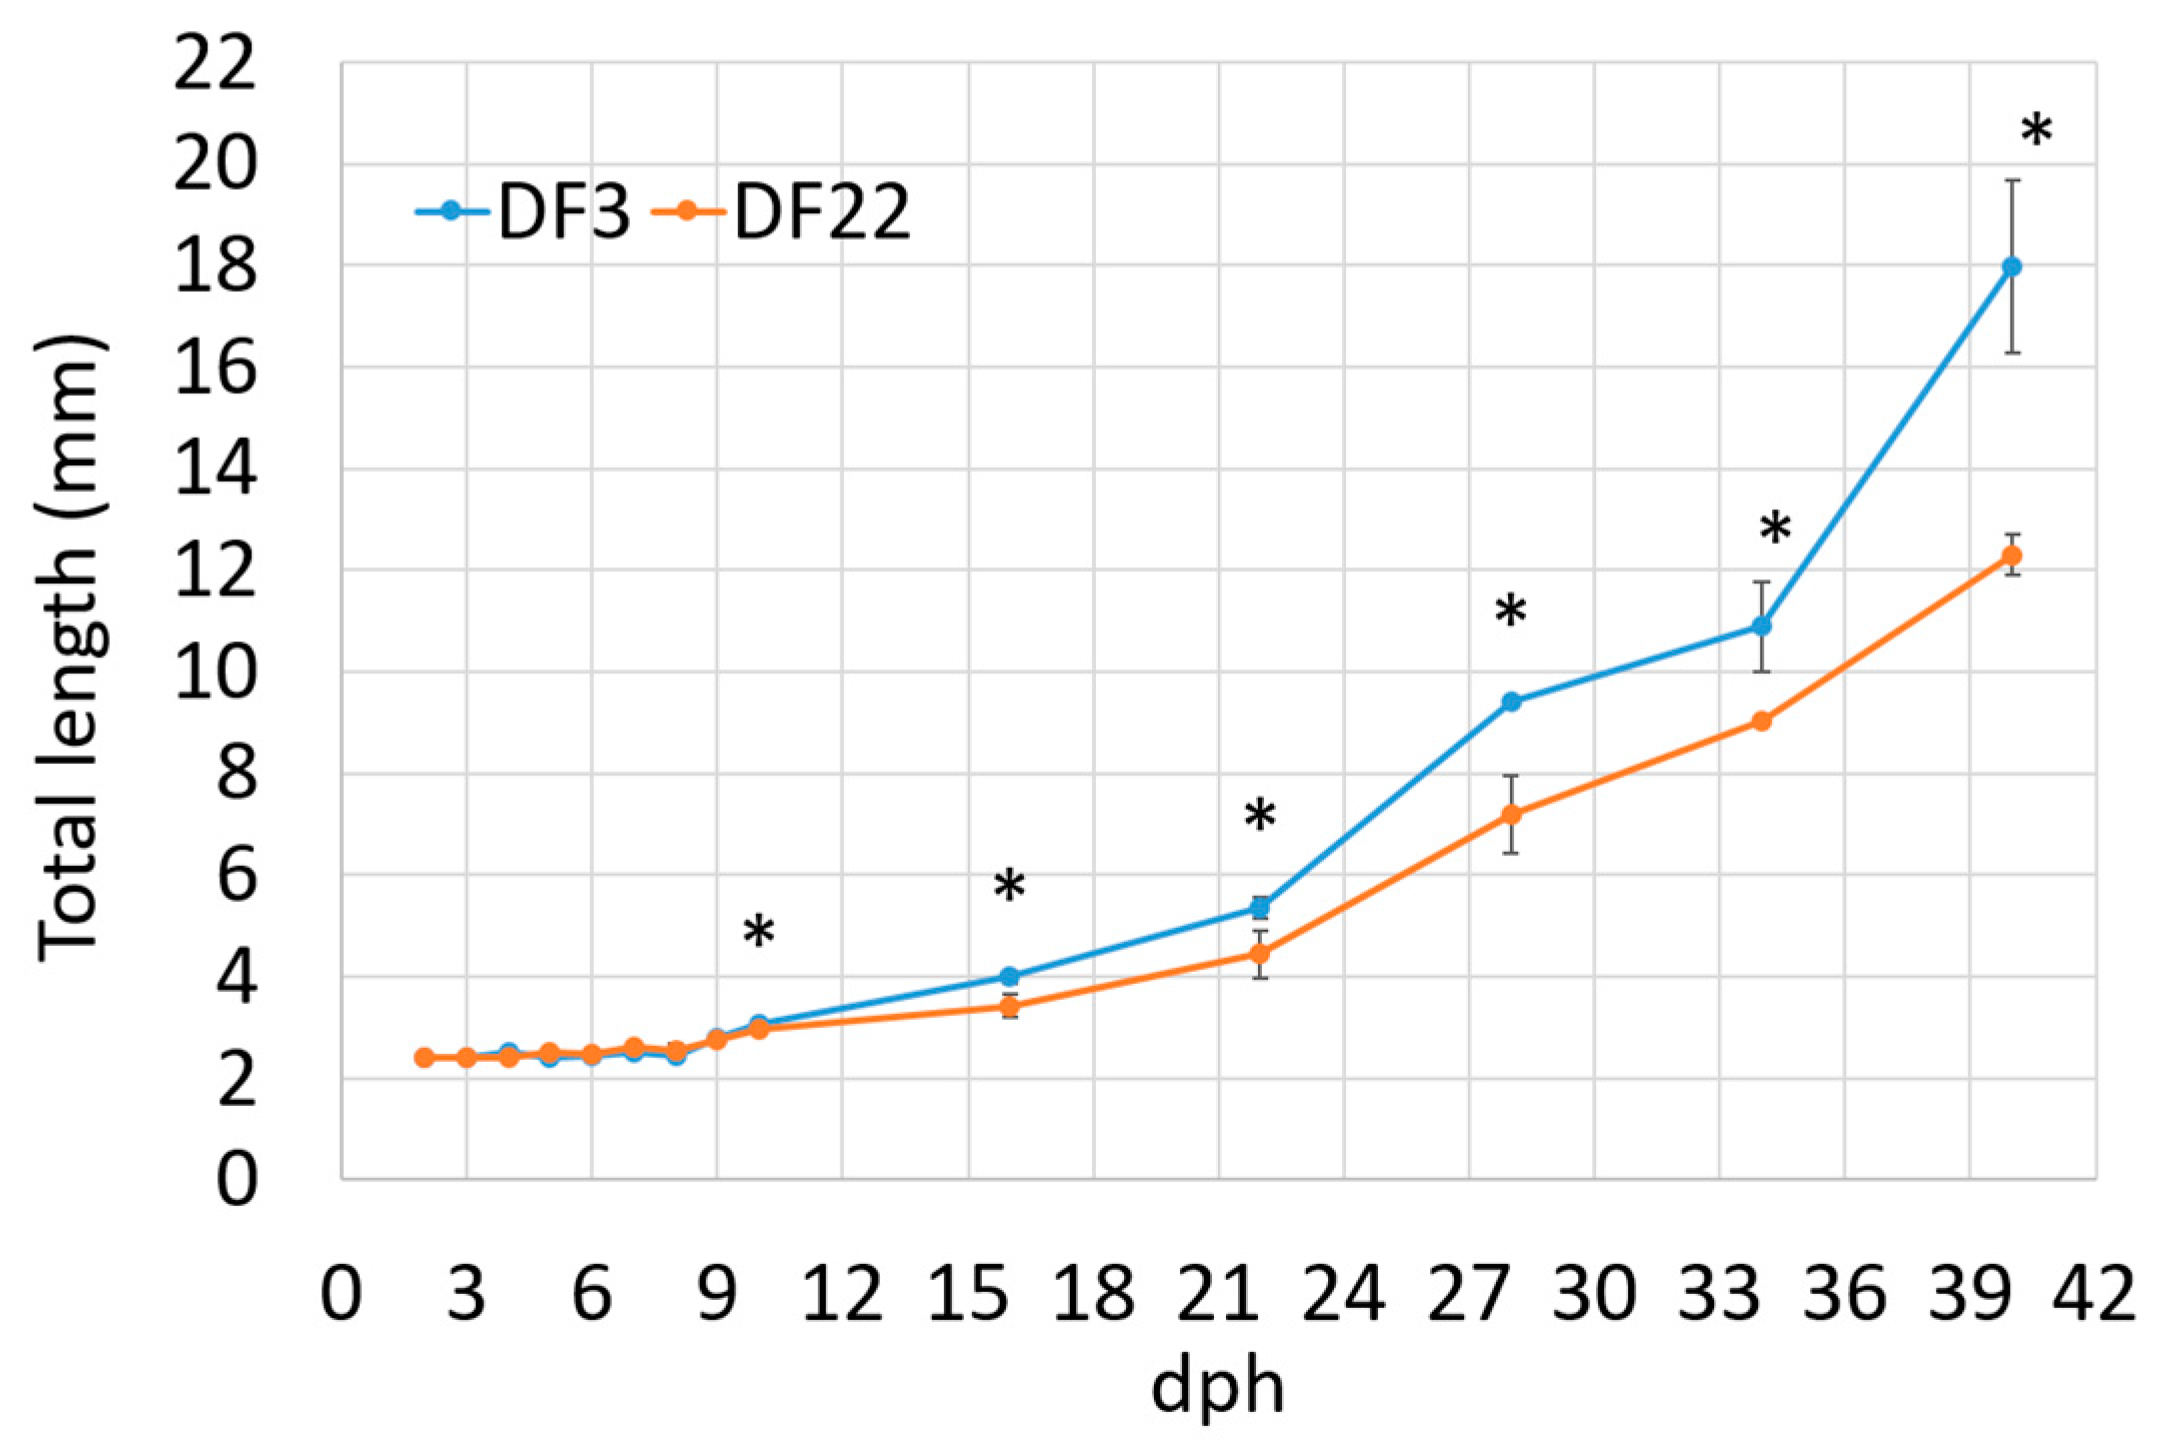
3.1.1. Larvae Growth

Larvae’s total length was similar between experimental treatments from 2 dph up to 9 dph. Thereafter, DF3 larvae had significantly higher total length than DF22 larvae. The difference was maintained up to 40 dph (Figure 3, Table 2). The SGRTL and TGCTL for the total hatchery rearing period were also significantly higher in DF3 larvae compared to DF22 (Table 2). The coefficient of total length variation at 40 dph (CVTL, Table 2) was similar between experimental treatments. The frequency distribution of the total length on 40 dph clearly showed that, in DF22, the majority of the larvae had obtained a lower total length than those in DF3 (Figure 4). Comparison of length distributions revealed a highly significant difference (Figure 4).

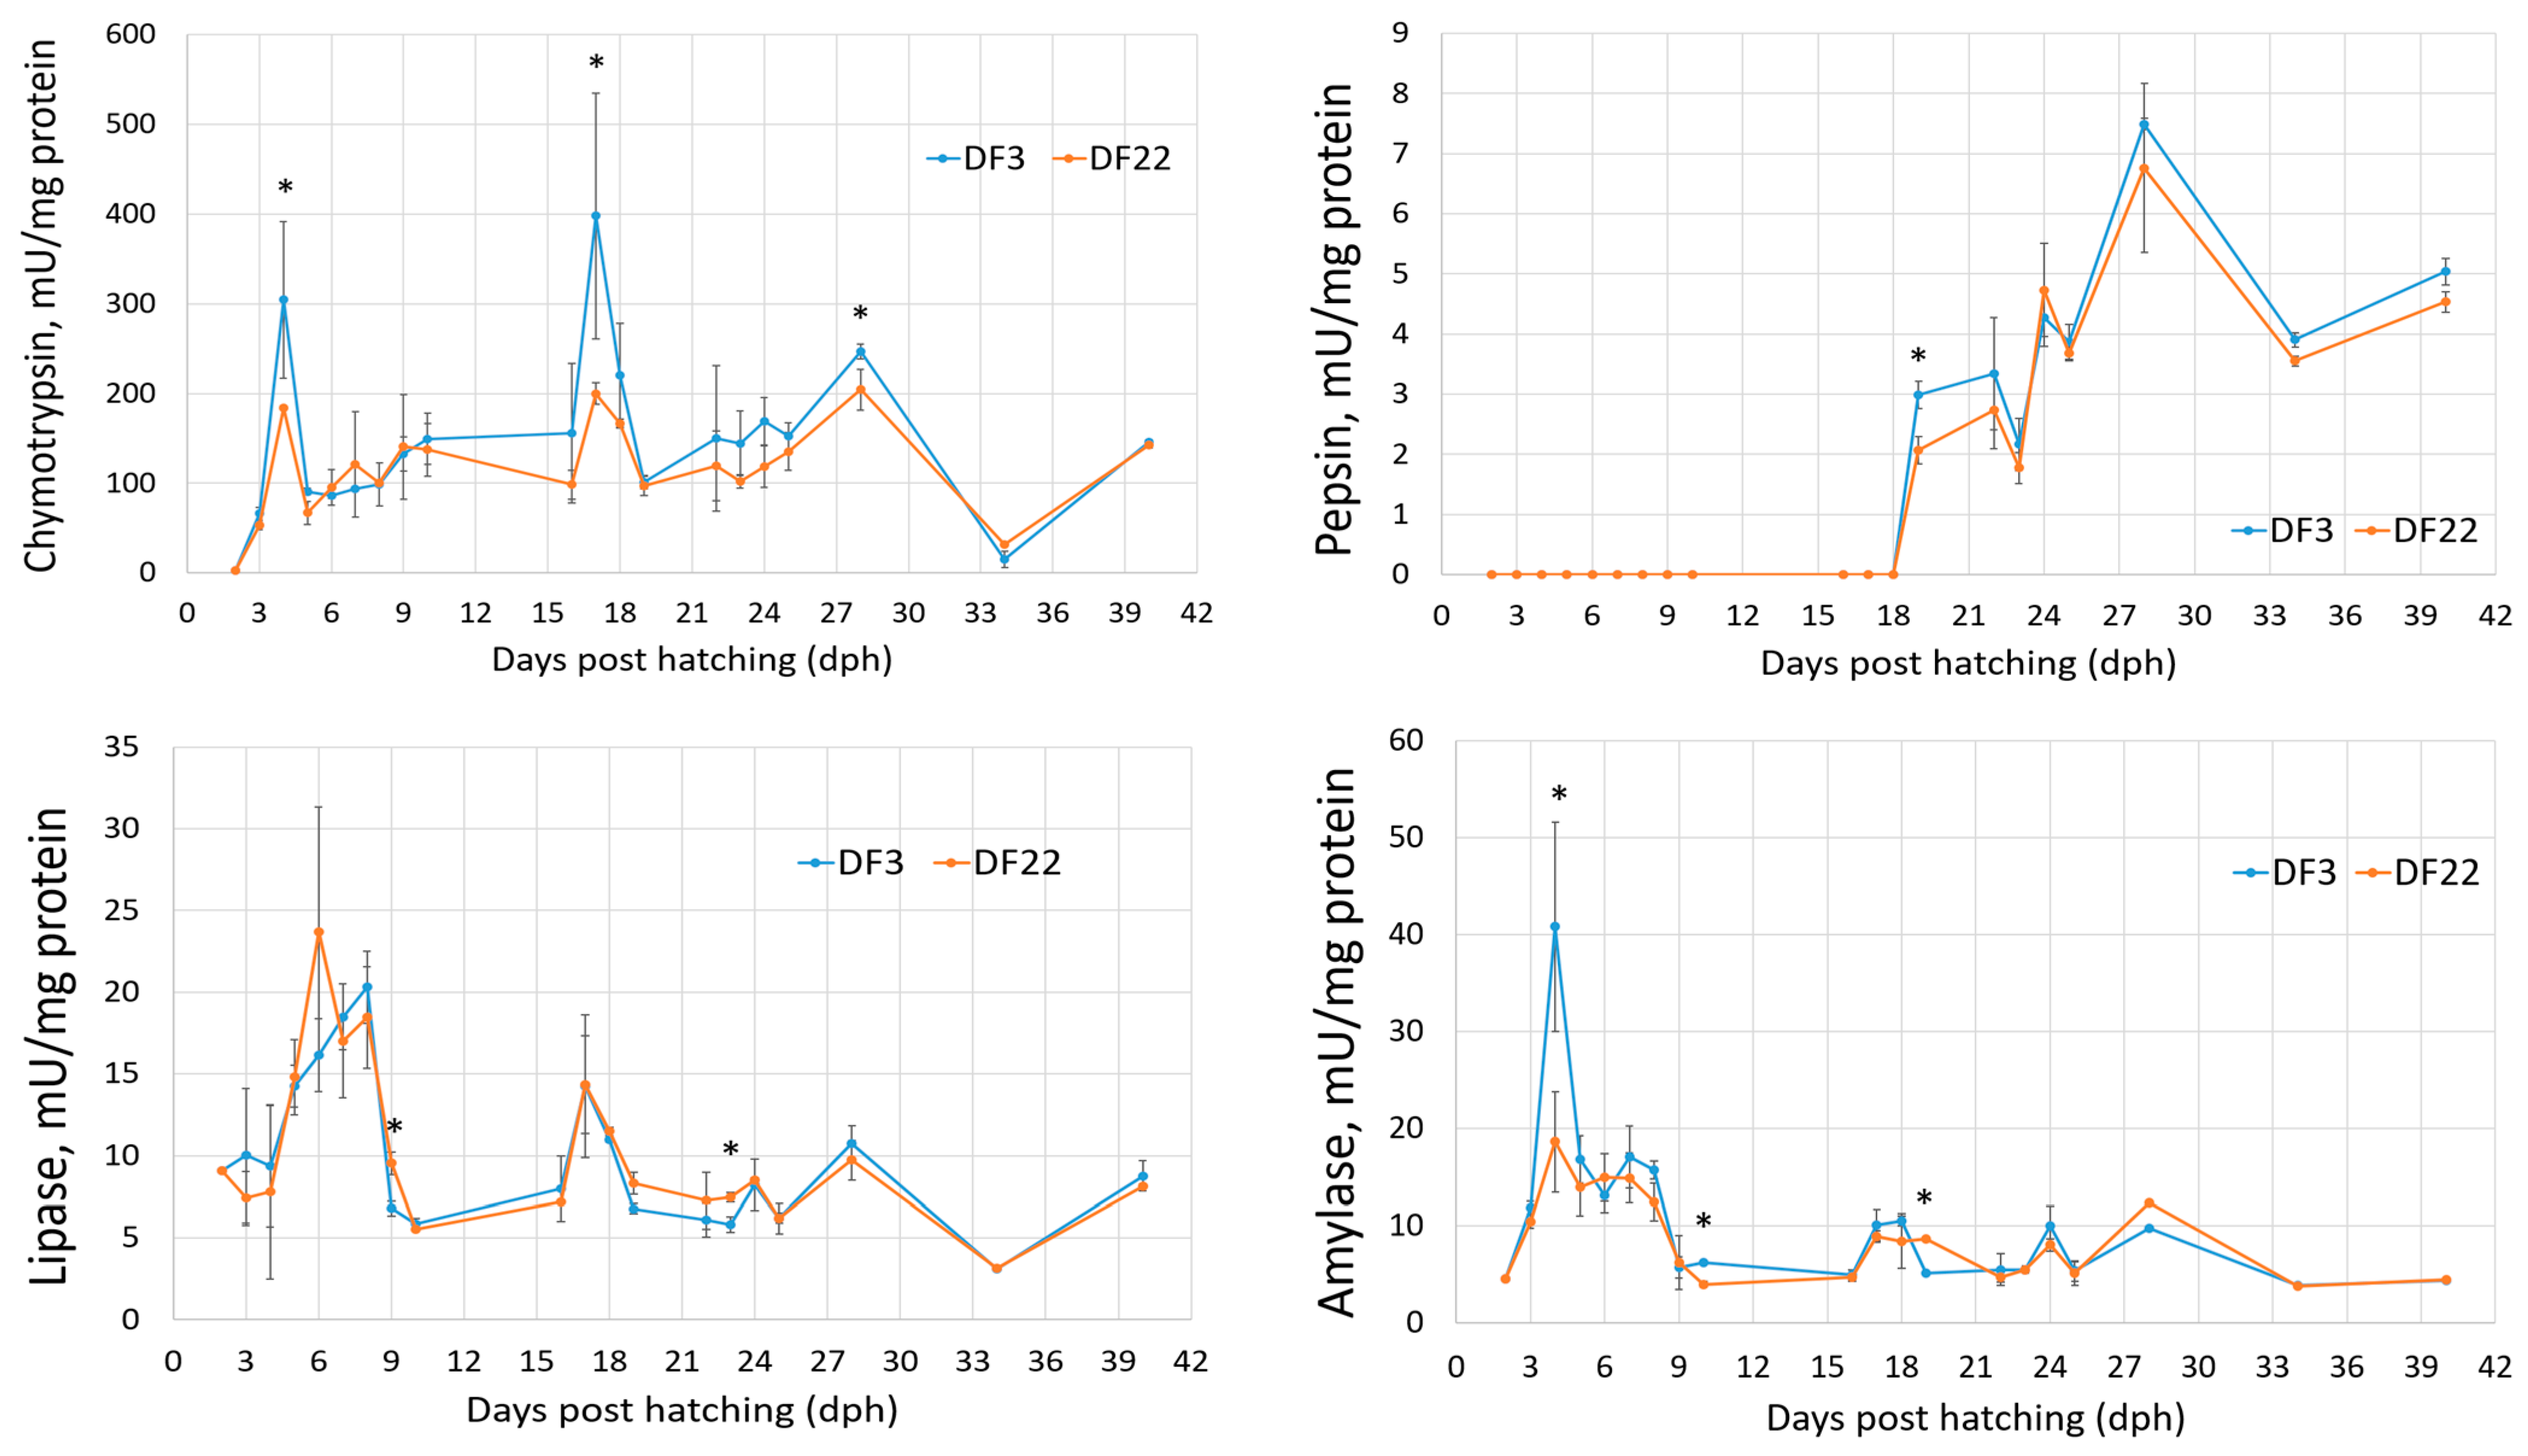
3.1.2. Digestive Enzymes

Whole body protein steadily increased throughout red seabream larvae development in both DF3 and DF22 treatments (Figure 5). During 19–23 dph, DF3 larvae had consistently higher values than DF22 larvae. Otherwise, the opposite was observed.
The two pancreatic proteolytic enzymes (trypsin and chymotrypsin) were present, although at low levels, on 2 dph, i.e., before the onset of exogenous feeding (Figure 5). In both DF3 and DF22 larvae, trypsin and chymotrypsin specific activities increased on 3 dph and peaked on 4 dph; DF3 larvae had higher values than DF22 larvae, and the differences were significant for chymotrypsin. From 4 to 10 dph, both proteolytic enzymes decreased in both treatments. A second peak was observed on 17 dph, which coincided with the introduction of Artemia on 16 dph. From 16 dph and up to 28 dph, trypsin activity was higher for DF3 larvae than for DF22 larvae; differences were significant for 19, 23, 24 and 28 dph larvae. A similar pattern was observed for chymotrypsin. Thereafter, both proteolytic enzymes were stabilized, except for 34 dph, where a sharp decrease was observed in both treatments and in both enzymes, coinciding with the larvae’s transfer from indoors to outdoors tanks on 33 dph (Figure 1 and Figure 5).
Pepsin-specific activity was first detected on 19 dph in both treatments (Figure 5). After a peak on 28 dph, pepsin levels stabilized. DF3 larvae had significantly higher pepsin levels on 19 dph.
Lipase-specific activity was present on 2 dph, i.e., before the onset of exogenous feeding (Figure 5). Lipase levels increased up to 6–8 dph, indicating feed intake without great differences between DF3 and DF22. Thereafter, lipase decreased and fluctuations observed followed the introduction of different feed items (i.e., Artemia, dry feed) and fasting events (i.e., larvae transfer on 33 dph). More specifically, an increase was observed on 17 dph, which coincided with the introduction of Artemia on 16 dph. Thereafter, lipase activity stabilized, except for 34 dph (larvae transferred to outdoors tanks).
Amylase specific activity was present on 2 dph, i.e., before the onset of exogenous feeding (Figure 5). In both DF3 and DF22 larvae, amylase increased on 3 dph and further increased on 4 dph, especially for DF3 larvae (significantly different from DF22). Thereafter, amylase stabilized at lower values until 40 dph.

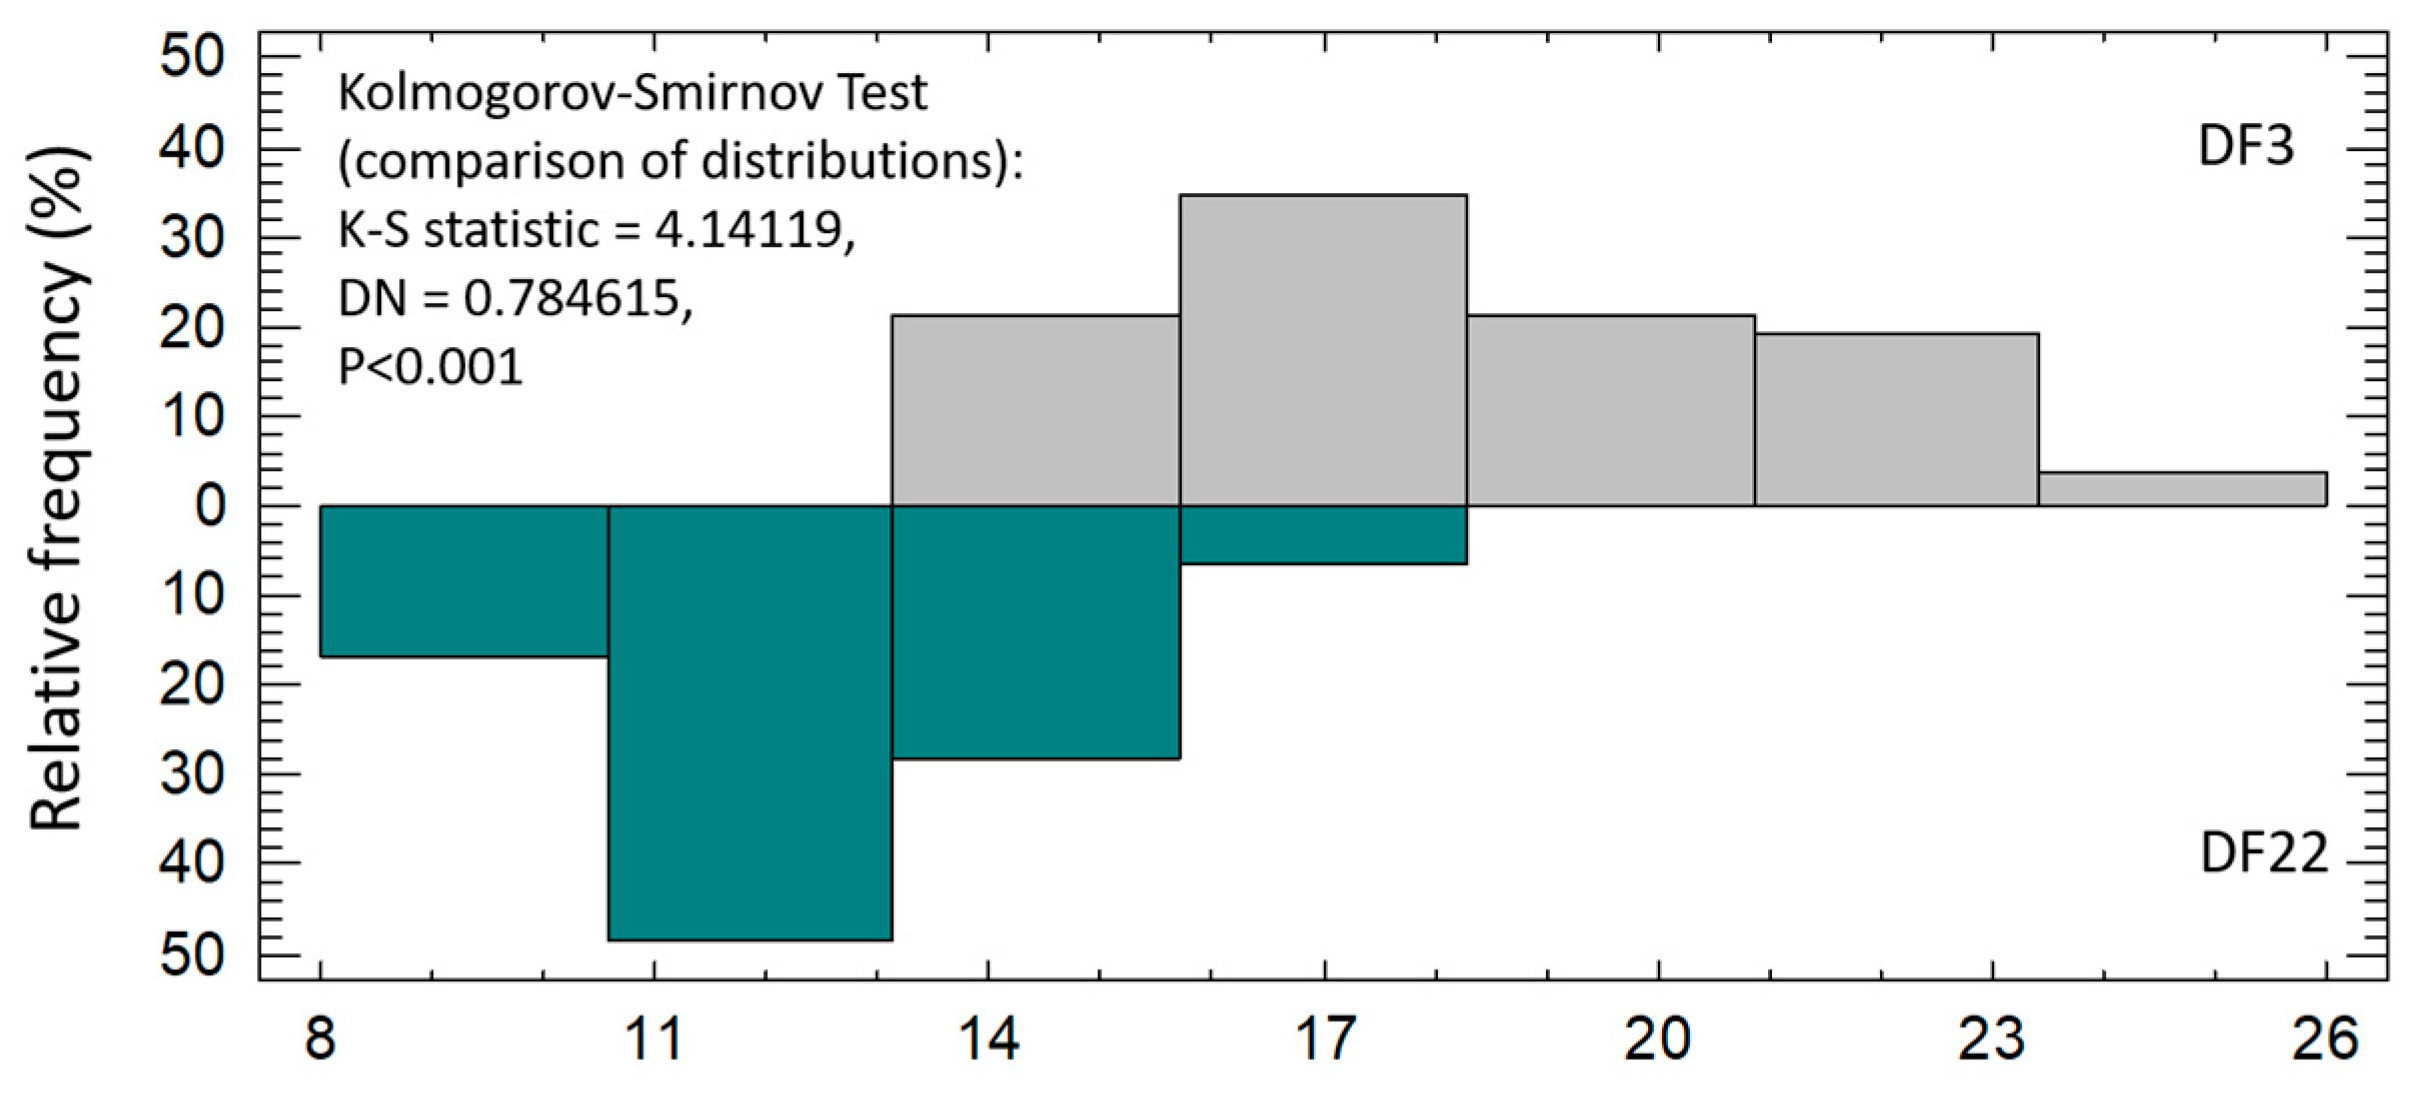
3.1.3. Hatchery Data Obtained on 1st Grading (53 dph)

Survival did not significantly differ between the two treatments (Table 2). The early introduction of dry feed (DF3) resulted in significantly higher and lower percentages of big and small larvae compared to the DF22 treatment. Moreover, both big and small larvae of DF3 were significantly larger than those of DF22 (Table 2).

3.2. Trial 2 (Laboratory Rearing, Lr)

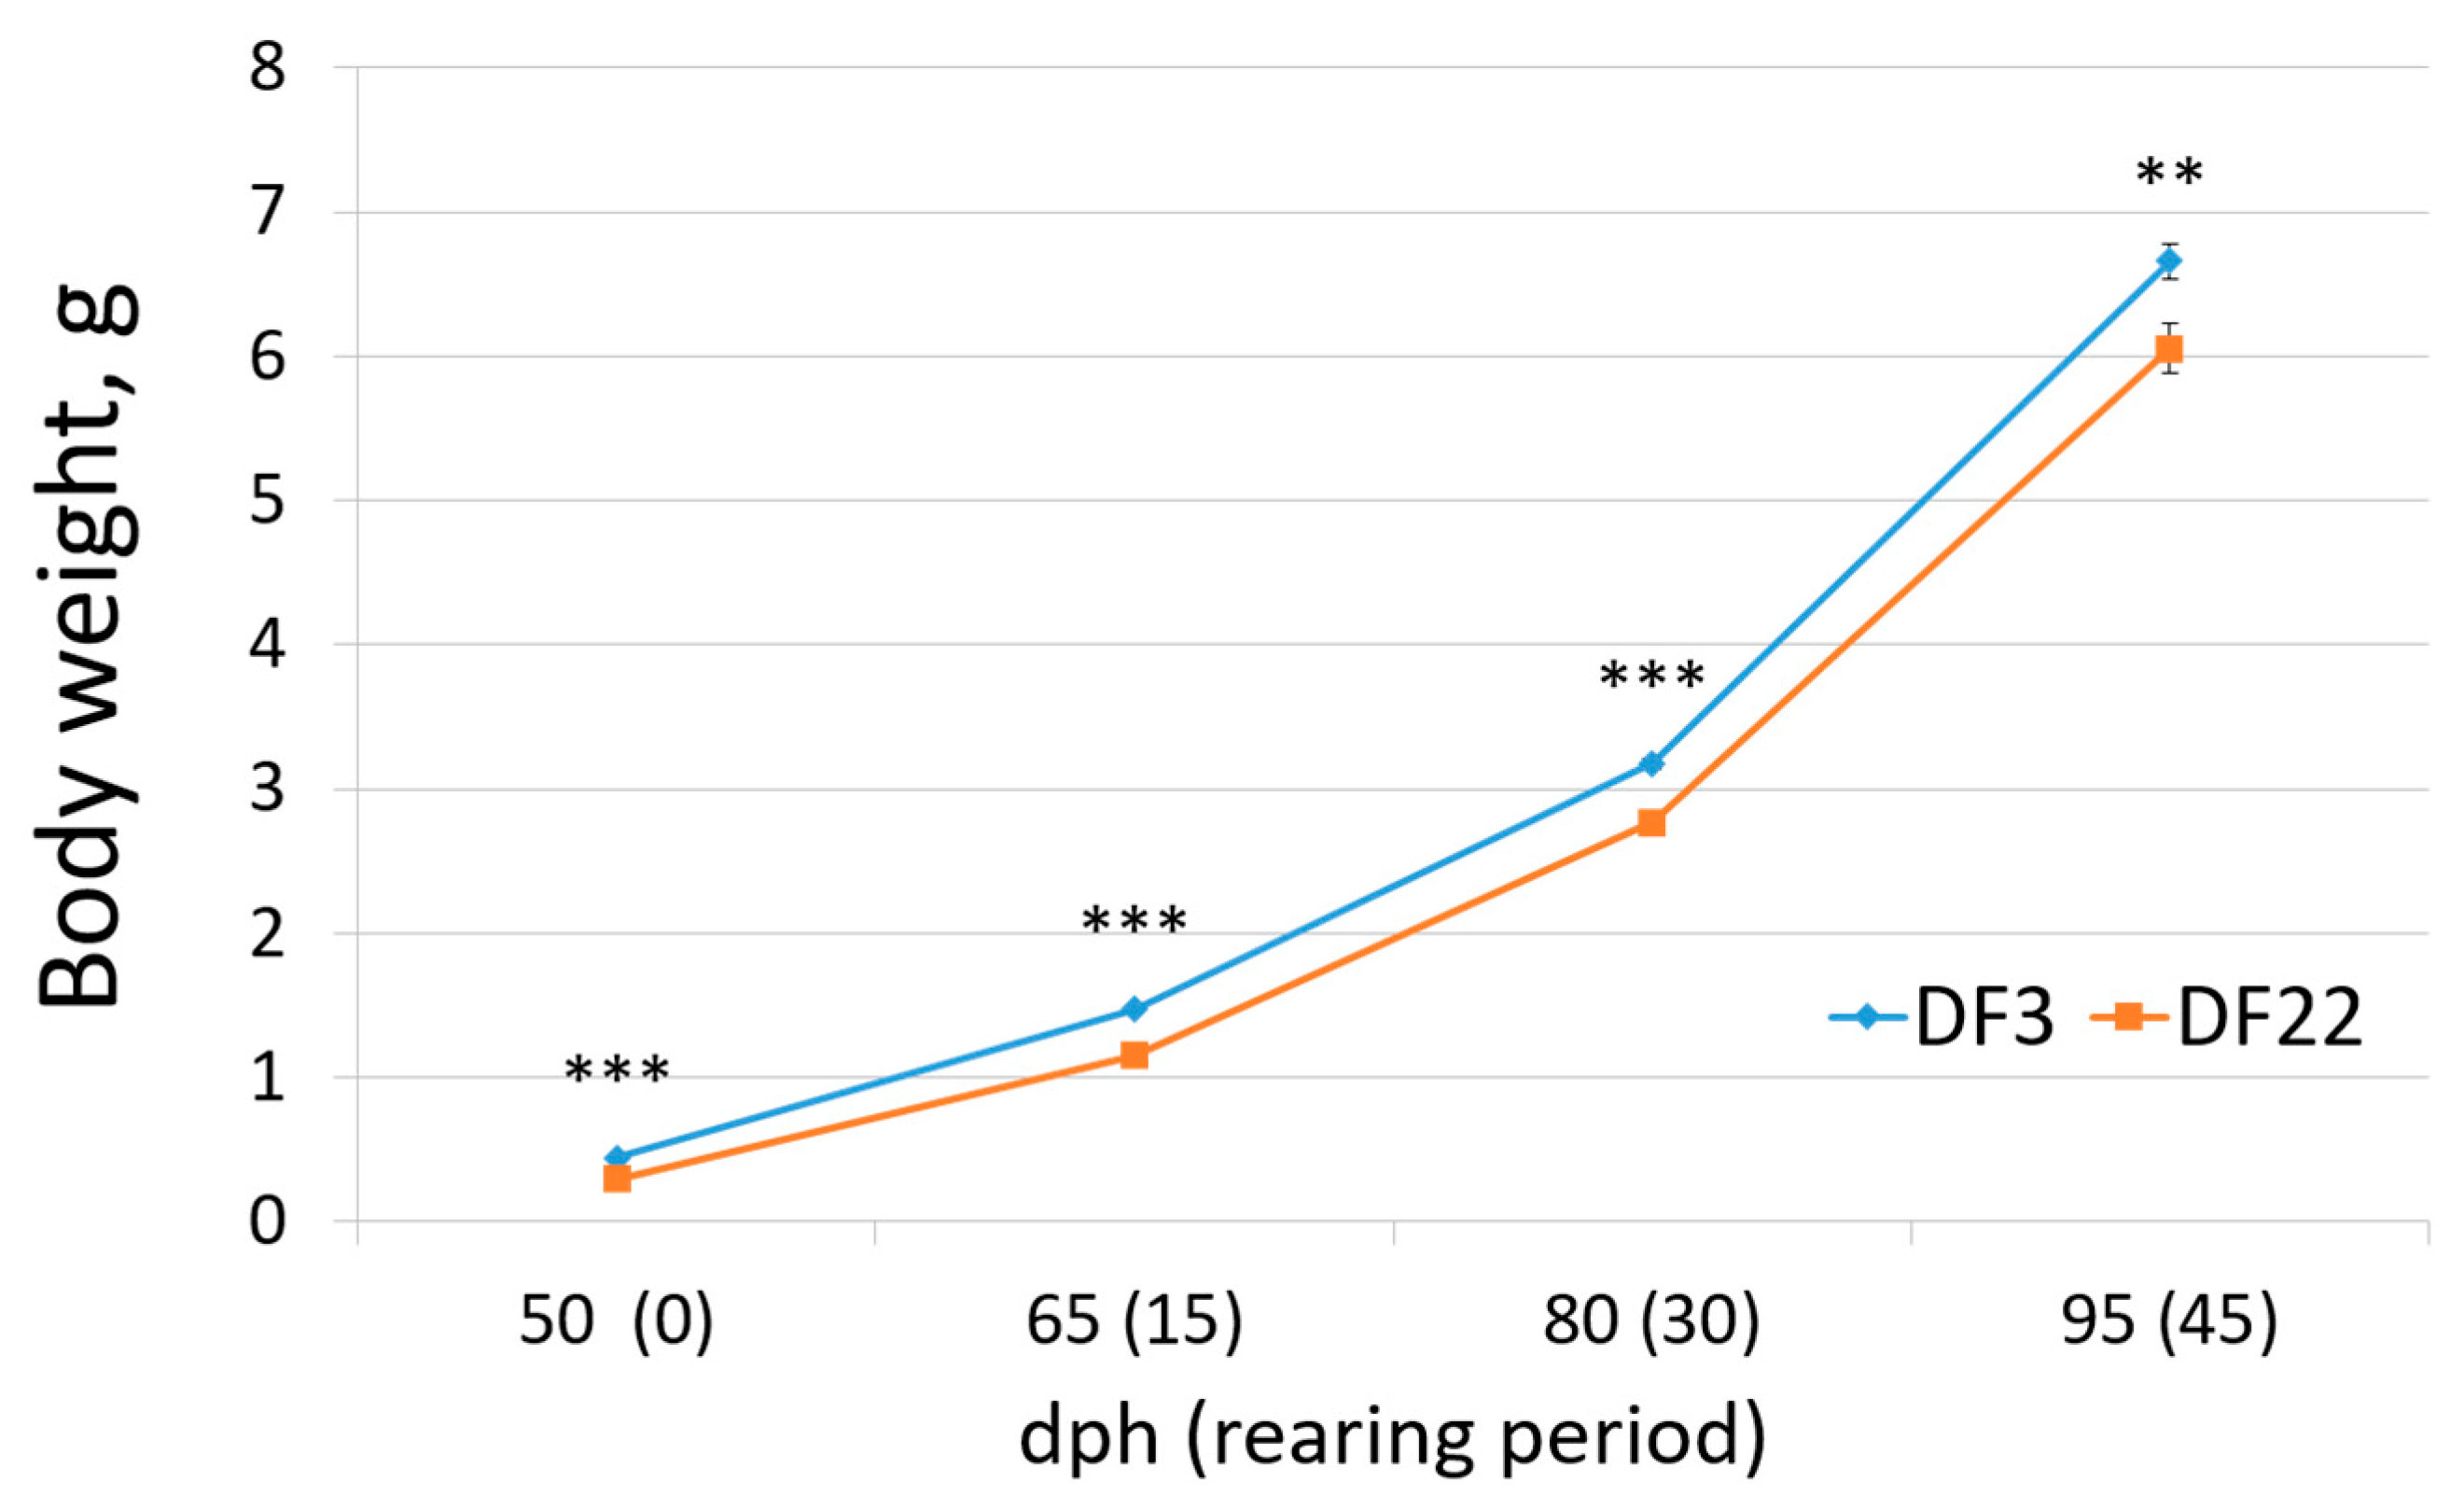
3.2.1. Growth Performance

When fish arrived at the laboratory facilities and were distributed in the experimental tanks, body weight was already differentiated between treatments, i.e., DF3 fish were significantly larger than DF22 fish (Figure 6, Table 3). This difference was maintained throughout the pre-growing experimental period (Figure 6, Table 3). SGR and TGC did not show significant differences between DF3 and DF22 fish, but the WG (g/day) of DF3 fish was significantly higher than DF22 fish (Table 3). CV during the pre-growing experimental period did not differ between DF3 and DF22 (Table 3). Comparison of weight distributions showed statistically significant differences; specifically, most fish of the DF22 treatment were in a lower weight class than DF3 (i.e., DF22: 85% of fish lower than 7.5 g; DF3: 67% of fish lower than 7.5 g; Figure 7). Finally, mortality was not significantly different between treatments (Table 3).

3.2.2. Phenotypical Deformities in Lr

No significant differences were observed between treatments for the total number of deformed fish or for the occurrence of gill, fin and jaw malformations (Table 4). On the other hand, spinal cord malformations were significantly lower in DF3 fish than in DF22 fish (Table 4).

4. Discussion

4.1. Larval Growth During Hr

Larval growth up to 40 dph was generally satisfactory in both treatments. The growth performance of DF22 (standard feeding protocol) was comparable to results previously reported for P. major larvae with similar feeding protocols and water conditions [13,34,35], as well as for the closely related species Pagrus pagrus [36,37,38]. Differences observed with other reported data on Pagrus sp. are probably linked to variations in larvae rearing and feeding protocols [39,40,41,42]. Growth performance of DF3 larvae was much better than both DF22 and previously reported data [13,34,35]. SGR, TGC and length frequency distribution, as well as hatchery data obtained on larvae 1st grading on 53 dph, reflect the growth advantage of DF3 larvae. Because no other differential factor was present, these results are largely attributed to the early introduction of dry feed on 3 dph.
Like present results, early co-feeding has resulted in larger larvae for the driftwood catfish (T. galeatus [25]), the North African catfish (C. gariepinus [14]), the walago catfish (W. attu [24]) and the loach (M. anguillicaudatus [23]). On the other hand, for other species, co-feeding dry and live feed from the onset of exogenous feeding did not have a significant advantage and, in some cases, also resulted in smaller larvae [11,17,18,21]. The variability of larvae’s response to the early introduction of dry feed is probably species-specific, but it may also be related to the partial replacement of live feed with dry feed, which most other published studies applied. Eventually, the goal of these studies was to lessen the use of live feed in aquaculture and consequently make larval rearing more cost-efficient. Instead, in the present study, where the experiment was performed on the actual fish that are produced in a hatchery, we preferred not to have the availability of live feed to newly hatched larvae as a limiting factor.
To our knowledge, the present study is the first one that shows the results of early co-feeding on red seabream larvae. Despite this, the obtained data can be compared with the results for gilthead seabream by Karakatsouli et al. (2021) [15], because they were both conducted in actual production conditions and they both follow very similar experimental feeding protocols (i.e., live feed was not restricted following the introduction of dry feed). In the case of gilthead seabream larvae, growth enhancement was not observed during larviculture but was clearly manifested when the experimental larvae batches were graded for the first time [15]. Apparently, the fact that larval length measurements were performed on samples of the ungraded larvae groups of each tank may have masked the detection of the early dry feed introduction due to large standard length variability. Additionally, the higher growth rate of red seabream larvae as compared to gilthead seabream or other Sparidae larvae [5] may have facilitated the manifestation of the observed growth promotion.
The ingestion of dry feed for DF3 larvae justifies the observed growth-promoting effect. Although larvae probably did not start feeding all at once, and the first encounter with dry feed particles must have been accidental, the presence of progressively increased dry feed particles better acclimates the larvae for their ingestion. A properly manufactured microdiet meeting the nutritional requirements of developing larvae, once ingested, is expected to promote larval growth. Additionally, present DF3 treatment could be considered as a prolonged co-feeding period before weaning, whereas it is known that the longer the period of co-feeding live and dry feeds, the better the larvae are conditioned to be weaned to dry feeds [7,12,17].

4.2. Digestive Enzymes

In the case of Pagrus sp., the maturation of the digestive tract has been well characterized [34,41,43,44,45,46,47]. Also, the digestive enzyme fluctuations that were observed in both treatments follow the pattern that has already been extensively reported for altricial carnivorous fish species, red seabream included [13,34,41,42,45,46,47,48,49]. Some specific points can be noted:
From 2 to 10 dph. The detection of trypsin, chymotrypsin, amylase and lipase at 2 dph indicates the functionality of the pancreatic tissue before the onset of exogenous feeding. It has been theorized that the enzyme activity at this stage aids in the digestion and absorption of the yolk-sac reserves, in addition to preparing for the digestion of the feed that will be consumed by the larvae [13,15,34,41,42,48].
The increase in trypsin and chymotrypsin activity on 3 dph, with a subsequent peak on 4 dph, indicates the ingestion of feed by an increasing number of larvae in both treatments [3,15,42,48]. The higher values observed in DF3 larvae suggest the intake of dry feed in addition to rotifers. Dry feed ingestion in DF3 larvae is also supported by amylase activity, as it follows a similar pattern and peaks on 4 dph at a much higher level than DF22. Besides the fact that marine fish larvae have the capacity of carbohydrate digestion at these early life stages [3], it has also been shown that amylase expression, and by extension amylase activity, can be modulated by the carbohydrate content of the feed to be consumed [8,13,50]. This also corroborates the ingestion of the composed diet by DF3 fish, because it is expected to have higher carbohydrate content than rotifers.
The gradual initial increase in lipase in both treatments can be explained by the progressive intake of feeds that are rich in lipids [7,15]. Lipids are an important energy source for fish, especially carnivorous species, like the red seabream. Additionally, some lipid categories, such as fatty acids and phospholipids, are extremely important for the development of the larvae [44,51].
The activity of both proteolytic pancreatic enzymes is reduced to lower levels after peaking on 4 dph. This is a phenomenon that typically happens at this stage of development, but the causes are not completely known. It could be suggested that it happens in relation to the maturation of the intestine and the secretion of brush border membrane enzymes. This was not explored in the current study, but it has previously been reported for Pagrus sp. larvae [16,49,52].
From 16 to 19 dph. The introduction of Artemia on 16 dph seems to have triggered an increase in the activity of trypsin, chymotrypsin, and, to a lesser extent, lipase. This is a good indication that the fish larvae ingested Artemia. In fact, DF3 larvae seem to have responded more actively to the new prey item since they showed higher enzymatic activity than DF22 larvae.
The appearance of pepsin activity on 19 dph signals the initial formation of the gastric glands and the stomach. This is supported by literature data that report the first signs of gastric glands in Pagrus sp. on 19–20 dph [34,38,41,45].
From 22 to 40 dph. Pepsin activity, after its first appearance, continued to increase in both treatments, peaked on 28 dph, and then stabilized to somewhat lower levels. The pattern observed agrees with literature data that report a fully formed and functional stomach on 28–30 dph in red seabream [34,38,42,45]. With a functional stomach and pepsin present, the relative contribution of the other digestive proteases (pancreatic, intestinal) is reduced. The functionality of the gastric glands as early as 19 dph confirms that the red seabream is a fast-growing species [52], especially in comparison to the gilthead seabream. In fact, Karakatsouli et al. (2021) [15] observed the appearance of pepsin activity in gilthead seabream larvae much later, i.e., on 55 dph. It could be hypothesized that the difference between treatments in the red seabream was more apparent because of the species’ increased growth rate, in contrast to the gilthead seabream.
Until the formation of the stomach, trypsin and chymotrypsin, together with intestinal proteolytic enzymes (that were not measured in the present study), play an important role in the digestion of dietary protein [3,42,49]. Larvae are now more actively ingesting food, justifying the progressive increase in enzymatic activities. The higher activities observed for DF3 larvae compared to DF22 larvae probably reflect the greater needs of these larger larvae and the greater need for body build-up, as body protein also confirms. Once the stomach is formed (after 28 dph), pancreatic enzymatic activities are reduced, since pepsin takes over a major part of protein digestion [13,15,37,45]. This may also justify the absence of significant increases in trypsin and chymotrypsin when dry feed was first introduced on 22 dph larvae of DF22; gastric glands were already present.
As larval development continues, the larvae progressively adopt carnivorous feeding habits, which means that carbohydrate consumption decreases, as does amylase activity, which remains stable at low levels until 40 dph [3,5,13,34,42,45]. Lipase activity, after reaching a peak at 28 dph, remains stable until 40 dph at high enough levels for lipid digestion to continue. Early introduction of DF3 larvae to dry feed did not differentiate this pattern.
It is worth mentioning that the abrupt drop in all enzyme activities (apart from amylase, which was already at low levels) after transfer of the larvae to the outdoor tanks reflects the short-term preceding feed deprivation but may also be related to a stress-induced lower feed intake due to the transfer process [3]. However, it seems that until the next sampling took place, fish larvae had already recovered.
Overall, the digestive activities’ pattern observed in DF3 and DF22 larvae indicates a normal functional development of the digestive system in both feeding protocols. However, when the introduction of dry feed occurs as early as on first feeding (DF3), the digestive system, especially the protein digestion-related enzymes, seems to respond more intensely to new feed items and to function at a higher level, probably to support the resultant fast-growing, larger and more actively feeding larvae.

4.3. Post-Larvae Growth During Lr

The growth advantage gained in the DF3 treatment was maintained until the end of the experimental pre-growing rearing in the laboratory (95 dph). Since growth rates (i.e., SGR, TGC) were similar between experimental treatments, it is suggested that the DF3 treatment gave a significant advantage to the larvae in their early life stages that was then carried forward as larvae grew older. Similar results were obtained for gilthead sea bream under comparable experimental conditions [15] and for loach [23]. It is reasonable to hypothesise that the growth-enhancing effects of early composed diet feeding could have promising results later in the red seabream rearing phases.
It should be noted that a limitation of the present study was that the second trial took place in laboratory conditions. Even though a trial conducted in actual production conditions would produce more realistic results, it would have been very complicated to design and continue. The main difficulty would be to maintain the treatments while frequent gradings and separation/mixing of fish groups into different weight classes occurred. Additionally, the fish arrived at the laboratory ungraded, i.e., big and small fish had not yet been separated. This practice may have “hidden” some aspects of the effect of the DF3 treatment and might even influence its evaluation. This choice was made in part because of the tank limitations in the laboratory, but also to prevent the fish groups from being disturbed further.
The evaluation of the phenotypical deformities of red seabream post-larvae showed that spinal cord malformations were distinctly fewer in DF3 than in DF22. This was also observed for gilthead seabream by Karakatsouli et al. (2021) [15]. The effect is indicated to be related to the timing of dry feed first introduction, since feed composition was the same for both treatments. Early dry feed feeding may have provided larvae with the necessary nutrients to form a healthy skeletal system at the sensitive stages of skeletal ontogenesis. Engrola et al. (2009) [14] also reported a better tail condition at the benthic stage of Senegalese sole that were co-fed at their pelagic phase with live and dry feeds, attributing the fact to a better nutritional status and physiological condition of the fish.

5. Conclusions

Overall, the early introduction of dry feed to newly hatched red seabream larvae had a growth-promoting effect and was not detrimental to the functional development of the digestive system. Instead, the digestive system was able to adapt and support the higher demands of faster larval growth. Additionally, data obtained during pre-growing are promising and suggest that growth benefits observed during larval rearing can persist during later growth stages. Co-feeding live and dry feed from the onset of exogenous feeding may also decrease the chances of spinal cord malformations of red seabream post-larvae and juveniles. It would be interesting to evaluate whether similar benefits can be obtained by rationally reducing Artemia use, to eventually establish more cost-efficient feeding protocols for red seabream larviculture. The present study shows the feasibility of an alternative feeding protocol for red seabream intensive larviculture and points out the critical role that larval rearing may have for later production stages.

Author Contributions

Conceptualization, N.K. and K.N.; validation, N.K., S.B.B. and A.B.; formal analysis, N.K.; investigation, S.B.B., V.-A.A., I.M., A.B. and A.K.; resources, K.N. and A.K.; writing—original draft preparation, S.B.B.; writing—review and editing, N.K., S.B.B. and K.N.; visualization, S.B.B. and N.K.; supervision, N.K., K.N. and A.K.; project administration, N.K. and K.N.; funding acquisition, K.N. All authors have read and agreed to the published version of the manuscript.

Funding

This research was funded by BioMar Hellenic SA (grant number: 920035).

Institutional Review Board Statement

This study was carried out in accordance with the EU Directive 2010/63/EU, national laws (PD 160/91) for animal experiments and the Bioethics Committee of the Department of Animal Science of the Agricultural University of Athens (approval code: 14/07.03.2025).

Data Availability Statement

Raw data will be made available by the authors upon reasonable request.

Acknowledgments

We cannot thank enough all the staff of the hatchery for their fundamental contribution to the successful experimental larval rearing. We are most grateful to G. Konstantinou for his valuable technical laboratory assistance.

Conflicts of Interest

The author Kostas Ntomalis was employed by BioMar Hellenic SA. The author Anemos Kastelis was employed by Hellenic Fishfarming SA. The remaining author declares that the research was conducted in the absence of any commercial or financial relationships that could be construed as a potential conflict of interest.

References

  1. Basurco, B.; Lovatelli, A.; Garcia, B. Current Status of Sparidae Aquaculture. In Sparidae: Biology and Aquaculture of Gilthead Sea Bream and Other Species; Pavlidis, M.A., Mylonas, C.C., Eds.; Wiley-Blackwell: Chichester, UK, 2011; pp. 1–50. ISBN 978-1-4051-9772-4. [Google Scholar]
  2. HAPO. Aquaculture in Greece: Aquaculture Annual Report 2024; Hellenic Aquaculture Producers Organisation: Athens, Greece, 2024. [Google Scholar]
  3. Rønnestad, I.; Yufera, M.; Ueberschar, B.; Ribeiro, L.; Sæle, Ø.; Boglione, C. Feeding Behaviour and Digestive Physiology in Larval Fish: Current Knowledge, and Gaps and Bottlenecks in Research. Rev. Aquac. 2013, 5, S59–S98. [Google Scholar] [CrossRef]
  4. Hagiwara, A.; Gallardo, W.G.; Assavaaree, M.; Kotani, T.; de Araujo, A.B. Live Food Production in Japan: Recent Progress and Future Aspects. Aquaculture 2001, 200, 111–127. [Google Scholar] [CrossRef]
  5. Yufera, M.; Conceicao, L.E.C.; Battaglene, S.; Fushimi, H.; Kotani, T. Early Development and Metabolism. In Sparidae: Biology and Aquaculture of Gilthead Sea Bream and Other Species; Pavlidis, M.A., Mylonas, C.C., Eds.; Wiley-Blackwell: Chichester, UK, 2011; pp. 133–155. ISBN 978-1-4051-9772-4. [Google Scholar]
  6. Hamre, K. Nutrient Profiles of Rotifers (Brachionus Sp.) and Rotifer Diets from Four Different Marine Fish Hatcheries. Aquaculture 2016, 450, 136–142. [Google Scholar] [CrossRef]
  7. Hart, P.; Purser, J. Weaning of Hatchery-Reared Greenback Flounder (Rhombosolea tapirina Gunther) from Live to Artificial Diets: Effects of Age and Duration of the Changeover Period. Aquaculture 1996, 145, 171–181. [Google Scholar] [CrossRef]
  8. Cahu, C.; Zambonino Infante, J. Substitution of Live Food by Formulated Diets in Marine Fish Larvae. Aquaculture 2001, 200, 161–180. [Google Scholar] [CrossRef]
  9. Mozes, N.; Papandroulakis, N.; Vergara, J.M.; Biswas, A.; Takii, K.; Ntatsopoulos, A. Production Systems. In Sparidae: Biology and Aquaculture of Gilthead Sea Bream and Other Species; Pavlidis, M.A., Mylonas, C.C., Eds.; Blackwell Publishing: Chichester, UK, 2011; pp. 169–198. ISBN 978-1-4051-9772-4. [Google Scholar]
  10. Hamre, K.; Yufera, M.; Rønnestad, I.; Boglione, C.; Conceicao, L.E.C.; Izquierdo, M. Fish Larval Nutrition and Feed Formulation: Knowledge Gaps and Bottlenecks for Advances in Larval Rearing. Rev. Aquac. 2013, 5, S26–S58. [Google Scholar] [CrossRef]
  11. Fernandez-Diaz, C.; Yufera, M. Detecting Growth in Gilthead Seabream, Sparus aurata L., Larvae Fed Microcapsules. Aquaculture 1997, 153, 93–102. [Google Scholar] [CrossRef]
  12. Fosse, P.J.; da Cruz Mattos, D.; Demier Cardoso, L.; Costa Radael, M.; Fosse Filho, J.; Vazquez Vidal, M.J. Duration of Co-Feeding on the Nishikigoi Cyprinus carpio Larvae during Weaning from Live to Inert Food in an Indoor System. Cienc. Rural 2018, 48, e20170579. [Google Scholar] [CrossRef]
  13. Khoa, T.N.D.; Waqalevu, V.; Honda, A.; Shiozaki, K.; Kotani, T. Comparative Study on Early Digestive Enzyme Activity and Expression in Red Sea Bream (Pagrus major) Fed on Live Feed and Micro-Diet. Aquaculture 2020, 519, 734721. [Google Scholar] [CrossRef]
  14. Chepkirui-Boit, V.; Ngugi, C.C.; Bowman, J.; Oyoo-Okoth, E.; Rasowo, J.; Mugo-Bundi, J.; Cherop, L. Growth Performance, Survival, Feed Utilization and Nutrient Utilization of African Catfish (Clarias gariepinus) Larvae Co-Fed Artemia and a Micro-Diet Containing Freshwater Atyid Shrimp (Caridina nilotica) during Weaning. Aquac. Nutr. 2011, 17, e82–e89. [Google Scholar] [CrossRef]
  15. Karakatsouli, N.; Batzina, A.; Ntomalis, K.; Panopoulos, S.; Coli, A.; Geropanagioti, E.; Anastasiadou, C.; Rati, M.; Bantounas, S. Co-Feeding Dry and Live Feed in First-Feeding Gilthead Seabream: Effects on Functional Development of the Digestive System, Larvae and Postlarvae Performance. Aquac. Nutr. 2021, 27, 2555–2566. [Google Scholar] [CrossRef]
  16. Kestemont, P.; Xueliang, X.; Hamza, N.; Maboudou, J.; Imorou Toko, I. Effect of Weaning Age and Diet on Pikeperch Larviculture. Aquaculture 2007, 264, 197–204. [Google Scholar] [CrossRef]
  17. Canavate, J.P.; Fernandez-Diaz, C. Influence of Co-Feeding Larvae with Live and Inert Diets on Weaning the Sole Solea senegalensis onto Commercial Dry Feeds. Aquaculture 1999, 174, 255–263. [Google Scholar] [CrossRef]
  18. Mai, M.G.; Engrola, S.; Morais, S.; Portella, M.C.; Verani, J.R.; Dinis, M.T.; Conceicao, L.E.C. Co-Feeding of Live Feed and Inert Diet from First-Feeding Affects Artemia Lipid Digestibility and Retention in Senegalese Sole (Solea senegalensis) Larvae. Aquaculture 2009, 296, 284–291. [Google Scholar] [CrossRef]
  19. Engrola, S.; Figueira, L.; Conceicao, L.E.C.; Gavaia, P.J.; Ribeiro, L.; Dinis, M.T. Co-Feeding in Senegalese Sole Larvae with Inert Diet from Mouth Opening Promotes Growth at Weaning. Aquaculture 2009, 288, 264–272. [Google Scholar] [CrossRef]
  20. Engrola, S.; Mai, M.; Dinis, M.T.; Conceicao, L.E.C. Co-Feeding of Inert Diet from Mouth Opening Does Not Impair Protein Utilization by Senegalese Sole (Solea senegalensis) Larvae. Aquaculture 2009, 287, 185–190. [Google Scholar] [CrossRef]
  21. Engrola, S.; Dinis, M.T.; Conceicao, L.E.C. Senegalese Sole Larvae Growth and Protein Utilization Is Depressed When Co-Fed High Levels of Inert Diet and Artemia since First Feeding. Aquac. Nutr. 2010, 16, 457–465. [Google Scholar] [CrossRef]
  22. Wang, Y.; Hu, M.; Cao, L.; Wang, W. Effects of Daphnia (Moina micrura) plus Chlorella (Chlorella pyrenoidosa) or Microparticle Diets on Growth and Survival of Larval Loach (Misgurnus anguillicaudatus). Aquac. Int. 2008, 16, 361–368. [Google Scholar] [CrossRef]
  23. Wang, Y.; Hu, M.; Wang, W.; Cao, L. Effects on Growth and Survival of Loach (Misgurnus anguillicaudatus) Larvae When Co-Fed on Live and Microparticle Diets. Aquac. Res. 2009, 40, 385–394. [Google Scholar] [CrossRef]
  24. Giri, S.S.; Sahoo, S.K.; Sahu, B.B.; Sahu, A.K.; Mohanty, S.N.; Mukhopadhyay, P.K.; Ayyappan, S. Larval Survival and Growth in Wallago attu (Bloch and Schneider): Effects of Light, Photoperiod and Feeding Regimes. Aquaculture 2002, 213, 151–161. [Google Scholar] [CrossRef]
  25. Marinho, Y.F.; Oliveira, C.Y.B.; Mendes, L.E.M.; Santos, I.R.A.; Dias, J.A.R.; Ândrade, M.; Lopes, Y.V.A.; Azevedo, J.W.J.; Lourenço, C.B.; Moura, R.S.T.; et al. Co-Feeding Using Live Food and Feed as First Feeding for the Small Catfish Trachelyopterus galeatus (Linnaeus 1766). Arq. Bras. Med. Veterinária E Zootec. 2024, 76, 323–332. [Google Scholar] [CrossRef]
  26. Sweetman, J.W. Larviculture of Mediterranean Marine Fish Species: Current Status and Future Trends. J. World Aquac. Soc. 1992, 23, 330–337. [Google Scholar] [CrossRef]
  27. López-Alvarado, J.; Kanazawa, A. Effect of Dietary Protein Sources in Microdiets on Feeding Behavior and Growth of Red Sea Bream, Pagrus major, During Weaning and Metamorphosis. J. Appl. Aquac. 1997, 7, 53–66. [Google Scholar] [CrossRef]
  28. El-Sayed, H.S.; Ghonim, A.Z.; El-Khodary, G.M.; El-Sheikh, M.A.; Khairy, H.M. Application of Enriched Cyclops Abyssorum divergens with Mixed Algal Diet Compared to Artemia franciscana for Improving Larval Growth and Body Composition of Dicentrarchus labrax. Aquac. Rep. 2021, 20, 100715. [Google Scholar] [CrossRef]
  29. Lainé, J.; Beattie, M.; LeBel, D. Simultaneous Kinetic Determinations of Lipase, Chymotrypsin, Trypsin, Elastase, and Amylase on the Same Microtiter Plate. Pancreas 1993, 8, 383–386. [Google Scholar] [CrossRef]
  30. Anson, M.L. The Estimation of Pepsin, Trypsin, Papain, and Cathepsin with Hemoglobin. J. Gen. Physiol. 1938, 22, 79–89. [Google Scholar] [CrossRef]
  31. Somogyi, M. Modifications of Two Methods for the Assay of Amylase. Clin. Chem. 1960, 6, 23–35. [Google Scholar] [CrossRef] [PubMed]
  32. Choi, S.-J.; Hwang, J.M.; Kim, S.I. A Colorimetric Microplate Assay Method for High Throughput Analysis of Lipase Activity. J. Biochem. Mol. Biol. 2003, 36, 417–420. [Google Scholar] [CrossRef]
  33. Bradford, M.M. Rapid and Sensitive Method for the Quantitation of Microgram Quantities of Protein Utilizing the Principle of Protein-Dye Binding. Anal. Biochem. 1976, 72, 248–254. [Google Scholar] [CrossRef]
  34. Khoa, T.N.D.; Waqalevu, V.; Honda, A.; Shiozaki, K.; Kotani, T. Early Ontogenetic Development, Digestive Enzymatic Activity and Gene Expression in Red Sea Bream (Pagrus major). Aquaculture 2019, 512, 734283. [Google Scholar] [CrossRef]
  35. Sasaki, T.; Matsui, H.; Kuwabara, Y.; Yokoyama, S.; Ishikawa, M.; Kotani, T. Euryhaline Copepod Pseudodiaptomus inopinus Changed the Prey Preference of Red Sea Bream Pagrus major Larvae. Fish. Sci. 2024, 90, 281–294. [Google Scholar] [CrossRef]
  36. Andrade, C.A.P.; Nascimento, F.; Conceicao, L.E.C.; Linares, F.; Lacuisse, M.; Dinis, M.T. Red Porgy, Pagrus pagrus, Larvae Performance and Nutritional Condition in Response to Different Weaning Regimes. J. World Aquac. Soc. 2012, 43, 321–334. [Google Scholar] [CrossRef]
  37. Andrade, C.A.P.; Nascimento, F.; Noguiera, N.; Pimenta, F.; Dinis, M.T.; Narciso, L. Allometric Growth in Red Porgy Larvae: Developing Morphological Indices for Mesocosm Semi-Intensive Culture. N. Am. J. Aquac. 2013, 75, 42–49. [Google Scholar] [CrossRef]
  38. Andrade, C.A.P.; Soares, F.; Ribeiro, L.; Roo, F.; Socorro, J.; Dinis, M.T. Morphological, Histological, Histochemical and Behavioral Aspects during Early Development of Red Porgy Pagrus pagrus L. Reared in Mesocosm. Turk. J. Fish. Aquat. Sci. 2015, 15, 137–148. [Google Scholar] [CrossRef]
  39. Mihelakakis, A.; Yoshimatsu, T.; Tsolkas, C. Spawning in Captivity and Early Life History of Cultured Red Porgy, Pagrus pagrus. Aquaculture 2001, 199, 333–352. [Google Scholar] [CrossRef]
  40. Papandroulakis, N.; Kentouri, M.; Divanach, P. Biological Performance of Red Porgy (Pagrus pagrus) Larvae under Intensive Rearing Conditions with the Use of an Automated Feeding System. Aquac. Int. 2004, 12, 191–203. [Google Scholar] [CrossRef]
  41. Darias, M.J.; Ortiz-Delgado, J.B.; Sarasquete, C.; Martinez-Rodriguez, G.; Yufera, M. Larval Organogenesis of Pagrus pagrus L., 1758 with Special Attention to the Digestive System Development. Histol. Histopathol. 2007, 22, 753–768. [Google Scholar] [CrossRef]
  42. Suzer, C.; Kamaci, H.O.; Coban, D.; Saka, S.; Firat, K.; Ozkara, B.; Ozkara, A. Digestive Enzyme Activity of the Red Porgy (Pagrus pagrus, L.) during Larval Development under Culture Conditions. Aquac. Res. 2007, 38, 1778–1785. [Google Scholar] [CrossRef]
  43. Uematsu, K.; Kitano, M.; Morita, M.; Iijima, N. Presence and Ontogeny of Intestinal and Pancreatic Phospholipase A2-like Proteins in the Red Sea Bream, Pagrus major. An Immunocytochemical Study. Fish Physiol. Biochem. 1992, 9, 427–438. [Google Scholar] [CrossRef]
  44. Roo, F.J.; Socorro, J.; Izquierdo, M.S.; Caballero, M.J.; Hernández-Cruz, C.M.; Fernández, A.; Fernández-Palacios, H. Development of Red Porgy Pagrus pagrus Visual System in Relation with Changes in the Digestive Tract and Larval Feeding Habits. Aquaculture 1999, 179, 499–512. [Google Scholar] [CrossRef]
  45. Darias, M.J.; Murray, H.M.; Gallant, J.W.; Douglas, S.E.; Yúfera, M.; Martínez-Rodríguez, G. The Spatiotemporal Expression Pattern of Trypsinogen and Bile Salt-Activated Lipase during the Larval Development of Red Porgy (Pagrus pagrus, Pisces, Sparidae). Mar. Biol. 2007, 152, 109–118. [Google Scholar] [CrossRef]
  46. Darias, M.J.; Murray, H.M.; Gallant, J.W.; Douglas, S.E.; Yúfera, M.; Martínez-Rodríguez, G. Ontogeny of Pepsinogen and Gastric Proton Pump Expression in Red Porgy (Pagrus pagrus): Determination of Stomach Functionality. Aquaculture 2007, 270, 369–378. [Google Scholar] [CrossRef]
  47. Sánchez-Amaya, M.I.; Ortiz-Delgado, J.B.; García-López, Á.; Cárdenas, S.; Sarasquete, C. Larval Ontogeny of Redbanded Seabream Pagrus auriga Valenciennes, 1843 with Special Reference to the Digestive System. A Histological and Histochemical Approach. Aquaculture 2007, 263, 259–279. [Google Scholar] [CrossRef]
  48. Cahu, C.; Rønnestad, I.; Grangier, V.; Zambonino Infante, J.L. Expression and Activities of Pancreatic Enzymes in Developing Sea Bass Larvae (Dicentrarchus labrax) in Relation to Intact and Hydrolyzed Dietary Protein; Involvement of Cholecystokinin. Aquaculture 2004, 238, 295–308. [Google Scholar] [CrossRef]
  49. Waqalevu, V.; Honda, A.; Dossou, S.; Khoa, T.N.D.; Matsui, H.; Mzengereza, K.; Liu, H.; Ishikawa, M.; Shiozaki, K.; Kotani, T. Effect of Oil Enrichment on Brachionus plicatilis Rotifer and First Feeding Red Sea Bream (Pagrus major) and Japanese Flounder (Paralichthys olivaceus). Aquaculture 2019, 510, 73–83. [Google Scholar] [CrossRef]
  50. Sargent, J.; McEvoy, L.; Estevez, A.; Bell, G.; Bell, M.; Henderson, J.; Tocher, D. Lipid Nutrition of Marine Fish during Early Development: Current Status and Future Directions. Aquaculture 1999, 179, 217–229. [Google Scholar] [CrossRef]
  51. Tocher, D.R.; Bendiksen, E.Å.; Campbell, P.J.; Bell, J.G. The Role of Phospholipids in Nutrition and Metabolism of Teleost Fish. Aquaculture 2008, 280, 21–34. [Google Scholar] [CrossRef]
  52. Foscarini, R. A Review: Intensive Farming Procedure for Red Sea Bream (Pagrus major) in Japan. Aquaculture 1988, 72, 191–246. [Google Scholar] [CrossRef]
Figure 1. Feeding protocols of red seabream larvae during Hr from 3 to 40 days post-hatching (dph). DF3: Dry feed introduction on 3 dph. DF22: Dry feed introduction on 3 dph. Transfer: Transfer of larvae to outdoor tanks.
Fishes 10 00324 g001
Figure 2. Photos of red seabream larvae during Hr. (a): 5 dph larvae with ingested rotifers (DF3); (b): 16 dph larvae with ingested rotifers (DF22); (c): 18 dph larvae with ingested dry feed (DF3); (d): 23 dph larvae with ingested Artemia (DF22).
Fishes 10 00324 g002
Figure 3. Red seabream larvae total length (mm) during development (significant differences between DF3 and DF22 for the same dph are denoted with asterisks; n = 2; * p < 0.05).
Fishes 10 00324 g003
Figure 4. Relative frequency (%) of red seabream larvae total length on 40 dph and comparison of distributions between experimental treatments.
Fishes 10 00324 g004
Figure 5. Total protein (mg/g larvae) and digestive enzymes specific activity (units/mg protein) during red seabream development (significant differences between DF3 and DF22 for the same dph are denoted with asterisks; n = 2; * p < 0.05).
Fishes 10 00324 g005aFishes 10 00324 g005b
Figure 6. Body weight (g) of red seabream during Lr pre-growing (significant differences between DF3 and DF22 for the same dph are denoted with asterisks; n = 5; ** p < 0.01; *** p < 0.001).
Fishes 10 00324 g006
Figure 7. Relative frequency (%) of red seabream body weight after 45 days of Lr pre-growing and comparison of distributions between experimental treatments.
Fishes 10 00324 g007
Table 1. Feeding protocol of red seabream larvae during Hr.
DF3 DF22
dphRotifers 1, mil/m3/dayArtemia 2, mil/m3/dayDry Feed 3, g/m3/dayRotifers, mil/m3/dayArtemia, mil/m3/dayDry Feed, g/m3/day
1
2
36.0 6.76.0
446.0 8.346.0
514.5 8.314.5
616.0 8.316.0
715.0 9.915.0
826.0 10.026.0
932.0 23.232.0
1034.0 16.534.0
1134.0 16.634.0
1232.0 16.732.0
1330.0 20.030.0
1442.0 20.042.0
1530.0 25.030.0
1638.00.425.038.00.4
1726.00.825.026.00.8
1830.01.625.030.01.6
1930.03.025.030.03.0
2032.03.825.032.03.8
2132.04.325.032.04.3
22 3.825.0 3.825.0
23 4.125.0 4.125.0
24 4.925.0 4.925.0
25 6.025.0 6.025.0
26 4.825.0 4.825.0
27 7.225.0 7.225.0
28 7.425.0 7.425.0
29 7.725.0 7.725.0
30 7.425.0 7.425.0
31 7.033.3 7.033.3
32 7.033.3 7.033.3
33 4.026.3 4.026.3
34 5.055.6 5.055.6
35 5.055.6 5.055.6
36 55.6 55.6
37 55.6 55.6
38 55.6 55.6
39 55.6 55.6
40 55.6 55.6
1 Rotifers were enriched with LARVIVA Multigain (BioMar) and contained: lipid 12.4 (% dry weight), protein 62.3 (% dry weight), n-3 HUFA 20.7 (mg/g dry weight). 2 Artemia were enriched with LARVIVA Multigain (BioMar) and contained: lipid 21.5 (% dry weight), protein 58.6 (% dry weight), n-3 HUFA 6.23 (mg/g dry weight). Enriched Artemia nauplii were offered from 16 to 18 dph; enriched Artemia metanauplii were offered from 19 to 35 dph. 3 Dry feed was Larviva Prostart 100 (80–125 μm), 200 (125–250 μm) and 300 (250–400 μm). All differently sized feeds had the same composition (% dry weight): lipid 12%, protein 67%, n-3 HUFA 2.3%. Regardless of the treatment, Larviva Prostart 100 (semi-floating) was offered up to 25 dph, Larviva Prostart 200 (semi-sinking) from 26 to 33 dph and Larviva Prostart 300 (semi-sinking) from 34 to 40 dph. Chemical analysis of live and dry feeds was kindly provided by BioMar.
Table 2. Growth performance and first grading data of red seabream larvae in Hr.
DF3DF22Significance Level (p)
Growth Performance
  Total length, 40 dph (mm)17.98 ± 1.690 b12.31 ± 0.393 a*
  CVTL, 40 dph12.3 ± 1.0515.2 ± 4.08ns
  SGRTL, 3–40 dph5.41 ± 0.253 b4.42 ± 0.076 a*
  TGCTL, 3–40 dph1.71 ± 0.110 b1.30 ± 0.030 a*
Grading data (53 dph)
  Survival (%)28.6 ± 0.8230.9 ± 6.07ns
  % Big fish61.1 ± 5.56 b9.0 ± 2.99 a**
  % Small fish38.9 ± 5.56 a91.0 ± 2.99 b**
  Weight (g) of Big fish0.72 ± 0.015 b0.60 ± 0.02 a*
  Weight (g) of Small fish0.47 ± 0.015 b0.28 ± 0.000 a**
Note: Values are means of duplicated groups ± SEM. Means with different letters in the same row are significantly different. Abbreviations: CVTL, coefficient of total length variation; SGRTL, specific growth rate based on total length; TGCTL, thermal growth coefficient based on total length. ns, not significant; * p < 0.05.; ** p < 0.01.
Table 3. Growth performance of red seabream after 45 days of Lr pre-growing.
DF3DF22Significance Level (p)
Initial body weight (g)0.44 ± 0.010 b0.29 ± 0.010 a***
Final body weight (g)6.66 ± 0.116 b6.05 ± 0.172 a*
Total length (cm)7.43 ± 0.0117.15 ± 0.014ns
Standard length (cm)6.29 ± 0.0226.01 ± 0.033ns
CFTL1.62 ± 0.0111.66 ± 0.014ns
CFSL2.68 ± 0.022 a2.79 ± 0.033 b**
CV (%)25.1 ± 1.4022.8 ± 1.44ns
WG (g/day)0.15 ± 0.003 b0.14 ± 0.004 a*
SGR6.84 ± 0.0546.87 ± 0.083ns
TGC1.02 ± 0.0071.04 ± 0.015ns
Mortality (%)47.3 ± 2.6245.8 ± 1.88ns
Note: Values are means of pentaplicated groups ± SEM. Means with different letters in the same row are significantly different. Abbreviations: CFTL, condition factor based on total length; CFSL, condition factor based on standard length; CV, coefficient of weight variation; SGR, specific growth rate; TGC, thermal growth coefficient. ns, not significant; * p < 0.05.; ** p < 0.01; *** p < 0.001.
Table 4. Deformities (% of total fish observed) of red gilthead seabream after 45 days of Lr pre-growing.
DF3DF22Significance Level (p)
Normal80.8 ± 2.1272.5 ± 4.54ns
Not-normal19.2 ± 2.1227.5 ± 4.54ns
  Gill operculum9.7 ± 1.576.2 ± 1.54ns
  Fin malformation2.5 ± 0.843.6 ± 1.56ns
  Jaw malformation0.9 ± 0.381.4 ± 0.44ns
  Spinal cord malformation3.8 ± 0.63 a11.7 ± 1.42 b***
Note: Values are means of pentaplicated groups ± SEM. Means with different letters in the same row are significantly different. ns, not significant; *** p < 0.001.
Disclaimer/Publisher’s Note: The statements, opinions and data contained in all publications are solely those of the individual author(s) and contributor(s) and not of MDPI and/or the editor(s). MDPI and/or the editor(s) disclaim responsibility for any injury to people or property resulting from any ideas, methods, instructions or products referred to in the content.

