
Age-Based Demography of Two Parrotfish and a Goatfish from Saipan, Northern Mariana Islands

Abstract
1. Introduction
2. Materials and Methods
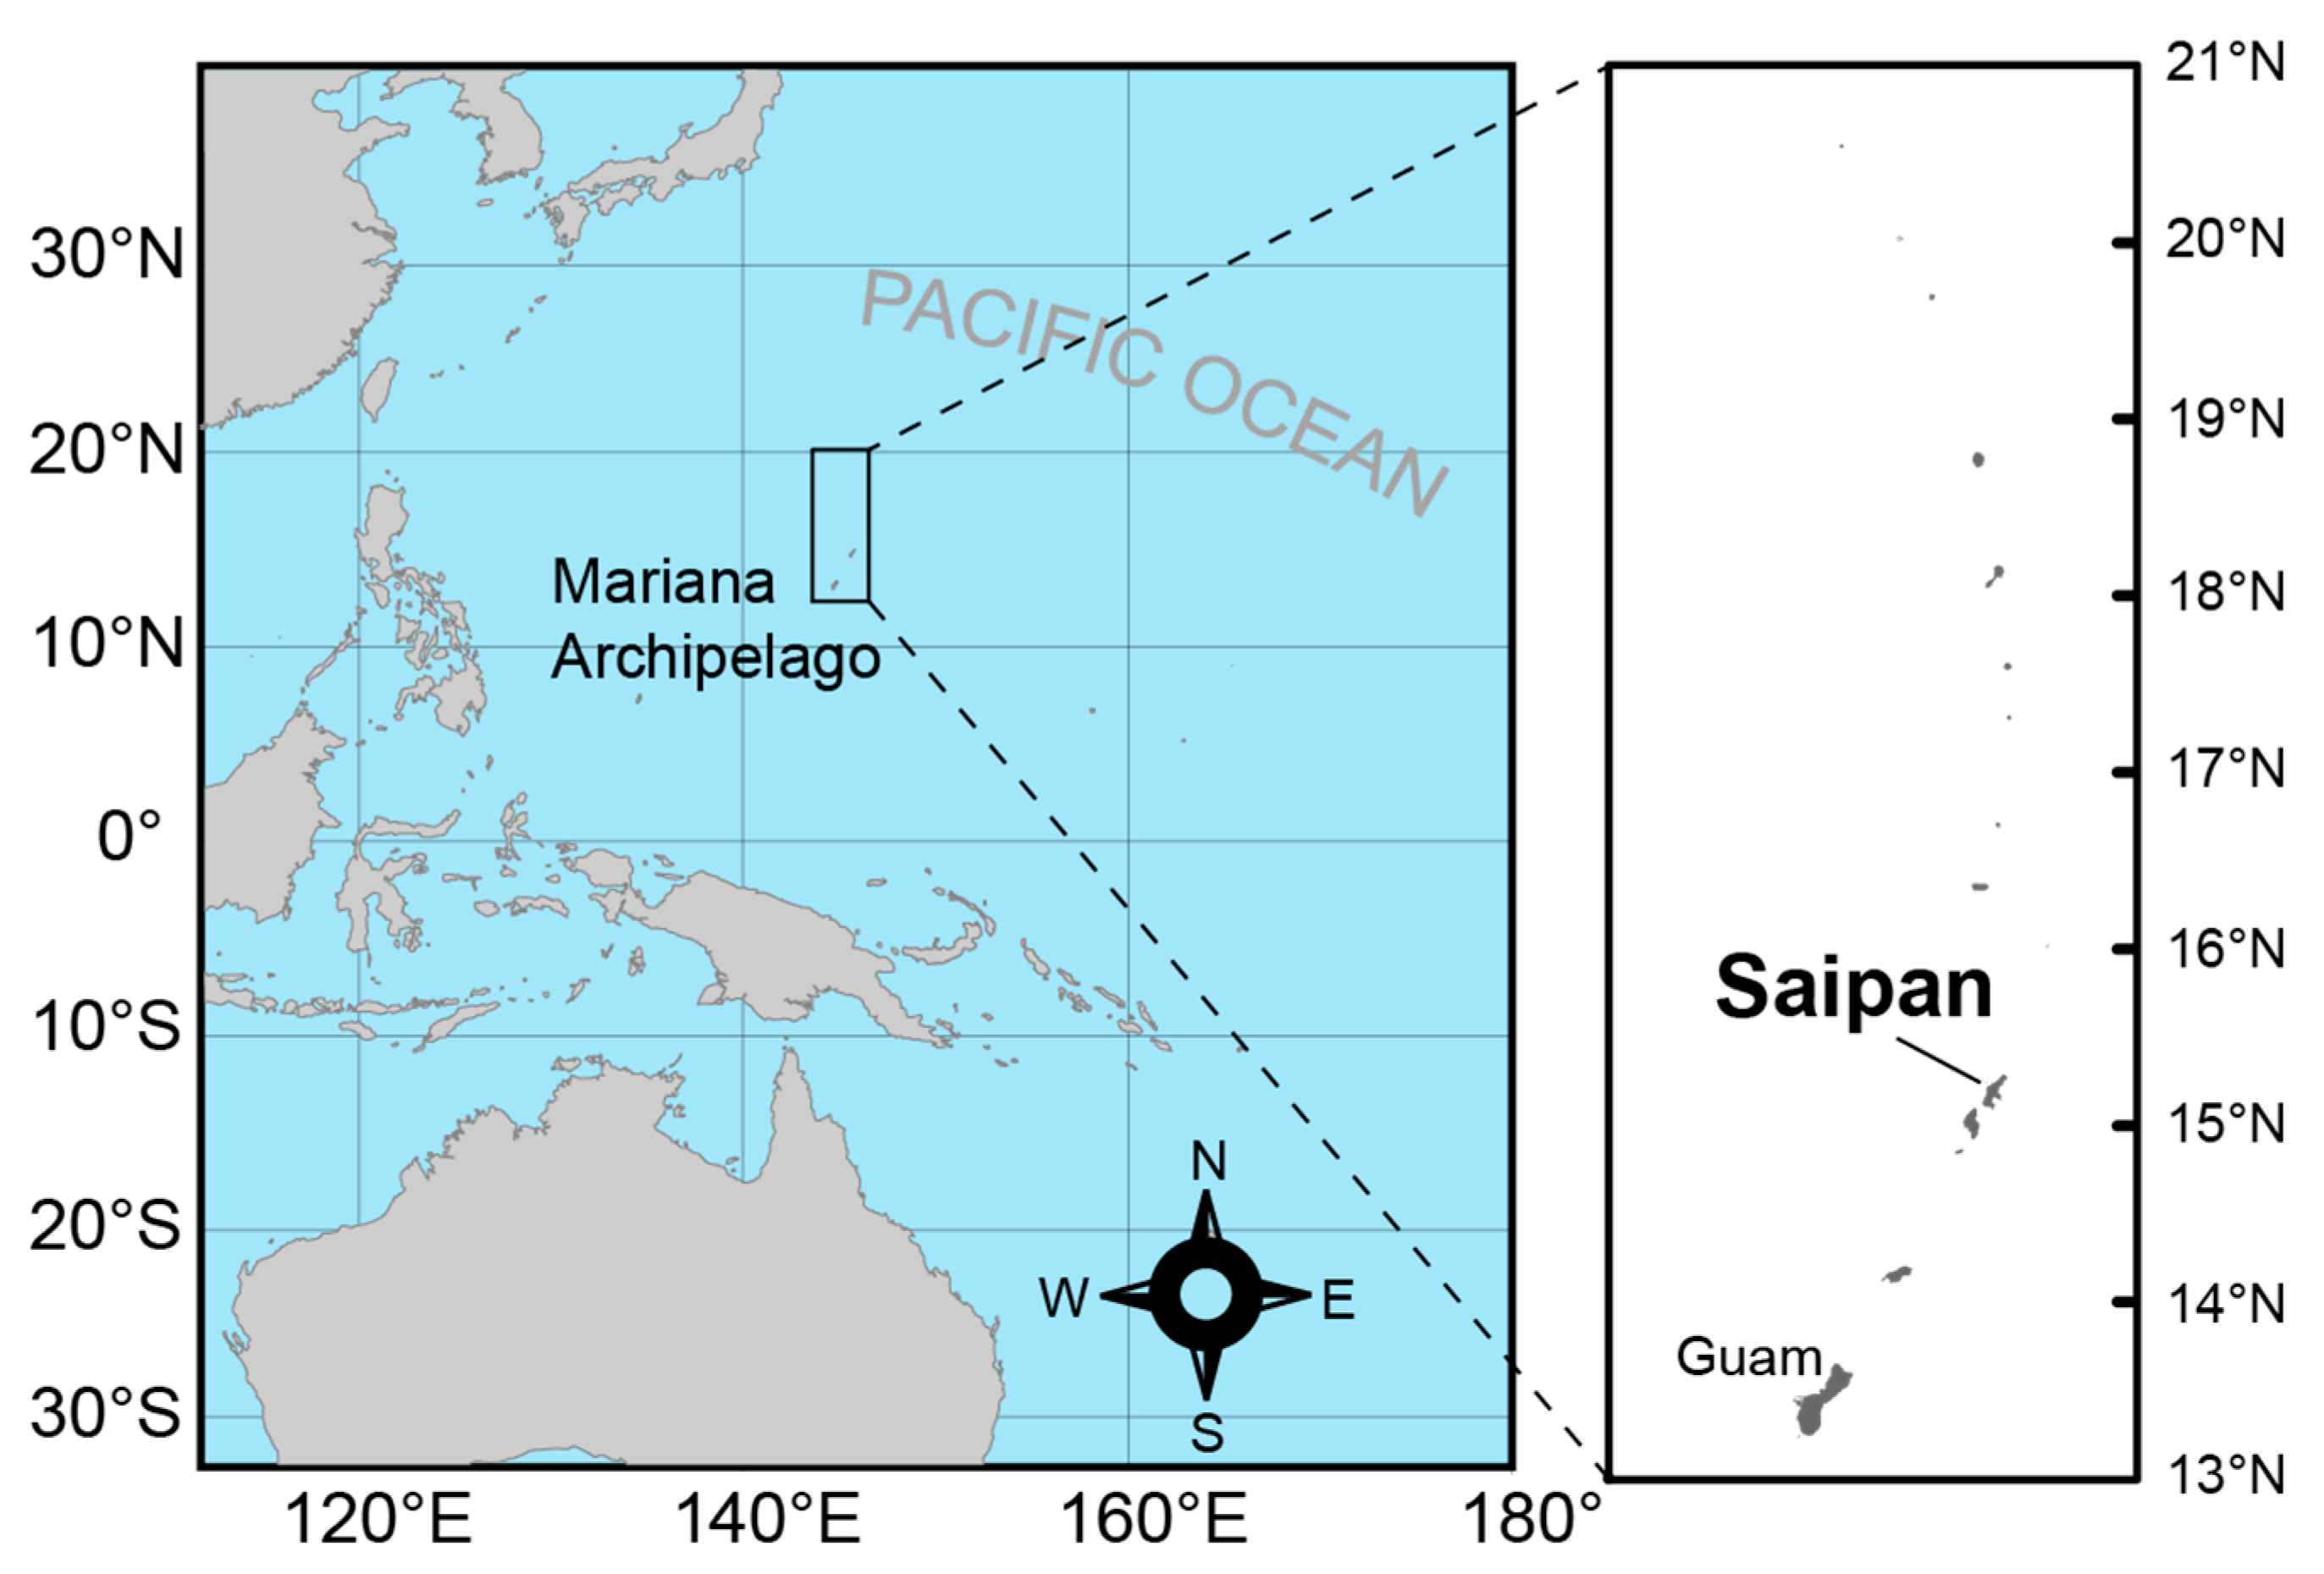
2.1. Study Site and Sampling
2.2. Reproduction
2.3. Age, Growth, and Mortality
3. Results
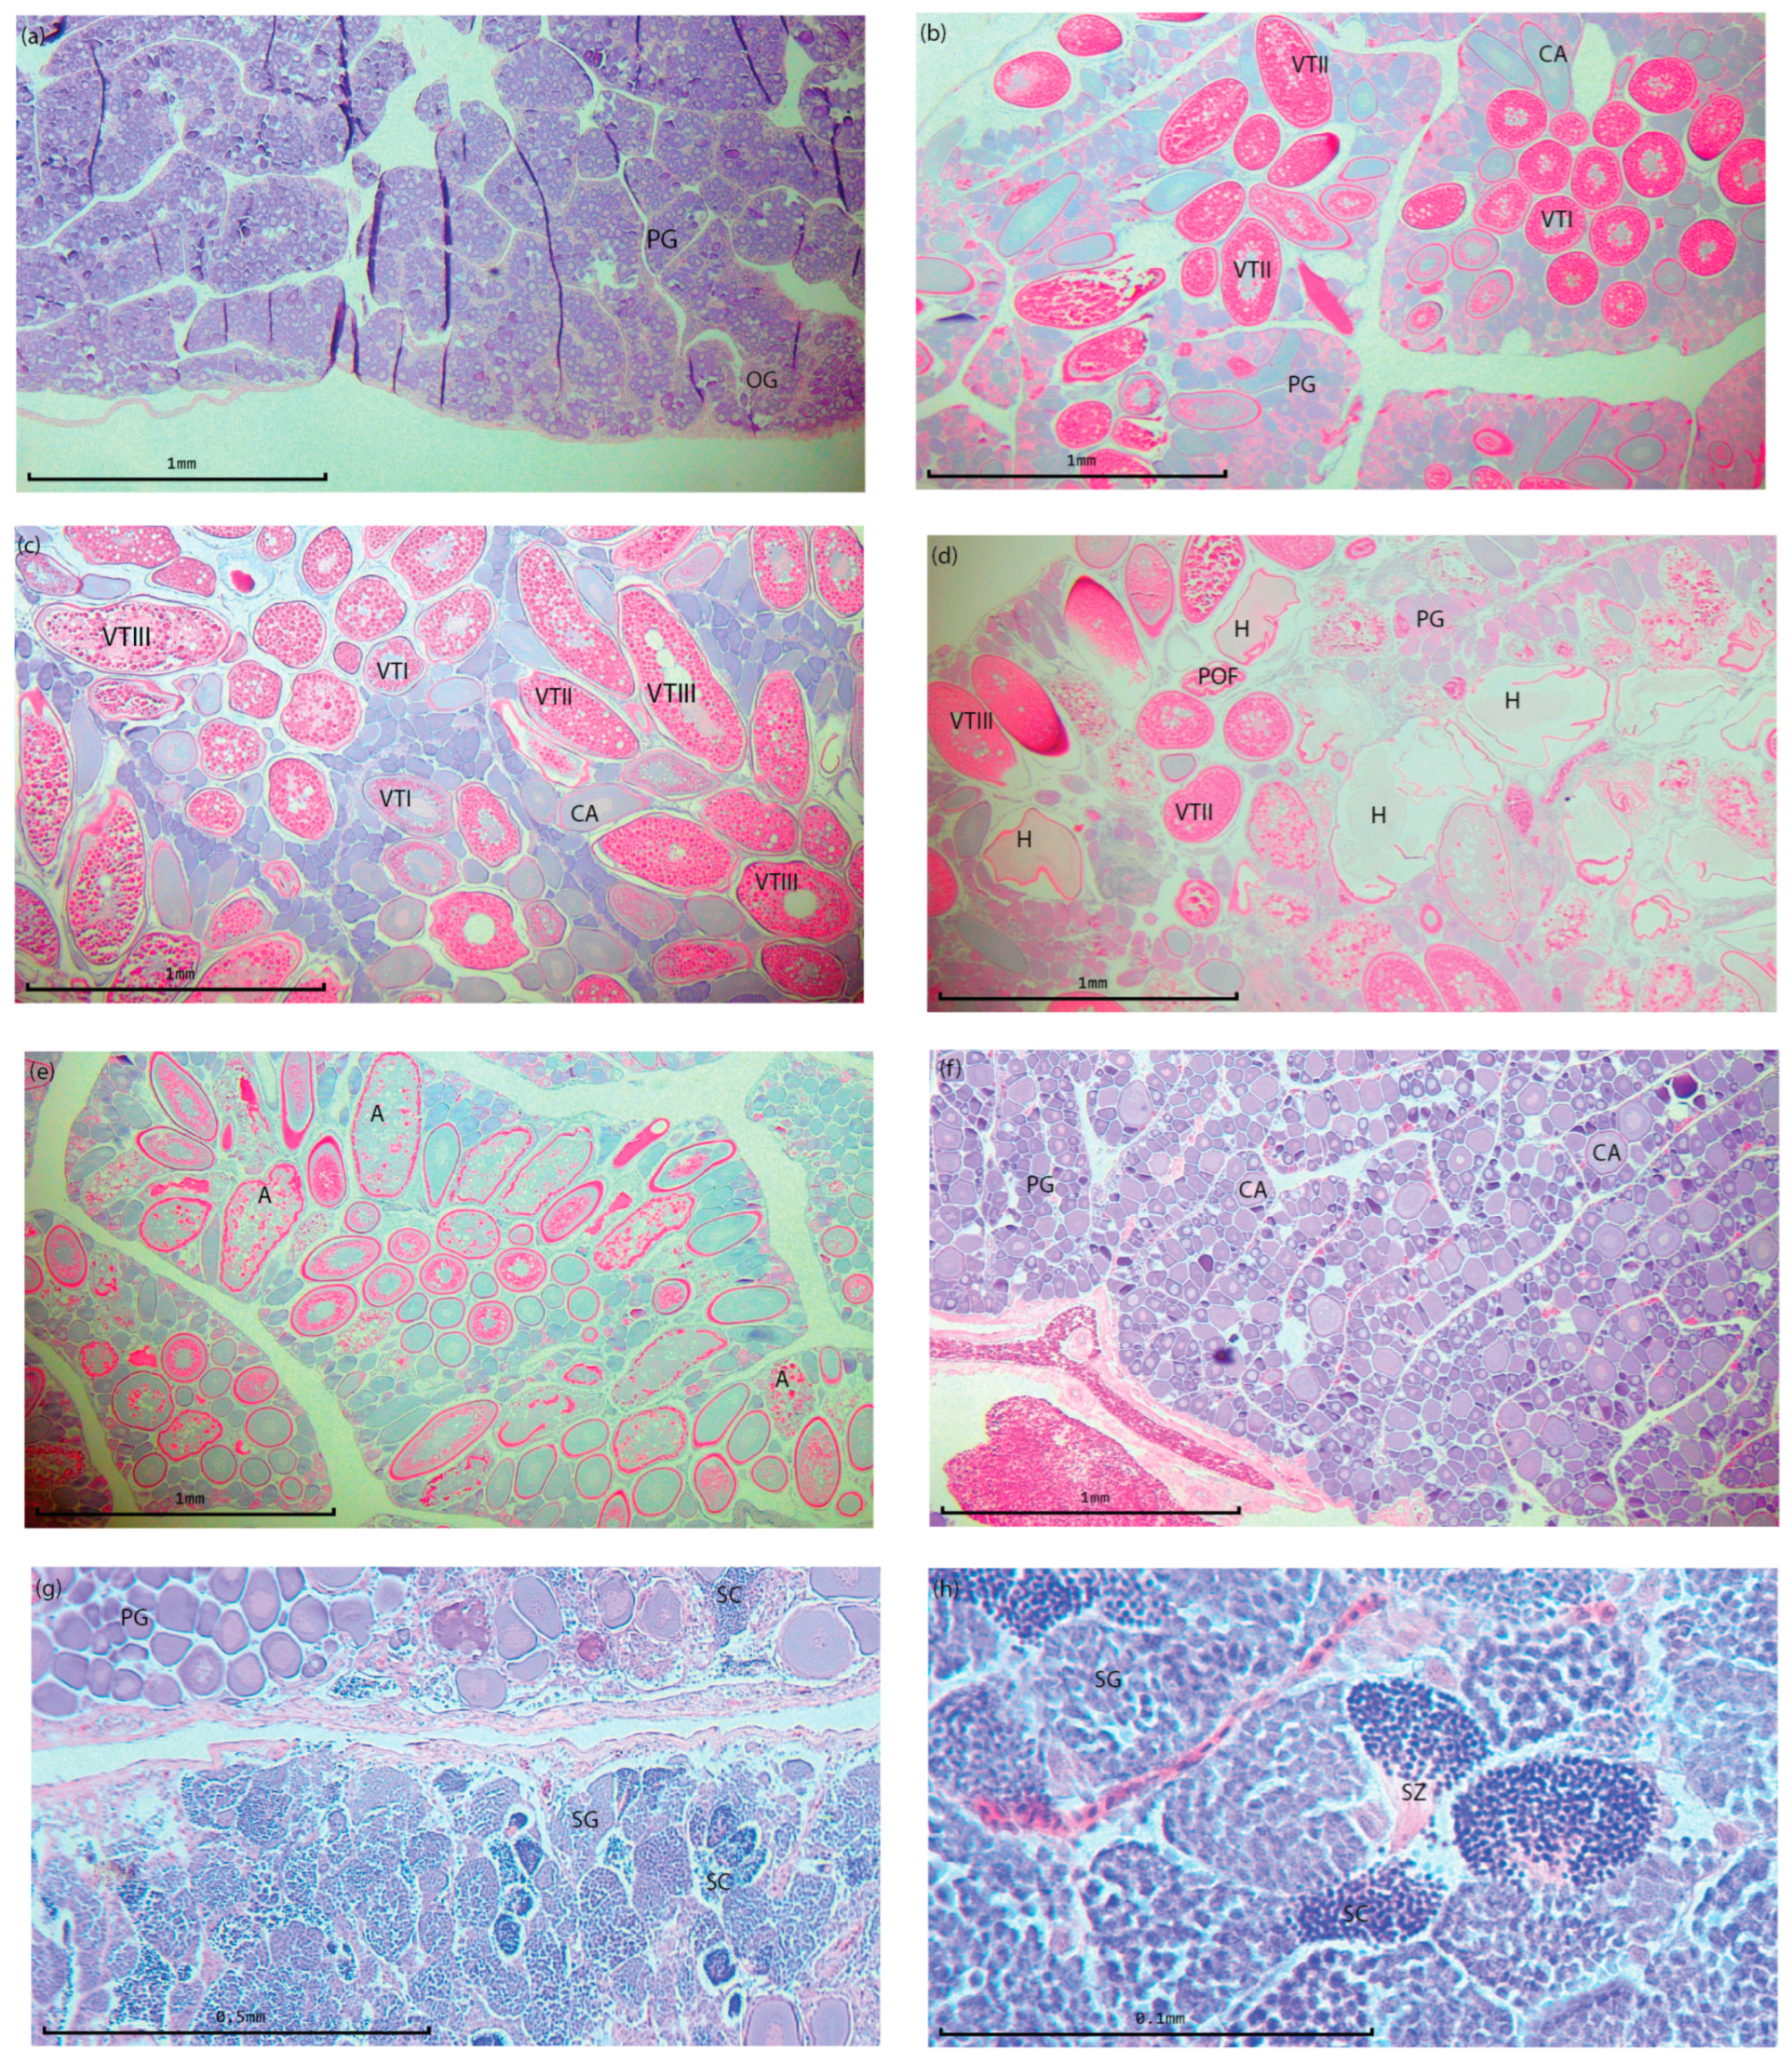
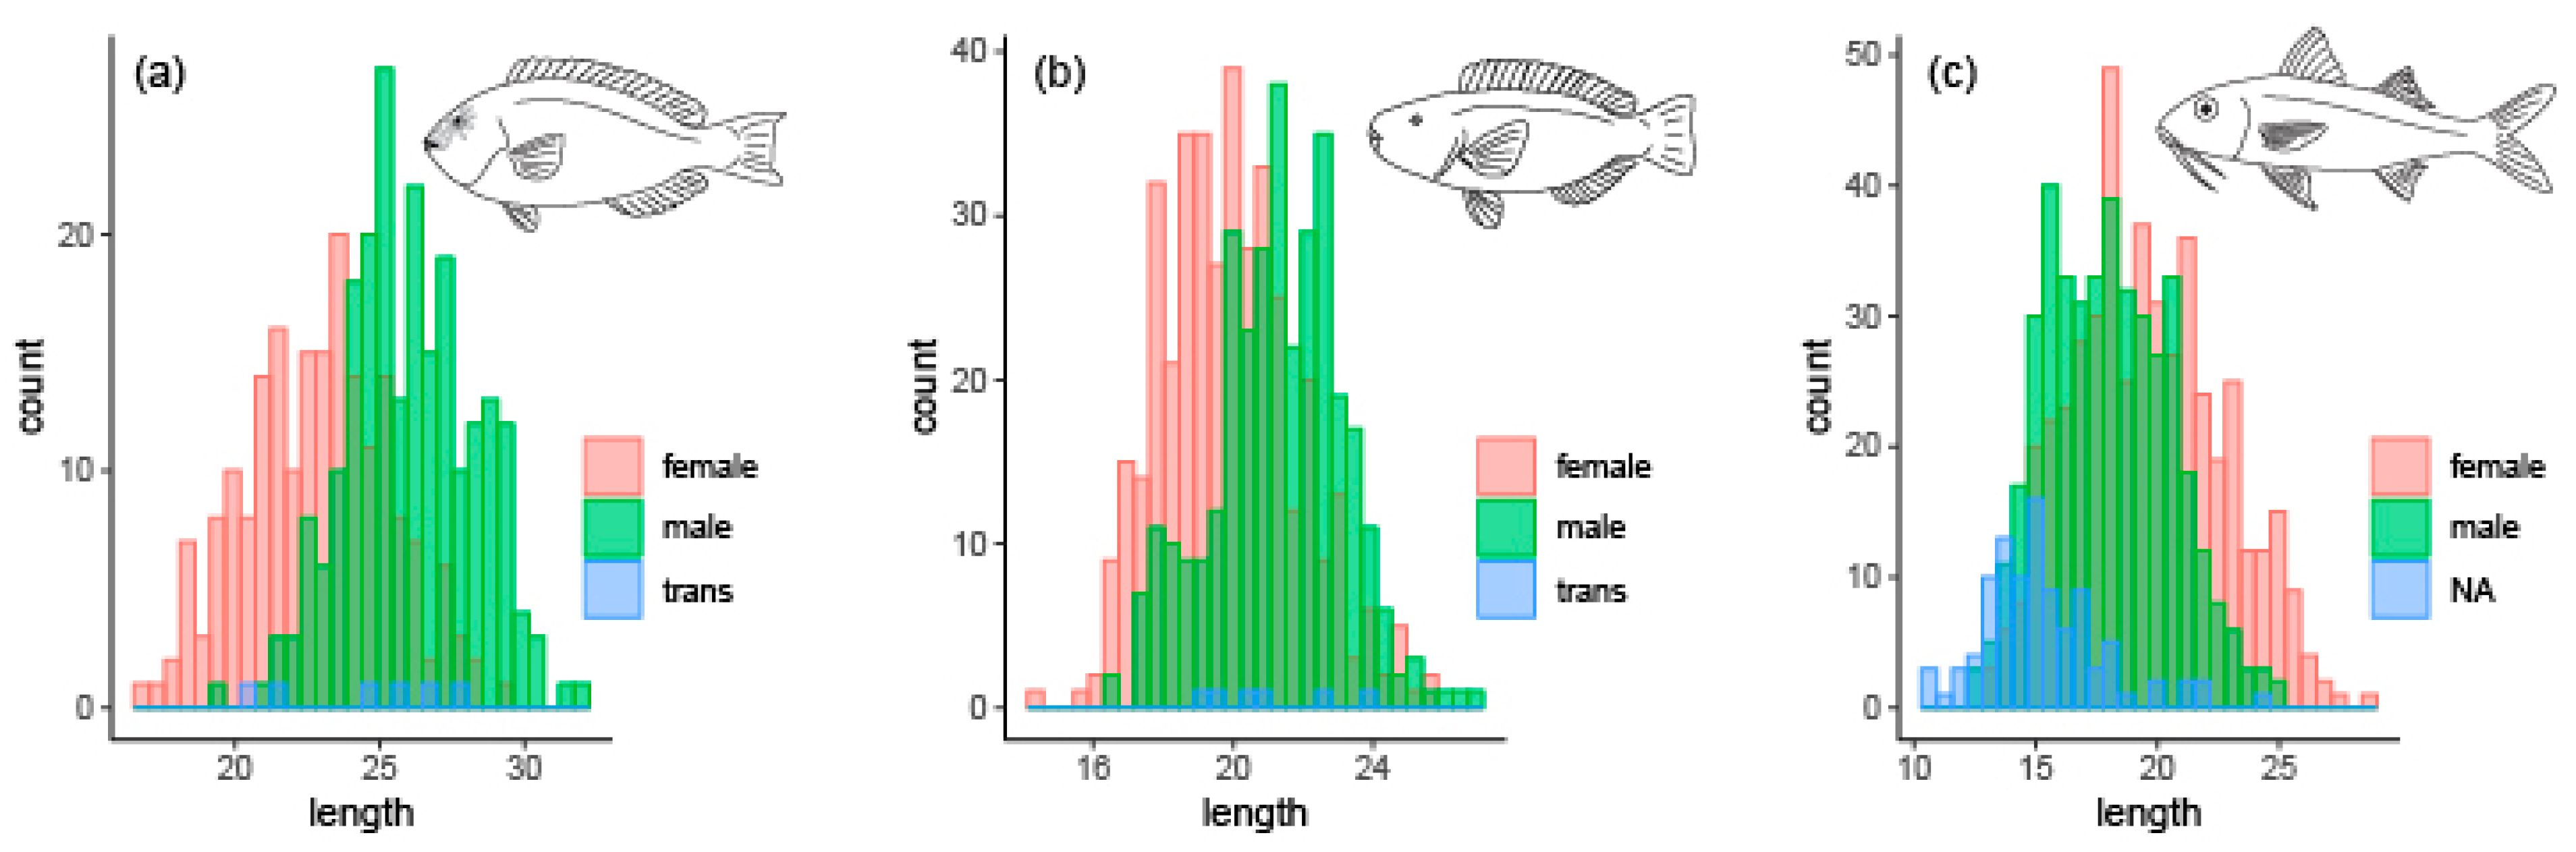
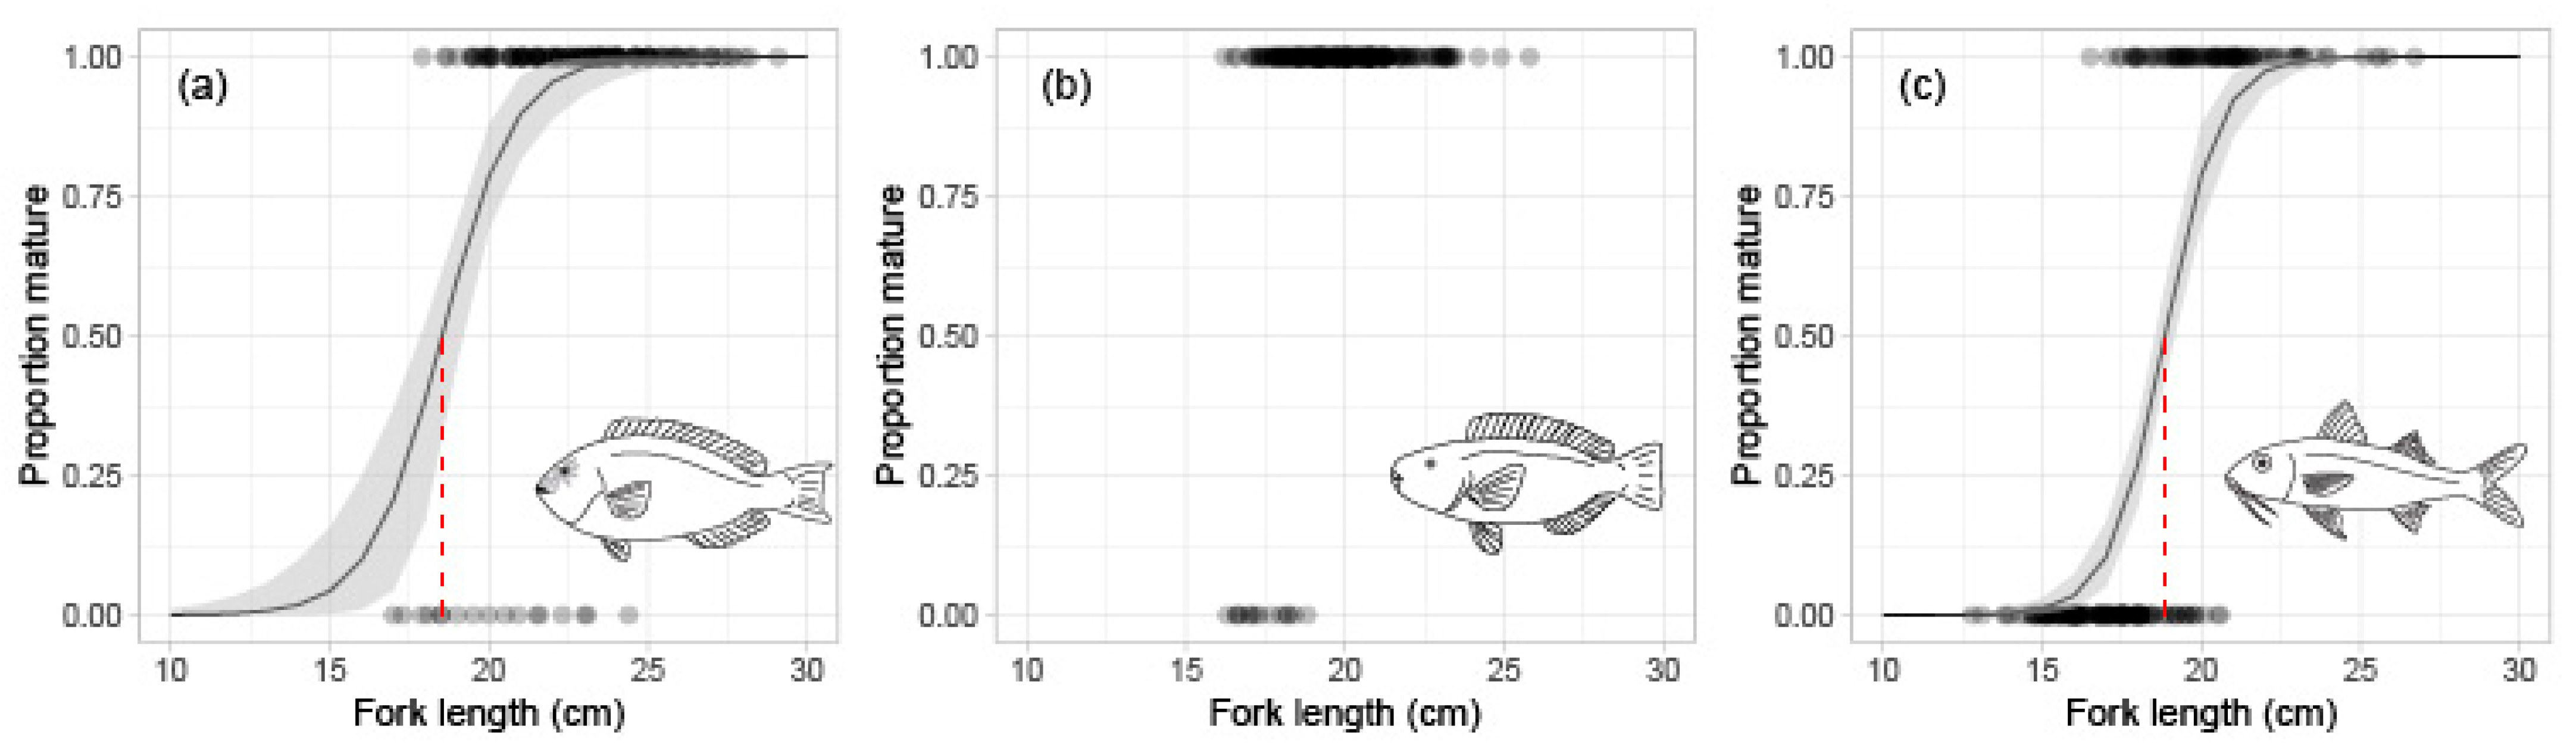
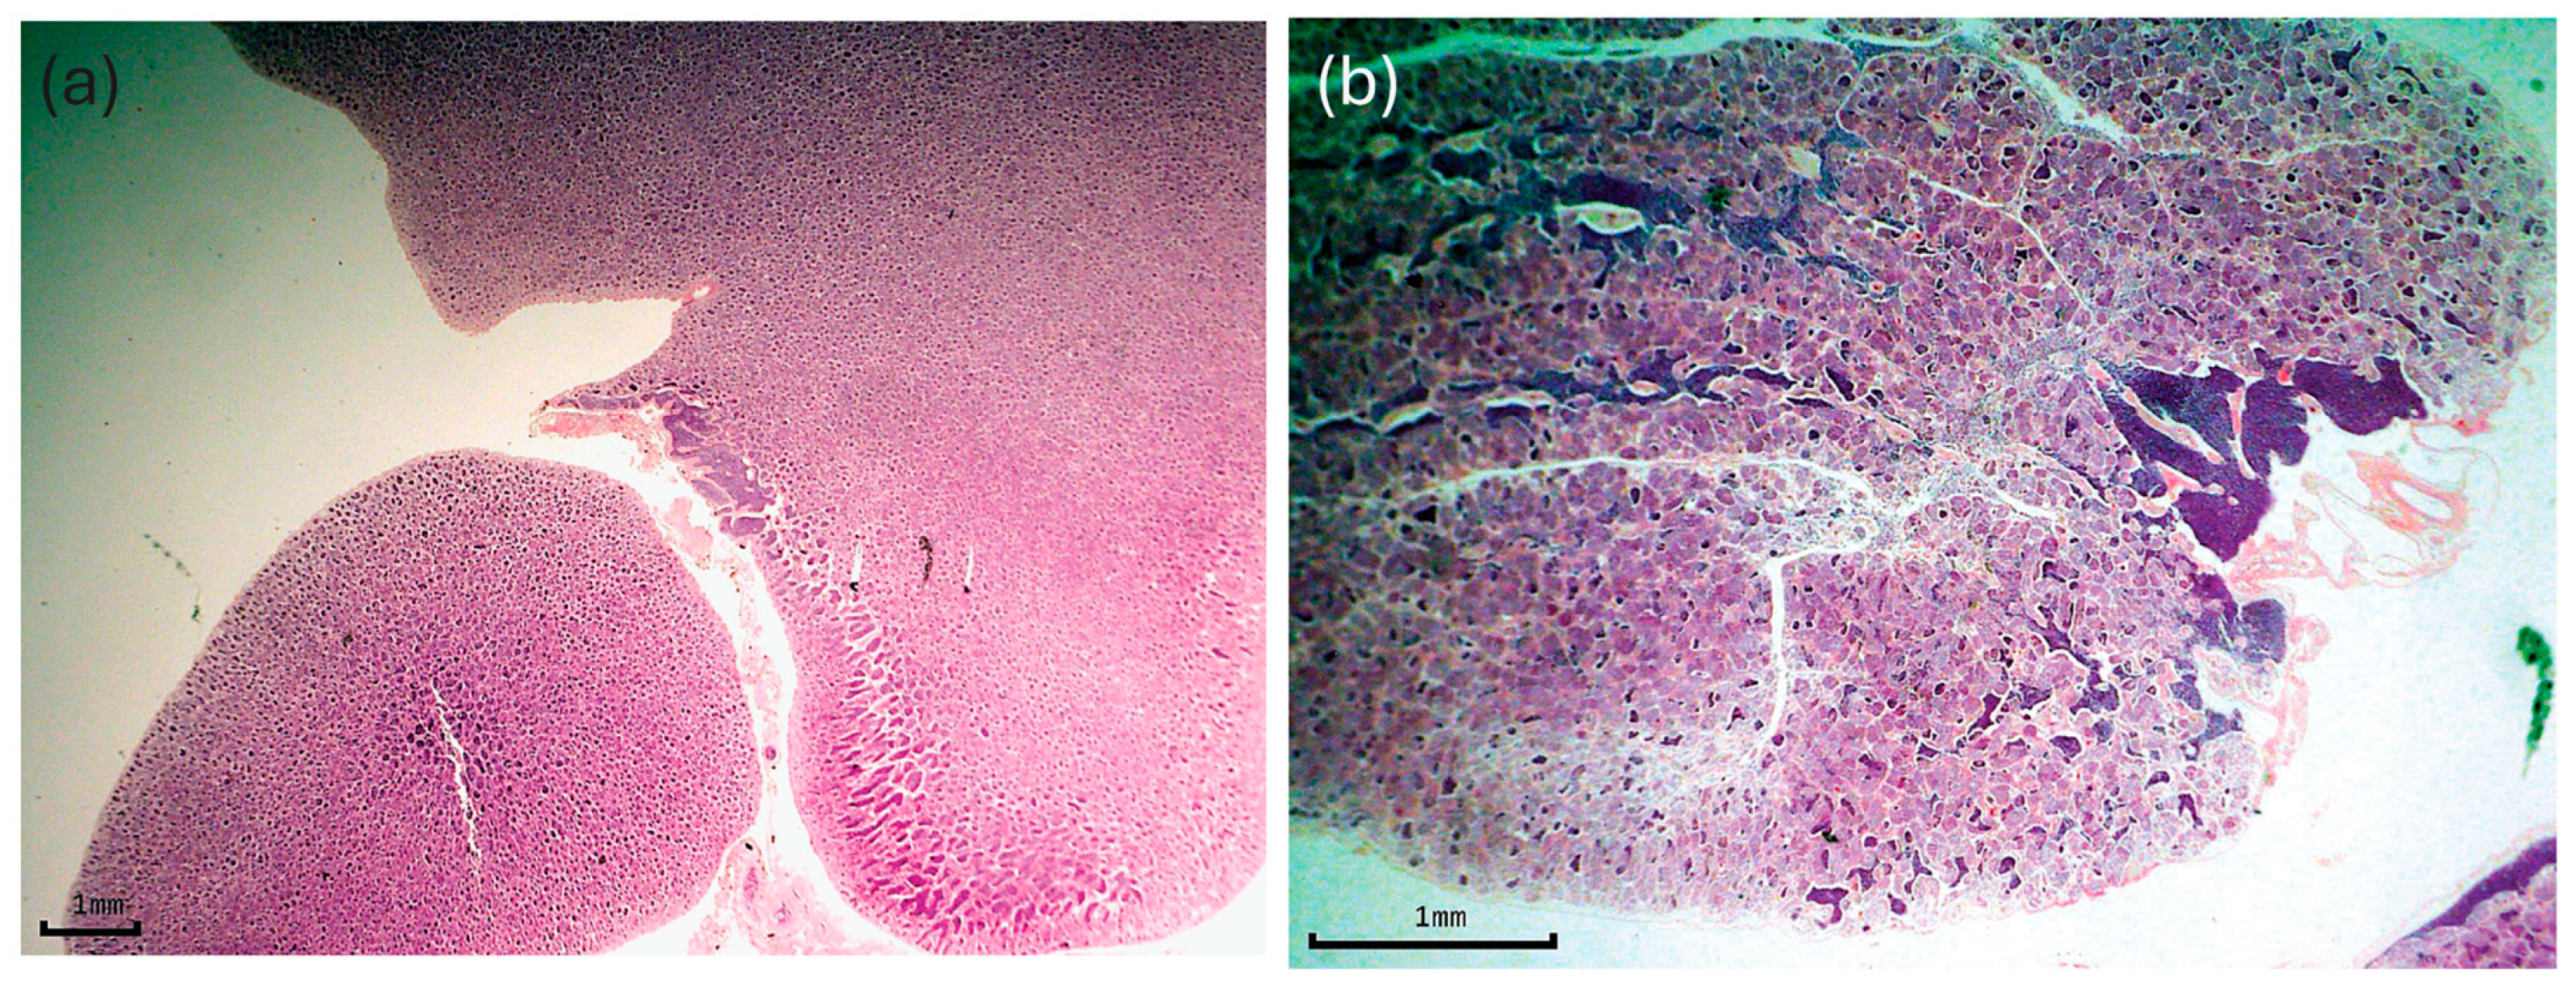
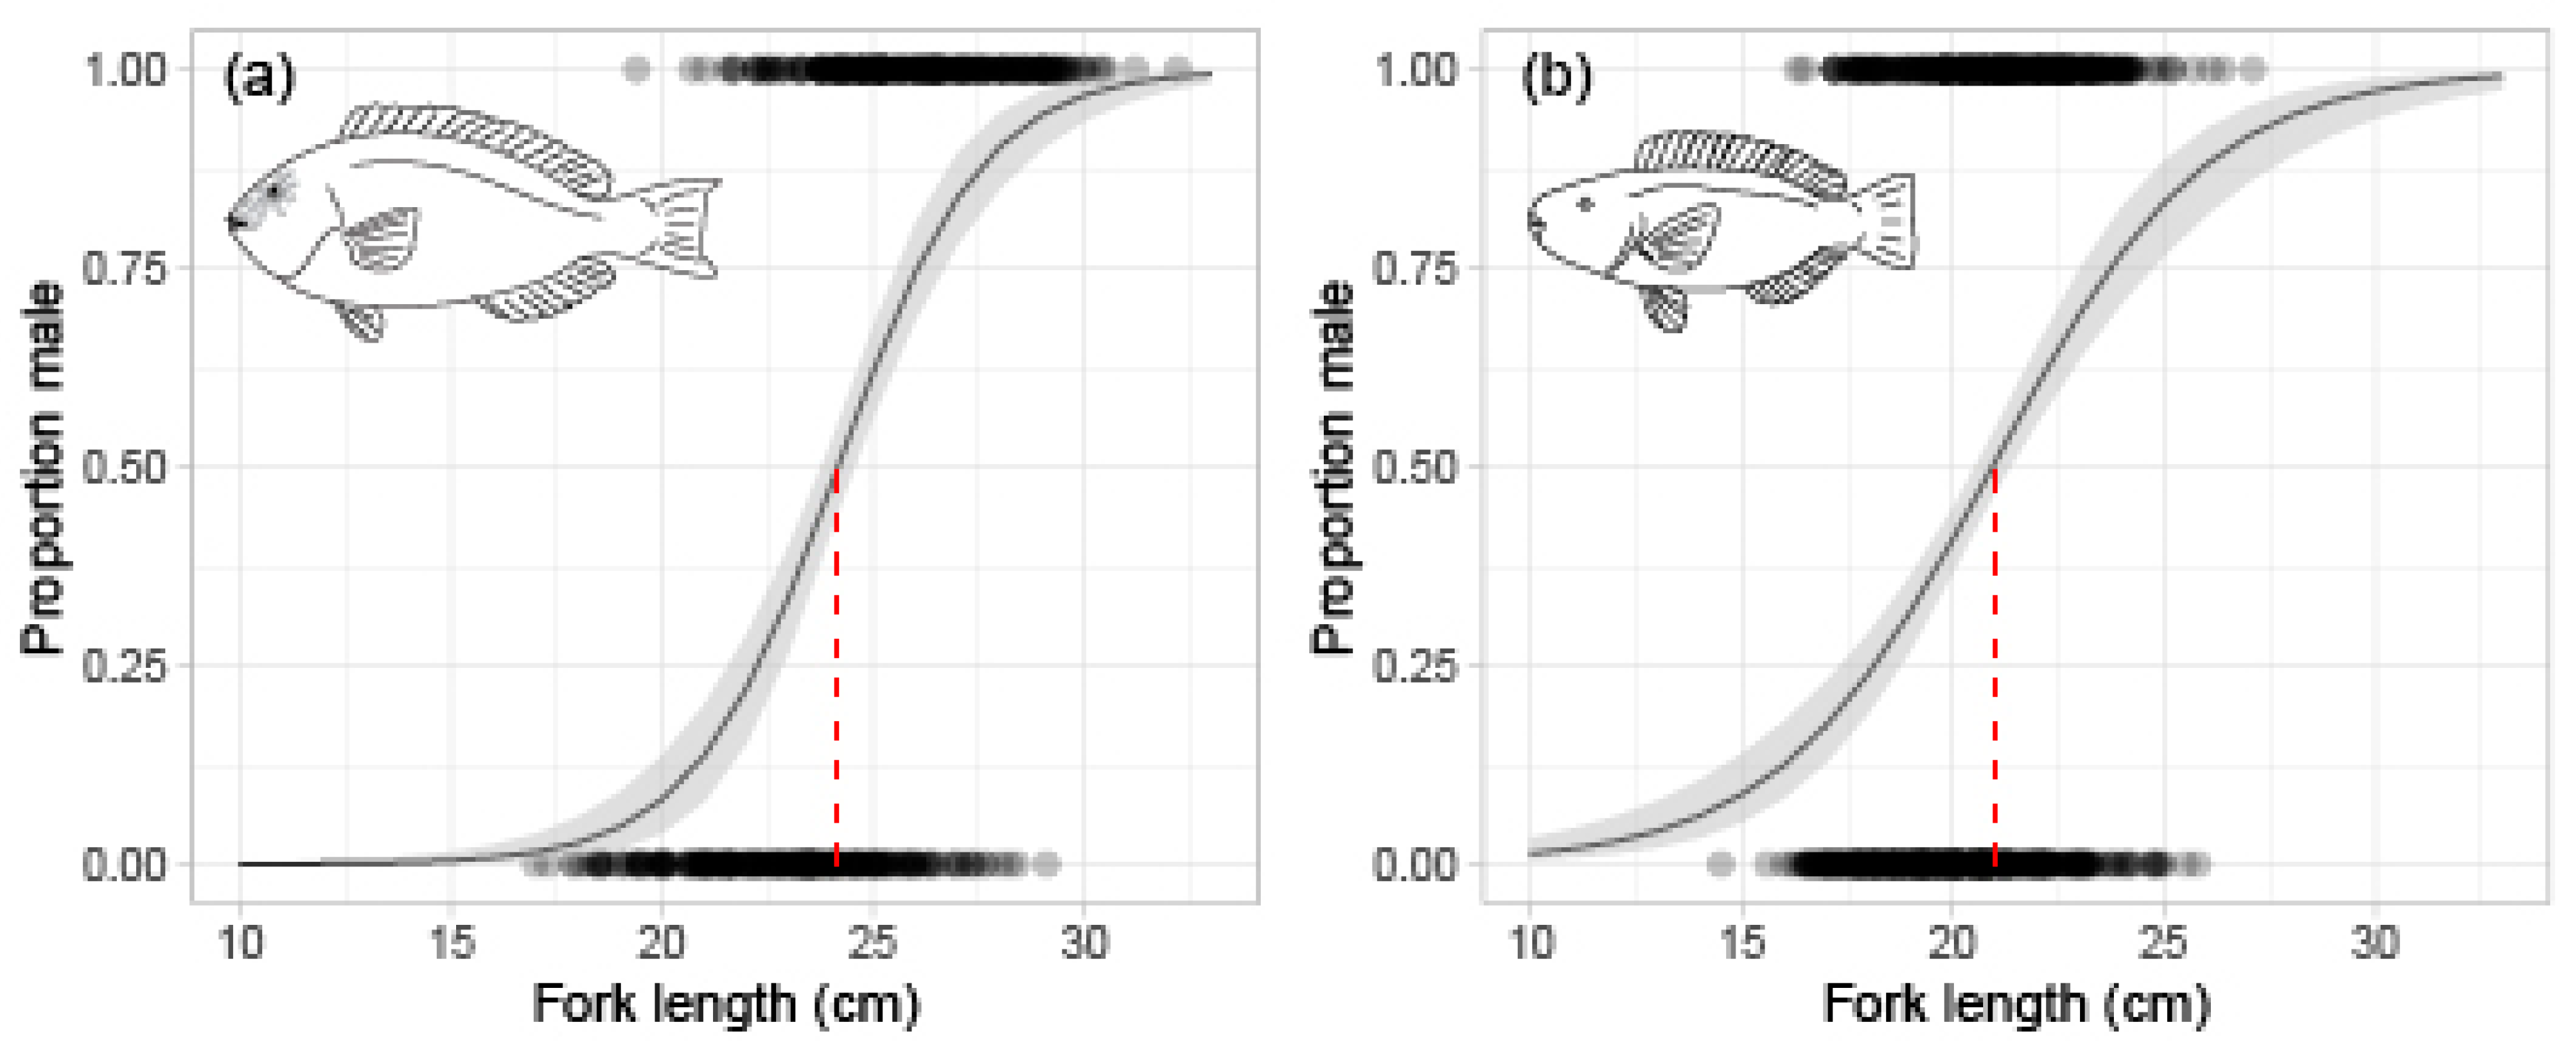
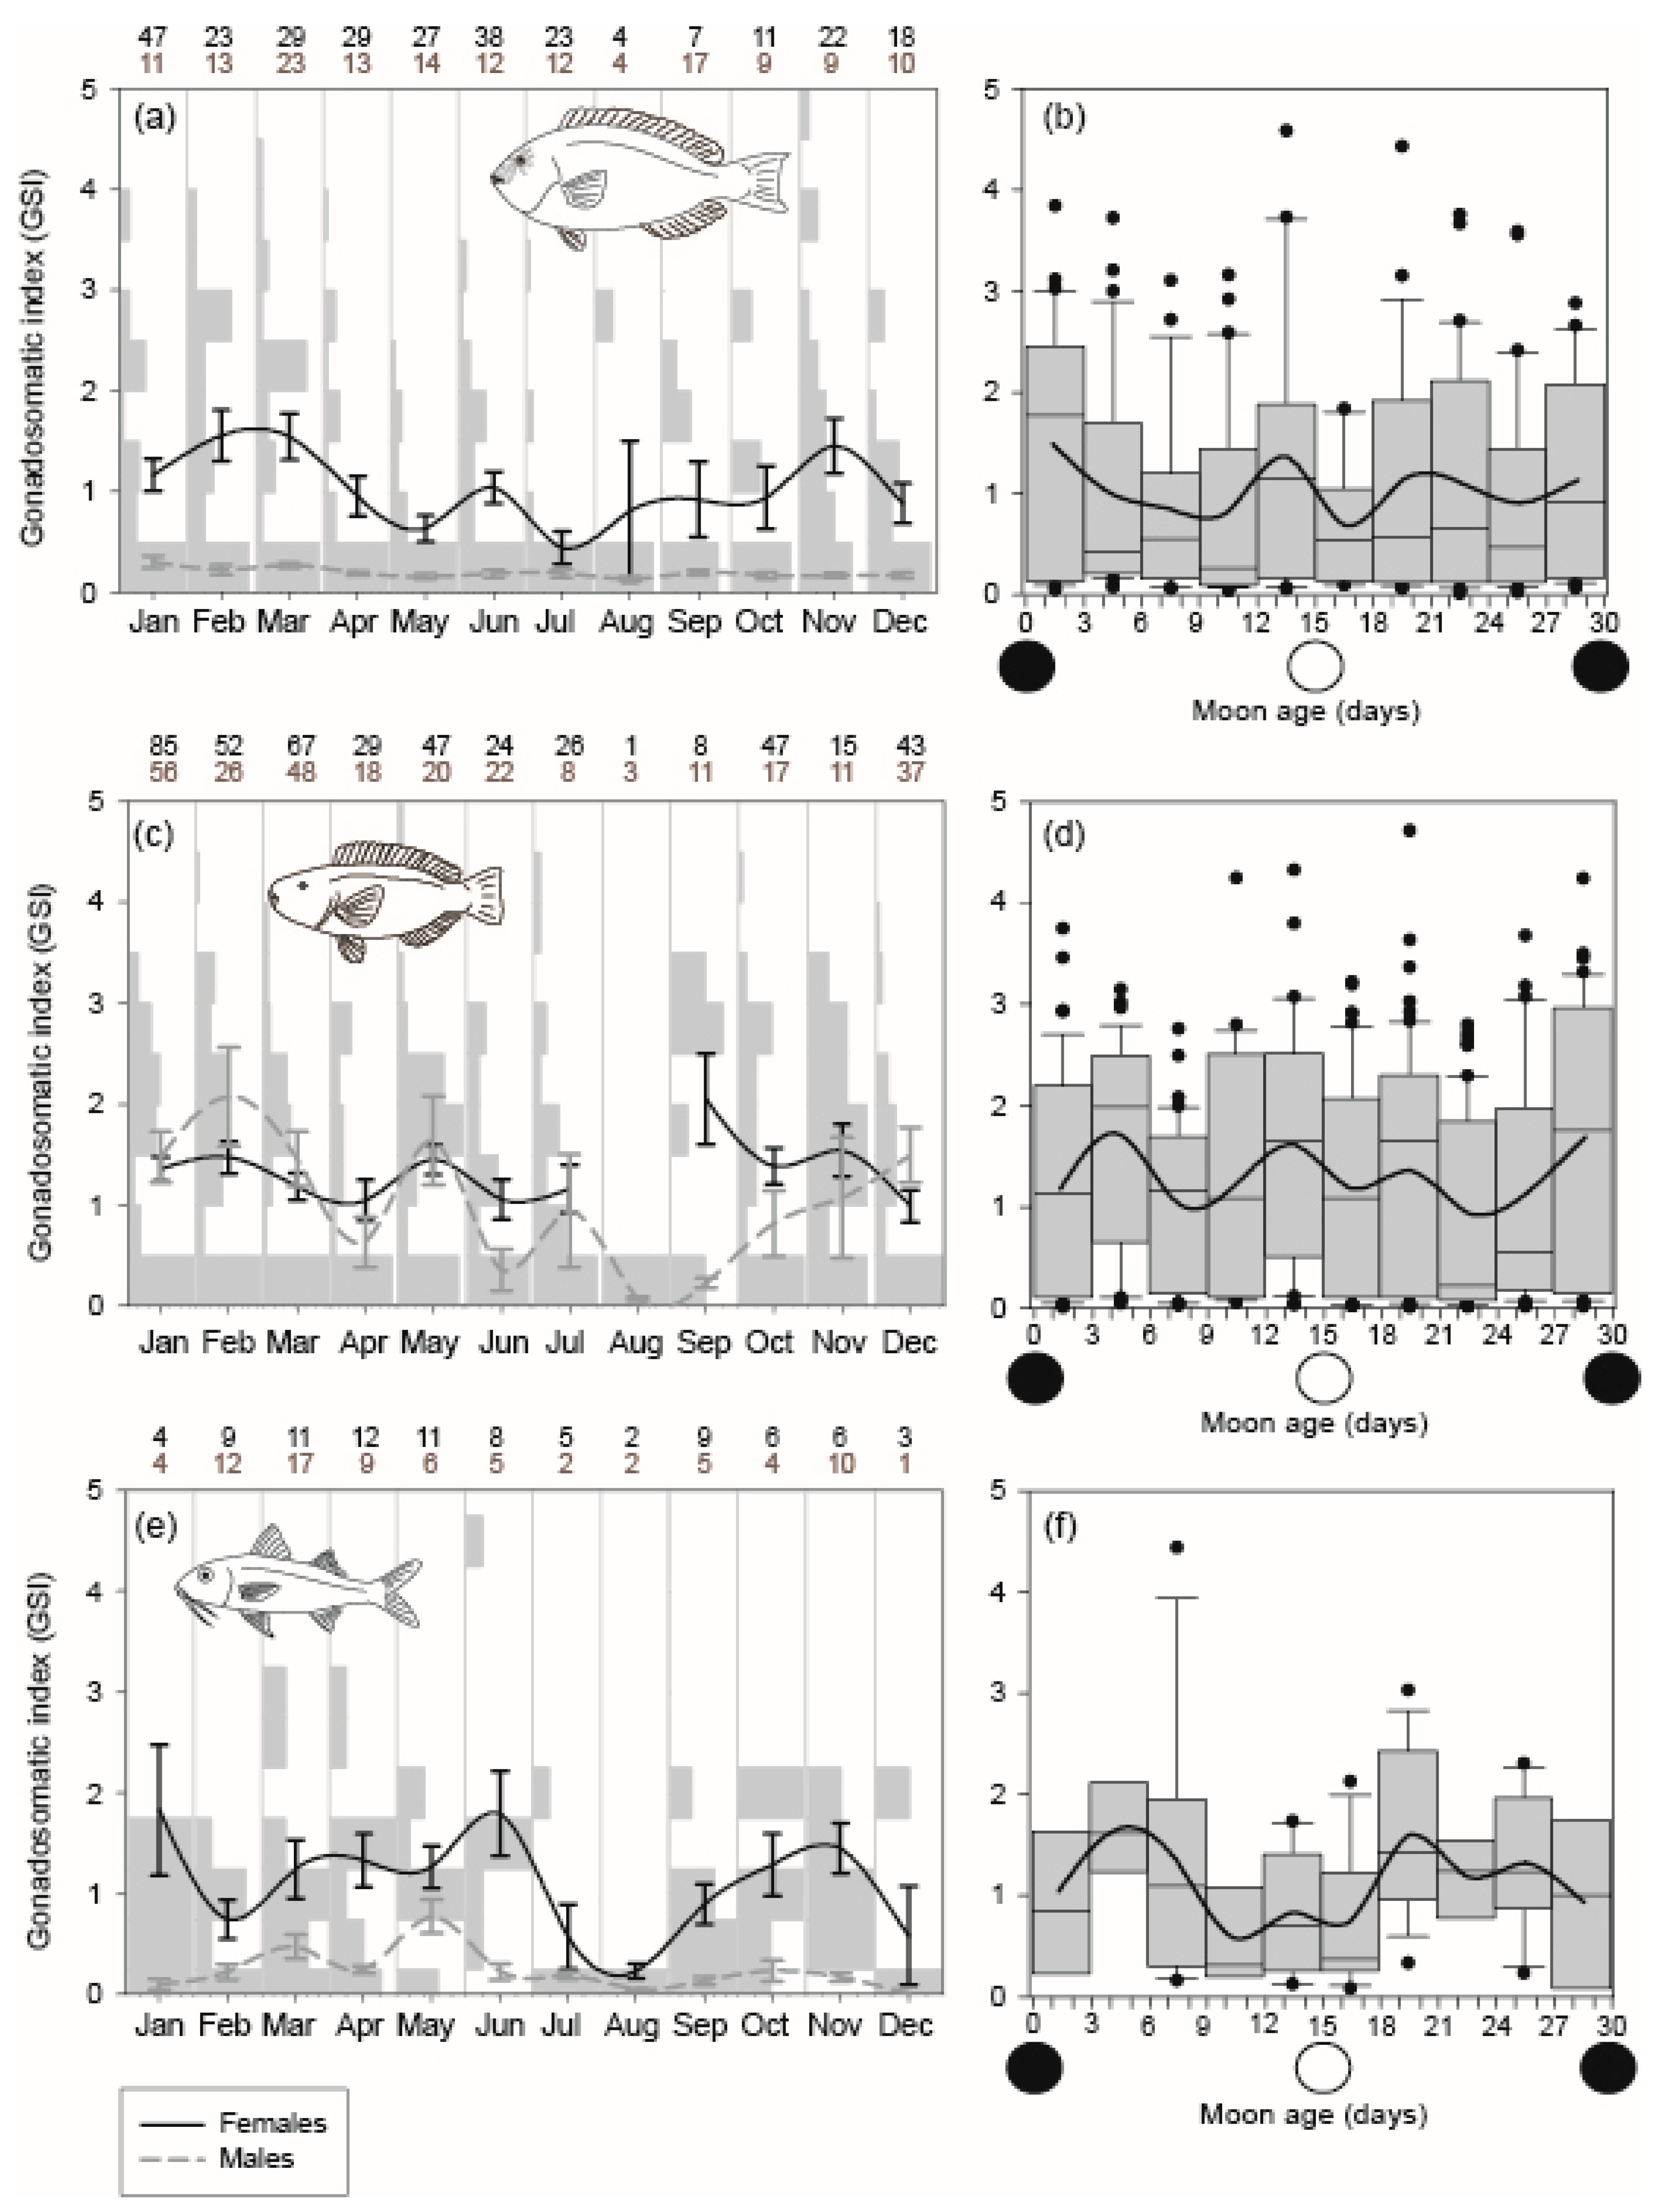
3.1. Reproduction
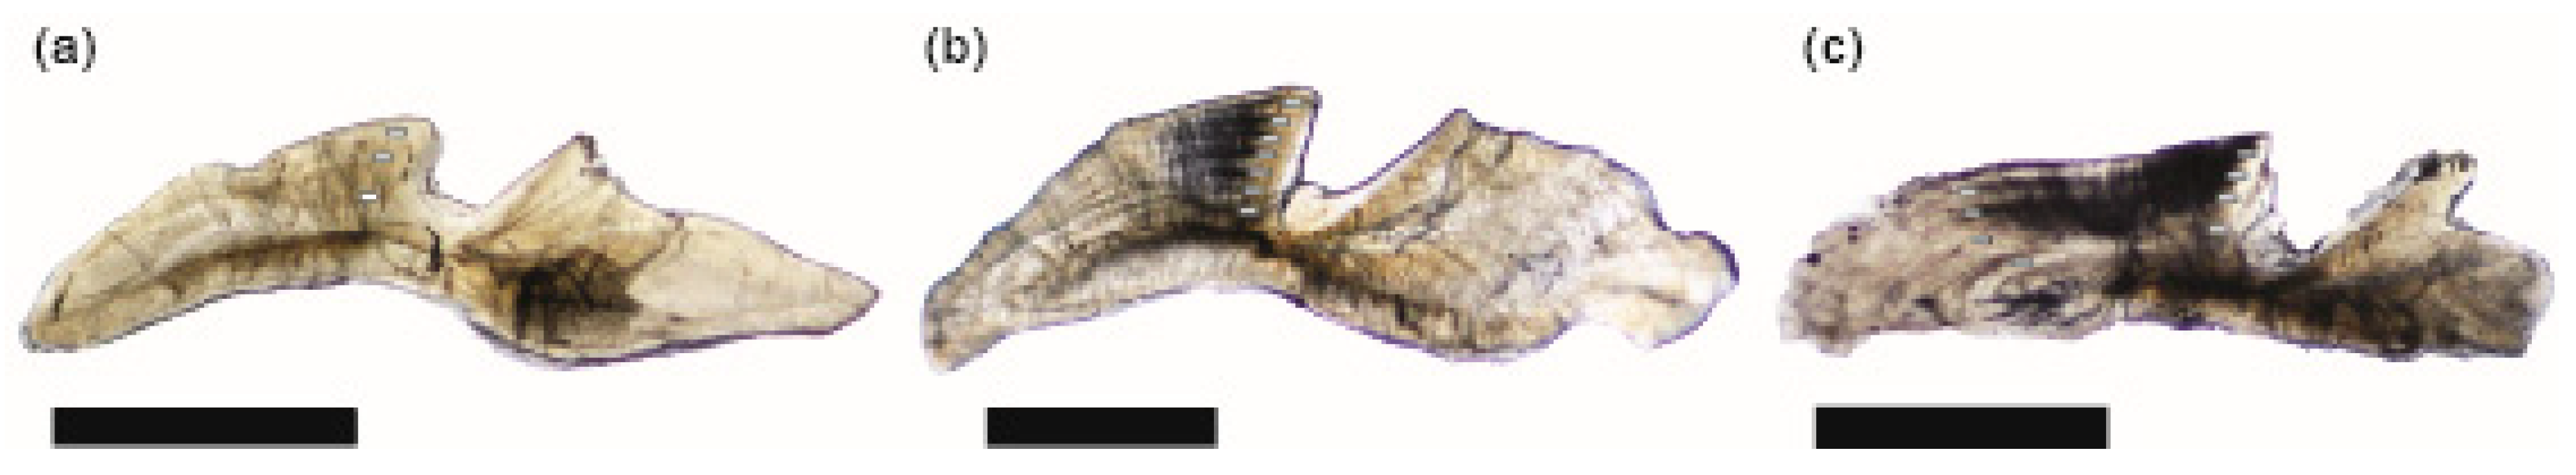
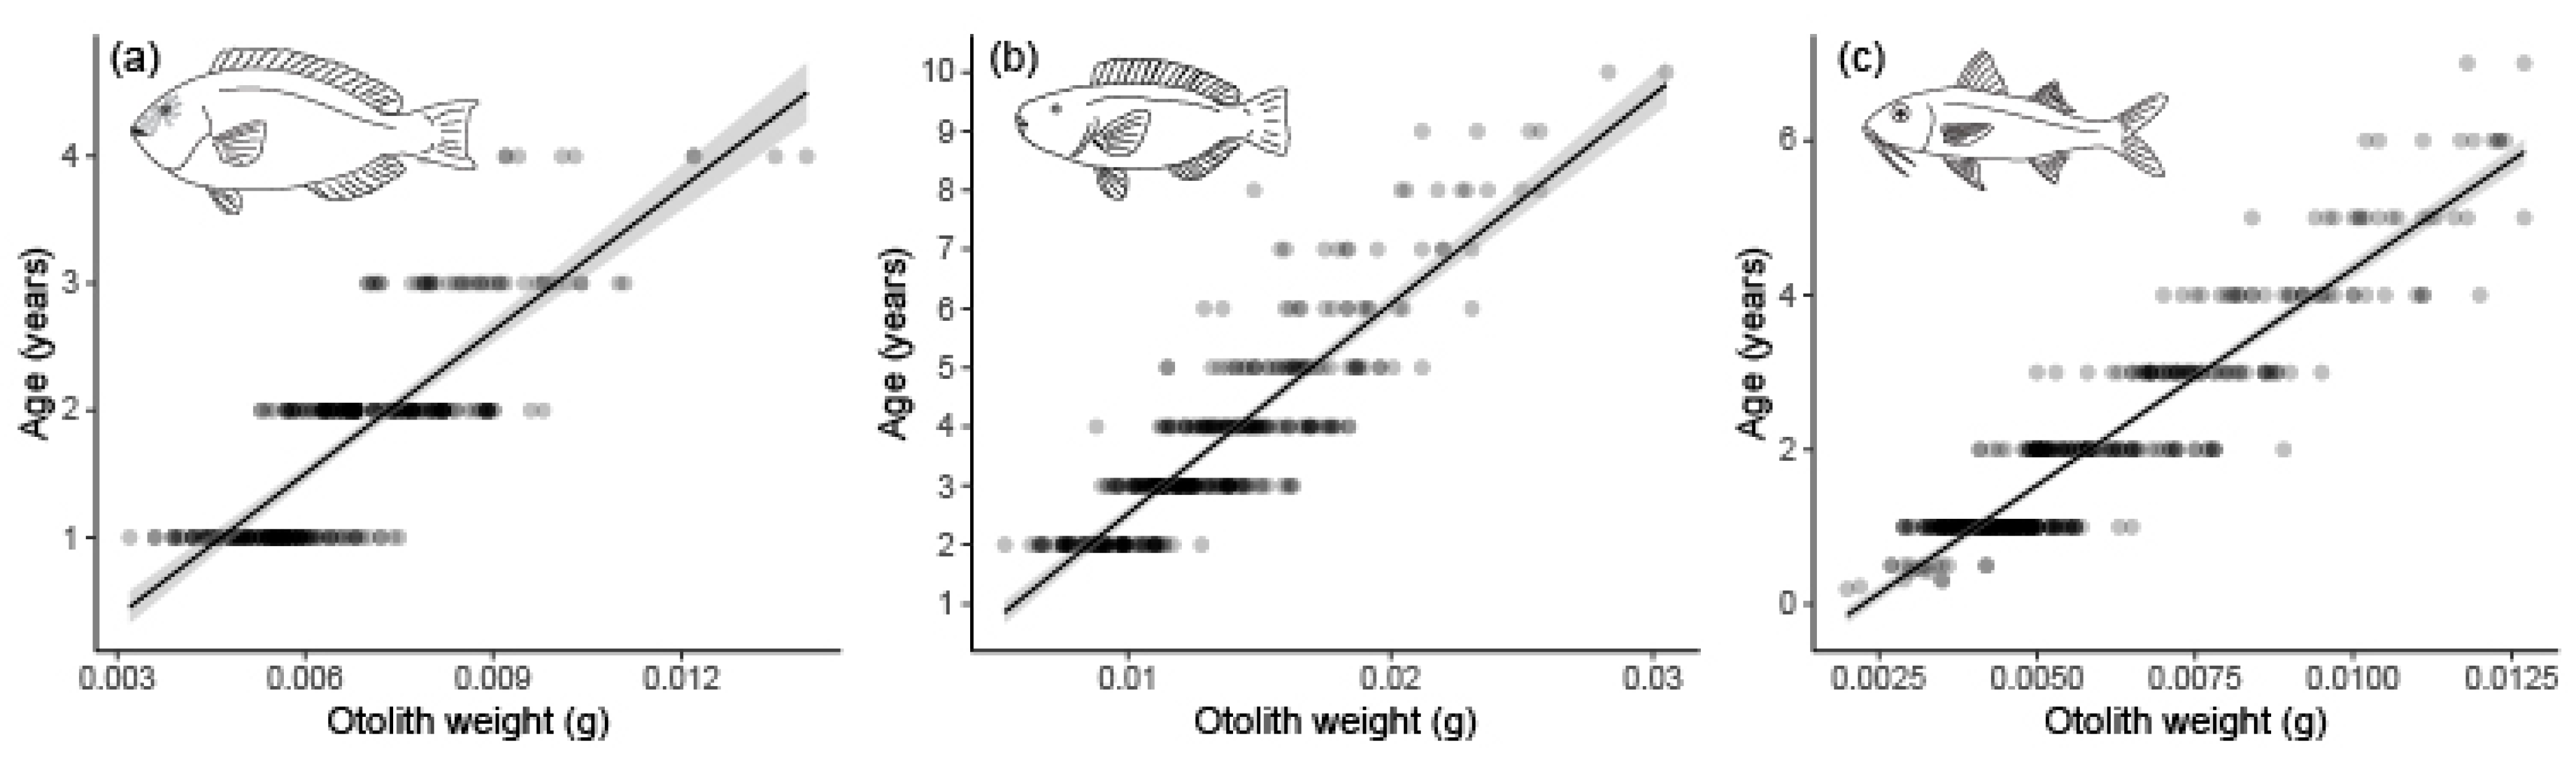
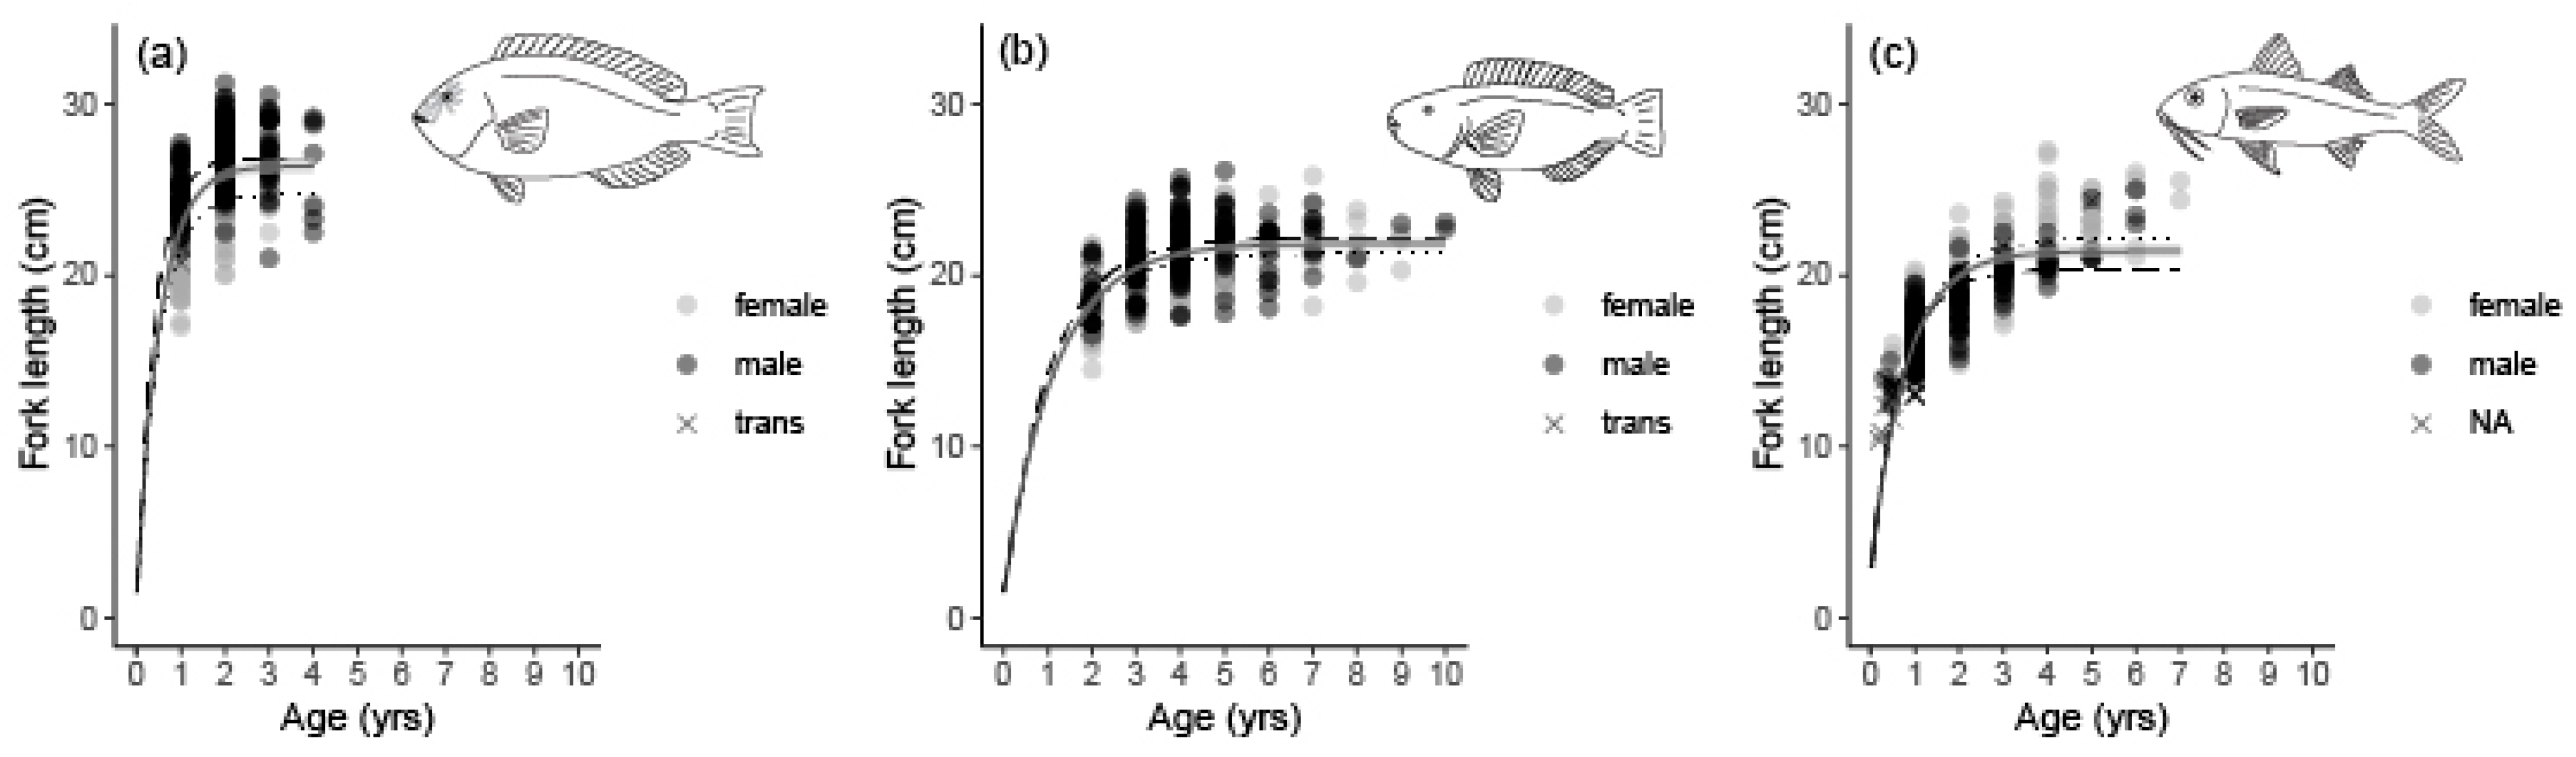
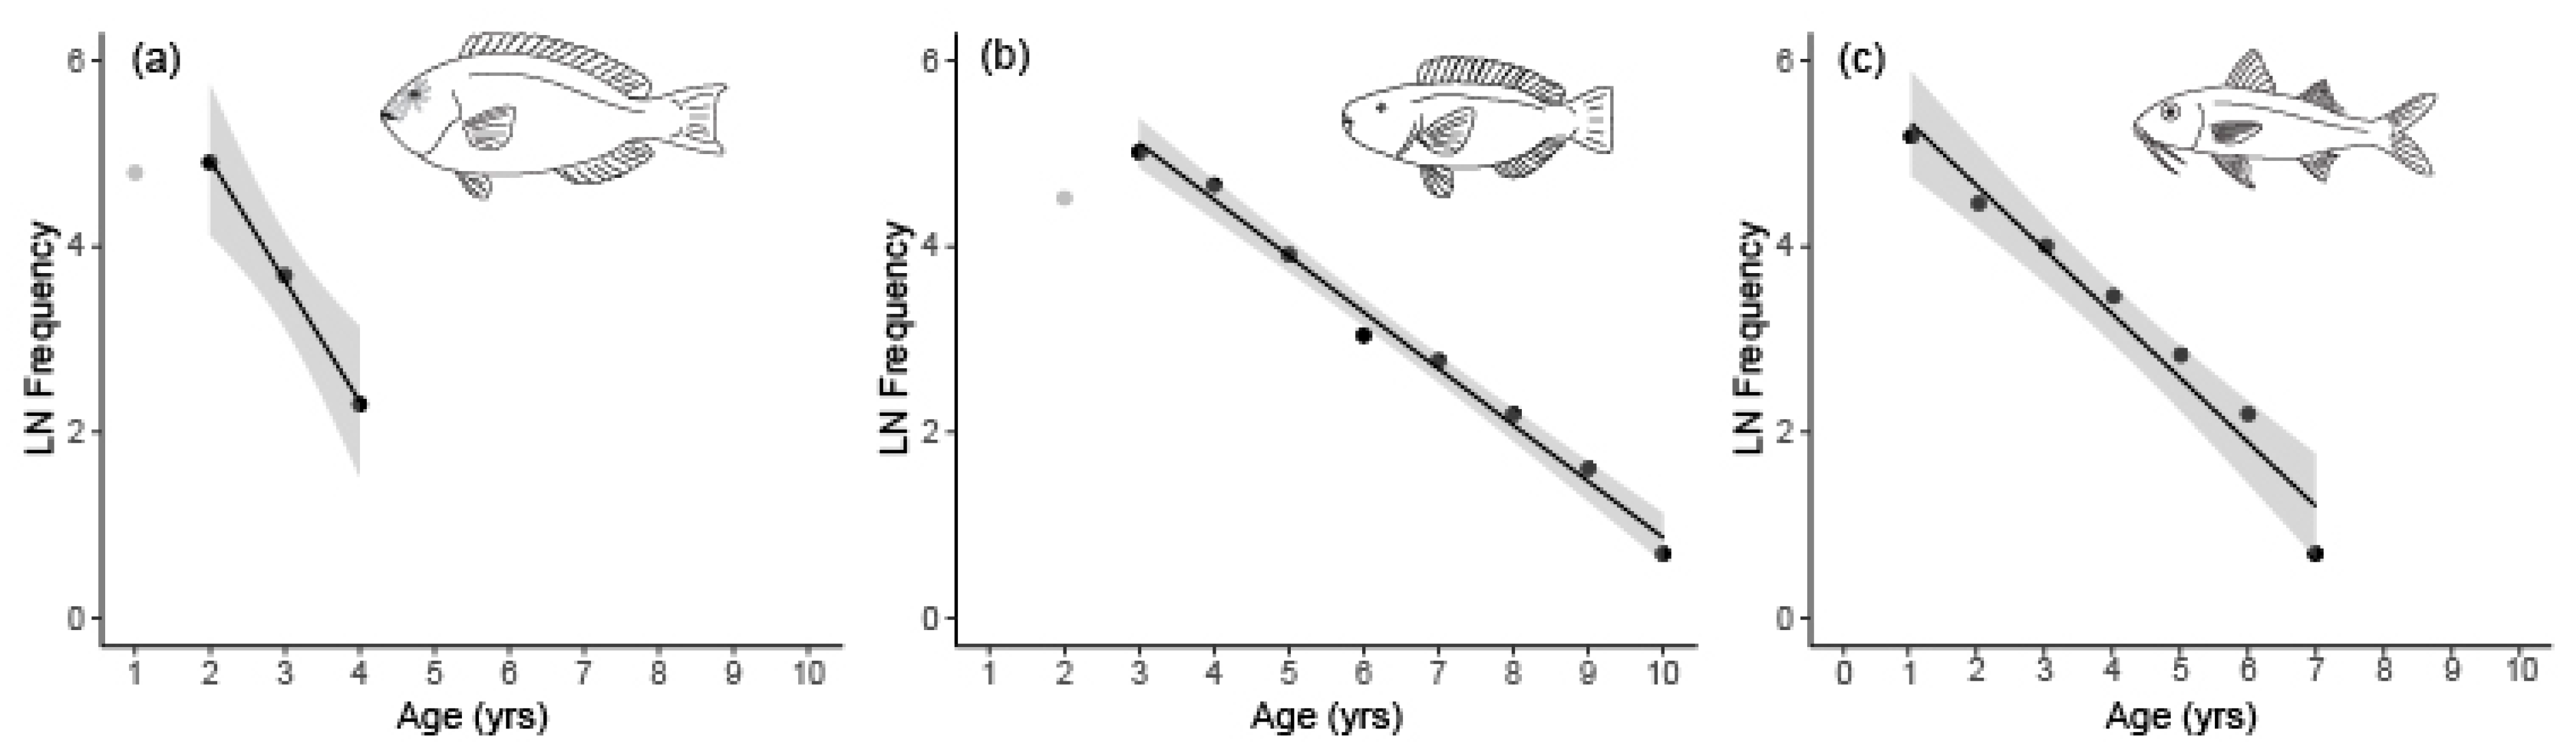
3.2. Age Determination, Growth, and Mortality
4. Discussion
5. Conclusions
Author Contributions
Funding
Institutional Review Board Statement
Data Availability Statement
Acknowledgments
Conflicts of Interest
References
- Carruthers, T.R.; Punt, A.E.; Walters, C.J.; MacCall, A.; McAllister, M.K.; Dick, E.J.; Cope, J. Evaluating Methods for Setting Catch Limits in Data-Limited Fisheries. Fish. Res. 2014, 153, 48–68. [Google Scholar] [CrossRef]
- Newman, D.; Carruthers, T.; MacCall, A.; Porch, C.; Suatoni, L. Improving the Science and Management of Data-Limited Fisheries: An Evaluation of Current Methods and Recommended Approaches; Natural Resources Defense Council: New York, NY, USA, 2014. [Google Scholar]
- Prince, J.; Victor, S.; Kloulchad, V.; Hordyk, A. Length Based SPR Assessment of Eleven Indo-Pacific Coral Reef Fish Populations in Palau. Fish. Res. 2015, 171, 42–58. [Google Scholar] [CrossRef]
- Houk, P.; Rhodes, K.; Cuetos-Bueno, J.; Lindfield, S.; Fread, V.; McIlwain, J.L. Commercial Coral-Reef Fisheries across Micronesia: A Need for Improving Management. Coral Reefs 2012, 31, 13–26. [Google Scholar] [CrossRef]
- Nadon, M.O.; Ault, J.S. A Stepwise Stochastic Simulation Approach to Estimate Life History Parameters for Data-Poor Fisheries. Can. J. Fish. Aquat. Sci. 2016, 73, 1874–1884. [Google Scholar] [CrossRef]
- Taylor, B.M.; Oyafuso, Z.S.; Trianni, M.S. Life History of the Orange-Striped Emperor Lethrinus Obsoletus from the Mariana Islands. Ichthyol. Res. 2017, 64, 423–432. [Google Scholar] [CrossRef]
- Trianni, M.S.; Gourley, J.E.; Ramon, M.S. Spatial, Temporal, and Biological Characteristics of a Nearshore Coral Reef Fishery in the Northern Mariana Islands. Dyn. Manag. Ecosyst. Sci. 2018, 10, 283–297. [Google Scholar] [CrossRef]
- Cole, K.S. Report to the Division of Aquatic Resources Dingell-Johnson Sport Fish Restoration; University of Hawaii at Manoa: Honolulu, HI, USA, 2009. [Google Scholar]
- Taylor, B.; Choat, J. Comparative Demography of Commercially Important Parrotfish Species from Micronesia. J. Fish Biol. 2014, 84, 383–402. [Google Scholar] [CrossRef]
- DeMartini, E.; Andrews, A.; Howard, K.; Taylor, B.; Lou, D.; Donovan, M. Comparative Growth, Age at Maturity and Sex Change and Longevity of Hawaiian Parrotfishes with Bomb Radiocarbon Validation. Can. J. Fish. Aquat. Sci. 2018, 15, 580–589. [Google Scholar] [CrossRef]
- Reed, E.M.; Taylor, B.M. Life History of Two Data-Poor but Commercially Valuable Tropical Reef Fishes, Parupeneus barberinus and Mulloidichthys flavolineatus, from the Saipan Fishery, Northern Mariana Islands. Mar. Freshw. Res. 2021, 72, 383–397. [Google Scholar] [CrossRef]
- Samejima, S.; Tachihara, K. Age, Growth and Reproductive Biology of a Widespread Coral Reef Fish, Yellowfin Goatfish Mulloidichthys vanicolensis (Valenciennes, 1831). J. Fish Biol. 2022, 100, 1233–1244. [Google Scholar] [CrossRef]
- Streelman, J.T.; Alfaro, M.; Westneat, M.W.; Bellwood, D.R.; Karl, S.A. Evolutionary History of the Parrotfishes: Biogeography, Ecomorphology, and Comparative Diversity. Evolution 2002, 56, 961–971. [Google Scholar] [CrossRef] [PubMed]
- Echreshavi, S.; Esmaeili, H.R.; Jufaili, S.M. Al Goatfishes of the World: An Updated List of Taxonomy, Distribution and Conservation Status (Teleostei: Mullidae). FishTaxa J. Fish Taxon. 2022, 23, 1–29. [Google Scholar]
- Bellwood, D.R.; Choat, J.H. A Functional Analysis of Grazing in Parrotfishes (Family Scaridae): The Ecological Implications. Environ. Biol. Fishes 1990, 28, 189–214. [Google Scholar] [CrossRef]
- Clements, K.D.; German, D.P.; Piché, J.; Tribollet, A.; Choat, J.H. Integrating Ecological Roles and Trophic Diversification on Coral Reefs: Multiple Lines of Evidence Identify Parrotfishes as Microphages. Biol. J. Linn. Soc. 2016, 120, 729–751. [Google Scholar] [CrossRef]
- Choat, J.H.; Robertson, D.R. Age-Based Studies on Coral Reef Fishes. In Coral Reef Fishes: Dynamics and Diversity in a Complex Ecosystem; Lieske, E., Myers, R., Eds.; Academic Press: San Diego, CA, USA, 2002; pp. 57–80. ISBN 9781728140643. [Google Scholar]
- Taylor, B.M.; Trip, E.L.; Choat, J.H. Dynamic Demography: Investigations of Life-History Variation in the Parrotfishes. In Biology of Parrotfishes; Hoey, A.S., Bonaldo, R.M., Eds.; CRC Press: Boca Raton, FL, USA, 2018; pp. 69–98. [Google Scholar]
- Taylor, B.M.; Hamilton, R.J.; Almany, G.R.; Howard Choat, J. The World’s Largest Parrotfish Has Slow Growth and a Complex Reproductive Ecology. Coral Reefs 2018, 37, 1197–1208. [Google Scholar] [CrossRef]
- Gust, N.; Choat, J.; Ackerman, J. Demographic Plasticity in Tropical Reef Fishes. Mar. Biol. 2002, 2002, 1039–1051. [Google Scholar] [CrossRef]
- Krajewski, J.P.; Sazima, I. Foraging Activity and Behaviour of Two Goatfish Species (Perciformes: Mullidae) at Fernando de Noronha Archipelago, Tropical West Atlantic Vertebrate Natural History View Project Natural History of Fish of the Bonito and Pantanal-Brazil View Project. Artic. Environ. Biol. Fishes 2006, 77, 1–8. [Google Scholar] [CrossRef]
- Uiblein, F. Goatfishes (Mullidae) as Indicators in Tropical and Temperate Coastal Habitat Monitoring and Management. Mar. Biol. Res. 2007, 3, 275–288. [Google Scholar] [CrossRef]
- Pacific Islands Fisheries Science Center (U.S.) CNMI Commercial Fisheries BioSampling (CFBS) 2024. Available online: https://www.fisheries.noaa.gov/inport/item/5633 (accessed on 6 February 2024).
- DeMartini, E.E.; Howard, K.G. Comparisons of Body Sizes at Sexual Maturity and at Sex Change in the Parrotfishes of Hawaii: Input Needed for Management Regulations and Stock Assessments. J. Fish Biol. 2016, 88, 523–541. [Google Scholar] [CrossRef]
- Sundberg, M.; Humphreys, R.; Lowe, M.K.; Cruz, E.; Gourley, J.; Ochavillo, D. Status of Life History Sampling Conducted through the Commercial Fisheries Bio-Sampling Programs in the Western Pacific Territories of American Samoa and Guam and in the Commonwealth of the Northern Mariana Islands; Pacific Islands Fisheries Science Center Administrative Report H 15-08; NOAA: Washington, DC, USA, 2015; pp. 1–56. [CrossRef]
- Sullivan-Brown, J.; Bisher, M.E.; Burdine, R.D. Embedding, Serial Sectioning and Staining of Zebrafish Embryos Using JB-4 Resin. Nat. Protoc. 2011, 6, 46–55. [Google Scholar] [CrossRef]
- Brown-Peterson, N.J.; Wyanski, D.M.; Saborido-Rey, F.; Macewicz, B.J.; Lowerre-Barbieri, S.K. A Standardized Terminology for Describing Reproductive Development in Fishes. Mar. Coast. Fish. 2011, 3, 52–70. [Google Scholar] [CrossRef]
- Kume, G.; Kubo, Y.; Yoshimura, T.; Kiriyama, T.; Yamaguchi, A. Life History Characteristics of the Protogynous Parrotfish Calotomus Japonicus from Northwest Kyushu, Japan. Ichthyol. Res. 2010, 57, 113–120. [Google Scholar] [CrossRef]
- Choat, J.; Axe, L. Growth and Longevity in Acanthurid Fishes; an Analysis of Otolith Increments. Mar. Ecol. Prog. Ser. 1996, 134, 15–26. [Google Scholar] [CrossRef]
- Bellwood, D.R.; Choat, J.H. A Description of the Juvenile Phase Colour Patterns of 24 Parrotfish Species (Family Scaridae) from the Great Barrier Reef, Australia. Rec. Aust. Museum 1989, 41, 1–41. [Google Scholar] [CrossRef]
- Kamikawa, K.T. Insight into Seasonal Recruitment Dynamics of Juvenile Mulloidichthys vanicolensis and M. flavolineatus; Univeristy of Hawaii at Manoa: Honolulu, HI, USA, 2016. [Google Scholar]
- Beverton, R.; Holt, S. On the Dynamics of Exploited Fish Populations. London Chapman Hall 1957, 1958, 242–243. [Google Scholar]
- Hoenig, J. Empirical Use of Longevity Data to Estimate Mortality-Rates. Fish. Bull. 1983, 82, 898–903. [Google Scholar]
- Munch, S.B.; Salinas, S. Latitudinal Variation in Lifespan within Species Is Explained by the Metabolic Theory of Ecology. Proc. Natl. Acad. Sci. USA 2009, 106, 13860–13864. [Google Scholar] [CrossRef]
- Taylor, B.M.; Choat, J.H.; DeMartini, E.E.; Hoey, A.S.; Marshell, A.; Priest, M.A.; Rhodes, K.L.; Meekan, M.G. Demographic Plasticity Facilitates Ecological and Economic Resilience in a Commercially Important Reef Fish. J. Anim. Ecol. 2019, 88, 1888–1900. [Google Scholar] [CrossRef]
- Priest, M.A.; Halford, A.R.; McIlwain, J.L. Evidence of Stable Genetic Structure across a Remote Island Archipelago through Self-Recruitment in a Widely Dispersed Coral Reef Fish. Ecol. Evol. 2012, 2, 3195–3213. [Google Scholar] [CrossRef]
- Horne, J.B.; Van Herwerden, L.; Abellana, S.; Mcilwain, J.L. Observations of Migrant Exchange and Mixing in a Coral Reef Fish Metapopulation Link Scales of Marine Population Connectivity. J. Hered. 2013, 104, 532–546. [Google Scholar] [CrossRef]
- Treml, E.A.; Halpin, P.N.; Urban, D.L.; Pratson, L.F. Modeling Population Connectivity by Ocean Currents, a Graph-Theoretic Approach for Marine Conservation. Landsc. Ecol. 2008, 23, 19–36. [Google Scholar] [CrossRef]
- Clarke, A. Principles of Thermal Ecology: Temperature, Energy, and Life; Oxford University Press: Oxford, UK, 2017; Volume 1, ISBN 9780199551668. [Google Scholar]
- Clarke, A.; Johnston, N.M. Scaling of Metabolic Rate with Body Mass and Temperature in Teleost Fish. J. Anim. Ecol. 1999, 68, 893–905. [Google Scholar] [CrossRef]
- Froese, R.; Binohlan, C. Empirical Relationships to Estimate Asymptotic Length, Length at First Maturity and Length at Maximum Yield per Recruit in Fishes, with a Simple Method to Evaluate. J. Fish Biol. 2000, 56, 758–773. [Google Scholar] [CrossRef]
- Patrick, W.S.; Spencer, P.; Ormseth, O.; Cope, J.; Field, J.; Kobayashi, D. Use of Productivity and Susceptibility Indices to Determine Stock Vulnerability, with Example Applications to Six U.S. Fisheries; Tech. Memo. NMFS-F/SPO-101; National Oceanic and Atmospheric Administration NOAA: Seattle, WA, USA, 2009; 90p.
- Taylor, B.M.; Houk, P.; Russ, G.R.; Choat, J.H. Life Histories Predict Vulnerability to Overexploitation in Parrotfishes. Coral Reefs 2014, 33, 869–878. [Google Scholar] [CrossRef]
- Lindfield, S.J.; McIlwain, J.L.; Harvey, E.S. Depth Refuge and the Impacts of SCUBA Spearfishing on Coral Reef Fishes. PLoS ONE 2014, 9, e92628. [Google Scholar] [CrossRef]
- Lindfield, S.J.; Harvey, E.S.; Halford, A.R.; McIlwain, J.L. Mesophotic Depths as Refuge Areas for Fishery-Targeted Species on Coral Reefs. Coral Reefs 2016, 35, 125–137. [Google Scholar] [CrossRef]
- Maunder, M.; Hamel, O.; Lee, H.-H.; Piner, K.R.; Cope, J.M.; Punt, A.E.; Ianelli, J.N.; Castillo-Jordán, C.; Kapur, M.S. A Review of Estimation Methods for Natural Mortality and Their Performance in the Context of Fishery Stock Assessment. Fish. Res. 2023, 257, 106489. [Google Scholar] [CrossRef]

| Calotomus carolinus | Chlorurus spilurus | Mulloidichthys vanicolensis | |||||||
|---|---|---|---|---|---|---|---|---|---|
| Males | Females | Combined | Males | Females | Combined | Males | Females | Combined | |
| L∞ (cm) | 26.9 (26.5–27.3) | 24.8 (24.1–25.5) | 26.4 (26.0–26.8) | 22.2 (21.8–22.6) | 21.3 (20.9–21.7) | 21.8 (21.6–22.2) | 20.3 (19.9–20.8) | 22.2 (21.7–22.7) | 21.4 (21.1–21.8) |
| K (year−1) | 2.46 (2.21–2.84) | 1.99 (1.75–2.29) | 1.94 (1.79–2.12) | 0.96 (0.84–1.10) | 0.91 (0.83–1.01) | 0.65 (0.58–0.73) | 1.46 (1.34–1.60) | 1.21 (1.11–1.32) | 1.27 (1.20–1.36) |
| n aged | 173 | 126 | 303 | 195 | 254 | 453 | 158 | 195 | 400 |
| Amax | 4 | 4 | 4 | 10 | 9 | 10 | 6 | 7 | 7 |
| L50 (cm) | - | 18.6 (17.9–19.1) | - | - | NA | - | 17.2 (16.9–17.5) | 18.9 (18.6–19.2) | |
| L95 (cm) | 21.9 (20.7–23.4) | NA | 19.6 (18.8–20.7) | 21.4 (20.7–22.3) | |||||
| LΔ50 (cm) | - | - | 24.2 (23.8–24.5) | - | - | 21.0 (20.6–21.4) | - | - | - |
| Z (year−1) | - | - | 1.30 (1.21–1.40) | - | - | 0.61 (0.56–0.66) | - | - | 0.69 (0.49–0.87) |
Disclaimer/Publisher’s Note: The statements, opinions and data contained in all publications are solely those of the individual author(s) and contributor(s) and not of MDPI and/or the editor(s). MDPI and/or the editor(s) disclaim responsibility for any injury to people or property resulting from any ideas, methods, instructions or products referred to in the content. |
© 2025 by the authors. Licensee MDPI, Basel, Switzerland. This article is an open access article distributed under the terms and conditions of the Creative Commons Attribution (CC BY) license (https://creativecommons.org/licenses/by/4.0/).
Share and Cite
Pardee, C.; Wiley, J.; Taylor, B.M. Age-Based Demography of Two Parrotfish and a Goatfish from Saipan, Northern Mariana Islands. Fishes 2025, 10, 303. https://doi.org/10.3390/fishes10070303
Pardee C, Wiley J, Taylor BM. Age-Based Demography of Two Parrotfish and a Goatfish from Saipan, Northern Mariana Islands. Fishes. 2025; 10(7):303. https://doi.org/10.3390/fishes10070303
Chicago/Turabian StylePardee, Cassandra, John Wiley, and Brett M. Taylor. 2025. "Age-Based Demography of Two Parrotfish and a Goatfish from Saipan, Northern Mariana Islands" Fishes 10, no. 7: 303. https://doi.org/10.3390/fishes10070303
APA StylePardee, C., Wiley, J., & Taylor, B. M. (2025). Age-Based Demography of Two Parrotfish and a Goatfish from Saipan, Northern Mariana Islands. Fishes, 10(7), 303. https://doi.org/10.3390/fishes10070303