Article

Stock Assessment of Long Whisker Catfish (Mystus gulio): Ensuring the Fisheries’ Sustainability in the Sundarbans Mangrove, Bangladesh

by
Md. Tanvir Rahman Ovi
1,†,
Tanni Sarkar
1,†,
Dwipika Gope
1,
Rayhan Ahmod
1,
Sanzib Kumar Barman
2,
Md. Mostafa Shamsuzzaman
1,
Mohammad Mojibul Hoque Mozumder
3,
Petra Schneider
4,* and
Partho Protim Barman
1,*
1
Department of Coastal and Marine Fisheries, Faculty of Fisheries, Sylhet Agricultural University, Sylhet 3100, Bangladesh
2
Department of Fishery Resources Conservation and Management, Faculty of Fisheries and Ocean Sciences, Khulna Agricultural University, Khulna 9100, Bangladesh
3
Fisheries and Environmental Management Group, Helsinki Institute of Sustainability Science (HELSUS), Faculty of Biological and Environmental Sciences, University of Helsinki, 00014 Helsinki, Finland
4
Department for Water, Environment, Civil Engineering and Safety, University of Applied SciencesMagdeburg-Stendal, Breitscheidstraße 2, D-39114 Magdeburg, Germany
*
Authors to whom correspondence should be addressed.
These authors contributed equally to this work.
Fishes 2025, 10(7), 300; https://doi.org/10.3390/fishes10070300
Submission received: 27 May 2025 / Revised: 16 June 2025 / Accepted: 18 June 2025 / Published: 20 June 2025
(This article belongs to the Section Biology and Ecology)

Abstract

The world’s largest mangrove, Sundarbans, Bangladesh, is the habitat of the euryhaline catfish Nona Tengra (Mystus gulio). This study aimed to assess the stock status of M. gulio and provide reference points for sustainable fisheries’ management. One-year length–frequency (LF) data were collected from the Sundarbans region of Bangladesh and analyzed using the Length-Based Bayesian Biomass (LBB) method and the Length-Based Spawning Potential Ratio (LBSPR) model. The findings showed healthy biomass (B/BMSY = 1.2), with 57% of the wild stock of this species being harvested (B/B0 = 0.43). The calculated fishing mortality ratio indicated the underfishing conditions (F/M = 0.9). Safe exploitation (E = 0.46) was depicted, as E was smaller than the permitted level of 0.5. The value of capture length (Lc = 12.8 cm) was larger than the optimum capture length (Lc_opt = 10.0 cm) and the optimum length for maximum yield per recruit (Lopt = 12.0 cm) and larger than the maturity length (Lm = 9.16 cm), indicating the capture of mature individuals. The calculated Spawning Potential Ratio (SPR = 48%) was higher than the target reference points (SPR = 40%). This research evaluated the sustainable stock status. Although the margin between Lc_opt and Lm is very narrow, setting the minimum capture size at Lopt would be a conservative buffer to ensure long-term sustainability. The recommended minimum harvest size is 12 cm for M. gulio. Current fishing gear selectivity can ensure the sustainability of M. gulio in Sundarbans, Bangladesh; however, maintaining current fishing practice through careful management is suggested. Further assessments with length-based and other low-data methods should be conducted to refine exploitation estimates and trends.
Key Contribution: Healthy biomass and safe exploitation level of Mystus gulio was assessed in Sundarbans, Bangladesh, using LBB and LBSPR models. The observed capture size was larger than the optimum length (Lc_opt) and maturity length (Lm). The Spawning Potential Ratio (SPR) was above the target reference point (SPR = 40%). This study recommends maintaining current fishing pressure and minimum capture size of 10 cm for sustainability.

1. Introduction

The Sundarbans Ramsar site is the world’s most diverse contiguous wetland ecosystem. This unique ecosystem is situated in the delta of the Ganges, Brahmaputra, and Meghna rivers, covering approximately 1 million hectares across the southwestern areas of Bangladesh in the districts of Bagerhat, Khulna, and Satkhira and the southeastern portion of West Bengal in India [1]. This mangrove has high biodiversity and species richness. It is home to a wide array of aquatic life, including 322 species of fish, 44 species of crabs, and 20 species of prawns [2]. The fishery resources of Sundarbans are the most significant non-wood element of the forest and play a crucial role in the livelihoods of millions living in the region, supporting the local economy and food security. In the fiscal year 2022–2023, fish production in Sundarbans totaled 26,047 metric tons, contributing 0.53% of the overall inland capture fishery sector of Bangladesh, and it generated a revenue of USD 5.16 million during this period [3].
Mystus gulio, commonly known as the Long Whiskers Catfish, belongs to the family Bagridae under the order of Siluriformes. This euryhaline catfish primarily inhabits brackish water environments, and it can venture into freshwater habitats [4]. It is available in canals, wetlands, haors, oxbow lakes, rivers, and estuaries across Bangladesh, including the Sundarbans delta [5]. This small indigenous fish species (SIS) possesses considerable nutritional benefits [6]. Because of its exceptional taste and high nutritional content, this species has gained widespread popularity among consumers, leading to significant market demand in many Asian countries, specifically in Bangladesh and India [7,8,9,10].
However, the rapid growth of human populations, along with limited alternative livelihood options, pose significant challenges to the integrity of Bangladesh’s Sundarbans ecosystem. The overexploitation of fish to fulfil rising demand is one of the major reasons for the depletion of wild stocks. In addition to overexploitation, Sundarbans fisheries are also facing a combination of anthropogenic and natural pressures, including illegal fishing, destructive fishing practices, mangrove destruction, pollution, invasive species, sea level rise, siltation, and natural disasters [11]. The decline in fish productivity in Sundarbans is alarming, as indicated by recent studies [12,13]. For example, between 1960 and 2000, the capture of M. gulio in the southern coastal region of Bangladesh declined by 33.6% [14]. This decline not only threatens the biodiversity of the region but also the economic stability of the communities that depend on fisheries for their livelihoods. Given the crucial role of this species in the livelihoods of local communities and national economic growth, it is imperative to assess stock status. Stock assessment serves as a vital tool that provides valuable insights into the stock’s health and assists policymakers in providing evidence-based reference points to maintain sustainable fishery production.
Currently, accurate and up-to-date stock data for this finfish species are limited in Bangladesh. Several studies have addressed length–weight relationships, food and feeding behavior, reproduction, culture potential, and stocking density of M. gulio [8,15,16,17,18]. Furthermore, a recent study touched on some variables of stock assessment, such as growth parameters, biomass, exploitation rate, and maximum sustainable yield of M. gulio in the Satkhira region [19]. Nevertheless, the application of advanced stock assessment tools, such as Length-Based Bayesian Biomass (LBB) and Length-Based Spawning Potential Ratio (LB-SPR), remains limited in the Sundarbans region. These modern techniques allow us to estimate some key factors and reference points, including the current biomass status relative to MSY, the length of capture (Lc), length at maturity (Lm), minimum and maximum catch size, and the Spawning Potential Ratio (SPR) of this species. Estimation of these parameters is necessary to maintain fishing pressure at a level that ensures fisheries’ sustainability.
Addressing the existing research gap, this research aimed to evaluate the stock status of M. gulio in Sundarbans by applying Length-Based Bayesian Biomass (LBB) and Length-Based Spawning Potential Ratio (LB-SPR) models. This study collected one-year length–frequency (LF) data to assess stock health and the Spawning Potential Ratio of M. gulio utilizing widely accepted LBB and LB-SPR models [20,21]. The findings of this research will contribute to the development of evidence-based policies and management strategies aiming at ensuring the long-term sustainability and economic viability of M. gulio in Sundarbans, Bangladesh.

2. Materials and Methods
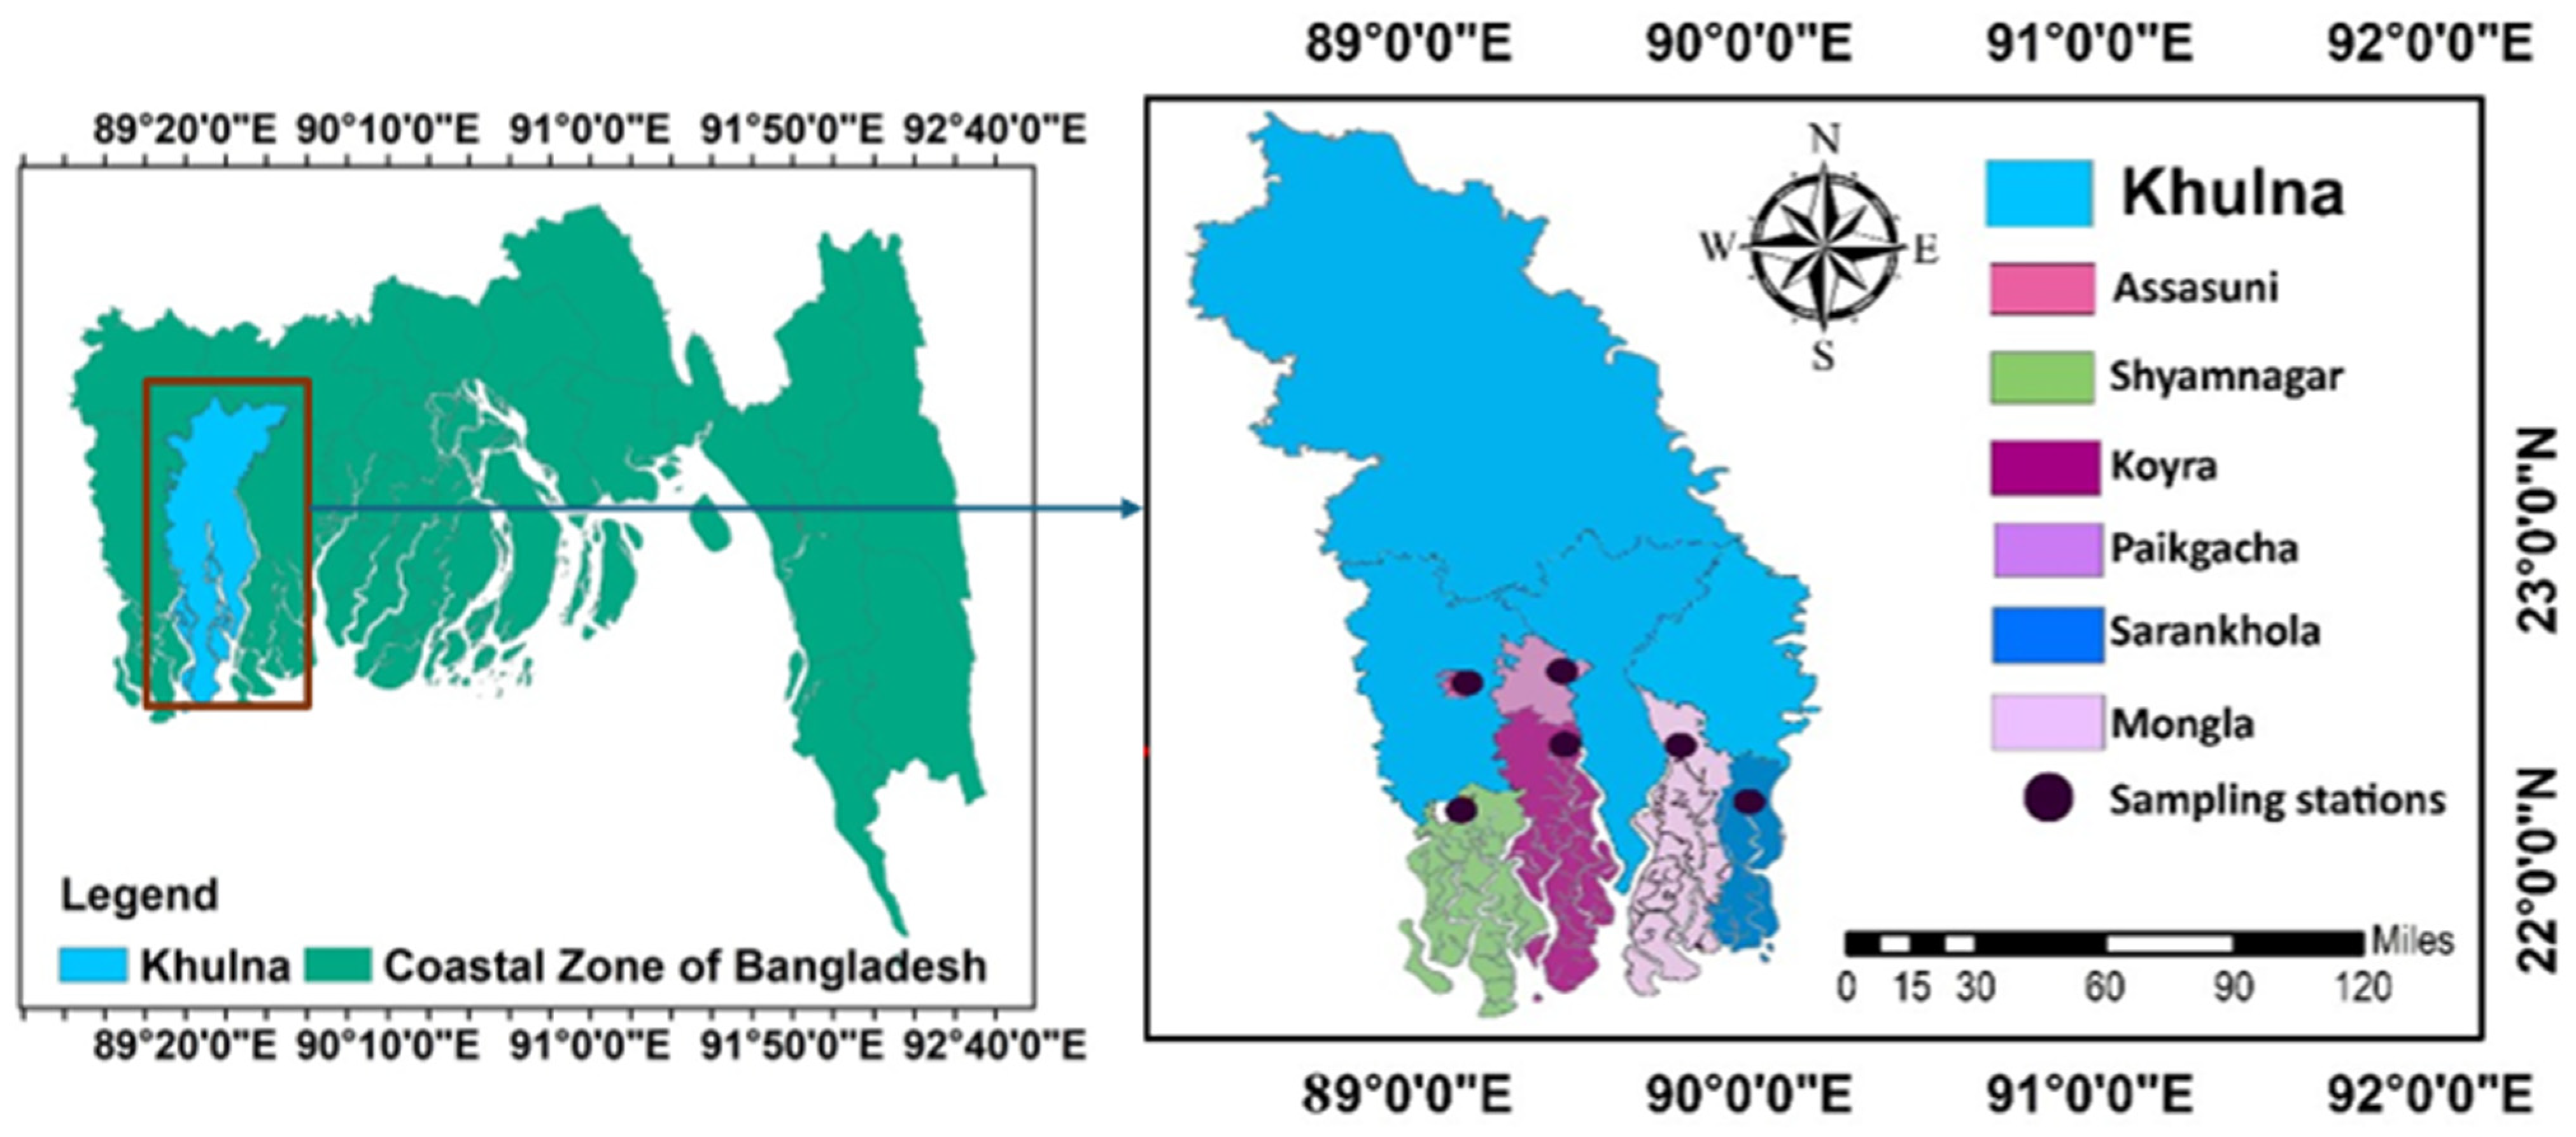
2.1. Sampling Sites

The study was conducted in Sundarbans, Bangladesh. Length–frequency (LF) data were collected from the six sampling sites, namely, Sarankhola fishery ghat (22°12′43″ N, 89°48′30″ E) and Mongla ghat (22°29′12″ N, 89°35′26″ E) in Bagerhat district, Paikgacha fishery ghat (22°35′22″ N, 89°19′30″ E) and Koyra landing site (22°21′08″ N, 89°17′33″ E) from Khulna district, and Hajrakhali fishery ghat (22°25′38″ N, 89°11′39″ E) and Shyamnagar’s fishery ghat (22°14′54″ N, 89˚14′17″ E) in Satkhira district (Figure 1).
These sites were selected to ensure representative spatial coverage of the Sundarbans mangrove in Bangladesh. The divers’ estuarine condition of the sampling locations was considered to ensure the availability of euryhaline M. gulio species. Thus, these sites are the major artisanal fishing and landing center of this species. Also, their consistent accessibility and prior use in fishery studies support reliable and year-round length–frequency (LF) data collection.

2.2. Data Collection and Analysis

In Sundarbans, Bangladesh, M. gulio is primarily harvested by artisanal fishers using small-scale and traditional fishing gear like the monofilament nylon gill net (Current jal with mesh size 1.5–2.5 cm), the polyethylene drag net (Behundi jal with mesh size 2.0 cm), and the lift net (Dharma jal). One-year length–frequency (LF) data were collected from January to December 2023 from artisanal fishing. Monthly sampling was conducted on board condition before landing from each sampling site. During sampling, the total length (TL) of each sampled fish was measured using the measuring wooden scale in millimeter (mm) units. To avoid sampling bias, a random sampling method was carefully chosen to ensure maximum representation across all age classes and length classes, from smaller to larger individuals.
A total of 1180 individual samples of M. gulio were collected during the study period. Among them, 145 samples were collected from Sarankhola, with the maximum and minimum length sizes recorded 5 cm to 20 cm, and 191 samples were collected from the Mongla site, with sample sizes ranging from 6 to 19 cm in the Bagerhat district. A total of 177 samples were collected from Paikgacha, with sample size ranging from 6.5 to 19.5 cm, and 177 samples were collected from Koyra, with sample sizes ranging from 8 to 19 cm in the Khulna district. A total of 165 samples were collected from Hajrakhali, with sample sizes ranging from 7 to 19 cm, and 325 samples from the Shyamnagar site, with sample sizes ranging from 5 to 19.5 cm in the Satkhira district (Figure 2).
The collected LFs were than grouped into different length classes based on 5 mm class intervals (CIs). Furthermore, both Length-based Bayesian Biomass (LBB) and Length-Based Spawning Potential Ratio (LB-SPR) methods were applied to analyze the LF data. R-codes for LBB (LBB33a.R) and LBSPR (LB-SPR package) were downloaded from http://oceanrep.geomar.de/44832/ (accessed on 10 July 2021) and https://cran.r-project.org/web/packages/LBSPR/index.html (accessed on 30 March 2022), respectively, and R studio (2024.12.1) was used to run the R codes.

2.3. Description of Length-Based Bayesian Biomass (LBB) Method

The Length-Based Bayesian Biomass (LBB) method was developed as a data limited stock assessment approach designed to evaluate the fish population using simple LF data [20]. The LBB method is particularly suitable in regions or conditions where traditional time series catch data and detailed age structure data are unavailable. This method uses a Bayesian Monte Carlo Markova Chain (MCMC) approach to evaluate the relevant population parameters, including asymptotic length or length infinity (Linf), natural mortality (M), fishing mortality (F), and the ratio between current biomass and biomass producing maximum sustainable yield (B/BMSY). This method also assumes steady-state population dynamics and applies length–base indicators to assess the stock status. Other important biological reference points (BRPs) like ratio of current biomass to virgin biomass (B/B0), exploitation (E), and mortality ratio (F/M) were also estimated through LBB. The LBB is a cost-effective and reliable stock assessment approach, particularly for small-scale and data-poor fisheries, and it offers guidance for management decisions under uncertainty.
The Von Bertalanffy Growth Function (VBGF) is fundamental to the LBB method to estimate the growth of aquatic organisms, including fish, in terms of length over time [22,23]. This VBGF (Equation (1)) provides a robust framework to describe individual growth trajectories from LF data.
L t = L i n f 1 e k ( t t 0 )
Here, length at t is indicated by Lt, the Linf is the asymptotic length, k is the rate at which the Linf is approached, and t0 is the hypothetical length at zero age.
When a specific type of gear is predominantly used for fishing, the catch curve in the LF distribution is principally influenced by total mortality (Z = F + M) relative to the growth coefficient (K), resulting in the rightward skew of the catch distribution by the Equation (2).
N L = N L s t a r t ( L i n f L L i n f L s t a r t ) Z / K
Here, NL is the number of survivors at L length, NLstart is the number of samples at Lstart length, Linf is the asymptotic length, and Z/K is the ratio between total mortality and growth coefficient.
Fishing gears typically exhibit characteristic selection patterns, which are incorporated into the LBB method through a selectivity ogive [24,25]. This ogive function describes the probability of capture as a function of fish length, and it is represented by Equation (3).
S L = 1 [ 1 + e α ( L L c ) ]
Here, SL is the fraction of an individuals captured at L length, α is the gradient of the ogive, and LC is the length at first capture.
Through the integration of Equations (1)–(3), the LBB method formulates additional expressions of Equations (4) and (5) to enable the simultaneous estimation of key BRPs, including the ratio of natural mortality to growth (M/K), the ratio of fishing mortality to growth (F/K), the length at first capture (Lc), asymptotic length (L), and the shape parameter of selectivity ogive (α). These equations provide the framework for estimating stock status based on LF data alone.
N L i = N L i 1 ( L i n f L i L i n f L i 1 ) M K + F K   S L i
C L i = N L i S L i
Here, the Li is the number of individuals at the length i, Li−1 is the number at the previous length, and C is the number of individuals vulnerable to fishing gear.
The optimum length (Lopt), defined as the length at which the biomass of a cohort is maximized, can be calculated from L and M/K using Equation (6) [26]. Subsequently, the optimal length at first capture (Lc_opt), which corresponds to the maximum yield and biomass under sustainable fishing pressure, is estimated using Equation (7), incorporating values of Lopt and the F/M ratio.
L o p t = L i n f ( 3 3 + M K )
L c _ o p t = L i n f ( 2 + 3 F M ) ( 1 + F M ) ( 3 + M K )
For the virgin (unfished condition) fisheries, the Z/K = M/K, where NLstar is 1 and Lstar is 0. Furthermore, the result of Lc_opt was used for relative biomass to produce MSY [20]. Table 1 represents the basic information and prior values (Linf, Lc, Z/K, M/K, F/K, and α) for the LBB analysis.

2.4. Description of Length-Based Spawning Potential Ratio (LB-SPR)

The Spawning Potential Ratio (SPR) is a widely recognized fishery reference point with a strong theoretical foundation for guiding sustainable fishery management. The LB-SPR approach is particularly effective for estimating SPR in aquatic species, especially when the natural mortality to growth ratio (M/K) exceeds 0.53 [27,28,29,30]. The LB-SPR method is distinguished from other equilibrium-based stock assessment models by several underlying assumptions: asymmetric selectivity; population length at age following the VBGF and being normally distributed; constant natural mortality across the adult population; and a stable growth rate within the stock cohort [31]. This method requires only length–frequency (LF) data for implementation [21]. The LB-SPR model also requires specific life history parameters as inputs: the asymptotic length (L), the M/K ratio, the length at 50% maturity (L50), and the length at 95% maturity (L95). In this study, the L and M/K values were derived from the LBB analysis, while L50 and L95 were estimated using Equations (8) and (9), respectively [31,32], as presented in Table 1.
logL50 = 0.8979logL − 0.0782
L95 = 1.1 × L50
The maximum likelihood technique is used to estimate the length of the first capture of a 50% population (SL50%) and a 95% population (SL95%) using the LB-SPR. Furthermore, the LB-SPR approach is used to estimate the relative fishing mortality (F/M) to determine the SPR value [21,31]. The target SPR set at SPR = 40% was set to run the LB-SPR method.

3. Results

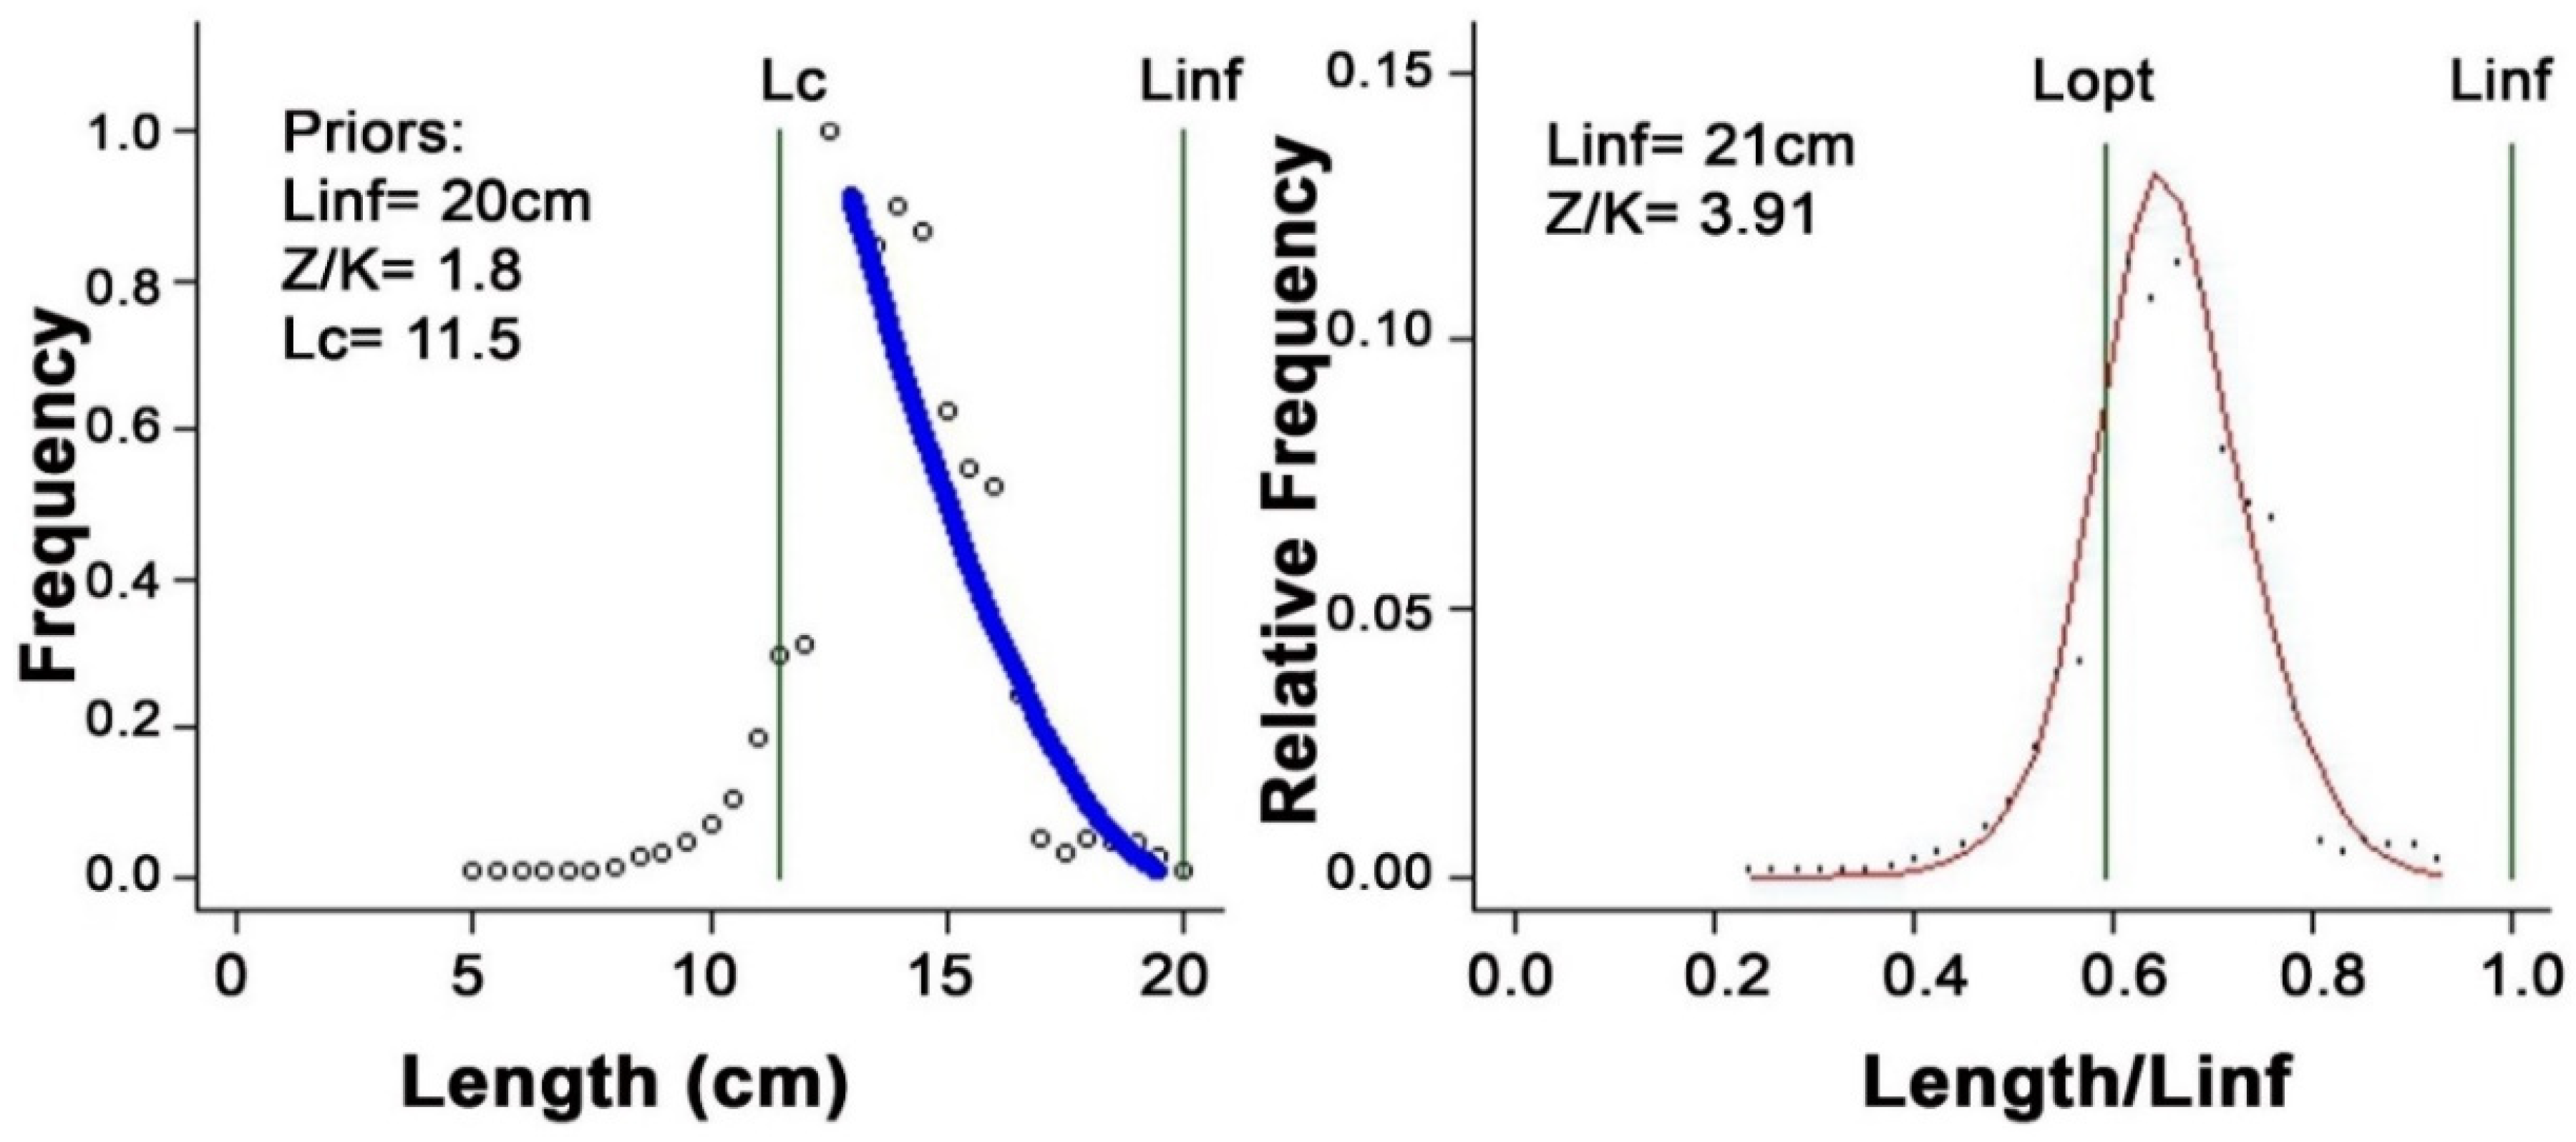
3.1. Length-Based Reference Points of Mystus gulio

The length-based population parameters and stock status of M. gulio were evaluated using the LBB approach in Table 2 and Figure 3. The assessed values of Lmean/Lopt and Lc/Lc_opt were 1.2 and 1.3, respectively, denoting the healthy state of the M. gulio stock and the harvesting of prominent individuals. The existence of larger-sized fish within the stock was indicated by L95th/Linf = 0.93 (higher than unity of 0.9). Furthermore, the obtained value of Lc (12.8 cm) is higher than Lc_opt (10 cm) and Lopt (12.0 cm), which signifies the harvesting of larger fish at first capture in Sundarbans. However, the assessed Lc > Lc_opt and the B/B0 > BMSY/B0 suggest that existing fishing pressure and gear have no impact on the biomass of M. gulio in Sundarbans, Bangladesh (Table 2).

3.2. Stock Status and Exploitation of Mystus gulio

The length-based stock information of M. gulio was evaluated using the LBB approach in Table 2. The predicted B/BMSY of 1.2 indicates the healthy condition of the M. gulio stock and denotes that the standing biomass is more than the level required to produce MSY. The computed B/B0 (0.43) indicates the safe biomass of M gulio and signifies that only 57% of this stock has been harvested. Additionally, the estimated B/B0 (0.43) was higher than the BMSY/B0 (0.36), which suggests that the wild stock of M gulio is being underharvested. The calculated F/M ratio was 0.9, which is very close to the optimum level of 1.0, providing further evidence that the M. gulio in Sundarbans is currently under sustainable fishing pressure. Moreover, the estimated exploitation rate (E = 0.46) was smaller than the permitted maximum rate of exploitation (E = 0.5), suggesting safe exploitation of M. gulio in Sundarbans, Bangladesh.

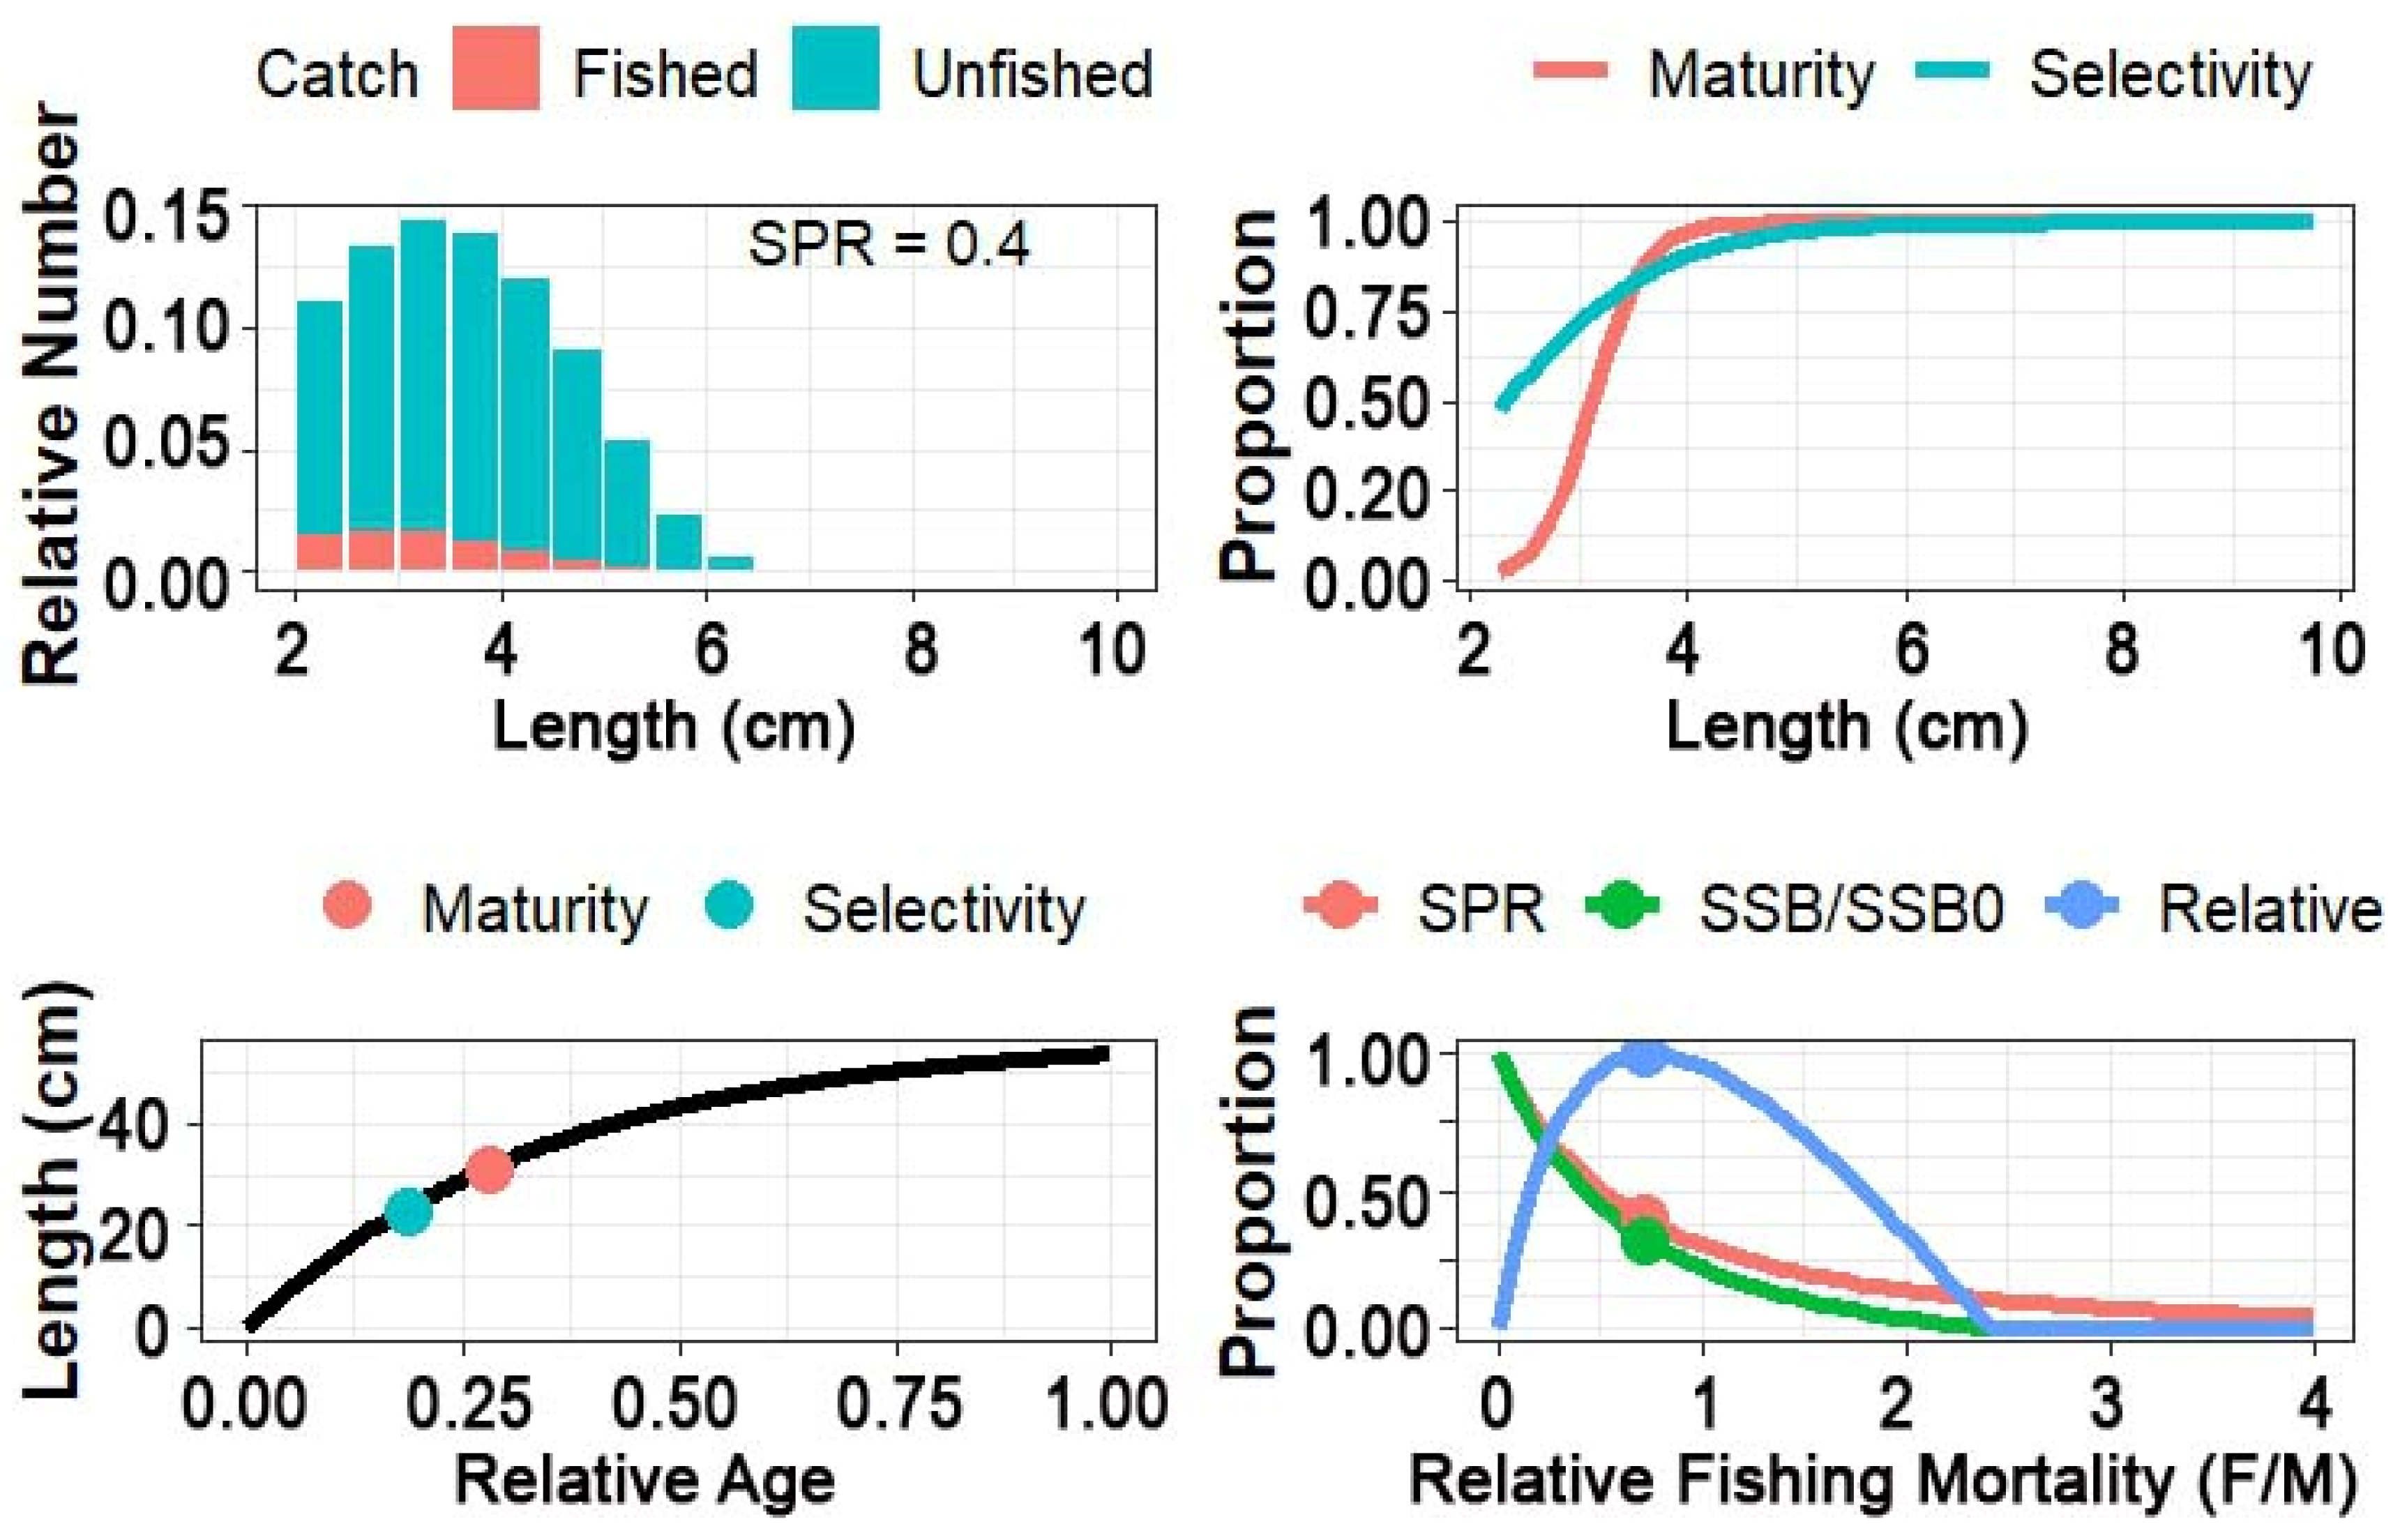
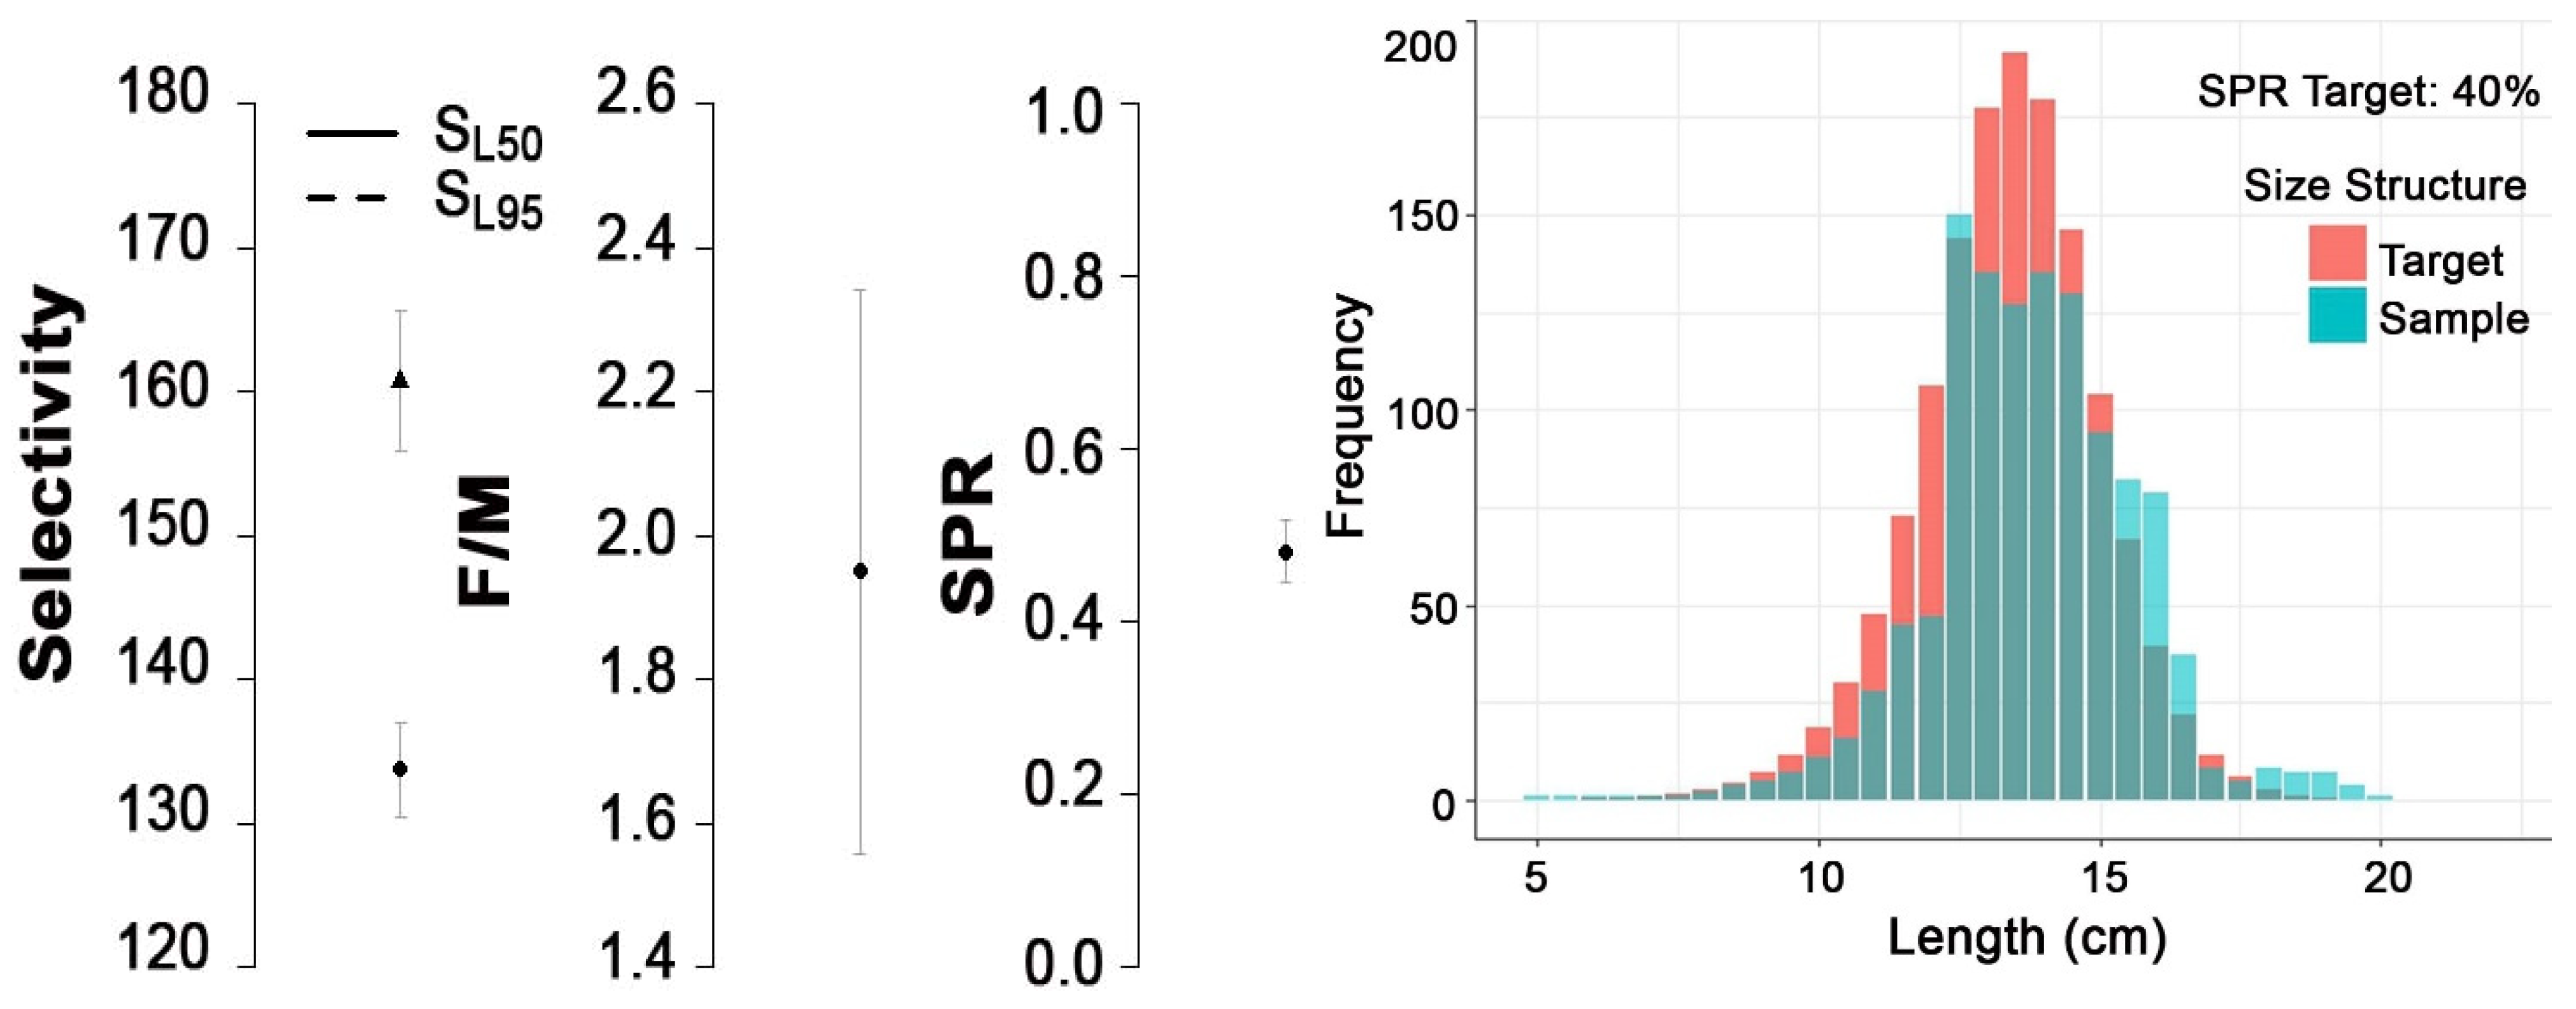
3.3. Life History, Selectivity, Maturity, and SPR of Mystus gulio

Table 3 and Figure 4 show the results of the LB-SPR analysis for M. gulio. The length–frequency distribution (top-left panel) shows a predominance of smaller to medium-sized individuals within the catch, with a clear distinction between unfished (light blue) and fished (pink) portions of the population. The figure highlights a Spawning Potential Ratio (SPR) of 0.40, indicating that approximately 40% of the unfished reproductive potential remains in the stock under current fishing pressure. The maturity length (Lm) was estimated as 9.16 cm (Table 2). The maturity and selectivity ogive curves (top-right panel) indicate that the size at 50% selectivity occurs at a slightly larger length than the size at 50% maturity. This suggests that fish are generally allowed to mature before being subject to high fishing mortality. This pattern is generally favorable from a management perspective, as it suggests that a substantial proportion of the population contributes to reproduction prior to being harvested.
Figure 5 displays that the growth curve distribution skewed toward smaller size classes, and it was appropriately fitted to the observed length–frequency data for M. gulio in the Sundarbans region (Figure 5, left panel). The strong central peak suggests that the population is dominated by mid-sized individuals, potentially near or slightly below the size at first maturity (L50%). The estimated selectivity lengths at 50% (SL50) and 95% (SL95) capture were 13.37 cm and 16.07 cm, respectively (Figure 5, right panel). These values reflect the size ranges over which the majority of fishing mortality is exerted. The average relative fishing mortality (F/M) was estimated at 1.95 from the LB-SPR model, suggesting current overfishing, and the Spawning Potential Ratio (SPR) was estimated at 0.48 (48%), indicating a relatively healthy stock status (Figure 5, right panel). The SPR value indicates that the population retains nearly half of its unexploited reproductive capacity, signifying a relatively healthy stock status. The LB-SPR analysis indicated that the modeled growth curve was appropriately fitted to the observed length–frequency data (Figure 5, right panel), showing a distribution skewed toward smaller size classes for M. gulio in the Sundarbans region.

4. Discussion

4.1. Suitability of LBB and LB-SPR for Mystus gulio

The stock assessment of Mystus gulio in Sundarbans using one year of length–frequency (LF) data highlights the effectiveness and applicability of length-based methods—particularly the Length-Based Bayesian Biomass (LBB) and Length-Based Spawning Potential Ratio (LB-SPR)—for evaluating data-poor fisheries. These approaches are increasingly recognized as practical and reliable alternatives to traditional age-structured models, especially where historical catch data, age composition, and fishery-independent surveys are unavailable [20,21,33].
The LBB method is well-suited for fish species, such as M. gulio, that exhibit indeterminate growth and are subject to continuous exploitation across various size classes. The method requires only LF data from the exploited population and relies on key life history traits, such as length at first capture and asymptotic length, to estimate biomass status and fishing pressure indicators [20]. In this study, LF data collected over twelve months were stratified into 5 mm length class intervals to ensure high resolution in size structure, and a random sampling strategy was adopted to reduce bias and enhance representativeness across all size classes.
The robustness of the LBB approach is evident from its ability to yield reliable estimates of biological reference points (e.g., B/BMSY, F/M) with minimal data input. Previous studies comparing the LBB method with classical models, such as the Pella–Tomlinson and Beverton–Holt yield-per-recruit approaches, have found that LBB produces consistent and biologically interpretable results even under severe data constraints [20,34]. These strengths make the LBB particularly advantageous for tropical multispecies fisheries and small-scale artisanal sectors, where systematic data collection is often limited.
In parallel, the LB-SPR method proved effective in estimating the Spawning Potential Ratio (SPR), a key indicator of reproductive sustainability. LB-SPR utilizes LF data to infer the proportion of the spawning biomass relative to an unfished population, incorporating parameters for size-selective fishing and maturity. Its reliance on length-based inputs rather than age composition or catch effort data makes it an accessible and scientifically rigorous option for resource-limited settings [21,31]. The successful application of this method to M. gulio provides critical insights into the reproductive dynamics of the stock and confirms that the majority of individuals are harvested after reaching maturity—a favorable outcome for ensuring recruitment success.
Together, these methods support a precautionary approach to fisheries’ management by offering quantitative estimates of stock status that are grounded in observed data yet require minimal assumptions [24,28,33,35]. They are particularly well-suited for M. gulio, a non-target but locally significant species in Sundarbans, where dedicated stock monitoring programs are scarce. Moreover, the findings from both models are consistent, reinforcing confidence in their applicability and reinforcing the reliability of LF-based assessments for data-poor fisheries. The outcomes of the LBB analysis provide not only an assessment of stock status and exploitation level but may also serve as prior information for more complex, data-demanding models. Previous studies have shown that even with limited data, results from the LBB model align well with those obtained from conventional approaches, such as the Pella–Tomlinson surplus production model and Beverton–Holt yield-per-recruit analysis [36,37]. Consequently, the use of LF data for M. gulio in this study is justified, and the model’s outputs are consistent with expectations for lightly exploited stocks, exhibiting asymmetrical distributions in line with patterns reported in earlier research [20].

4.2. Length-Based Reference Points of Mystus gulio

Length-based indicators offer insights into fish stock status and are essential in fisheries’ management, particularly for data-poor fisheries or developing areas [34,38,39]. Indicators like mean length, length at first capture (Lc), length at maturity (Lm), and ratios, such as Lmean/Lopt or Lc/Lc_opt, directly inform population size structure. Changes in these indicators indicate overfishing, growth overfishing, recruitment overfishing, or recovery trends, aiding timely management decisions [21,40].
The Lmean/Lopt ratio is a widely used biological indicator in length-based stock assessment methods. It helps evaluate whether a fish population is optimally exploited, overfished, or underfished. Lmean/Lopt ≈ 1.0 suggests that the stock is optimally exploited, Lmean/Lopt suggests that the stock is overfished, meaning fish are caught too early before reaching optimal size, and Lmean/Lopt > 1.0 may suggest underfishing, meaning fish are generally older/larger and harvesting could be increased [40]. The estimated Lmean/Lopt was 1.2 and the Lc/Lc_opt was 1.3, indicating a population skewed toward larger individuals, which suggests low fishing mortality and selective harvesting of larger fish [21,34].
If Lc < Lc_opt, fish are caught before they reach their optimum size of harvest, leading to growth overfishing. If Lc > Lc_opt, fish are caught later than an ideal size, possibly causing stock underutilization. When LcLc_opt, fishing mortality is balanced better to maximize sustainable yield without harming recruitment or growth [32]. The estimated Lc (12.8 cm) was higher than the Lc_opt (10 cm), indicating that the gear selectivity or mesh size currently employed enables fish to attain larger sizes before being captured, which is generally favorable for stock sustainability. The findings of this research are supported by different studies conducted in Bangladesh and India (Table 4).
The L95th/L ratio is a valuable indicator derived from LF data to evaluate the exploitation status of a fish population [34]. It compares the 95th percentile of observed fish lengths (L95th) to the theoretical asymptotic length (L) estimated from growth models, such as the VBGF. A ratio of L95th/L > 0.9 indicates a healthy size structure and the presence of large individuals, while L95th/L < 0.7 indicates a truncated size structure, potential overfishing, or high selectivity pressure on large fish [34,38,41]. Large individuals within the stock are also supported by a high L95th/L ratio of 0.93, exceeding the precautionary value of 0.9, further emphasizing the low harvest pressure.
Selectivity refers to the probability that the fishing gear catches fish of a specific size (length). It is fundamental to understanding how fishing affects different size classes in the population. Length at 50% selectivity (SL50%) is the length at which 50% of the fish are vulnerable or caught by the gear, and length at 95% selectivity (SL95%) is the length at which 95% of the fish are vulnerable to capture [42,43,44]. This information allows managers to estimate the impact of fishing on spawning biomass and recruitment, influencing stock sustainability. Accurate selectivity estimates improve the precision of BRPs, such as SPR and MSY [43]. Selectivity helps detect growth or recruitment overfishing, guiding adaptive management actions [44]. The estimated size at SL50% and SL95% was 13.37 cm and 16.07 cm, respectively. These values suggest that the fishing gear is likely targeting larger individuals, allowing smaller and potentially immature fish to escape. This selectivity pattern aligns with best practices in fisheries’ management, promoting stock sustainability by reducing the capture of juvenile fish and allowing them to contribute to future generations [33]. Length parameters help to design the practical size limits, mesh regulations, and harvest control rules to protect spawning biomass and ensure sustainable yields [45]. Fishery managers use this ratio to establish minimum size limits or gear regulations to ensure fish are harvested near the optimal size for productivity [23]. Based on the estimated life history parameters (Lm = 9.16 cm, Lopt = 12.0 cm, Lc_opt = 10.0 cm, Lc50 = 12.8 cm), this research recommends a minimum harvest size of 12 cm for M. gulio. Although the margin between Lc_opt and Lm is very narrow, setting the minimum capture size at Lopt (12 cm) would be a conservative buffer to ensure long-term sustainability [23,38]. This precautionary threshold ensures that most individuals have the opportunity to reproduce at least once before capture, while also aligning with the optimum yield length (Lopt). Because Lc50 is larger than Lm and Lopt, the gear starts capturing fish significantly above maturity, suggesting that current fishing gear is relatively selective and precautionary to support long-term sustainability of the M. gulio stock in Sundarbans, Bangladesh [38].
Table 4. Growth coefficient and length parameters (in cm) of M. gulio in different studies.
Study LocationLKLcLc_optReference
Sundarbans, Bangladesh21.0-12.810.0Present Study (2025)
The Malancha River, Bangladesh19.30.94--[19]
Sundarbans, Bangladesh23.00.758.53-[46]
The Meghna estuary, Bangladesh18.50.809.809.50[47]
The Krishna estuary, India21.00.6810.510.0[48]
The Ganga delta, India20.20.7010.210.0[49]
The Hoogly estuary, India17.60.859.509.20[50]

4.3. Stock Status and Exploitation of Mystus gulio

This study offers important insights into the exploitation pattern and stock status of M. gulio in Sundarbans, Bangladesh. The fishing mortality (F) relative to natural mortality (M) ratio is expressed as F/M, which is a widely used metric in fisheries’ stock assessment because it provides a standardized and biologically meaningful measure of fishing pressure relative to the natural loss of fish from the population [20]. F/M < 1 denotes that the fishing is considered sustainable or underexploited, F/M ≈ 1 indicates sustainable limits, and F/M > 1 indicates unsustainable depletion or collapse [31]. The F/M ratio was calculated at 0.90, well below the optimal benchmark of 1.0 [51]. This assessed low F/M value indicates minimal fishing pressure and reflects responsible regional harvesting practices. Supporting this, the exploitation rate (E = 0.46) also remains close but lower than the commonly accepted threshold of E = 0.5 for sustainable exploitation [52,53,54,55]. Together, these indicators underscore a low level of exploitation of M. gulio in Sundarbans, affirming its role as a relatively undisturbed habitat for this species, as supported by different studies conducted in Bangladesh and India (Table 5).
The biomass to biomass producing MSY (B/BMSY) ratio and current biomass to virgin biomass (B/B0) were analyzed using the LBB method to clarify the fishery stock’s condition. Stocks were classified according to the B/BMSY values as follows: healthy stock (B/BMSY > 1.1), slightly overfished (0.8 < B/BMSY ≤ 1.1), overfished (0.5 < B/BMSY ≤ 0.8), grossly overfished (0.2 < B/BMSY ≤ 0.5), and collapsed (B/BMSY ≤ 0.2) [20]. The estimated B/BMSY ratio in this research was 1.2, indicating a biomass level exceeding the required amount to reach the MSY, suggesting a healthy stock [20]. The healthy stock status of this research is supported by different studies (Table 6).
B/B0 is commonly used in data-limited stock assessments to evaluate how much of the original population remains, and it helps to quantify the depletion of fish stocks to guide management decisions and conservation strategies [20]. A B/B0 range from 0.4 to 0.5 is the precautionary biomass level that maintains sustainable yields without risking stock collapse [51]. The computed B/B0 value of 0.43 is within the biological limit threshold, which denotes that the current biomass retains 57% of its unexploited level. This suggests that only a tiny fraction of the stock has been harvested [20]. Similarly, the observed B/B0 (0.43) surpasses the BMSY/B0 reference value (0.36), further indicating that the stock is underharvested and exists in a biologically safe state [21].

4.4. Spawning Potential Ratio of Mystus gulio

The Spawning Potential Ratio (SPR) serves as an essential reference point in fisheries’ management indicating the reproductive capacity of a fish stock compared to its unfished state. The SPR is a dependable biological benchmark for evaluating how current fishing pressures affect a stock’s reproductive ability [21,31]. Various species have different SPR limits that act as biological reference points for sustainable fishing practices. The 30% SPR (0.3) often functions as a proxy limit below which recruitment can be hindered; this is commonly applied to multiple fish stocks worldwide [56]. A SPR range of 20–30% is frequently recommended to prevent recruitment overfishing, particularly in fisheries with limited data [57]. A 40% SPR (0.4) may serve as a target or more precautionary limit, especially for heavily fished stocks or vulnerable stocks [21]. Additionally, a 35% SPR is proposed as a reference for certain species where some reduction in spawning biomass is deemed acceptable [58], while a 50% SPR is regarded as a conservative target for sustainable fisheries to ensure strong reproductive capacity [59]. The LB-SPR model for M. gulio in Sundarbans indicated an SPR of 0.48, suggesting that the stock retains around 48% of its unfished reproductive capacity and can maintain adequate reproductive output for long-term sustainability. Consequently, the SPR value for M. gulio indicates a healthy spawning biomass, affirming that current fishing methods do not significantly threaten the population’s reproductive potential.

5. Conclusions

The current evaluation shows that M. gulio’s stock status is healthy. The exploitation rate (E) and the mortality ratio (F/M) suggest moderate fishing pressure close to the upper limits. With B/BMSY (1.20), stock biomass exceeds the level necessary for MSY, indicating sustainable fishing practices. The length at Lc > Lc_opt shows that fish are harvested after reaching an optimal size. B/B0 (0.43) and BMSY/B0 (0.36) indicate that biomass has dropped to 43% of unexploited levels, presenting an opportunity to rebuild stock resilience. SPR (0.48) suggests the stock is near the critical threshold of 0.4, below which reproduction could be at risk. Thus, E (0.46) is acceptable, allowing current fishing pressure to be sustained but not increased. However, metrics like SPR and B/B0 indicate a need for precautionary management for long-term sustainability. A minimum harvest size of 12 cm is recommended for M. gulio based on the estimated life history parameters. The current fishing gear is relatively selective and precautionary, which allows the majority of individuals to reproduce at least once prior to capture. Though the current fishing practice can promote the long-term sustainability of M. gulio stock in Sundarbans, Bangladesh, maintaining or enhancing the SPR ratio through careful management is advised. Ongoing assessments with length-based and other low-data methods should be conducted to refine exploitation estimates and monitor trends.

Author Contributions

M.T.R.O.: Data collection, data analysis, and draft writing. T.S.: Data processing, draft writing, and editing. D.G.: Draft writing and reviewing. R.A.: Data collection and editing. S.K.B.: Data collection, reviewing, and editing. M.M.S.: Reviewing and editing, M.M.H.M.: Editing and reviewing, P.S.: Reviewing, editing and funding, P.P.B.: Conceptualization, methodology, data processing, data analysis, editing, and reviewing. All authors have read and agreed to the published version of the manuscript.

Funding

There are no external funding sources for this research.

Institutional Review Board Statement

The study was entirely based on non-invasive, observational data collection. Length–frequency data were obtained from commercially exploited fish specimens that had already been caught and landed in a dead condition by local fishers at designated landing centers. These fish were part of the routine commercial catch, and no animals were sacrificed specifically for the purposes of this research. Data collection was conducted in accordance with institutional and national guidelines for research involving animals, ensuring full compliance with ethical standards for non-experimental field studies.

Informed Consent Statement

Not applicable.

Data Availability Statement

Data will be made available by the corresponding author upon request.

Acknowledgments

The authors thank the Department of Fishery Resources Conservation and Management, Faculty of Fisheries and Ocean Sciences, Khulna Agricultural University, Khulna-9100, for their kind cooperation and support during sampling.

Conflicts of Interest

The authors declare no conflicts of interest.

References

  1. Hoq, M.E. Sundarbans fisheries: A livelihood option for the coastal people of Bangladesh. In Proceedings of the 8th Asian Fisheries Forum, Kochi, India, 20–23 November 2007; Bangladesh Fisheries Research Institute: Mymensingh, Bangladesh, 2008. [Google Scholar]
  2. Habib, A.; Hossain, M.S.; Islam, M.R.; Das, N.G. Fish biodiversity of the Sundarbans mangrove ecosystem in Bangladesh: Present status and challenges. Aquat. Ecosyst. Health Manag. 2020, 23, 261–273. [Google Scholar]
  3. Department of Fisheries (DoF). Yearbook of Fisheries Statistics of Bangladesh 2022–2023; Ministry of Fisheries and Livestock, Government of the People’s Republic of Bangladesh: Dhaka, Bangladesh, 2023.
  4. Shafi, M.; Quddus, M.M.A. Bangladesh: The Living Fisheries; University of Dhaka: Dhaka, Bangladesh, 2001. [Google Scholar]
  5. Huda, M.S.; Haque, M.M.; Sultana, M. Fisheries of the Sundarbans. In The Ecosystem of the Sundarbans and Management Options; Islam, M.A., Ed.; BFRI & DoF: Dhaka, Bangladesh, 2003; pp. 125–138. [Google Scholar]
  6. Ray, S.; Barman, S.; Sarma, D. Small indigenous fish species of India: Significance, conservation and utilization. J. Bioresour. Sustain. Dev. 2014, 1, 1–10. [Google Scholar]
  7. Tripathi, S.D. Present status and future prospects of catfish culture in India. Aquac. Asia 1996, 1, 13–15. [Google Scholar]
  8. Sarker, M.N.; Rahman, M.M.; Dewan, S. Food and feeding habits of Mystus gulio (Hamilton) in the River Padma. Bangladesh J. Fish. Res. 2002, 6, 47–54. [Google Scholar]
  9. Begum, M.; Alam, M.J.; Islam, M.A.; Pal, H.K. Artificial breeding and nursery management of indigenous catfish, Mystus gulio. Progress. Agric. 2008, 19, 117–124. [Google Scholar]
  10. Haniffa, M.A. Breeding and culture of indigenous catfishes of India. Aquac. Asia Mag. 2009, 14, 14–17. [Google Scholar]
  11. Islam, S.M.M.; Bhuiyan, A. Sundarbans mangrove forest of Bangladesh: Causes of degradation and sustainable management options. Environ. Sustain. 2018, 1, 113–131. [Google Scholar] [CrossRef]
  12. Mahmood, N.; Rahman, M.M.; Hossain, M.S. Declining fish biodiversity in the Sundarbans mangrove ecosystem: Status, causes and management. Reg. Stud. Mar. Sci. 2021, 45, 101838. [Google Scholar] [CrossRef]
  13. Ghosh, A.K.; Roy, P. Fisheries decline in the Sundarbans: A socio-ecological assessment of vulnerabilities and adaptation. Ocean Coast. Manag. 2022, 225, 106254. [Google Scholar]
  14. Patra, R.W.; Azad, S.A.; Alam, M.J. Studies on catch trends and production decline of Mugil cephalus in the Sundarbans. Bangladesh J. Fish. Res. 2005, 9, 15–22. [Google Scholar]
  15. Kibria, M.G. Growth performance and feed utilization of Mystus gulio under different feeding regimes. Aquac. Res. Lett. 2024, 5, 12–20. [Google Scholar]
  16. Sabbir, W.; Islam, M.N.; Hasan, M.M. Food and feeding habits of Mystus gulio (Hamilton, 1822) from the Meghna estuary, Bangladesh. J. Fish. 2017, 5, 55–60. [Google Scholar]
  17. Hossain, M.A.R.; Nahiduzzaman, M.; Saha, D.; Alam, M.T. Gonadal development and spawning season of Mystus gulio in the southwestern region of Bangladesh. J. Bangladesh Agric. Univ. 2016, 14, 47–54. [Google Scholar]
  18. Hossain, M.A.R.; Nahiduzzaman, M.; Saha, D. Length-weight relationship and condition factor of Mystus gulio in different coastal habitats of Bangladesh. Egypt. J. Aquat. Res. 2018, 44, 135–139. [Google Scholar] [CrossRef]
  19. Rahman, M.M.; Islam, M.S.; Ahmed, K. Preliminary stock assessment of Mystus gulio in the Satkhira region using surplus production models. Reg. Stud. Fish. Manag. 2024, 9, 88–96. [Google Scholar]
  20. Froese, R.; Winker, H.; Coro, G.; Demirel, N.; Tsikliras, A.C.; Dimarchopoulou, D.; Scarcella, G.; Probst, W.N.; Dureuil, M.; Pauly, D. A new approach for estimating stock status from length frequency data. ICES J. Mar. Sci. 2018, 75, 2004–2015, Erratum in ICES J. Mar. Sci. 2019, 76, 50–60. [Google Scholar] [CrossRef]
  21. Hordyk, A.R.; Ono, K.; Valencia, S.R.; Loneragan, N.R.; Prince, J.D. A novel length-based empirical estimation method of spawning potential ratio (SPR), and tests of its performance, for small-scale, data-poor fisheries. ICES J. Mar. Sci. 2015, 72, 217–231. [Google Scholar] [CrossRef]
  22. von Bertalanffy, L. A quantitative theory of organic growth (inquiries on growth laws II). Hum. Biol. 1938, 10, 181–213. [Google Scholar]
  23. Beverton, R.J.H.; Holt, S.J. On the Dynamics of Exploited Fish Populations; Chapman and Hall: London, UK, 1957; p. 179. [Google Scholar]
  24. Quinn, T.J.; Deriso, R.B. Quantitative Fish Dynamics; Oxford University Press: Oxford, UK, 1999. [Google Scholar]
  25. Sparre, P.; Venema, S.C. Introduction to Tropical Fish Stock Assessment. Part 1: Manual; FAO Fisheries Technical Paper No. 306/1, Rev. 2; FAO: Rome, Italy, 1998. [Google Scholar]
  26. Beverton, R.J.H. Patterns of reproductive strategy parameters in some marine teleost fishes. J. Fish Biol. 1992, 41, 137–160. [Google Scholar] [CrossRef]
  27. Chong, L.; Hordyk, A.R.; Pilling, G.M.; Davies, C.R. Performance evaluation of a length-based method for data-limited fisheries. ICES J. Mar. Sci. 2020, 77, 483–496. [Google Scholar] [CrossRef]
  28. Dowling, N.A.; Dichmont, C.M.; Smith, D.C. Simple methods for estimating stock status from length frequency data. Fish Fish. 2019, 20, 1051–1071. [Google Scholar] [CrossRef]
  29. Pons, M.; Prince, J.D.; Hordyk, A.R.; Kell, L.T.; Hillary, R.M. Developing empirical harvest strategies for data-poor fisheries: A case study from Uruguay. Fish Fish. 2019, 20, 183–200. [Google Scholar] [CrossRef]
  30. Babcock, E.A.; Hordyk, A.R.; Prince, J.D.; Walters, C.J. Even simple fisheries models can have complex dynamics: A cautionary tale for data-poor assessment. Mar. Coast. Fish. 2018, 10, 517–531. [Google Scholar] [CrossRef]
  31. Prince, J.D.; Hordyk, A.R.; Valencia, S.R.; Loneragan, N.R.; Sainsbury, K.J. Revisiting the concept of Beverton–Holt life history invariants with the aim of informing data-poor fisheries assessment. ICES J. Mar. Sci. 2015, 72, 194–203. [Google Scholar] [CrossRef]
  32. Froese, R.; Binohlan, C. Empirical relationships to estimate asymptotic length, length at first maturity and length at maximum yield per recruit in fishes, with a simple method to evaluate length frequency data. J. Fish Biol. 2000, 56, 758–773. [Google Scholar] [CrossRef]
  33. Prince, J.D.; Hordyk, A. Length-based spawning potential ratio: A new approach for estimating fish stock reproductive potential and sustainability using length data. Fish Fish. 2019, 20, 135–152. [Google Scholar] [CrossRef]
  34. Cope, J.M.; Punt, A.E. Length-based reference points for data-limited situations: Applications and restrictions. Mar. Coast. Fish. 2009, 1, 169–186. [Google Scholar] [CrossRef]
  35. Costello, C.; Ovando, D.A.; Hilborn, R.; Gaines, S.D.; Deschenes, O.; Lester, S.E. Status and solutions for the world’s unassessed fisheries. Science 2012, 338, 517–520. [Google Scholar] [CrossRef]
  36. Kleisner, K.M.; Pauly, D.; Froese, R. Using length-frequency data to estimate fishing mortality and stock status of marine fishes. ICES J. Mar. Sci. 2013, 70, 217–226. [Google Scholar] [CrossRef]
  37. Palomares, M.L.D.; Froese, R.; Pauly, D. Length-based methods in fisheries research: Applications and recommendations. Fish. Res. 2018, 204, 203–212. [Google Scholar] [CrossRef]
  38. Froese, R. Keep it simple: Three indicators to deal with overfishing. Fish Fish. 2004, 5, 86–91. [Google Scholar] [CrossRef]
  39. Winker, H.; Carvalho, F.; Kapur, M. JABBA: Just Another Bayesian Biomass Assessment. Fish. Res. 2018, 204, 275–288. [Google Scholar] [CrossRef]
  40. Froese, R.; Winker, H.; Gascuel, D.; Sumaila, U.R.; Pauly, D. Bottom-up, fisheries-independent indicators of the status of marine fish stocks and ecosystems: Evaluating a pilot set. ICES J. Mar. Sci. 2012, 69, 1065–1073. [Google Scholar] [CrossRef]
  41. Shin, Y.-J.; Rochet, M.-J.; Jennings, S.; Field, J.G.; Gislason, H. Using size-based indicators to evaluate the ecosystem effects of fishing. ICES J. Mar. Sci. 2005, 62, 384–396. [Google Scholar] [CrossRef]
  42. Millar, R.B.; Fryer, R.J. Estimating the size-selection curves of towed gears, traps, nets and hooks. Rev. Fish Biol. Fish. 1999, 9, 89–116. [Google Scholar] [CrossRef]
  43. Punt, A.E.; Smith, A.D.M.; Cui, G. Review of progress in the introduction of management strategy evaluation (MSE) for Australia’s south east fishery. Mar. Freshw. Res. 2000, 52, 719–726. [Google Scholar] [CrossRef]
  44. Maunder, M.N.; Punt, A.E. A review of integrated analysis in fisheries stock assessment. Fish. Res. 2013, 142, 61–74. [Google Scholar] [CrossRef]
  45. Froese, R.; Winker, H.; Gascuel, D.; Sumaila, U.R.; Pauly, D. Minimizing the impact of fishing. Fish Fish. 2016, 17, 785–802. [Google Scholar] [CrossRef]
  46. Mustafa, M.G.; Hossain, M.A.R.; Kabir, K.M.R. Assessment of the fish stock status in the Sundarbans mangrove ecosystem, Bangladesh. Indian J. Geo-Mar. Sci. 2019, 48, 187–193. [Google Scholar]
  47. Islam, M.A.; Alam, M.T.; Hossain, M.B. Population dynamics and stock assessment of Coilia dussumieri from the Meghna estuary, Bangladesh. J. Appl. Ichthyol. 2018, 34, 615–621. [Google Scholar] [CrossRef]
  48. Srinivasa, A.R.; Rao, G.R.; Kumar, V. Length-based stock assessment of Coilia dussumieri in the Krishna estuary, India. J. Aquat. Biol. Fish. 2021, 9, 35–42. [Google Scholar]
  49. Naser, N.M.; Das, B.K.; Paul, S.K. Biological parameters and exploitation level of Coilia dussumieri in the Ganga delta region, India. Indian J. Fish. 2020, 67, 78–84. [Google Scholar]
  50. Bhakta, J.N.; Ghosh, A.R.; Datta, N.C. Length-based population parameters and exploitation status of Coilia dussumieri from the Hooghly estuary, India. Int. J. Fish. Aquat. Stud. 2016, 4, 10–15. [Google Scholar]
  51. Froese, R.; Coro, G.; Kleisner, K.M.; Demirel, N. Revisiting safe biological limits in fisheries. Fish Fish. 2017, 18, 758–771. [Google Scholar] [CrossRef]
  52. Pauly, D.; Ingles, J. Aspects of the growth and natural mortality of exploited coral reef fishes. ICLARM Conf. Proc. 1981, 4, 89–98. [Google Scholar]
  53. Pauly, D. Some Simple Methods for the Assessment of Tropical Fish Stocks; FAO Fisheries Technical Paper No. 234; FAO: Rome, Italy, 1983. [Google Scholar]
  54. Barman, S.K.; Hossain, M.J.; Shesir, M.A.R.; Hossain, S.; Barman, P.P. Stock status and spawning potential ratio of orange mud crab (Scylla olivacea, Herbst 1796) in the southwestern coastal waters of Bangladesh. Heliyon 2024, 10, e39283. [Google Scholar] [CrossRef]
  55. Barman, P.P.; Liu, Q.; Al-Mamun, M.A.; Schneider, P.; Mozumder, M.M.H. Stock assessment of exploited sardine populations from northeastern Bay of Bengal water, Bangladesh using the length-based Bayesian biomass (LBB) method. J. Mar. Sci. Eng. 2021, 9, 1137. [Google Scholar] [CrossRef]
  56. Rosenberg, A.A.; Restrepo, V.R. Uncertainty and risk evaluation in stock assessment advice for U.S. marine fisheries. Can. J. Fish. Aquat. Sci. 1994, 51, 2715–2720. [Google Scholar] [CrossRef]
  57. Goodyear, C.P. Spawning stock biomass per recruit in fisheries management: Foundation and current use. Can. Spec. Publ. Fish. Aquat. Sci. 1993, 120, 67–81. [Google Scholar]
  58. Gulland, J.A. Fish Stock Assessment: A Manual of Basic Methods; FAO/Wiley Series on Food and Agriculture: Rome, Italy, 1983. [Google Scholar]
  59. Legault, C.M.; Restrepo, V.R. A Flexible Forward Age-Structured Population Dynamics Model; NOAA Technical Memorandum NMFS-F/NEC-104; National Marine Fisheries Service: Silver Spring, MD, USA, 1993.
Figure 1. Map of the study area (source: authors, 2025).
Fishes 10 00300 g001
Figure 2. Length–frequency distribution of M. gulio collected from six sampling sites.
Fishes 10 00300 g002
Figure 3. LBB-derived findings for M. gulio in Bangladesh’s Sundarbans waters.
Fishes 10 00300 g003
Figure 4. Output from the LB-SPR assessment for M. gulio in Sundarbans, Bangladesh, shows the length–frequency histogram with SPR overlay (in top-left panel), the selectivity and maturity ogives (in top-right panel), the length vs. relative age curve (in bottom-left panel), and the performance indicator vs. relative fishing mortality (F/M) (in bottom-right panel).
Fishes 10 00300 g004
Figure 5. Output from the LB-SPR assessment for M. gulio in Sundarbans, Bangladesh, shows the distribution of selectivity for SL50% and SL95%, relative fishing mortality (F/M), and SPR (in left panel). Right panel shows the sample observed vs. the target size structure, with the target SPR limit set at 40%.
Fishes 10 00300 g005
Table 1. Inputs and prior values of LBB and LB-SPR analysis for M. gulio in Sundarbans, Bangladesh.
MethodsParametersValues
Input values for LBB Min (mm)50
Max (mm)200
Class Interval (mm)5.0
Individual Number1180
Linf Prior (cm)20.0
Z/K Prior1.80
M/K Prior1.50
F/K Prior0.27
Lc Prior11.7
Alpha Prior44.7
Input values for LB-SPRL (cm)21.0
M/K1.98
L50 (cm)/Lm9.16
L95 (cm)16.07
Table 2. Stock information of M. gulio in Sundarbans, Bangladesh, from LBB analysis.
Length Parameters cmDifferent Length RatiosStock Information
Lmean14.4Lc_opt/Linf0.49M/K1.98
Linf21.0Lopt/Linf0.57F/M0.90
Lc 12.8Lc/Linf0.61F/K1.80
Lc_opt10.0Lmean/Lopt1.20Z/K3.90
Lc5012.8Lc/Lc_opt1.30B/B00.43
Lc9515.0L95th/Linf0.93B/BMSY1.20
L95th19.5E0.46BMSY/B00.36
Lopt12.0Lc/Lopt1.28
Stock StatusHealthy stock and safe exploitation of M. gulio in Bangladesh.
Table 3. Output of LB-SPR model for M. gulio in Sundarbans, Bangladesh.
ParametersValues
SL50% (cm)13.37
SL95% (cm)16.07
F/M1.95
SPR0.48
Table 5. Mortality and exploitation status of M. gulio in different studies.
Study LocationM/KZ/KF/KF/MEReference
Sundarbans, Bangladesh1.983.91.80.90.46Present Study (2025)
The Malancha River, Bangladesh1.603.62.91.80.63[19]
Sundarbans, Bangladesh2.124.01.90.90.47[46]
The Meghna estuary, Bangladesh1.202.31.10.90.48[47]
The Krishna estuary, India1.001.60.90.90.40[48]
The Ganga delta, India1.101.91.00.90.47[49]
The Hoogly estuary, India1.32.51.20.90.49[50]
Table 6. Stock health condition of M. gulio in different studies.
Study LocationStock StatusReference
Sundarbans, BangladeshHealthyPresent Study (2025)
The Malancha River, BangladeshOverexploited[19]
Sundarbans, BangladeshFully exploited[46]
The Meghna estuary, BangladeshFully exploited[47]
The Krishna estuary, IndiaHealthy[48]
The Ganga delta, IndiaHealthy[49]
The Hoogly estuary, IndiaFully exploited[50]
Disclaimer/Publisher’s Note: The statements, opinions and data contained in all publications are solely those of the individual author(s) and contributor(s) and not of MDPI and/or the editor(s). MDPI and/or the editor(s) disclaim responsibility for any injury to people or property resulting from any ideas, methods, instructions or products referred to in the content.

