Article

Survival Estimates of Endangered Shortnose Sturgeon (Acipenser brevirostrum Lesueur, 1818) from Geographically Disjunct Population Segments

by
Evan C. Ingram
1,*,†,
Amanda L. Higgs
2,3,
Liam Butler
4,
Dewayne A. Fox
5 and
Adam G. Fox
6
1
School of Marine and Atmospheric Sciences, Stony Brook University, Stony Brook, NY 11794, USA
2
Department of Natural Resources, Cornell University, Ithaca, NY 14853, USA
3
Division of Marine Resource, New York State Department of Environmental Conservation, New Paltz, NY 12561, USA
4
Department of Systems and Control Engineering, Faculty of Engineering, University of Malta, Msida MSD 2080, Malta
5
Department of Agriculture and Natural Resources, Delaware State University, Dover, DE 19901, USA
6
Warnell School of Forestry and Natural Resources, University of Georgia, Athens, GA 30602, USA
*
Author to whom correspondence should be addressed.
Current address: Atlantic States Marine Fisheries Commission, Arlington, VA 22201, USA.
Fishes 2025, 10(6), 293; https://doi.org/10.3390/fishes10060293
Submission received: 19 April 2025 / Revised: 10 June 2025 / Accepted: 12 June 2025 / Published: 17 June 2025
(This article belongs to the Section Biology and Ecology)

Abstract

The complex life history and stock structure of endangered shortnose sturgeon (Acipenser brevirostrum) may hinder recovery efforts for individually managed river populations in the US. Reliable survival estimates are essential for evaluating population trends and guiding conservation amid ongoing and emergent threats. However, such estimates are scarce in the recent literature and available for only a few wild populations, with their usefulness in practical management limited. In this study, we leverage multi-year acoustic telemetry data from monitoring projects in the Hudson River, New York (2012–2015), and Altamaha River, Georgia (2011–2014), to develop and compare survival estimates for spawning populations at opposite ends of the species’ US geographic range. Bayesian multistate capture–recapture models indicated high and precise apparent monthly adult survival in both the Hudson (0.991; 95% Bayesian credibility interval [CI]: 0.984–0.996) and Altamaha (0.980; 95% CI: 0.969–0.989) rivers, with implied annual survival rates of 0.897 and 0.787, respectively. Overall, this study advances our understanding of clinal variation in key demographic parameters and underscores the need to develop regionally specific goals for recovery. Broadening the estimates through increased telemetry coverage and integration of additional data will strengthen recovery efforts and support the long-term persistence of shortnose sturgeon across their range.
Key Contribution: Development and comparison of survival estimates for endangered shortnose sturgeon populations at opposite ends of the species’ US geographic range.

1. Introduction

The shortnose sturgeon (Acipenser brevirostrum Lesueur, 1818) is an imperiled species historically distributed across major Atlantic coast estuaries of North America [1,2,3,4]. During the late 19th and early 20th centuries, fisheries exploitation and the development and industrialization of coastal waterways precipitated a marked decline in abundance throughout the species’ range [5,6,7]. Shortnose sturgeon were initially designated as endangered in the United States under the Endangered Species Preservation Act of 1967 and are currently protected as a single, range-wide stock under the Endangered Species Act (ESA) [8]. Although concomitant conservation efforts have largely prevented further stock reductions, individually managed river population units have yet to recover to abundance thresholds necessary for delisting [8,9]. The current range of rivers occupied by shortnose sturgeon remains highly fragmented and significantly reduced from its historic extent. Notable extirpations of spawning populations in rivers between Chesapeake Bay and the North Carolina–South Carolina border have resulted in a pronounced gap in the species’ distribution, effectively separating northern and southern populations segments [4]. Despite documentation of amphidromous migrations into coastal marine waters by adult shortnose sturgeon in other parts of the range, there is no evidence of successful recolonization in this region [10,11,12].
Shortnose sturgeon are characterized by a relatively long lifespan and a late age of sexual maturity. However, significant clinal variation in these life history traits is evident between population segments [4]. Individuals in river systems north of Chesapeake Bay may reach ages of up to 70 years [5], whereas maximum ages of around 20 years have been reported for populations south of Chesapeake Bay [13]. Although the average length at maturity is similar across the species’ range (i.e., ≥500 mm fork length (FL) or 550 mm total length (TL) for males and females [14]), slower growth rates in northern populations result in delayed maturity and more protracted life histories compared to those in southern populations [5,14]. The localized population dynamics for shortnose sturgeon typically mirror regional abundance trends, with the largest and most viable populations generally occurring in rivers north of Chesapeake Bay, such as the Saint John (New Brunswick, Canada; 18,000 adults [5]), Hudson (New York/New Jersey; 56,708 adults [9]), and Delaware rivers (14,000 adults [15]). In contrast, population estimates for rivers south of Chesapeake Bay are generally below 2500 adults, with the notable exception of the Altamaha River in Georgia, which is estimated to support a dynamic population of 2218 to over 6000 adults [16,17]. Consequently, southern populations appear to face a higher risk of local extirpation than those in the north [18].
The complex and highly dynamic stock structure of shortnose sturgeon may limit the ability of individual river populations to recover effectively from increased mortality caused by ongoing or emergent threats [19]. Although range-wide protections for shortnose sturgeon have long been established against directed harvest, concerns persist that even moderate increases in mortality of ~7% could undermine the recovery of individual populations [8]. Documented threats, including river dredging, water quality deterioration, incidental bycatch, and poaching, may act to further compound these risks [20,21,22]. As such, reliable estimates of survival and mortality are crucial for tracking abundance trends within and among populations. However, such estimates are challenging to obtain and have largely been derived through catch curve analysis [23] and traditional capture–mark–recapture analysis or inferred indirectly from life history invariants [24,25,26]. These methods are likely of limited use in practical management applications for shortnose sturgeon, as small sample sizes or recapture rates can result in highly imprecise estimates, and the investigation of assumed rates—while useful for capturing broad life history trends—cannot account for species differences or allow for the characterization of local or temporal effects.
Electronic tagging and monitoring have emerged as vital tools for estimating the demographic parameters necessary to model endangered populations, with acoustic telemetry being particularly effective for studying species that are long-lived and wide-ranging [27]. This approach uses fixed-position arrays of acoustic receivers to collect location data from telemetered fish, allowing for longer-term monitoring over large geographic areas and enabling more efficient estimation of demographic parameters. Acoustic telemetry has been successfully employed to quantify survival and mortality for other congeneric species of sturgeon, including the Atlantic Sturgeon (A. oxyrinchus oxyrinchus [28,29,30]), green sturgeon (A. medirostris [31]), Gulf sturgeon (A. oxyrinchus desotoi [32]), and lake sturgeon (A. fulvescens [33]). However, despite the recent proliferation of telemetry tagging studies conducted on shortnose sturgeon to investigate their migratory behaviors and habitat use [11,34], acoustic telemetry has not yet been applied to estimate river-specific survival rates for this species.
Here, our objective is to leverage acoustic telemetry detections collected from previous studies spanning multiple years to estimate apparent survival rates of adult shortnose sturgeon in two geographically disjunct river systems: the Hudson River in New York and the Altamaha River in Georgia. These rivers support the healthiest and, arguably, the most well-studied shortnose sturgeon populations in their respective regions, offering a unique opportunity to develop and compare robust, independent survival estimates from spawning populations at opposite ends of the species’ US geographic range. As such, these two rivers were selected not only for the quality and depth of existing data but also because they represent key geographic reference points in the species’ range, providing valuable context for conservation planning across distinct ecological and geographical settings.

2. Materials and Methods
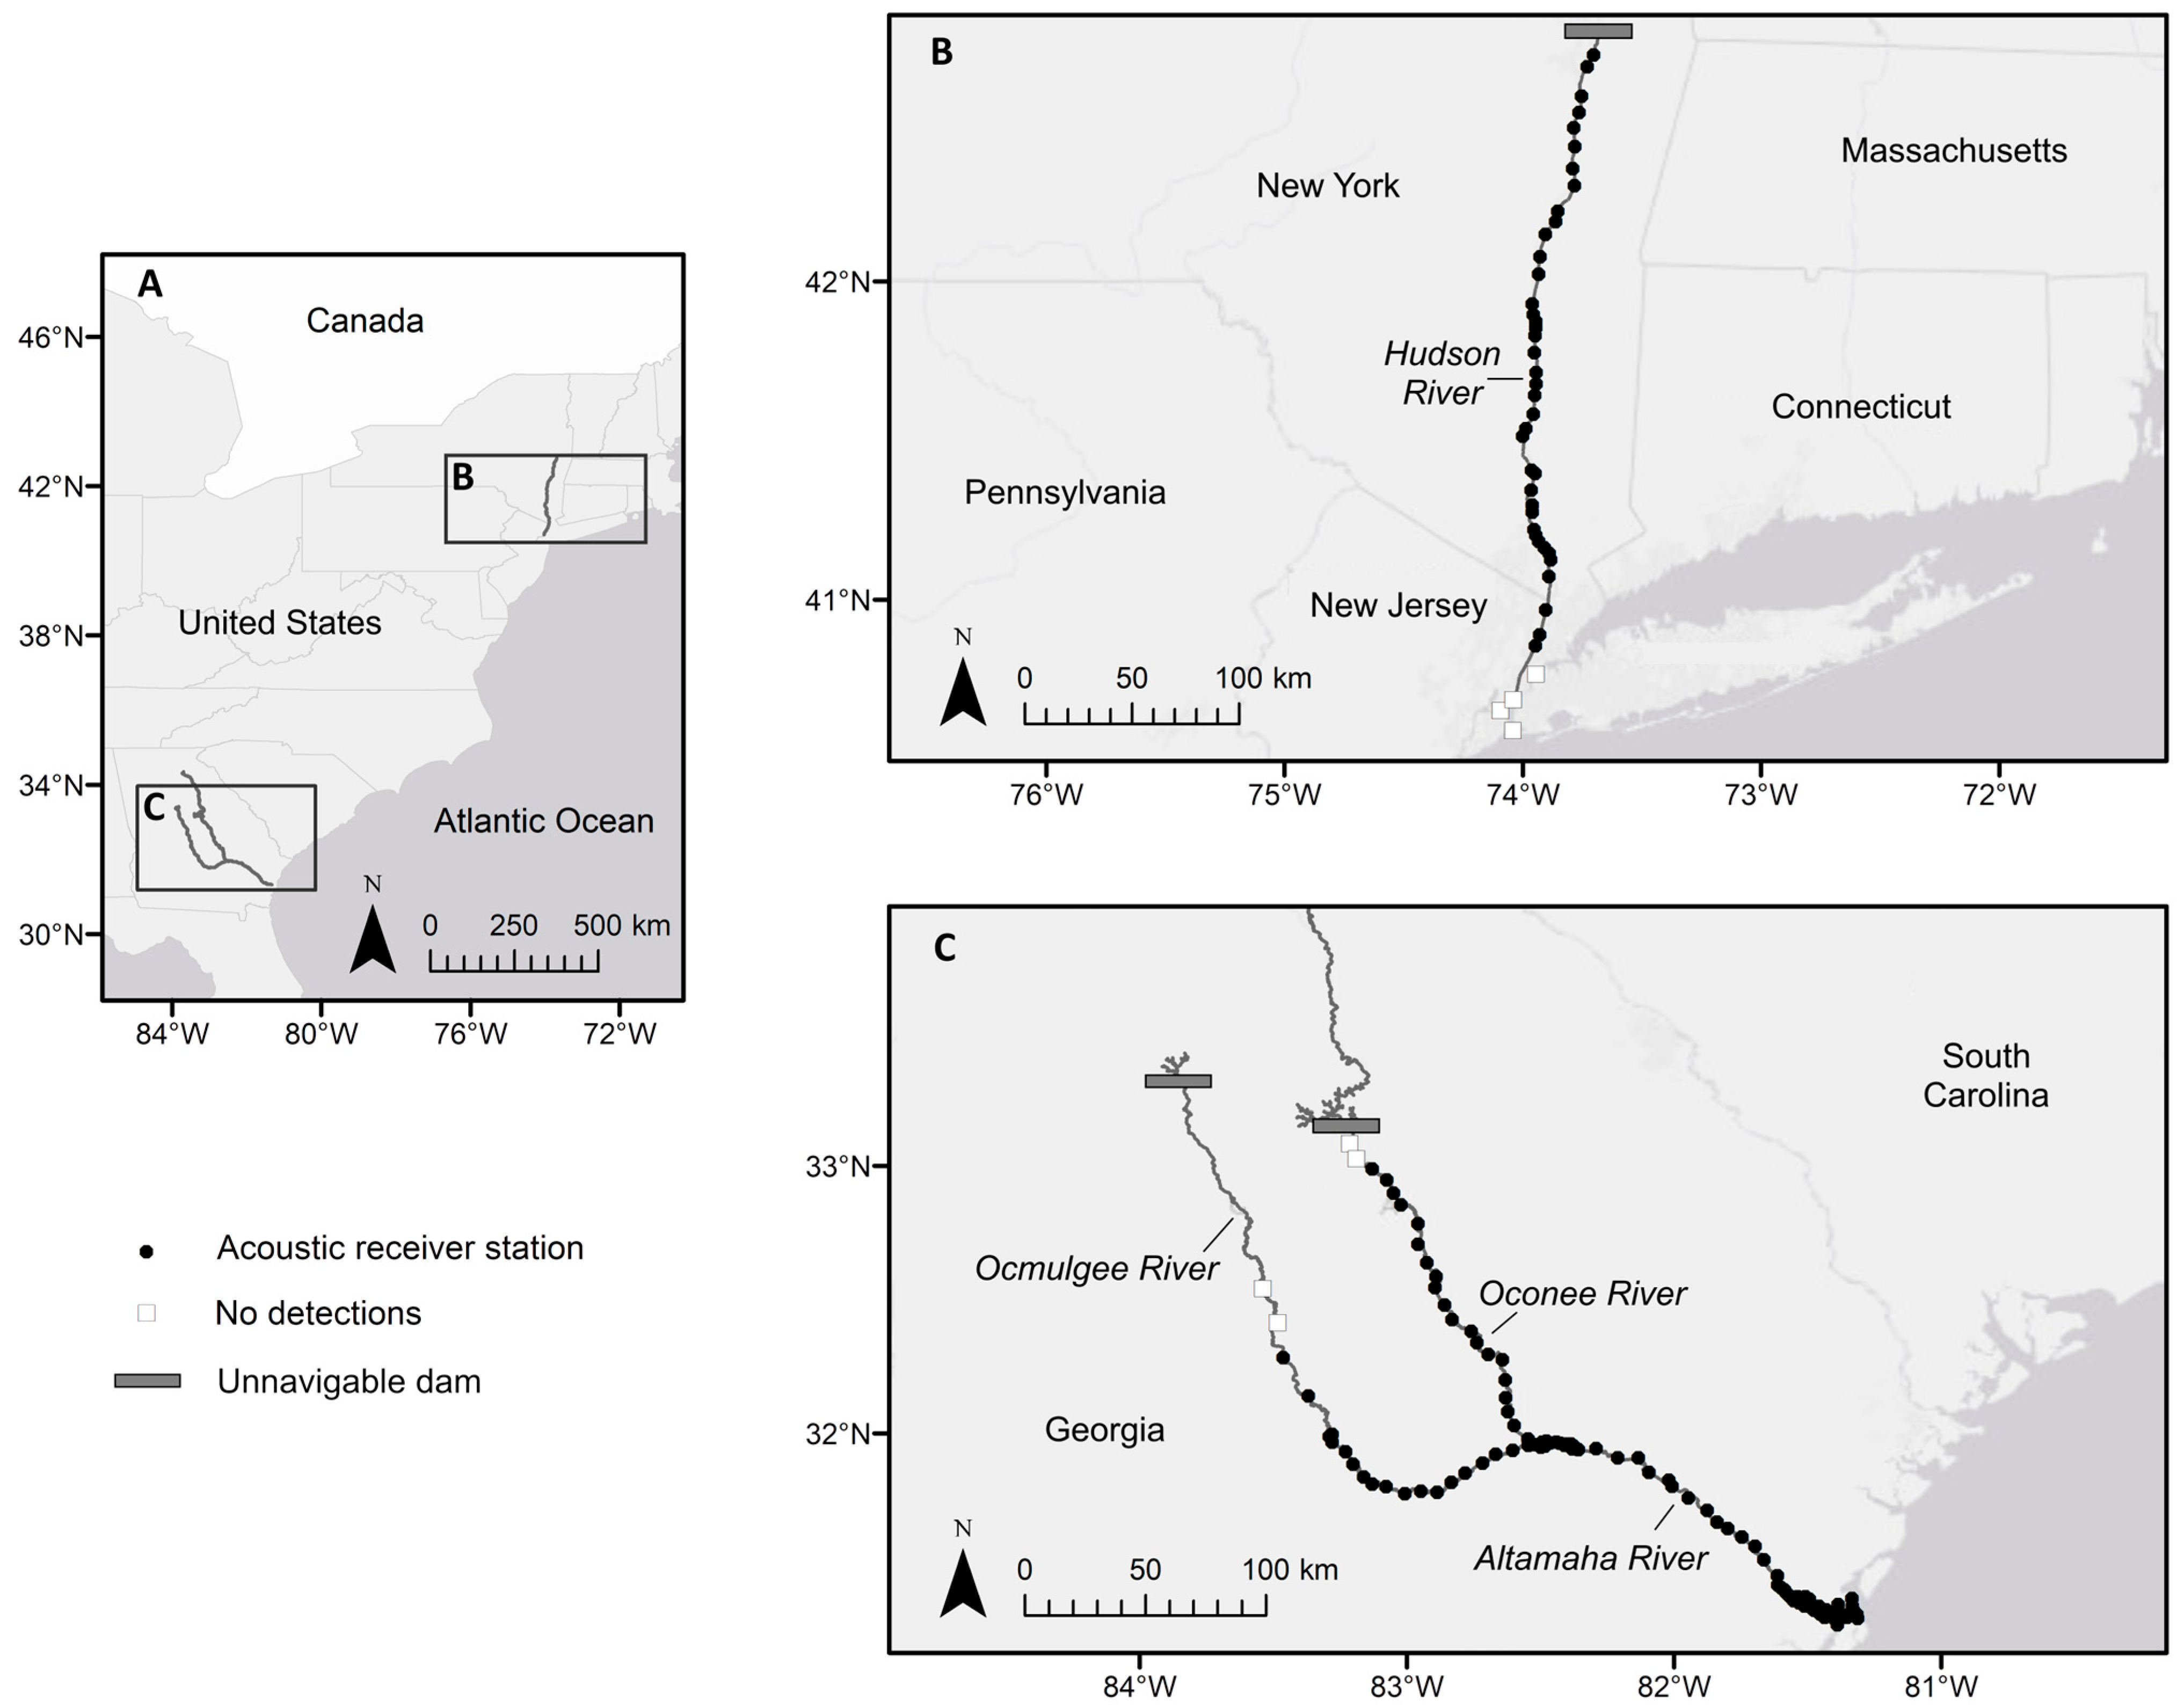
2.1. Study Sites

2.1.1. Hudson River

Shortnose sturgeon in the Hudson River in New York are managed under New York’s endangered species regulations, which grant the state the ability to safeguard or mitigate impacts on endangered fish species. The Hudson flows generally southward through eastern New York for 507 km before discharging into the Atlantic Ocean via New York Bay (Figure 1). The main channel is fragmented by the Federal Dam and Lock near river kilometer (rkm) 246, forming an impassable barrier to shortnose sturgeon. The lower Hudson River, extending from immediately south of the dam to the Battery at the southern tip of Manhattan Island (rkm 0), is suspected to support the largest population of shortnose sturgeon in the United States [9]. This section of the river is characterized by distinct channel morphologies that reflect the underlying geological variation, ranging from tidally influenced freshwater channel to mesohaline fjord [35]. The waterway is highly developed near New York City and is maintained as a navigable shipping channel that is periodically dredged. Periods of increased discharge during the spring and fall months are associated with snowmelt and rain, respectively, and the location of the salt front (i.e., saltwater–freshwater interface, defined as the upper limit of saltwater intrusions where salinity = 0.1 ppt) varies widely depending on freshwater input and tidal amplitude, but typically occurs between rkm 17 and 34 during high flow and between rkm 100 and 135 during periods of low flow [36,37,38]. During winter, the estuary may become entirely ice-covered, although tidal action and vessel traffic act to disrupt ice formation [39].

2.1.2. Altamaha River

The Altamaha River in Georgia represents the southern margin of the shortnose sturgeon’s spawning range (Figure 1). Shortnose sturgeon in this river are managed under Georgia’s Endangered Wildlife Act, which regulates the capture, killing or selling of protected species and the protection of the habitat of the species on public lands. In contrast to the Hudson River and most other large, highly urbanized river systems that are found along the US Atlantic seaboard, the Altamaha River watershed is relatively undisturbed, and its estuary remains largely undeveloped [40]. The main channel of the Altamaha originates at the confluence of the Ocmulgee and Oconee Rivers and flows southeast for 207 rkms before emptying into the Atlantic Ocean. Tidal influence extends approximately 54 rkm upstream from the river mouth, with the salt front typically occurring between rkms 35 and 50 [41]. Despite the presence of dams above the fall line on both main tributaries, nearly the entire extent of historically available habitat remains accessible to shortnose sturgeon. Although juveniles and spawning adults have been documented near the confluence and in both tributaries during the winter months, the estuary represents the primary habitat of shortnose sturgeon [34]. During summer, individuals are primarily limited to deeper areas of the main channel near the freshwater–saltwater interface [17,34].

2.2. Acoustic Telemetry Monitoring

The capture and handling of shortnose sturgeon was authorized by the National Marine Fisheries Service (endangered species permits 16436, 16439, and 16482). Shortnose sturgeon were targeted with set gill nets deployed in the estuarine reaches of the Hudson River in New York during 2012 through 2014 and in the Altamaha River in Georgia during 2011 through 2013 [34,42]. Wild-caught individuals were identified and distinguished from sympatric species [2,43]. Biological measurements of FL, TL, and weight were recorded, and fish were examined for the presence of internal and external tags (Tables S1 and S2). Because of the difficulty in discerning sex and maturity for shortnose sturgeon in field conditions, a criterion of 550 mm TL was used to assign wild-caught individuals as adults [14,44]. Adult fish were surgically implanted with a uniquely coded Lotek MM-MR-16-50 (Hudson River; 69 kHz; tag delay 60 s; estimated battery life = 389 d) or VEMCO V16-4H (Altamaha River; 69 kHz; tag delay 30–90 s; estimated battery life = 1248 d) acoustic transmitter by using the recommendations of Boone et al. [45]. Movements of telemetered fish were monitored using fixed arrays of acoustic receivers (VEMCO VR2W) maintained throughout estuarine and main channel habitats of the Hudson and Altamaha rivers (Figure 1). The Hudson River receiver array consisted of 45 unique stations deployed irregularly during 1 April 2012 through 31 October 2015. There was limited telemetry coverage during the winter months when navigational aids used as attachment points were removed to prevent damage from ice [46]. During these periods, supplementary receiver arrays maintained by collaborative partners in the coastal marine waters of New York were available to provide detection data from potential emigrants. In the Altamaha River, a receiver array consisting of 112 unique stations was deployed year-round from 1 April 2011 through 31 March 2014 [34,47]. Transmitters from fish that were tagged in the Altamaha River also had the potential to be detected on receiver arrays that were maintained in near-adjacent coastal Georgia drainages, including the Ogeechee, Satilla, and St. Marys Rivers.

2.3. Bayesian Multistate Capture–Recapture
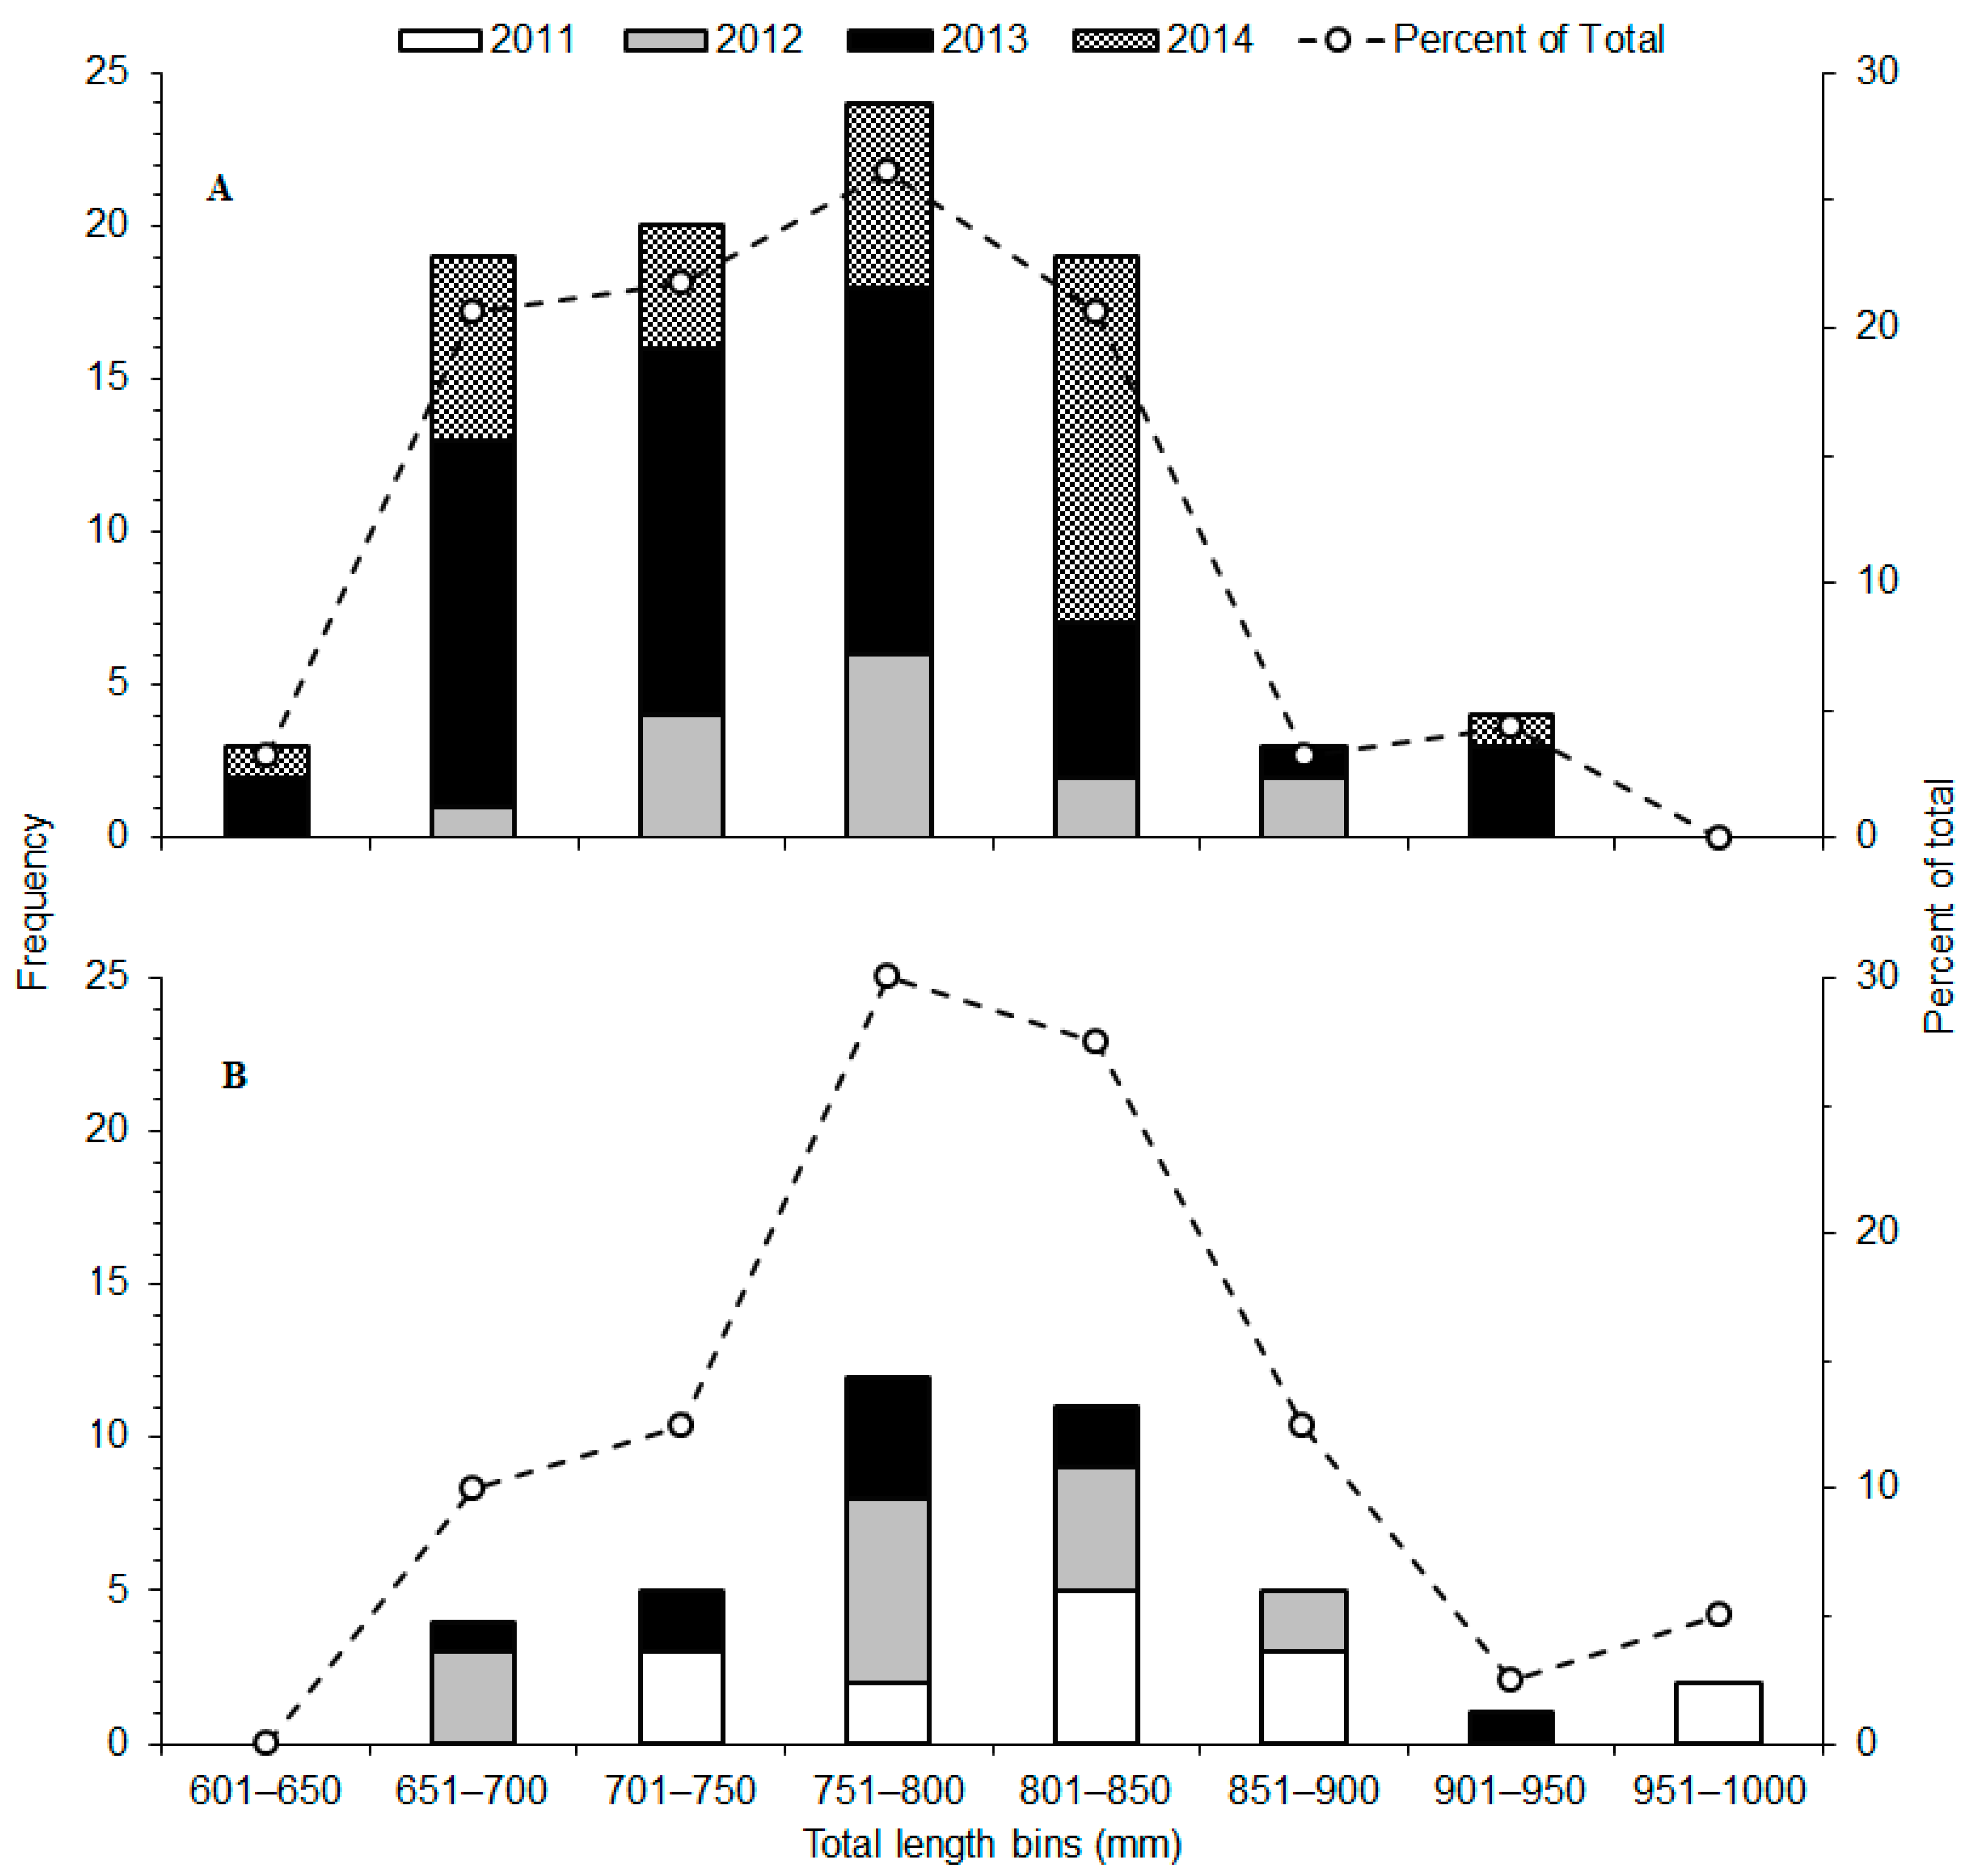
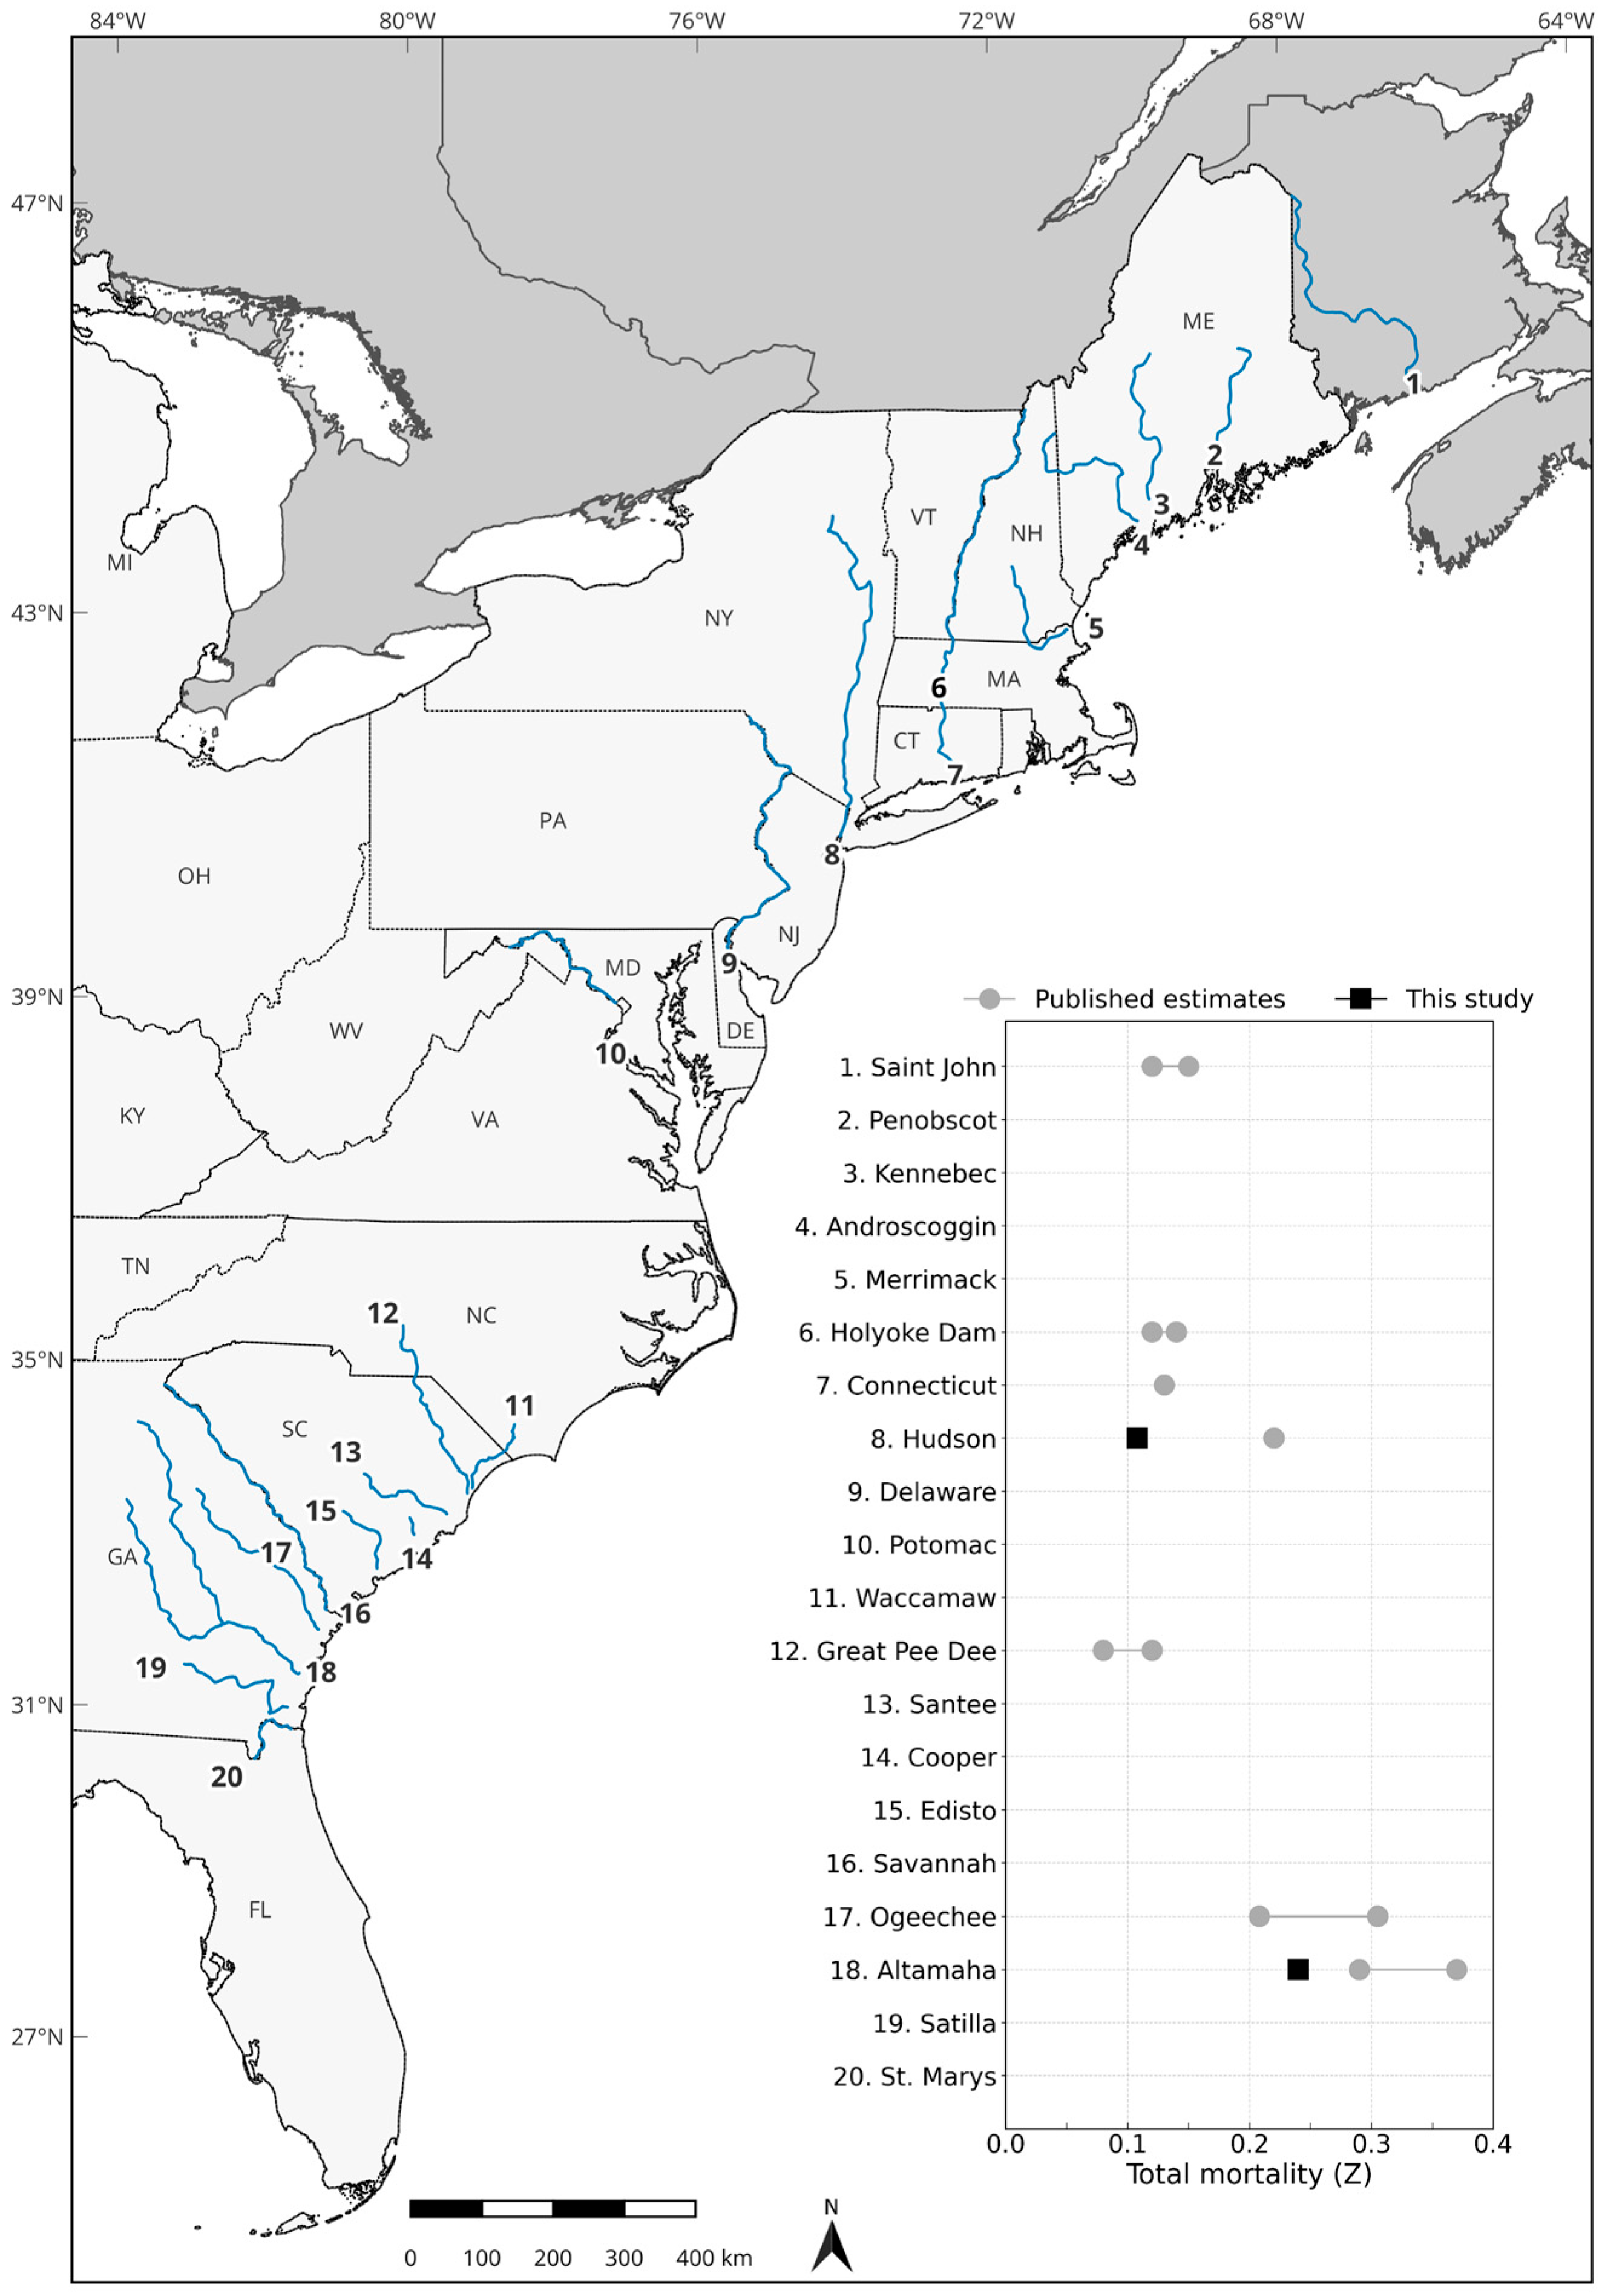
A Bayesian approach to multistate capture–recapture modeling was used to separately assess the apparent survival of adult shortnose sturgeon in the Altamaha and Hudson Rivers [48]. Bayesian multistate models are particularly useful for modeling capture–recapture data as they allow for the discrimination of the underlying biological process (i.e., the true unknown state, in this case the apparent survival of individuals over time) from the observational process (i.e., the relocation or recovery of tagged individuals) [49,50,51]. Multistate capture–recapture models [52,53,54] were applied to shortnose sturgeon telemetry detection data and fit in JAGS [55] using a Markov chain Monte Carlo (MCMC) simulation. All analyses were sourced through the R2jags package (ver. 4-10 [56]) in R (ver. 3.5.1 [57]).
Individual capture histories were constructed from telemetry detection data and summarized as capture-history matrices for each river, with rows representing telemetered individuals and columns for monthly detection occasions (Hudson River = 43 monthly occasions during April 2012–October 2015; Altamaha River = 36 monthly occasions during April 2011–March 2014; Tables S3 and S4). Because of the short duration of the detection occasions relative to the full period of analysis, any potential bias that could occur from the timing of tagging or detections was assumed to be negligible [48,58]. Individual capture histories were censored beginning with the first monthly occasion after putative battery expiration to account for transmitters that could expire before the end of the study period. However, if telemetry detections were subsequently observed, then individual capture histories were instead censored beginning with the monthly occasion that followed the transmitter’s last valid detection. Fish not detected on at least one monthly occasion after initial capture were excluded to reduce potential tagging or capture bias, resulting in the removal of one fish from the Hudson River.
Capture-history matrices were used as input data to fit multistate capture–recapture models containing parameters for apparent survival (S; local survival or the probability of a fish surviving and being in the study area) and detection probability (p; probability that a live fish will be detected on one or more receivers). The candidate models in this study were informed by the inspection of raw telemetry detections as well as preliminary modeling efforts, which indicated limited variation in apparent survival among periods but potential seasonality in detection probability. Candidate models evaluated for each river consisted of a base model that allowed for time-varying detection probability (pt) and constant apparent survival (S0), and an alternative model that allowed for time-varying detection probability (pt) and included TL as a covariate for apparent survival (STL). Detection parameters were constrained as fixed values for the first monthly occasion in each model (i.e., pt = 1) or for any occasion where in-river receiver coverage was unavailable (i.e., pt = 0) [48]. We assigned reference priors to the distributions of the mean apparent survival (uniform distribution; 0–1) and the logit-scale slope of the TL covariate (normal distribution; mean = 0; variance = 1000; bounds: −10 to 10) [29,49,59]. For all MCMC simulations, the initial burn-in run of 10,000 iterations was discarded, and an additional 50,000 iterations were used for parameter estimation. Parameter sets were updated using three independent chains, and model convergence was assessed for all parameters using the Gelman–Rubin statistic (i.e., acceptable R ^ < 1.01) [60]. Selection criteria for the preferred model from each river were determined based on whether the 95% Bayesian credibility interval (CI) of the estimate for the TL slope parameter in the alternative model ranged over zero [29]. The deviance information criterion (DIC) [61], which provides a Bayesian measure of model complexity and fit, was also deployed to provide complementary evidence for the preferred model but was not used as the primary criterion for selection [62]. Model goodness-of-fit was assessed using posterior predictive checking to visually compare simulated values from the joint posterior distribution of the replicated data against the observed data [49,63].
Implied annual survival from the preferred model for each river was used to estimate rates of total instantaneous mortality (Z = −loge[survival]) [29]. These estimates of Z were assumed to be representative of the combination of true natural mortality (M) and mortality from anthropogenic sources (F). Although useful for comparison, estimates of M for shortnose sturgeon in the Altamaha and Hudson rivers are not widely available in the literature. As an alternative, M was estimated indirectly using the updated Paulynls-T estimator (Mest = 4.118K0.73L−0.333) and Von Bertalanffy growth parameters (Altamaha River: K = 0.149, L = 970 [FL, mm] [44]; Hudson: K = 0.044, L = 1064 [FL, mm] [64]), as recommended for the evaluation of data-poor stocks when estimates of maximum age are unavailable [26].

3. Results

A total of 131 shortnose sturgeon were tagged with acoustic transmitters and monitored during telemetry efforts in the Hudson (n = 91 fish; 2012–2015) and Altamaha (n = 40 fish; 2011–2014) river basins (Table 1). The numbers of fish sampled, and the size range of tagged fish varied between rivers and among years (Table 1, Tables S1 and S2; Figure 2). All fish were identified as adults based on TL at capture ≥ 550 mm [14,44]. Pooled lengths for all fish ranged from 633 to 973 mm TL, with a mean of 771 mm TL (SD = 71.4) (Table 1, Tables S1 and S2).
Telemetry detections indicated the presence of shortnose sturgeon in both rivers throughout receiver array operations (Tables S3 and S4). Confirmed detections of tagged fish varied from 29 to 296,130 detections per individual, with 4,391,596 total detections of 131 unique fish (Table 1). Detection counts in the Hudson River varied from 29 to 69,027 detections per fish, with 1,277,096 total detections of 91 unique fish (Table 1 and Table S1). In the Altamaha River, detection counts varied from 5266 to 296,130 detections per fish, with 3,164,500 total detections of 40 unique fish (Table 1 and Table S2). Although periods of limited coverage or coverage gaps occurred, there was no evidence from cooperative research arrays of emigration from either study area.
The results of the model selection provided support for the preferred models based on telemetry-derived capture–recapture data (Table 2). The preferred model for each river was identified as the base model containing parameters for time-varying detection probabilities and constant apparent survival. The 95% CI of the TL slope parameter estimates from alternative models ranged over zero, indicating there was no individual effect of size on survival (Table 2). Additional evaluation of the candidate models with the DIC provided complementary evidence for the preferred models (i.e., lower DIC values) and indicated that the models identified by the selection process were appropriately complex. Convergence was rapid for all MCMC simulations (Figures S1–S4), and the convergence criterion of R ^ < 1.01 was met for all parameters [60]. Additional visual inspection of MCMC diagnostics indicates that parameter space was sufficiently explored in order to be considered representative of the posterior distribution and that estimates were stable (Figures S1–S4) [65].
Estimates of detection probability varied noticeably between rivers as well as among monthly occasions (Figure 3). In the Hudson River, detection probability estimates consistently declined during late fall when limited receiver coverage was available and remained low (i.e., pt < 0.50) throughout the winter months before rebounding in April or May. In the Altamaha River, detection probability was relatively high and stable throughout the course of the study, with seasonal peaks generally observed during the winter months. Point-value estimates of detection probability ranged from a low of 0.670 in May 2011 to a high of 0.966 in January 2013. Mean monthly detection probability values for the Altamaha (0.821; 95% CI = 0.792–0.848) were significantly higher than for the Hudson (0.602; 95% CI = 0.582–0.621; Table 2). The inclusion of the TL covariate for apparent survival did not influence the estimates of mean monthly detection probability for either river (Table 2).
Apparent monthly survival of shortnose sturgeon was high and precisely estimated for both the Hudson (0.991; 95% CI = 0.984–0.996) and Altamaha rivers (0.980; 95% CI = 0.969–0.989). These monthly estimates implied annual apparent survival rates of 0.897 (95% CI = 0.828–0.953) and 0.787 (95% CI = 0.685–0.874), respectively (Table 2). Total instantaneous mortality rates estimated from implied annual survival were 0.108 for the Hudson River and 0.240 for the Altamaha River, with comparable trends observed from indirect estimates of M (0.089 and 0.224, respectively; Table 2).

4. Discussion

A deeper understanding of shortnose sturgeon population dynamics is critical for conservation managers working to develop effective recovery goals and strategies under the ESA [8,66]. Despite nearly six decades of focused research prompted by the species’ imperiled status, robust and river-specific estimates of adult survival remain limited. This study provides new information on survival rates for spawning populations at opposite ends of the species’ US geographic range. Using acoustic telemetry data and Bayesian multistate capture–recapture models, we estimated annual apparent survival at 0.897 for the Hudson River and 0.787 for the Altamaha River. These estimates address a knowledge gap and offer essential parameters for evaluating population viability. They also provide a foundation for conservation actions targeting major threats, including in-river construction, habitat disturbance, fisheries bycatch, and vessel strikes [8]. By informing impact assessments and management decisions, these findings strengthen the scientific basis for advancing recovery efforts and ensuring the long-term persistence of shortnose sturgeon.
Our modeling efforts proved highly effective for estimating shortnose sturgeon demographic parameters across independent study locations. Unlike traditional capture–mark–recapture designs, which often suffer from low reencounter rates or other constraints that can undermine the accuracy of modeling efforts, the use of long-term acoustic telemetry tags across multiple studies provided a substantial advantage in sample size and monitoring coverage [67]. This approach resulted in highly precise parameter estimates, and the flexibility of the Bayesian framework allowed models to achieve rapid convergence. Such precision is critical, as reliable survival and mortality estimates are foundational for evaluating population viability under the regulatory framework of the ESA [68]. Although our parameter estimates are assumed to represent conservative rates, any biases that may have resulted from tagging mortality, transmitter failure or expulsion, or emigration from the study area were largely accounted for in the construction of capture histories. Moreover, any impact from the timing of tagging or detections was assumed to be negligible due to the selection of detection occasions that were relatively short in duration compared to the overall analysis period.
The preferred model for shortnose sturgeon provides evidence of relatively high annual apparent survival rates for adults in both the Hudson and Altamaha Rivers. These estimates align with expectations for a long-lived species and offer benchmarks for survival rates within these rivers. The difference in point estimates between the two rivers suggests that localized environmental conditions, anthropogenic stressors, and ecological interactions play a significant role in shaping survival dynamics across populations. Our estimates imply instantaneous mortality rates (Z) of 0.11 in the Hudson River and 0.24 in the Altamaha River. This difference likely reflects a combination of natural mortality (M) and anthropogenic factors, such as habitat degradation, vessel strikes, and bycatch [4]. Moreover, indirect estimates of the true natural mortality using growth parameters for the Hudson River (M = 0.09) and Altamaha River (M = 0.22) are comparable to their corresponding total mortality (Z) estimates (Table 2). This suggests that anthropogenic impacts on adult mortality may currently be limited, aligning with expectations of harvest protection for these populations [9]. Nevertheless, recovery criteria could be strengthened by establishing biologically realistic Z targets that reflect true M across the species’ range.
Our parameter estimates highlight clear geographic trends in shortnose sturgeon survival, providing empirical evidence that aligns with expectations of higher survival rates in northern river populations relative to those in the south [3]. While our results support prior assumptions, they offer more robust and contemporary evidence for these patterns. Although river-specific comparisons remain challenging due to the limited number of quantified assessments across the species’ range, a synthesis of the available literature for this data-poor species suggests generally high survival (and subsequently low mortality) rates, with a discernible decline in survival (and increase in mortality) along a latitudinal gradient from north to south (Table S5; Figure 4). It is notable that these patterns persist despite considerable variability and limitations in previous estimation methodologies, underscoring the robustness of the observed trend. For example, adjusted catch-curve analyses of adult shortnose sturgeon in the Saint John River in Canada yield Z estimates of 0.12 and 0.15 [5]. Similarly, catch-curve analyses of northern U.S. populations report Z values ranging from 0.12 to 0.22 [69,70]. Although more variable, estimates of Z for southern populations range from 0.08 to 0.37 [44,71,72]. Collectively, these findings underscore a consistent latitudinal gradient in shortnose sturgeon survival, reflecting the influence of geographic and environmental factors across populations, and emphasizing the need for continued river-specific estimates to better inform conservation and management efforts.
The variation in the monthly detection probability for telemetered adult shortnose sturgeon reflects the localized study dynamics as well as clinal differences in migratory life history between rivers. Periods of elevated detection probability likely reflected dispersal to foraging sites or extended migrations associated with spawning movements between estuarine and upriver habitat, which increased the likelihood of interactions with multiple receivers or high-coverage areas. Although environmental conditions in the Hudson River prevented receiver arrays from being deployed during the winter, adult shortnose sturgeon are known to aggregate at overwintering sites as water temperatures begin to decline in the late fall and exhibit limited movements or relocations until dispersing in the early spring [14]. As such, lower detection probabilities in winter were anticipated, and the reduction in receiver coverage was unlikely to have biased apparent survival estimates, as the battery life of the tags allowed for the reestablishment of individual status through movements and subsequent detections once arrays were redeployed in the spring.
This study advances our understanding of shortnose sturgeon survival, a key demographic parameter essential for assessing recovery potential and predicting future population trends in sturgeon species [29]. Our findings confirm clinal variation in survival rates, highlighting the importance of developing regionally specific recovery objectives. Effective assessment of shortnose sturgeon recovery under the ESA will require a more comprehensive understanding of river-specific dynamics or, at minimum, finer-scale latitudinal patterns in key demographic parameters. The observed differences in apparent survival rates between the two river populations investigated underscore the importance of local factors—ranging from habitat quality and predator abundance to exposure to anthropogenic impacts such as vessel strikes and bycatch—in shaping population viability while contributing to our broader understanding of potential metapopulation dynamics. For example, despite the Hudson River being extensively industrialized, we observed lower mortality rates there compared to the relatively undeveloped Altamaha River. This contrast may, in part, reflect the extreme summer temperatures at the southern edge of the species’ range [34], where individuals approaching their upper thermal limits may experience sublethal physiological stress or direct mortality [73]. Thermally induced mortality is expected to increase with ongoing climate change, posing a growing threat to populations in warmer regions [74,75]. As such, the lower apparent survival rates in the Altamaha River population may indicate heightened vulnerability to additional stressors, underscoring the need for targeted mitigation measures, including enhanced monitoring of in-river construction, habitat disturbances, and fisheries interactions. Accordingly, conservation strategies must be specifically tailored to address the distinct ecological conditions and management challenges faced by geographically disjunct populations. This study, and other future river-specific studies like it, will enable more effective management strategies to assess the effects of anthropogenic changes. The apparent survival rates we observed can be used as benchmarks to determine how in-river construction projects, habitat disturbances or remediations, changes in bycatch levels, or non-native species introductions affect survival and population recovery. Expanding receiver arrays and integrating additional coastwide datasets will allow for continued refinement and understanding of these dynamics, further strengthening recovery efforts and supporting the long-term persistence of shortnose sturgeon across their native range.

Supplementary Materials

The following supporting information can be downloaded at https://www.mdpi.com/article/10.3390/fishes10060293/s1, Table S1: Hudson River biological data; Table S2: Altamaha River biological data; Table S3: Hudson River capture-history matrix; Table S4: Altamaha River capture-history matrix; Table S5: Summary and sources of river-specific survival and mortality estimates; Figure S1: Mean apparent survival diagnostic plots; Figure S2: Annual apparent survival diagnostic plots; Figure S3: Detection diagnostic plots; Figure S4: Deviance diagnostic plots.

Author Contributions

Conceptualization, E.C.I.; resources, E.C.I., A.L.H., and D.A.F.; investigation, E.C.I., A.L.H., and D.A.F.; data curation, E.C.I.; methodology, E.C.I.; formal analysis, E.C.I.; validation, E.C.I., and L.B.; writing—original draft, E.C.I.; visualization, E.C.I.; writing—review and editing, E.C.I., A.L.H., L.B., and A.G.F. All authors have read and agreed to the published version of the manuscript.

Funding

This research received no external funding.

Institutional Review Board Statement

The animal study protocol was approved by the Institutional Animal Care and Use Committee of the University of Georgia (AUP No. A2013 01-012-R1).

Informed Consent Statement

Not applicable.

Data Availability Statement

The original contributions presented in this study are included in the article/supplementary material. Further inquiries can be directed to the corresponding author.

Acknowledgments

Funding for the original collection of field data in the Hudson River, New York, was provided by the Environmental Protection Fund through the Hudson River Estuary Program and the Ocean and Great Lakes Program. The authors are especially grateful to J. Best and all the staff at the Hudson River Fisheries Unit at the New York State Department of Environmental Conservation. Funding for the original collection of field data in the Altamaha River, Georgia, was provided by the National Marine Fisheries Service and administered by B. Post at the South Carolina Department of Natural Resources. The authors are especially grateful to R. Harrell and J. Garritt, whose field assistance was critical to project implementation and data collection. We thank B. Boehm, A. Cummins, D. Bahr, and S. Bahr for their contributions in the field. We also thank M. Bednarski and J. Hightower for preliminary assistance with modeling considerations, and D. Higginbotham for the administration of field logistics.

Conflicts of Interest

The authors declare no conflicts of interest.

Abbreviations

The following abbreviations are used in this manuscript:
CIBayesian credibility interval
DICDeviance information criterion
ESAEndangered Species Act
FLFork length
MCMCMarkov chain Monte Carlo
TLTotal length

References

  1. Birstein, V.J. Sturgeons and paddlefishes: Threatened fishes in need of conservation. Conserv. Biol. 1993, 7, 773–787. [Google Scholar] [CrossRef]
  2. Vladykov, V.D.; Greeley, J.R. Order Acipenseroidei. In Fishes of the Western North Atlantic. Part 3: Soft-Rayed Bony Fishes; Olsen, V.H., Ed.; Yale University: New Haven, CT, USA, 1963; pp. 24–60. [Google Scholar]
  3. Kynard, B. Life history, latitudinal patterns, and status of the shortnose sturgeon, Acipenser brevirostrum. Environ. Biol. Fishes 1997, 48, 319–334. [Google Scholar] [CrossRef]
  4. Kynard, B.; Bolden, S.; Kieffer, M.; Collins, M.; Brundage, H.; Hilton, E.J.; Litvak, M.; Kinnison, M.T.; King, T.; Peterson, D. Life history and status of shortnose sturgeon (Acipenser brevirostrum LeSeur, 1818). J. Appl. Ichthyol. 2016, 32, 208–248. [Google Scholar] [CrossRef]
  5. Dadswell, M.J. Biology and population characteristics of the shortnose sturgeon, Acipenser brevirostrum LeSueur 1818 (Osteichthyes: Acipenseridae), in the Saint John River estuary, New Brunswick, Canada. Can. J. Zool. 1979, 57, 2186–2210. [Google Scholar] [CrossRef]
  6. Rochard, E.; Castelnaud, G.; Lepage, M. Sturgeons (Pisces: Acipenseridae): Threats and prospects. J. Fish Biol. 1990, 37, 123–132. [Google Scholar] [CrossRef]
  7. Cooke, D.W.; Leach, S.D. Implications of a migration impediment on shortnose sturgeon spawning. N. Am. J. Fish. Manag. 2004, 24, 1460–1468. [Google Scholar] [CrossRef]
  8. Shortnose Sturgeon Status Review Team. A Biological Assessment of Shortnose Sturgeon (Acipenser brevirostrum). Report to National Marine Fisheries Service, Northeast Regional Office. 2010. Available online: https://repository.library.noaa.gov/view/noaa/17811 (accessed on 1 June 2022).
  9. Bain, M.B.; Haley, N.; Peterson, D.L.; Arend, K.K.; Mills, K.E.; Sullivan, P.J. Recovery of a US endangered fish. PLoS ONE 2007, 2, e168. [Google Scholar] [CrossRef]
  10. Altenritter, M.N.; Zydlewski, G.B.; Kinnison, M.T.; Zydlewski, J.D.; Wippelhauser, G.S. Understanding the basis of shortnose sturgeon (Acipenser brevirostrum) partial migration in the Gulf of Maine. Can. J. Fish. Aquat. Sci. 2018, 75, 464–473. [Google Scholar] [CrossRef]
  11. Fernandes, S.J.; Zydlewski, G.B.; Zydlewski, J.D.; Wippelhauser, G.S.; Kinnison, M.T. Seasonal distribution and movements of shortnose sturgeon and Atlantic Sturgeon in the Penobscot River estuary, Maine. Trans. Am. Fish. Soc. 2010, 139, 1436–1449. [Google Scholar] [CrossRef]
  12. King, T.L.; Henderson, A.P.; Kynard, B.E.; Kieffer, M.C.; Peterson, D.L.; Aunins, A.W.; Brown, B.L. A nuclear DNA perspective on delineating evolutionarily significant lineages in polyploids: The case of the endangered shortnose sturgeon (Acipenser brevirostrum). PLoS ONE 2014, 9, e102784. [Google Scholar] [CrossRef]
  13. Fleming, J.E.; Bryce, T.D.; Kirk, J.P. Age, growth, and status of shortnose sturgeon in the lower Ogeechee River, Georgia. Proc. Annu. Conf. SEAFWA 2003, 57, 80–91. [Google Scholar]
  14. Bain, M.B. Atlantic and shortnose sturgeons of the Hudson River: Common and divergent life history attributes. Environ. Biol. Fishes 1997, 48, 347–358. [Google Scholar] [CrossRef]
  15. O’herron, J.C.; Able, K.W.; Hastings, R.W. Movements of shortnose sturgeon (Acipenser brevirostrum) in the Delaware River. Estuaries 1993, 16, 235. [Google Scholar] [CrossRef]
  16. Ingram, E.C.; Peterson, D.L.; Fox, A.G. Abundance of endangered shortnose sturgeon (Acipenser brevirostrum) in the Altamaha River in Georgia. Fish. Bull. 2020, 118, 198–204. [Google Scholar] [CrossRef]
  17. Peterson, D.L.; Bednarski, M.S. Abundance and size structure of shortnose sturgeon in the Altamaha River, Georgia. Trans. Am. Fish. Soc. 2013, 142, 1444–1452. [Google Scholar] [CrossRef]
  18. Jager, H.I.; Peterson, D.L.; Farrae, D.; Bevelhimer, M.S. A population model to assess influences on the viability of the shortnose sturgeon population in the Ogeechee River, Georgia. Trans. Am. Fish. Soc. 2013, 142, 731–746. [Google Scholar] [CrossRef]
  19. Boreman, J. Sensitivity of North American sturgeons and paddlefish to fishing mortality. Environ. Biol. Fishes 1997, 48, 399–405. [Google Scholar] [CrossRef]
  20. Bahn, R.A.; Fleming, J.E.; Peterson, D.L. Bycatch of shortnose sturgeon in the commercial American shad fishery of the Altamaha River, Georgia. N. Am. J. Fish. Manag. 2012, 32, 557–562. [Google Scholar] [CrossRef]
  21. Collins, M.R.; Rogers, S.G.; Smith, T.I.J. Bycatch of sturgeons along the southern Atlantic Coast of the USA. N. Am. J. Fish. Manag. 1996, 16, 24–29. [Google Scholar] [CrossRef]
  22. Collins, M.R.; Rogers, S.G.; Smith, T.I.J.; Moser, M.L. Primary factors affecting sturgeon populations in the southeastern United States: Fishing mortality and degradation of essential habitats. Bull. Mar. Sci. 2000, 66, 917–928. [Google Scholar]
  23. Robson, D.S.; Chapman, D.G. Catch curves and mortality rates. Trans. Am. Fish. Soc. 1961, 90, 181–189. [Google Scholar] [CrossRef]
  24. Pauly, D. On the interrelationships between natural mortality, growth parameters, and mean environmental temperature in 175 fish stocks. J. Cons. Cons. Perm. Int. Pour Explor. Mer. 1980, 39, 175–192. [Google Scholar] [CrossRef]
  25. Lorenzen, K. The relationship between body weight and natural mortality in juvenile and adult fish: A comparison of natural ecosystems and aquaculture. J. Fish Biol. 1996, 49, 627–642. [Google Scholar] [CrossRef]
  26. Then, A.Y.; Hoenig, J.M.; Hall, N.G.; Hewitt, D.A. Evaluating the predictive performance of empirical estimators of natural mortality rate using information on over 200 fish species. ICES J. Mar. Sci. 2015, 72, 82–92. [Google Scholar] [CrossRef]
  27. Brownscombe, J.W.; Lédée, E.J.I.; Raby, G.D.; Struthers, D.P.; Gutowsky, L.F.G.; Nguyen, V.M.; Young, N.; Stokesbury, M.J.W.; Holbrook, C.M.; Brenden, T.O.; et al. Conducting and interpreting fish telemetry studies: Considerations for researchers and resource managers. Rev. Fish Biol. Fish. 2019, 29, 369–400. [Google Scholar] [CrossRef]
  28. Kahn, J.E.; Hager, C.; Watterson, J.C.; Mathies, N.; Deacy, A.; Hartman, K.J. Population and sex-specific survival estimates for Atlantic Sturgeon: Addressing detection probability and tag loss. Aquat. Biol. 2023, 32, 1–12. [Google Scholar] [CrossRef]
  29. Hightower, J.E.; Loeffler, M.; Post, W.C.; Peterson, D.L. Estimated survival of subadult and adult Atlantic Sturgeon in four river basins in the southeastern United States. Mar. Coast. Fish. 2015, 7, 514–522. [Google Scholar] [CrossRef]
  30. Melnychuk, M.C.; Dunton, K.J.; Jordaan, A.; McKown, K.A.; Frisk, M.G. Informing conservation strategies for the endangered Atlantic Sturgeon using acoustic telemetry and multi-state mark–recapture models. J. Appl. Ecol. 2016, 54, 914–925. [Google Scholar] [CrossRef]
  31. Lindley, S.T.; Moser, M.L.; Erickson, D.L.; Belchik, M.; Welch, D.W.; Rechisky, E.L.; Kelly, J.T.; Heublein, J.; Klimley, A.P. Marine migration of North American green sturgeon. Trans. Am. Fish. Soc. 2008, 137, 182–194. [Google Scholar] [CrossRef]
  32. Rudd, M.B.; Ahrens, R.N.M.; Pine III, W.E.; Bolden, S.K. Empirical, spatially explicit natural mortality and movement rate estimates for the threatened Gulf Sturgeon (Acipenser oxyrinchus desotoi). Can. J. Fish. Aquat. Sci. 2014, 71, 1407–1417. [Google Scholar] [CrossRef]
  33. Colborne, S.F.; Hayden, T.A.; Holbrook, C.M.; Hondorp, D.W.; Krueger, C.C. Lake sturgeon (Acipenser fulvescens) annual adult survival estimated from acoustic telemetry. J. Gt. Lakes Res. 2021, 47, 1814–1823. [Google Scholar] [CrossRef]
  34. Ingram, E.C.; Peterson, D.L. Seasonal movements of shortnose sturgeon (Acipenser brevirostrum) in the Altamaha River, Georgia. River Res. Appl. 2018, 34, 873–882. [Google Scholar] [CrossRef]
  35. Coch, N.K.; Bokuniewicz, H.J. Oceanographic and geologic framework of the Hudson System. Northeast. Geol. 1986, 8, 96–108. [Google Scholar]
  36. Olsen, C.R.; Simpson, H.J.; Peng, T.-H.; Bopp, R.F.; Trier, R.M. Sediment mixing and accumulation rate effects on radionuclide depth profiles in Hudson Estuary sediments. J. Geophys. Res. Oceans 1981, 86, 11020–11028. [Google Scholar] [CrossRef]
  37. de Vries, M.P.; Weiss, L.A. Salt-Front Movement in the Hudson River Estuary, New York—Simulations by One-Dimensional Flow and Solute-Transport Models; Water-Resources Investigations Report 99–4024; U.S. Geological Survey: Reston, VA, USA, 2001; 69p. Available online: https://pubs.er.usgs.gov/publication/wri994024 (accessed on 1 June 2022).
  38. Blumberg, A.F.; Hellweger, F.L. Hydrodynamics of the Hudson River estuary. Am. Fish. Soc. Symp. 2006, 51, 9–28. [Google Scholar]
  39. Seekell, D.A.; Pace, M.L. Climate change drives warming in the Hudson River estuary, New York (USA). J. Environ. Monit. 2011, 13, 2321. [Google Scholar] [CrossRef]
  40. Dynesius, M.; Nilsson, C. Fragmentation and flow regulation of river systems in the northern third of the world. Science 1994, 266, 753–762. [Google Scholar] [CrossRef]
  41. Sheldon, J.E.; Alber, M. A Comparison of residence time calculations using simple compartment models of the Altamaha River estuary, Georgia. Estuaries 2002, 25, 1304–1317. [Google Scholar] [CrossRef]
  42. Pendleton, R.M.; Standley, C.R.; Higgs, A.L.; Kenney, G.H.; Sullivan, P.J.; Sethi, S.A.; Harris, B.P. Acoustic telemetry and benthic habitat mapping inform the spatial ecology of shortnose sturgeon in the Hudson River, New York, USA. Trans. Am. Fish. Soc. 2019, 148, 35–47. [Google Scholar] [CrossRef]
  43. Scott, W.B.; Crossman, E.J. Freshwater Fishes of Canada, 1st ed.; Fisheries Research Board of Canada: Ottawa, ON, Canada, 1973. [Google Scholar]
  44. Dadswell, M.J.; Taubert, B.D.; Squiers, T.S.; Marchette, D.; Buckley, J. Synopsis of Biological Data on Shortnose Sturgeon, Acipenser brevirostrum LeSueur 1818; FAO Fish Synopsis 140; National Oceanic and Atmospheric Administration: Washington, DC, USA, 1984. [Google Scholar]
  45. Boone, S.S.; Hernandez, S.M.; Camus, A.C.; Peterson, D.L.; Jennings, C.A.; Shelton, J.L.; Divers, S.J. Evaluation of four suture materials for surgical incision closure in Siberian sturgeon. Trans. Am. Fish. Soc. 2013, 142, 649–659. [Google Scholar] [CrossRef]
  46. Breece, M.W.; Higgs, A.L.; Fox, D.A. Spawning intervals, timing, and riverine habitat use of adult Atlantic Sturgeon in the Hudson River. Trans. Am. Fish. Soc. 2021, 150, 528–537. [Google Scholar] [CrossRef]
  47. Ingram, E.C.; Peterson, D.L. Annual spawning migrations of adult Atlantic Sturgeon in the Altamaha River, Georgia. Mar. Coast. Fish. Dyn. Manag. Ecosyst. Sci. 2016, 8, 595–606. [Google Scholar] [CrossRef]
  48. Hightower, J.E.; Harris, J.E. Estimating fish mortality rates using telemetry and multistate models. Fisheries 2017, 42, 210–219. [Google Scholar] [CrossRef]
  49. Kéry, M.; Schaub, M. Bayesian Population Analysis Using WinBUGS: A Hierarchical Perspective; Academic Press: Cambridge, MA, USA, 2012. [Google Scholar]
  50. King, R. A review of Bayesian state-space modelling of capture-recapture-recovery data. Interface Focus 2012, 2, 190–204. [Google Scholar] [CrossRef]
  51. Gimenez, O.; Rossi, V.; Choquet, R.; Dehais, C.; Doris, B.; Varella, H.; Vila, J.-P.; Pradel, R. State-space modelling of data on marked individuals. Ecol. Model. 2007, 206, 431–438. [Google Scholar] [CrossRef]
  52. Arnason, A.N. The estimation of population size, migration rates and survival in a stratified population. Res. Popul. Ecol. 1973, 15, 1–8. [Google Scholar] [CrossRef]
  53. Kendall, W.L.; Nichols, J.D. On the use of secondary capture-recapture samples to estimate temporary emigration and breeding proportions. J. Appl. Stat. 1995, 22, 751–762. [Google Scholar] [CrossRef]
  54. White, G.C.; Kendall, W.L.; Barker, R.J. Multistate survival models and their extensions in Program MARK. J. Wildl. Manag. 2006, 70, 1521–1529. [Google Scholar] [CrossRef]
  55. Plummer, M. JAGS: A program for analysis of Bayesian graphical models using Gibbs sampling. In Proceedings of the 3rd International Workshop on Distributed Statistical Computing, Vienna, Austria, 20–22 March 2003; pp. 1–10. [Google Scholar]
  56. Su, Y.; Yajima, M. R2jags: A Package for Running JAGS from R, 2014. Available online: http://CRAN.R-project.org/package=R2jags (accessed on 1 June 2022).
  57. R Core Team. R: A Language and Environment for Statistical Computing; R Foundation for Statistical Computing: Vienna, Austria, 2018. [Google Scholar]
  58. Nelson, T.R.; Powers, S.P. Estimates of red drum mortality via acoustic telemetry. Mar. Coast. Fish. 2020, 12, 78–97. [Google Scholar] [CrossRef]
  59. Calvert, A.M.; Bonner, S.J.; Jonsen, I.D.; Flemming, J.M.; Walde, S.J.; Taylor, P.D. A hierarchical Bayesian approach to multi-state mark–recapture: Simulations and applications. J. Appl. Ecol. 2009, 46, 610–620. [Google Scholar] [CrossRef]
  60. Gelman, A.; Rubin, D.B. Inference from iterative simulation using multiple sequences. Stat. Sci. 1992, 7, 457–472. [Google Scholar] [CrossRef]
  61. Spiegelhalter, D.J.; Best, N.G.; Carlin, B.P.; Van Der Linde, A. Bayesian measures of model complexity and fit. J. R. Stat. Soc. Ser. B Stat. Methodol. 2002, 64, 583–639. [Google Scholar] [CrossRef]
  62. Hooten, M.B.; Hobbs, N.T. A guide to Bayesian model selection for ecologists. Ecol. Monogr. 2015, 85, 3–28. [Google Scholar] [CrossRef]
  63. Gelman, A.; Carlin, J.B.; Stern, H.S.; Dunson, D.B.; Vehtari, A.; Rubin, D.B. Bayesian Data Analysis, 3rd ed.; Chapman & Hall/CRC Texts in Statistical Science; CRC Press: Boca Raton, FL, USA, 2013. [Google Scholar]
  64. Dovel, W.L. The Endangered Shortnose Sturgeon of the Hudson Estuary: Its Life History and Vulnerability to the Activities of Man; U.S. Department of Energy: Washington, DC, USA, 1981. [Google Scholar]
  65. Kruschke, J.K. Bayesian analysis reporting guidelines. Nat. Hum. Behav. 2021, 5, 1282–1291. [Google Scholar] [CrossRef] [PubMed]
  66. Shortnose Sturgeon Recovery Team. Final Recovery Plan for the Shortnose Sturgeon (Acipenser brevirostrum); National Marine Fisheries Service: Silver Spring, MD, USA, 1998. [Google Scholar]
  67. Perry, R.W.; Castro-Santos, T.; Holbrook, C.M.; Sandford, B.P. Using mark-recapture models to estimate survival from telemetry data. In Telemetry Techniques: A User Guide for Fisheries Research; Adams, N.S., Beeman, J.W., Eiler, J.H., Eds.; American Fisheries Society: Bethesda, MD, USA, 2012; pp. 453–475. [Google Scholar]
  68. Morris, W.F.; Doak, D.F. Quantitative Conservation Biology: Theory and Practice of Population Viability Analysis; Sinauer Associates: Sunderland, MA, USA, 2003. [Google Scholar]
  69. Taubert, B.D. Reproduction of shortnose sturgeon (Acipenser brevirostrum) in Holyoke Pool, Connecticut River, Massachusetts. Copeia 1980, 1980, 114–117. [Google Scholar] [CrossRef]
  70. Woodland, R.J.; Secor, D.H. Year-class strength and recovery of endangered shortnose sturgeon in the Hudson River, New York. Trans. Am. Fish. Soc. 2007, 136, 72–81. [Google Scholar] [CrossRef]
  71. Peterson, D.L.; Farrae, D.J. Evidence of metapopulation dynamics in shortnose sturgeon in the southern part of their range. Trans. Am. Fish. Soc. 2011, 140, 1540–1546. [Google Scholar] [CrossRef]
  72. DeVries, R.J. Population Dynamics, Movements, and Spawning Habitat of the Shortnose Sturgeon, Acipenser Brevirostrum, in the Altamaha River System, Georgia. Master’s Thesis, University of Georgia, Athens, GA, USA, 2006. [Google Scholar]
  73. Ziegeweid, J.R.; Jennings, C.A.; Peterson, D.L.; Black, M.C. Effects of salinity, temperature, and weight on the survival of young-of-year shortnose sturgeon. Trans. Am. Fish. Soc. 2008, 137, 1490–1499. [Google Scholar] [CrossRef]
  74. Pörtner, H.O.; Peck, M.A. Climate change effects on fishes and fisheries: Towards a cause-and-effect understanding. J. Fish Biol. 2010, 77, 1745–1779. [Google Scholar] [CrossRef]
  75. IPCC. Climate Change 2021: The Physical Science Basis. Contribution of Working Group I to the Sixth Assessment Report of the Intergovernmental Panel on Climate Change; Masson-Delmotte, V., Zhai, P., Pirani, A., Connors, S.L., Péan, C., Berger, S., Caud, N., Chen, Y., Goldfarb, L., Gomis, M.I., et al., Eds.; Cambridge University Press: Cambridge, UK; New York, NY, USA, 2023. [Google Scholar]
Figure 1. Acoustic telemetry study sites showing (A) the general locations of the Hudson and Altamaha River systems along the Atlantic Coast of the United States; (B) the Hudson River study site in New York; and (C) the Altamaha River study site in Georgia, including its Oconee and Ocmulgee River tributaries. The maps of the study sites illustrate the maximum navigable habitat for shortnose sturgeon (Acipenser brevirostrum) up to each impassable barrier. Acoustic receiver stations where shortnose sturgeon were detected are shown as filled black circles, while stations without detections are represented by white squares.
Fishes 10 00293 g001
Figure 2. Length frequency distributions of total length (TL, mm) for shortnose sturgeon (Acipenser brevirostrum) tagged with acoustic transmitters in (A) the Hudson River in New York (2012–2014; n = 91) and (B) the Altamaha River in Georgia (2011–2013; n = 40).
Fishes 10 00293 g002
Figure 3. Estimated monthly detection probabilities for telemetered adult shortnose sturgeon (Acipenser brevirostrum) from the lower Hudson River, New York (April 2012–October 2015; 43 monthly occasions), and the Altamaha River, Georgia (April 2011–April 2014; 36 monthly occasions). Values are based on the preferred model for each river (see Table 2). Filled markers indicate fixed detection probabilities: pt = 1 for the first monthly occasion in each river; pt = 0 for months with no available receiver coverage (i.e., January–March of 2014–2015 in the Hudson River).
Fishes 10 00293 g003
Figure 4. Map of shortnose sturgeon (Acipenser brevirostrum) river systems (blue lines) along the Atlantic Coast of North America. The accompanying plot shows availability of total mortality (Z) estimates for each river system, with published estimates (gray circles) and results from this study (black squares). See Table S5 for point estimates, methodology, and sources of published data.
Fishes 10 00293 g004
Table 1. Biological and detection data for adult shortnose sturgeon (Acipenser brevirostrum) tagged with acoustic transmitters in the Hudson River, New York (2012–2014), and the Altamaha River, Georgia (2011–2013). FL = fork length; TL = total length; SD = standard deviation; battery life = expected tag life (days).
FL (mm)TL (mm)Detections
RiverTag TypeBattery (d)Release YearNo. TaggedMeanRange [SD]MeanRange [SD]TotalRange
HudsonLotek MM-MR-16-50389201214673590–759 [49.4]777694–871 [54.8]389,79212,932–69,027
201347647545–801 [60.2]749639–942 [69.4]555,945110–49,517
201430675566–826 [61.0]765633–918 [67.5]281,35929–49,555
All years91661545–826 [59.9]759633–942 [66.9]1,227,09629–69,027
AltamahaVEMCO V16-4H1248201115726635–830 [60.6]828732–973 [75.2]1,698,8335266–296,130
201215690670–800 [52.4]784658–897 [64.1]1,256,75110,442–141,132
201310681574–819 [66.2]776656–945 [79.7]208,9168459–39,022
All years40701574–830 [60.9]799656–973 [74.3]3,164,5005266–296,130
Overall131673545–830 [62.9]771633–973 [71.4]4,391,59629–296,130
Table 2. Bayesian multistate capture–recapture models fitted to capture-history matrices for adult shortnose sturgeon (Acipenser brevirostrum) tagged with acoustic transmitters in the Hudson River, New York, and the Altamaha River, Georgia. Deviance information criterion (DIC) and the effective number of parameters (pD) are provided for each candidate model. Monthly detection probability (p) and monthly apparent survival rate (S) are reported as mean values. The preferred model for each river (highlighted in gray) was selected based on whether the 95% Bayesian credibility interval (CI) for the slope of the total length (TL) size effect on apparent survival included zero.
ModelpSFish TL SlopeAnnual SurvivalMortality
RiverNo. TaggedTL (mm) pSpDDICEstimate95% CIEstimate95% CIEstimate95% CIEstimate95% CIZ aM b
Hudson91633–942TimeConstant211.11137.60.6020.582–0.6210.9910.984–0.996--0.8970.828–0.9530.1080.089
TimeSize214.01150.40.6010.581–0.6200.9930.986–0.9980.012−0.002–0.0310.9230.848–0.983
Altamaha40656–973TimeConstant122.3793.10.8210.792–0.8480.9800.969–0.989--0.7870.685–0.8740.2400.224
TimeSize122.4793.60.8210.792–0.8480.9810.970–0.989−0.001−0.007–0.0060.7930.692–0.880
a Total instantaneous mortality rate (Z) is implied by the annual apparent survival estimate for the preferred model (Z = −loge[survival]) [29]. Here, Z is assumed to be representative of the combination of true natural mortality, M, and mortality from anthropogenic sources, F. b Natural mortality rates (M) shown for comparison were indirectly estimated using the Paulynls-T estimator (Mest = 4.118K0.73L−0.333 [26]) and available Von Bertalanffy growth parameters for the Altamaha River (K = 0.149; L = 970 [FL, mm] [44]) or Hudson River (K = 0.044; L = 1064 [FL, mm] [64]).
Disclaimer/Publisher’s Note: The statements, opinions and data contained in all publications are solely those of the individual author(s) and contributor(s) and not of MDPI and/or the editor(s). MDPI and/or the editor(s) disclaim responsibility for any injury to people or property resulting from any ideas, methods, instructions or products referred to in the content.

