Article

A Hydroacoustic Assessment of the Density, Size, and Biomass of Fish in a Freshwater Reservoir After Non-Classical Biomanipulation

Agriculture Ministry Key Laboratory of Healthy Freshwater Aquaculture, Zhejiang Institute of Freshwater Fisheries, 999th South Hangchangqiao Road, Wuxing District, Huzhou 313001, China
*
Author to whom correspondence should be addressed.
Fishes 2025, 10(6), 274; https://doi.org/10.3390/fishes10060274
Submission received: 31 March 2025 / Revised: 27 May 2025 / Accepted: 28 May 2025 / Published: 5 June 2025
(This article belongs to the Section Fishery Economics, Policy, and Management)

Abstract

Monitoring changes in fishery resources, such as the density and growth of fish, following large-scale fish stocking in a reservoir is important. In this study, BioSonics DT-X (201 kHz) was used to assess the seasonal changes in the density, size distribution, and biomass of fish in Duihekou Reservoir, Zhejiang province, China, in 2020. The fish density was significantly lower in spring (3.33 ind./1000 m3) than in summer (75.24 ind./1000 m3), autumn (56.22 ind./1000 m3), and winter (20.37 ind./1000 m3) (p < 0.01). No significant difference in fish density was apparent between summer and autumn. Additionally, the average target strength (TS) values in spring (−41.05 dB) were significantly higher than in summer (−44.66 dB) and autumn (−45.55 dB) (p < 0.01), but significantly higher in winter (−38.12 dB) than in the other seasons (p < 0.01); no significant difference was observed between the summer and autumn values (p > 0.01). The fish biomass in winter (14.3 g/m3) was 13 times that in spring (1.1 g/m3). These results indicate that large-scale fish stocking can effectively adapt to reservoir habitats to achieve growth. The catch composition revealed silver carp (Hypophthalmichthys molitrix) and bighead carp (Aristichthys nobilis) to be dominant species, mostly comprising young individuals. Stock enhancement plays a critical role in reshaping the fishery population structure in a reservoir. These findings enhance our understanding of fishery resource changes in reservoirs after non-classical biomanipulation and demonstrate how hydroacoustic techniques can be successfully used to quantify the density and size distribution of fish for more effective fishery management.
Key Contribution: Hydroacoustic surveys were performed to monitor fishery resources—including the density, size distribution, and growth dynamics of fish—while evaluating the long-term impacts of biomanipulation in a reservoir. These findings will provide critical data to optimize biomanipulation strategies, guide sustainable fishery management, and support water quality conservation efforts.

1. Introduction

Eutrophication and cyanobacterial blooms have become major environmental challenges, affecting lakes and reservoirs worldwide. Maintaining high water quality is particularly critical for water supply reservoirs, where the health of the ecosystem directly impacts both human use and ecological integrity [1,2]. Among various mitigation strategies, biomanipulation through aquatic food web regulation has emerged as a widely adopted, environmentally sustainable approach for controlling cyanobacterial blooms [3]. A prominent example of this strategy is non-classical biomanipulation, which involves stocking filter-feeding fish to reduce the phytoplankton biomass [4]. In China, silver carp (Hypophthalmichthys molitrix) and bighead carp (Aristichthys nobilis) have been effectively introduced to control algal blooms in several eutrophic lakes, including Lake Donghu [5], Lake Taihu [6], and Qiandao Lake [2]. Notably, Qiandao Lake represents a case where algal blooms have been successfully controlled by means of the stocking and harvest of silver and bighead carp [7]. However, this practice is not without ecological trade-offs. For example, the large-scale stocking of filter-feeding fish can lead to ecological degradation [8,9] and adverse effects on other aquatic organisms [10]. Given these risks, comprehensive monitoring of fishery resources—including the density, size distribution, and growth dynamics of fish—is essential to assess the long-term impacts of biomanipulation in reservoir ecosystems.
For more than half a century, hydroacoustic technology has been successfully employed in fishery stock assessments [11] and resource surveys across diverse aquatic ecosystems, including rivers [12,13], lakes and reservoirs [14,15], and deep-water systems [16]. This methodology offers several distinct advantages [17,18]: it is non-invasive, highly repeatable, and capable of producing continuous, high-resolution data, regardless of the water clarity and without the depth limitations of traditional survey methods [19]. Furthermore, hydroacoustic techniques have proven to be particularly valuable for constructing size spectra in freshwater fish communities [20] and evaluating the ecological status of inland water bodies [21]. Despite these benefits, the approach has certain limitations. Hydroacoustic surveys cannot reliably distinguish between fish species or differentiate fish from non-biological targets such as air bubbles. Their effectiveness is also influenced by multiple factors, including instrument specifications, fish behavioral patterns, and environmental conditions (e.g., wind-induced waves or entrained air) [18,22]. Nevertheless, hydroacoustics remains one of the most cost-effective and dependable tools for studying the density and spatial distribution of fish in reservoir ecosystems [18,23].
We performed hydroacoustic surveys in Duihekou Reservoir, Zhejiang, to (1) quantify the size distribution, density, and biomass of the fish and (2) assess the effects of stocking of H. molitrix and A. nobilis on the density, biomass, and population structure of the fish in this reservoir. These findings will provide critical data to optimize biomanipulation strategies, guide sustainable fishery management, and support water quality conservation efforts.

2. Materials and Methods

2.1. Study Area

Surveys were performed at Duihekou Reservoir (119°5′ E, 30°33′ N; Figure 1), located in Huzhou City in the northwest of Zhejiang Province. This reservoir, constructed in 1965, provides most of the drinking water for local residents; its maximum volume is 1.469 × 10⁸ m3, its surface area is 10.5 km2, its average depth is 12 m, and its maximum depth is 22 m. The dominant fish species are H. molitrix and A. nobilis. Other common species include Culter alburnus, Carassius auratus, Xenocypris davidi, and Hemiculterlla wui. Details of the non-classical biomanipulation management strategies that were used for the fish in this reservoir are presented in Table 1. The management regime transitioned through two distinct phases: (1) In 2017–2019, 10.615 × 10⁴ kg of silver and bighead carp were released and 17 × 104 kg were caught (Table 1). (2) In 2020, a total of 9.81 × 10⁴ kg of fry from silver and bighead carp was released, following which fishing activities were prohibited; almost no fish have been caught since 2020, except for research purposes.

2.2. Hydroacoustic Survey

Four hydroacoustic surveys were conducted in a zig-zag pattern using a BioSonics split-beam DT-X echosounder (BioSonics, Seattle, WA, USA) with a 201 kHz transducer on sunny, windless days in the spring (March 11th), summer (June 11th), autumn (September 6th), and winter (December 11th) of 2020 (Figure 1). This transducer had a half-power beam angle of 6.5° and transmitted at 4 pings·s−1. The pulse length was 0.4 ms. All acoustic data were georeferenced with an integrated GPS (Garmin 17×HVS, Garmin Ltd., Olathe, KS, USA) and collected on a computer using Visual Acquisition Software 6.1 (BioSonics Inc., Seattle, WA, USA). During the surveys, the transducer face was held 40–50 cm below the water surface and was directed vertically down. According to the manufacturer’s instructions and the standard protocol recommended by Foote et al. [24], the transducer was calibrated with a standard 36 mm tungsten carbide sphere. The boat speed was <7.5 km·h−1. The degree of coverage (D) was calculated for each survey using the formula D = L/ A [25], where L is the total length of the transects and A is the area surveyed. Godlewska et al. [26] demonstrated that the sampling error of density estimates was less than 10% at a coverage above 2. In this study, the degree of coverage among the four surveys ranged from 2.28 to 6.08; the detection routes are shown in Figure 1.
Figure 1. Detection routes of the hydroacoustic survey in Duihekou Reservoir in different seasons. This figure was created using ArcGIS software version 10.7 (http://www.esri.com (accessed on 13 March 2024)).
Fishes 10 00274 g001

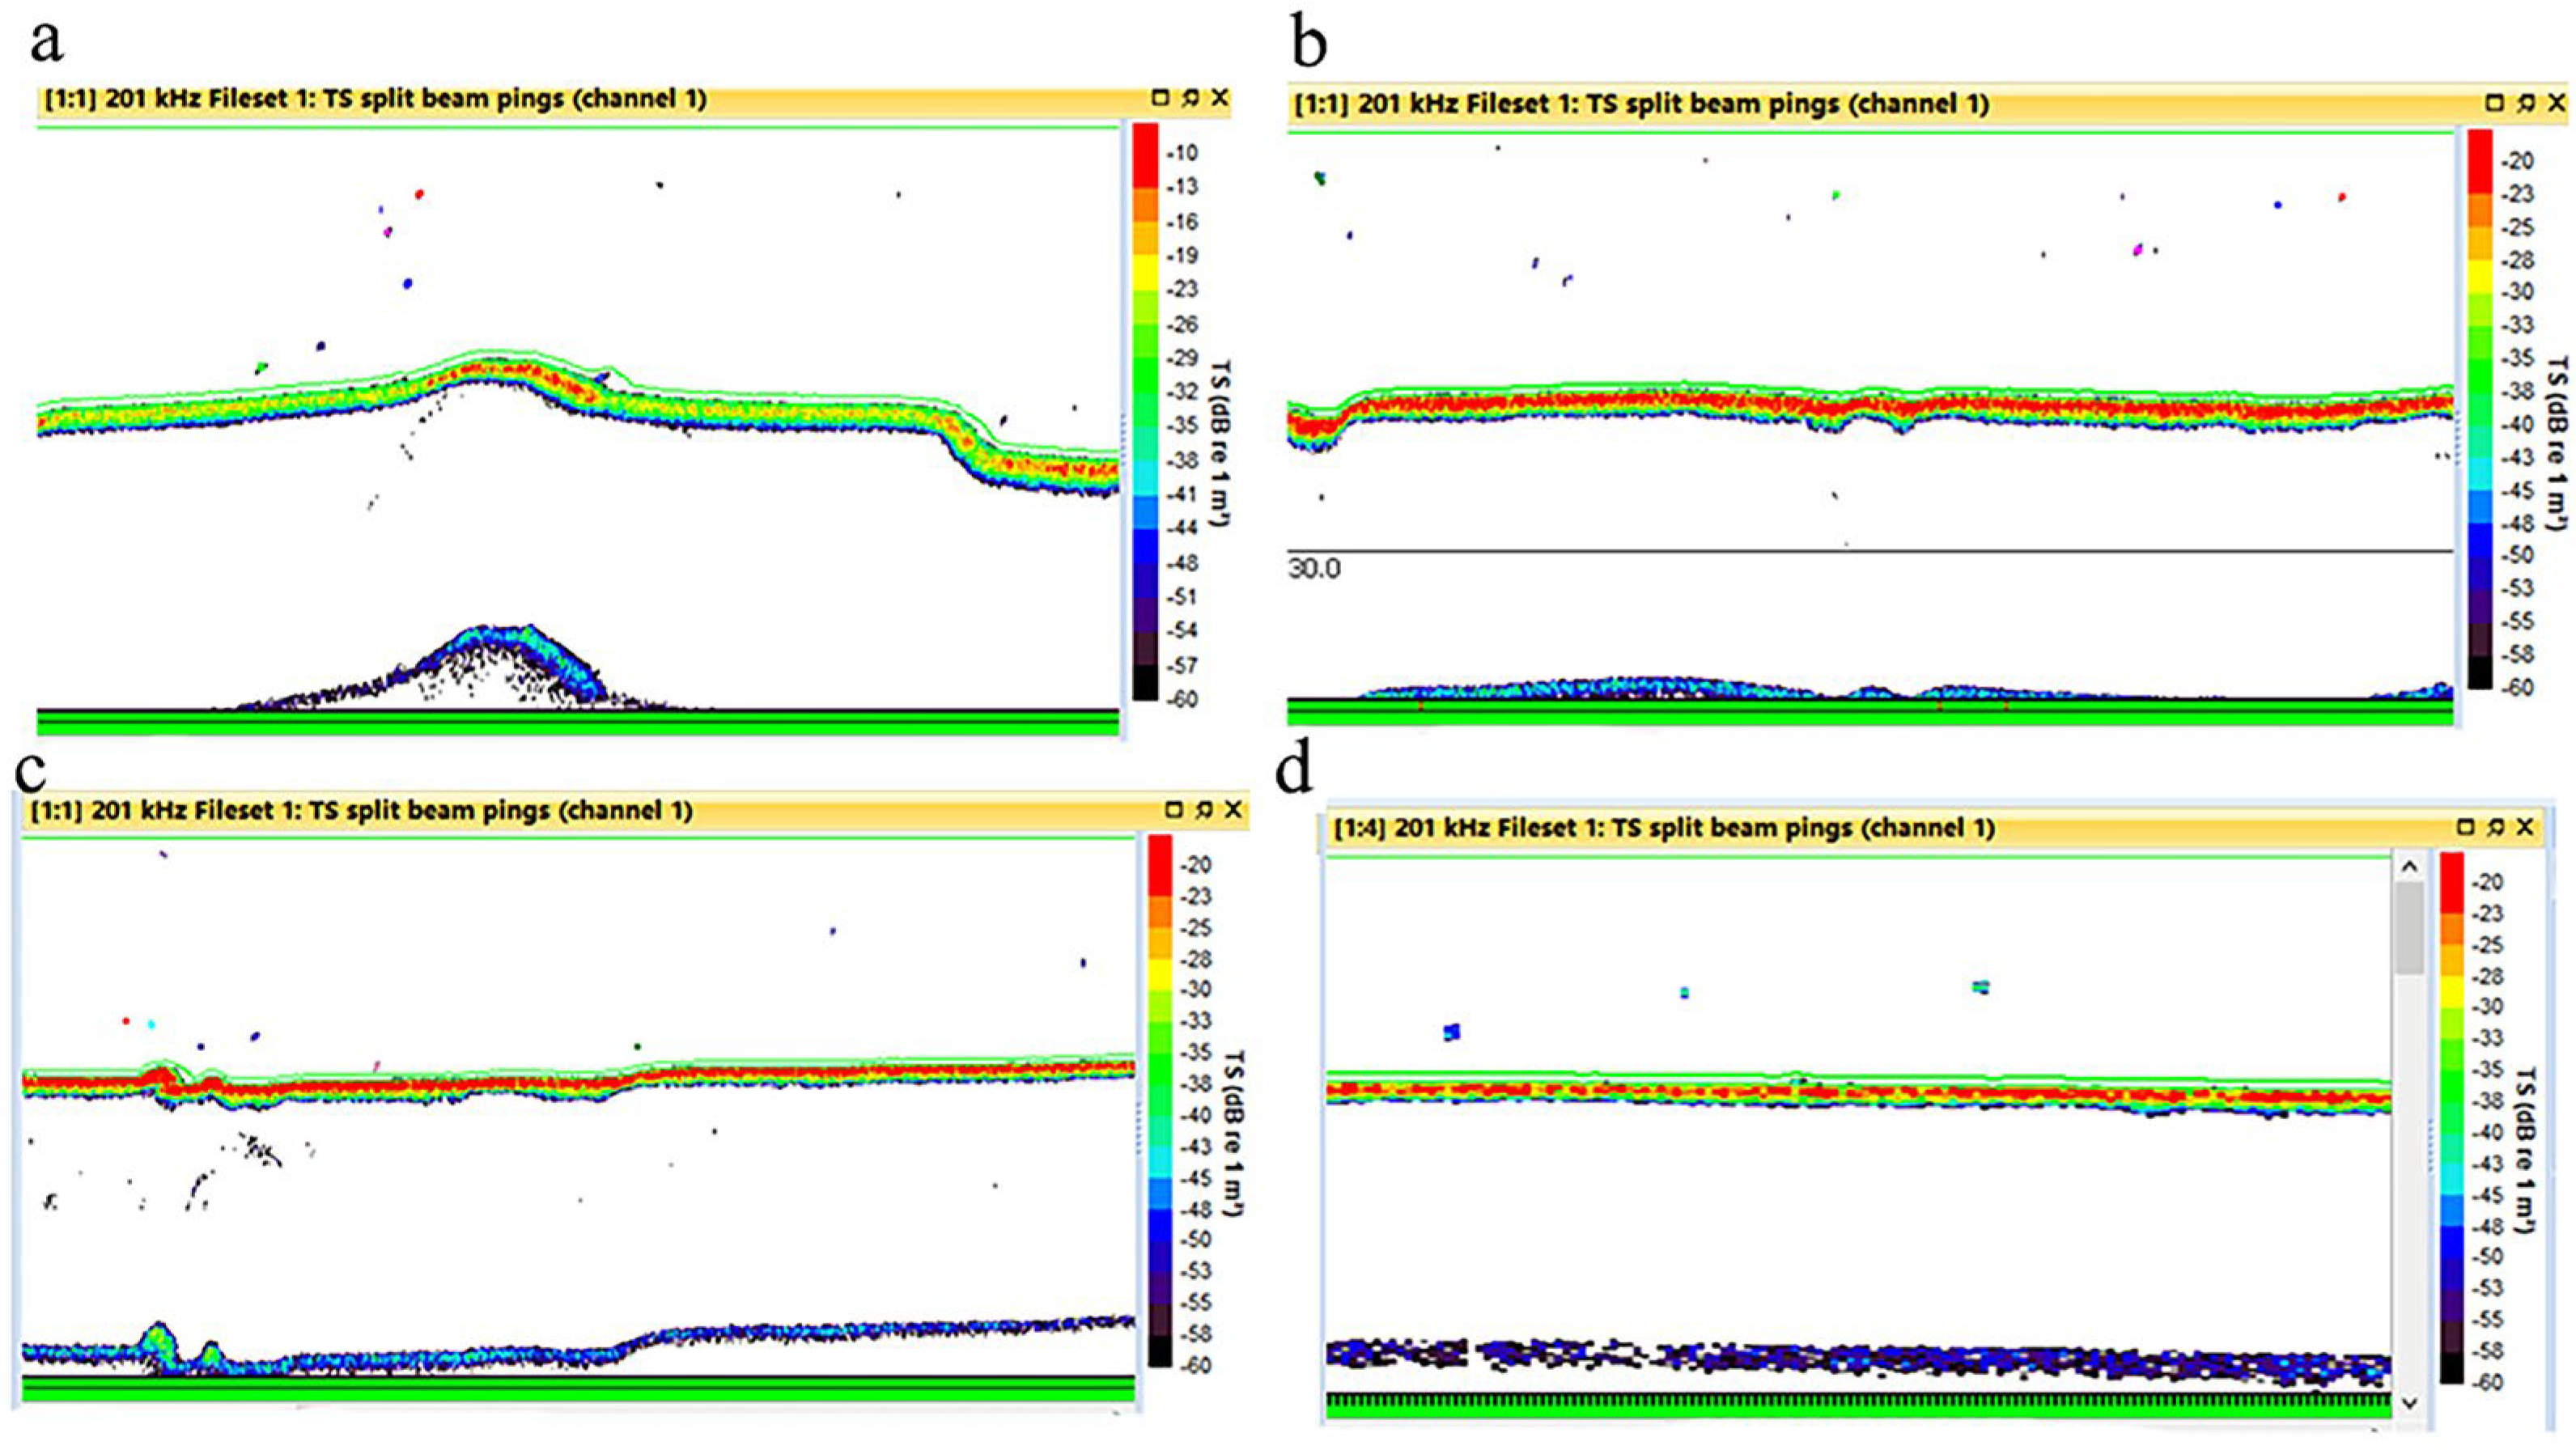
2.3. Acoustic Data Processing

Acoustic data were processed using Echoview software (v14.0, Myriax Pty Ltd., Hobart, Australia) (Figure 2) [27]. To exclude dead zones, only acoustic data from within the range of 1.5 m from the transducer to 0.5 m above the bottom layer were analyzed. When setting the parameters, a time-varied gain of 40 logR was applied to compensate for the echo amplitudes of beam spreading and absorption. The target strength (TS) threshold was set to −60 dB to remove noise from bubbles and plankton (the reference pressure value was 10−6 Pa). With the appropriate threshold set and manually corrected, each transect data point was cleared of noise [28]. Fish sizes and TS values were tracked using single-target detection (SED) [14]. The criteria for the SED were as follows: TS threshold = −60 dB; pulse length determination level = 6 dB; minimum normalized pulse length = 0.7; maximum pulse width length = 1.5; maximum beam compensation = 4 dB; maximum standard deviation of minor-axis angles = 0.6; and maximum standard deviation of major-axis angles = 0.6. To enumerate the targets correctly, the following tracking parameters were used: the minimum number of single targets in a track was 1, and the maximum gap between single targets was 1. Each of the 1000 pings served as an integration interval to analyze the fish density. The fish density was calculated by means of echo integration, defined as the summation of the volume backscattering strength (Sv) divided by the backscattering cross-section (σbs), derived from the mean echo intensity (TS) of individual fish. The TS value is the logarithm of the backscattering cross-section of the fish, which is described based on the acoustic size of a fish [18]. Thus, a high TS value implies a big fish and vice versa.

2.4. Fish Sampling and Age Determination

Immediately before the hydroacoustic survey, fish were sampled using three multi-mesh gillnets (mish size knot-to-knot: 4, 6, and 8 cm; net height: 6 m; length: 100 m) that were set in the evening (approximately 19:00) and lifted the following morning (approximately 05:00), leading to 10 h of fishing time.
All fish were collected individually, their species was identified, and they were measured for body length (0.1 cm) and weighed (0.1 g). For each silver carp and bighead carp, 5–10 scales were collected from below the dorsal fin and above the lateral line; scales were soaked in 4% NaOH solution for 12 h to remove the surface mucus and connective tissue. After washing and installing the scales, the growth ring characteristics were observed under a stereo-microscope (SZX 16, OLYMPUS) [29].

2.5. Acoustic Biomass

The fish biomass (g/m3) was calculated as follows [19]: (1) The TS distribution (based on SED from −60 dB to−20 dB, in 1 dB bins) was converted to length using the TS–length relationship, where TS = 25.76lgTL − 105.32 [30]. (2) The average length was converted to weight using the W-L equation for H. molitrix [31], where W = 0.0052 × L3.162. (3) The proportions of weight were multiplied by the total density of transects. (4) These values were summed per weight class to yield a biomass value. (5) The mean weight (g/m3) of all transects was calculated as the average biomass for the reservoir.

2.6. Statistical Analysis

The statistical analysis was performed using SPSS 27.0 (SPSS, Inc., Chicago, IL, USA). Prior to analyses, data were examined for assumptions of normality using the Kolmogorov–Smirnov test and Levene’s tests for homogeneity of variance. The differences in mean density, TS and biomass in the four seasons were analyzed using Kruskal–Wallis H tests.
The fish density and the corresponding unit center coordinate GPS data were imported into ArcGIS 10.7 (ESRI Inc., Redlands, CA, USA) for a spatial distribution analysis. The Ordinary Kriging Spherical method was used in ArcGIS to build the raster image [32].
The index relative importance (IRI) is an important metric of the relative abundance of fishes; it is based on the number, weight, and frequency of occurrence of species in the total catch [33]. When IRI is > 1000, species are considered dominant, while those with 100 < IRI < 1000 are common, those with 10 < IRI < 100 are general, those with 1 < IRI < 10 are occasional, those with and IRI < 1 are rare. The IRI is calculated as follows:
IRI = (N% + W%) × F%
where W% = percentage of species by weight; N% = percentage of species by number; and F% = frequency of occurrence percentage.

3. Results

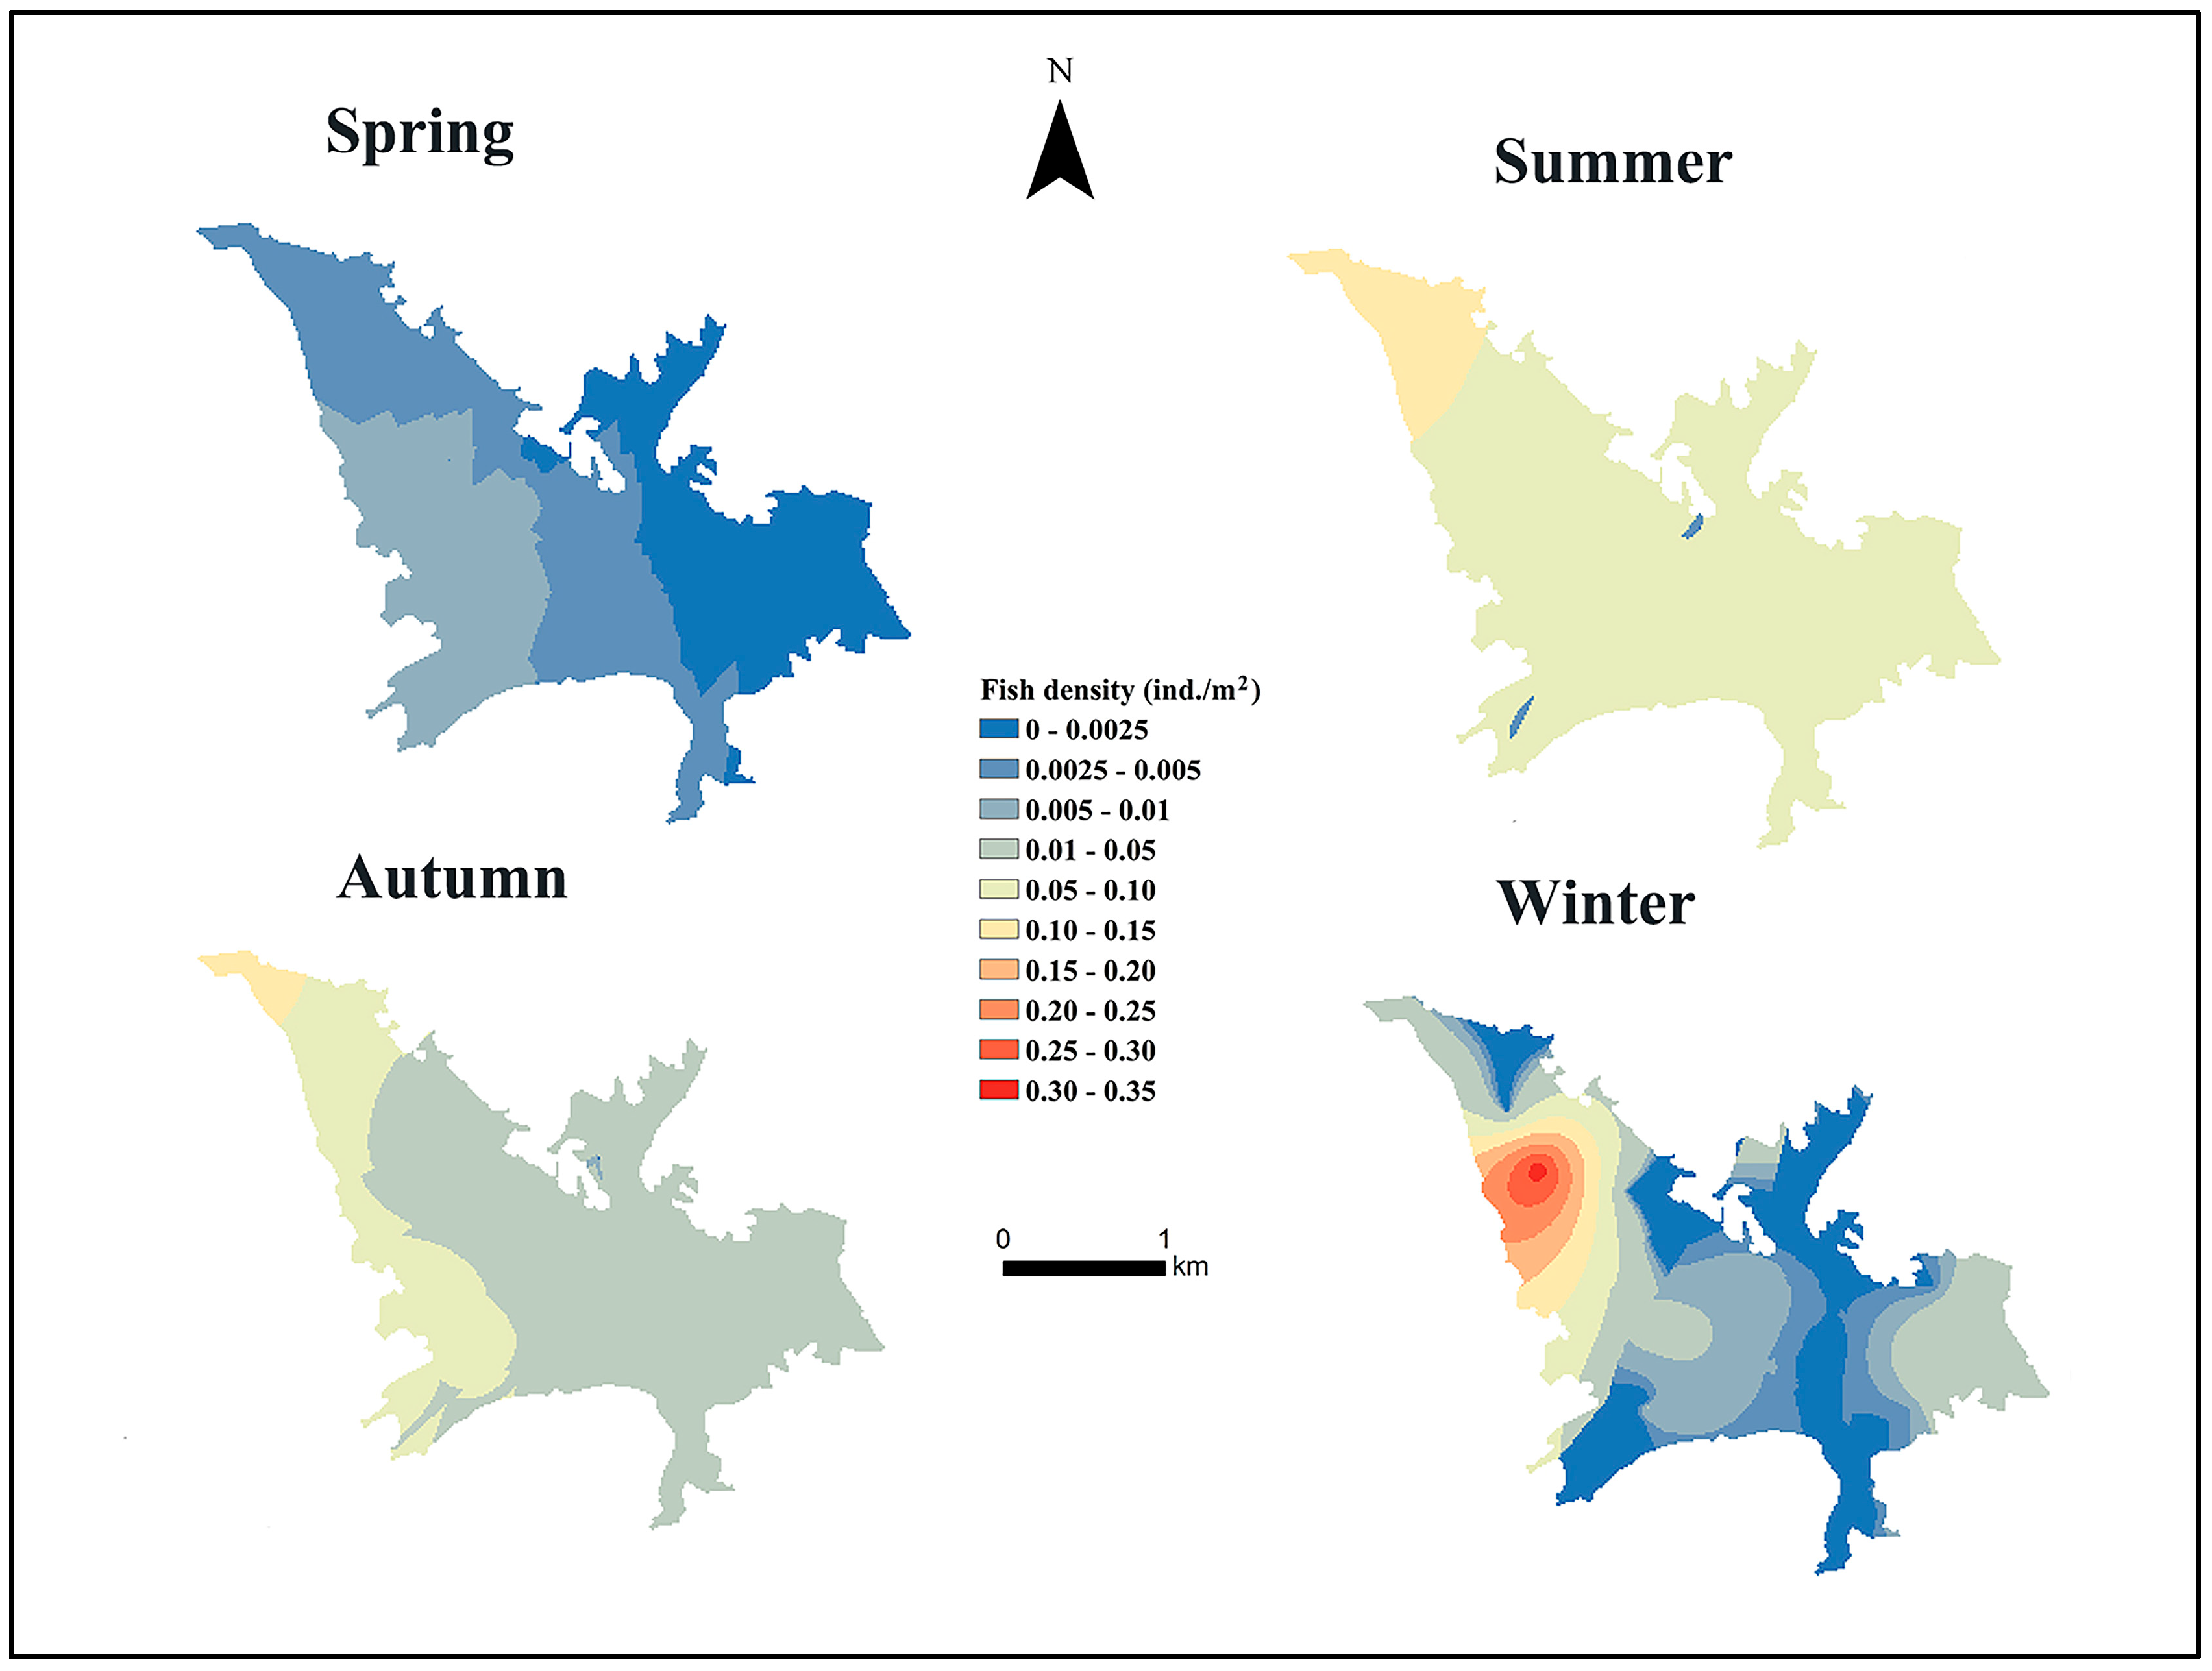
3.1. Spatial and Temporal Variation in Fish Density

The results of the descriptive values and statistical comparisons of the acoustic fish density estimates are presented in Table 2. Mean fish densities varied significantly between seasons (H = 65.493, p < 0.01). The fish density in spring (3.33 ind./1000 m3) was significantly lower than in summer (75.27 ind./1000 m3), autumn (56.22 ind./1000 m3), and winter (20.37 ind./1000 m3) (p < 0.01). The fish density in autumn showed no significant variation compared with in summer or winter, but the fish densities in summer and winter exhibited a significant difference. The fish density ranged from 0 to 27.2 ind./1000 m3 in spring, 6 to 285.4 ind./1000 m3 in summer, and 7 to 264.3 ind./1000 m3 in autumn; the winter values ranged from 0 to 331.4 ind./1000 m3 across the different transects.
The spatial distribution of the fish density exhibited distinct seasonal patterns in the reservoir. During the summer months, the fish displayed a relatively homogeneous distribution pattern across the water body. In contrast, the winter distribution showed pronounced spatial aggregation, with significant density hotspots occurring preferentially in the bay areas and upstream regions of the reservoir (Figure 3).

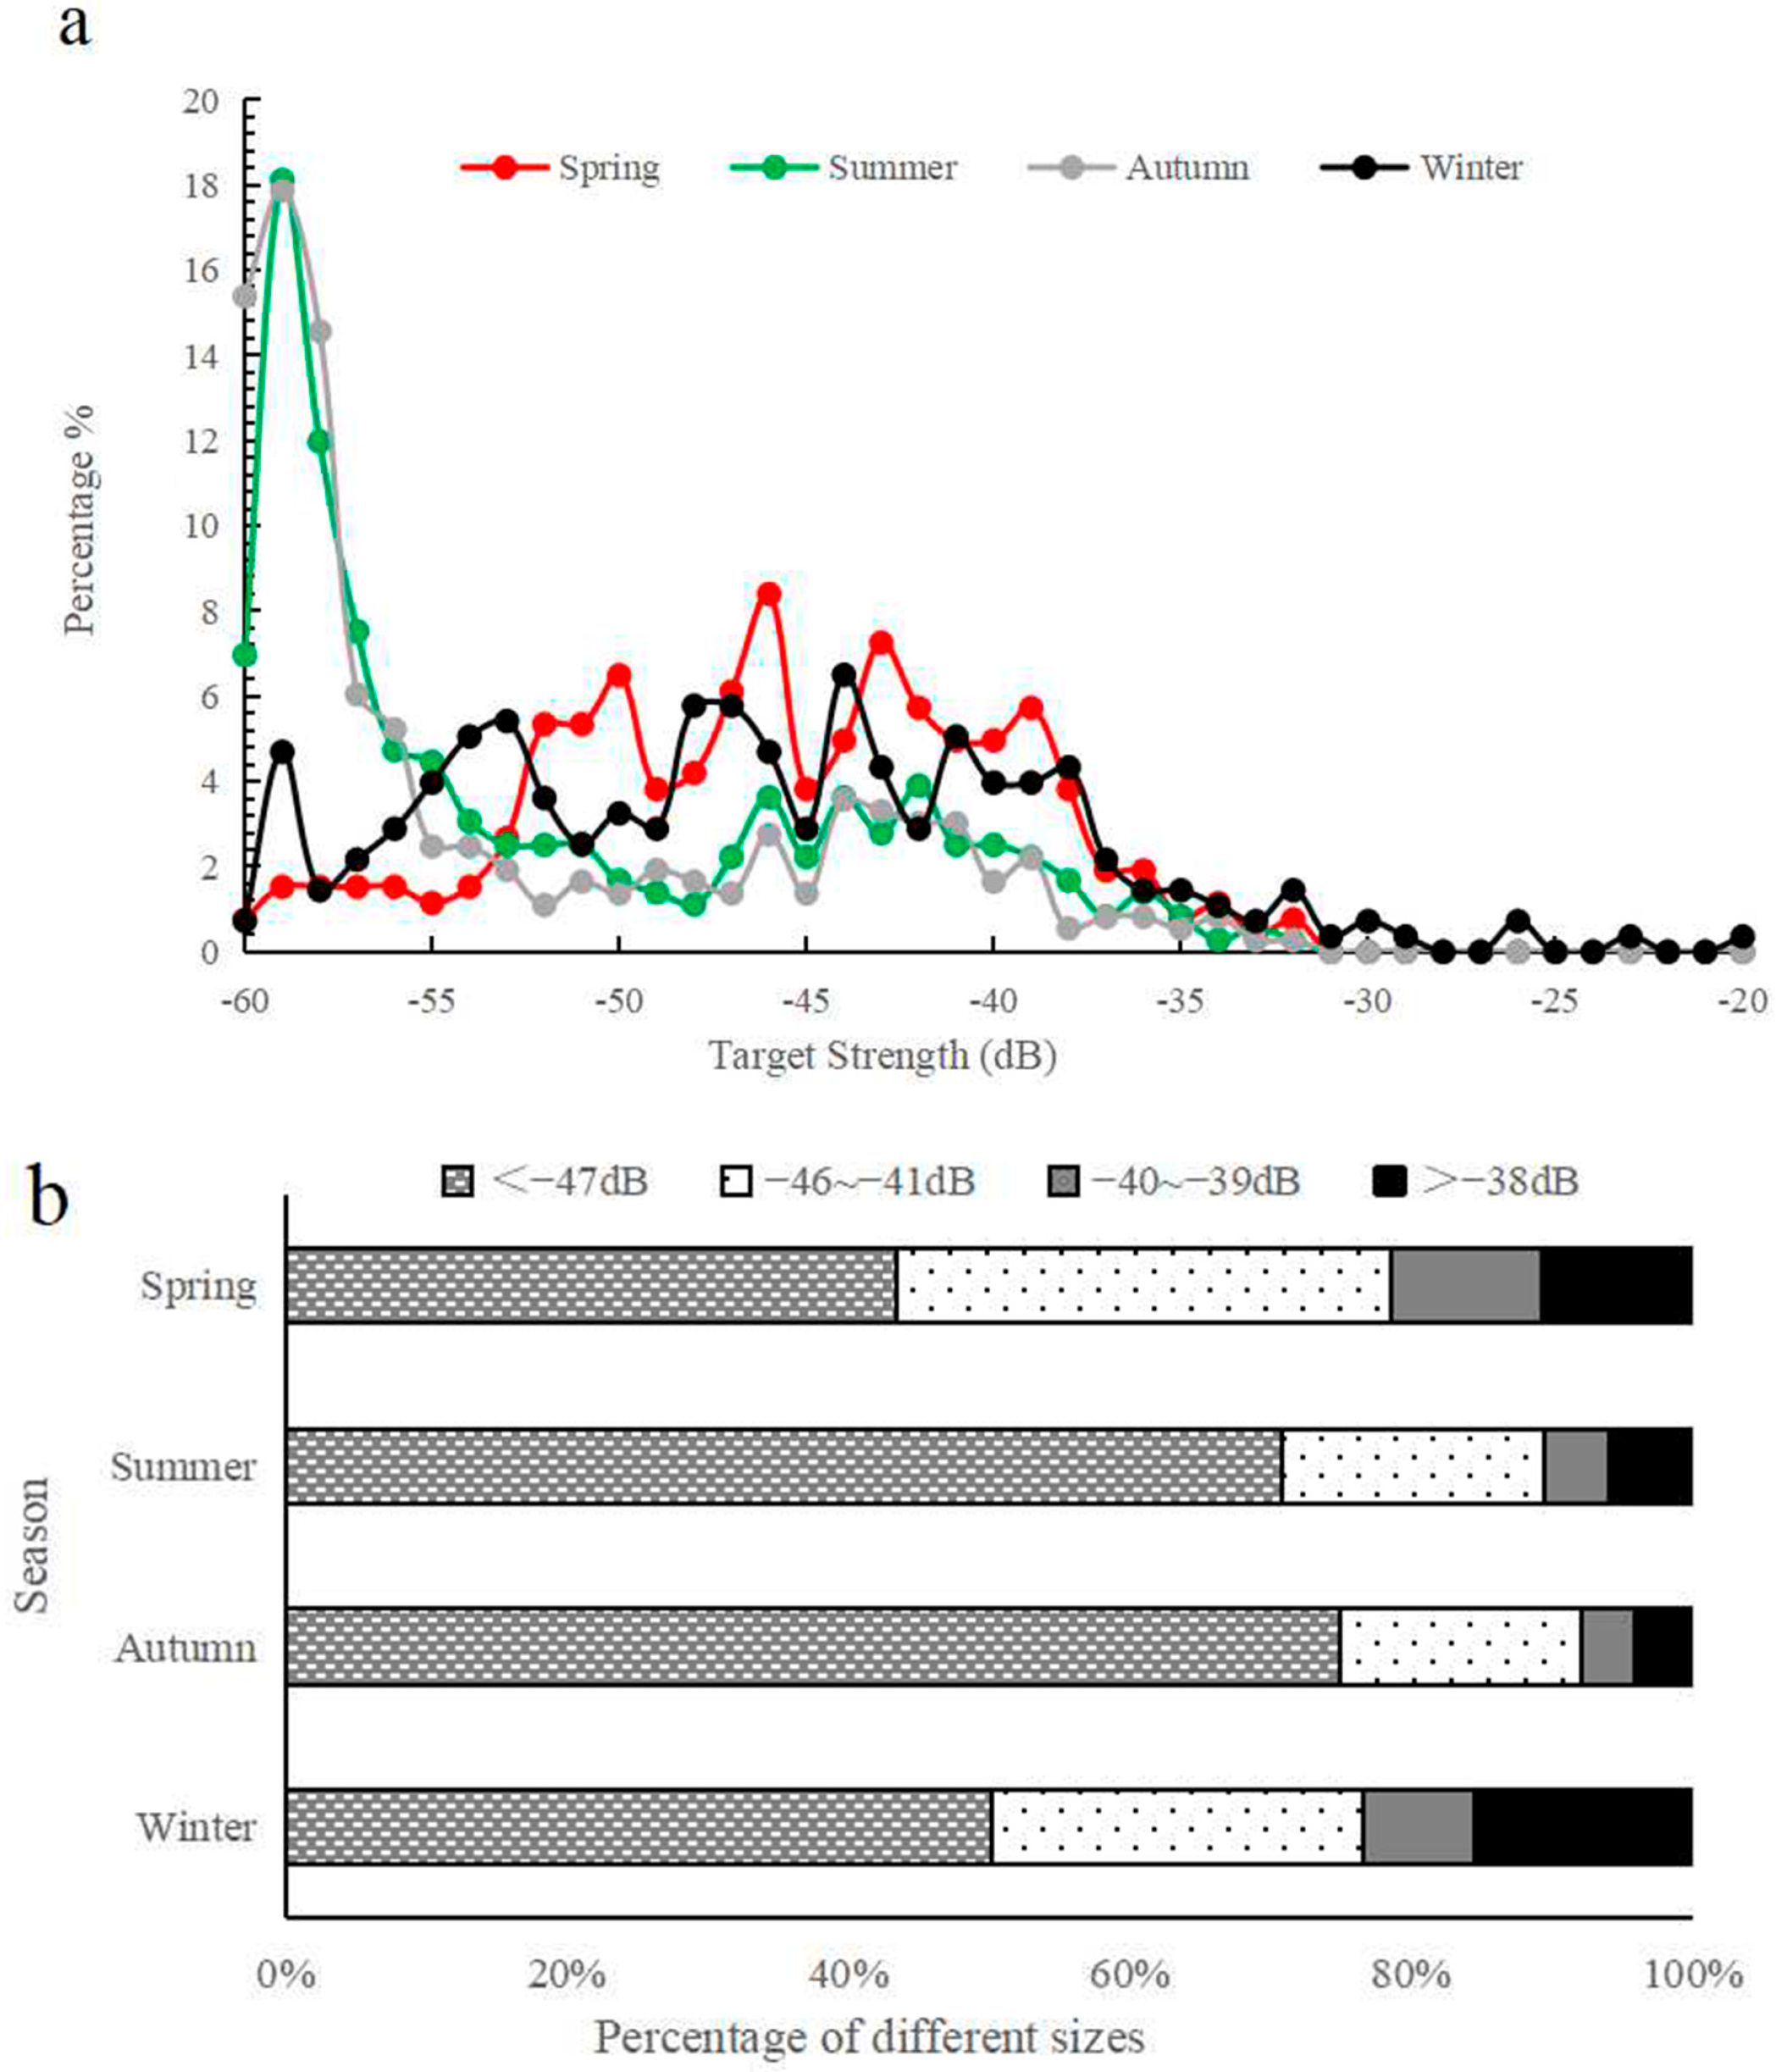
3.2. Comparison of Fish Size Distributions

The frequency distribution of the TS values from the hydroacoustic surveys represents the distribution of fish sizes. In this study, the results showed that the proportion of fish sizes below −47 dB accounted for 43.5% of all fish in spring, 70.8% in summer, 75.0% in autumn, and 50.2% in winter. In spring, fish sizes from −46 to −41 dB accounted for 35.1% of all fish, while in summer, autumn, and winter, this proportion decreased to 18.7%, 17.0%, and 26.4%, respectively. In spring, the proportion of −40 to −39 dB fish accounted for 10.7% of the total, while in summer, autumn, and winter, this proportion decreased to 4.7%, 3.9%, and 7.9%, respectively. In spring, the proportion of fish that were larger than −38 dB accounted for 10.7% of all fish, but this decreased to 5.9% in summer and 4.1% in autumn, while it increased to more than 15.5% in winter (Figure 4).
The mean TS values across different seasons in Duihekou Reservoir are represented in Table 3. Mean TS varied significantly between seasons (H = 253.191, p < 0.01). Our statistical analysis revealed significant seasonal variations, with summer (−44.66 dB) and autumn (−45.55 dB) exhibiting significantly lower TS values than spring (−41.05 dB) and winter (−38.12 dB) (p < 0.01). However, there were no significant differences in mean TS values between summer and autumn (p > 0.01) (Table 3).

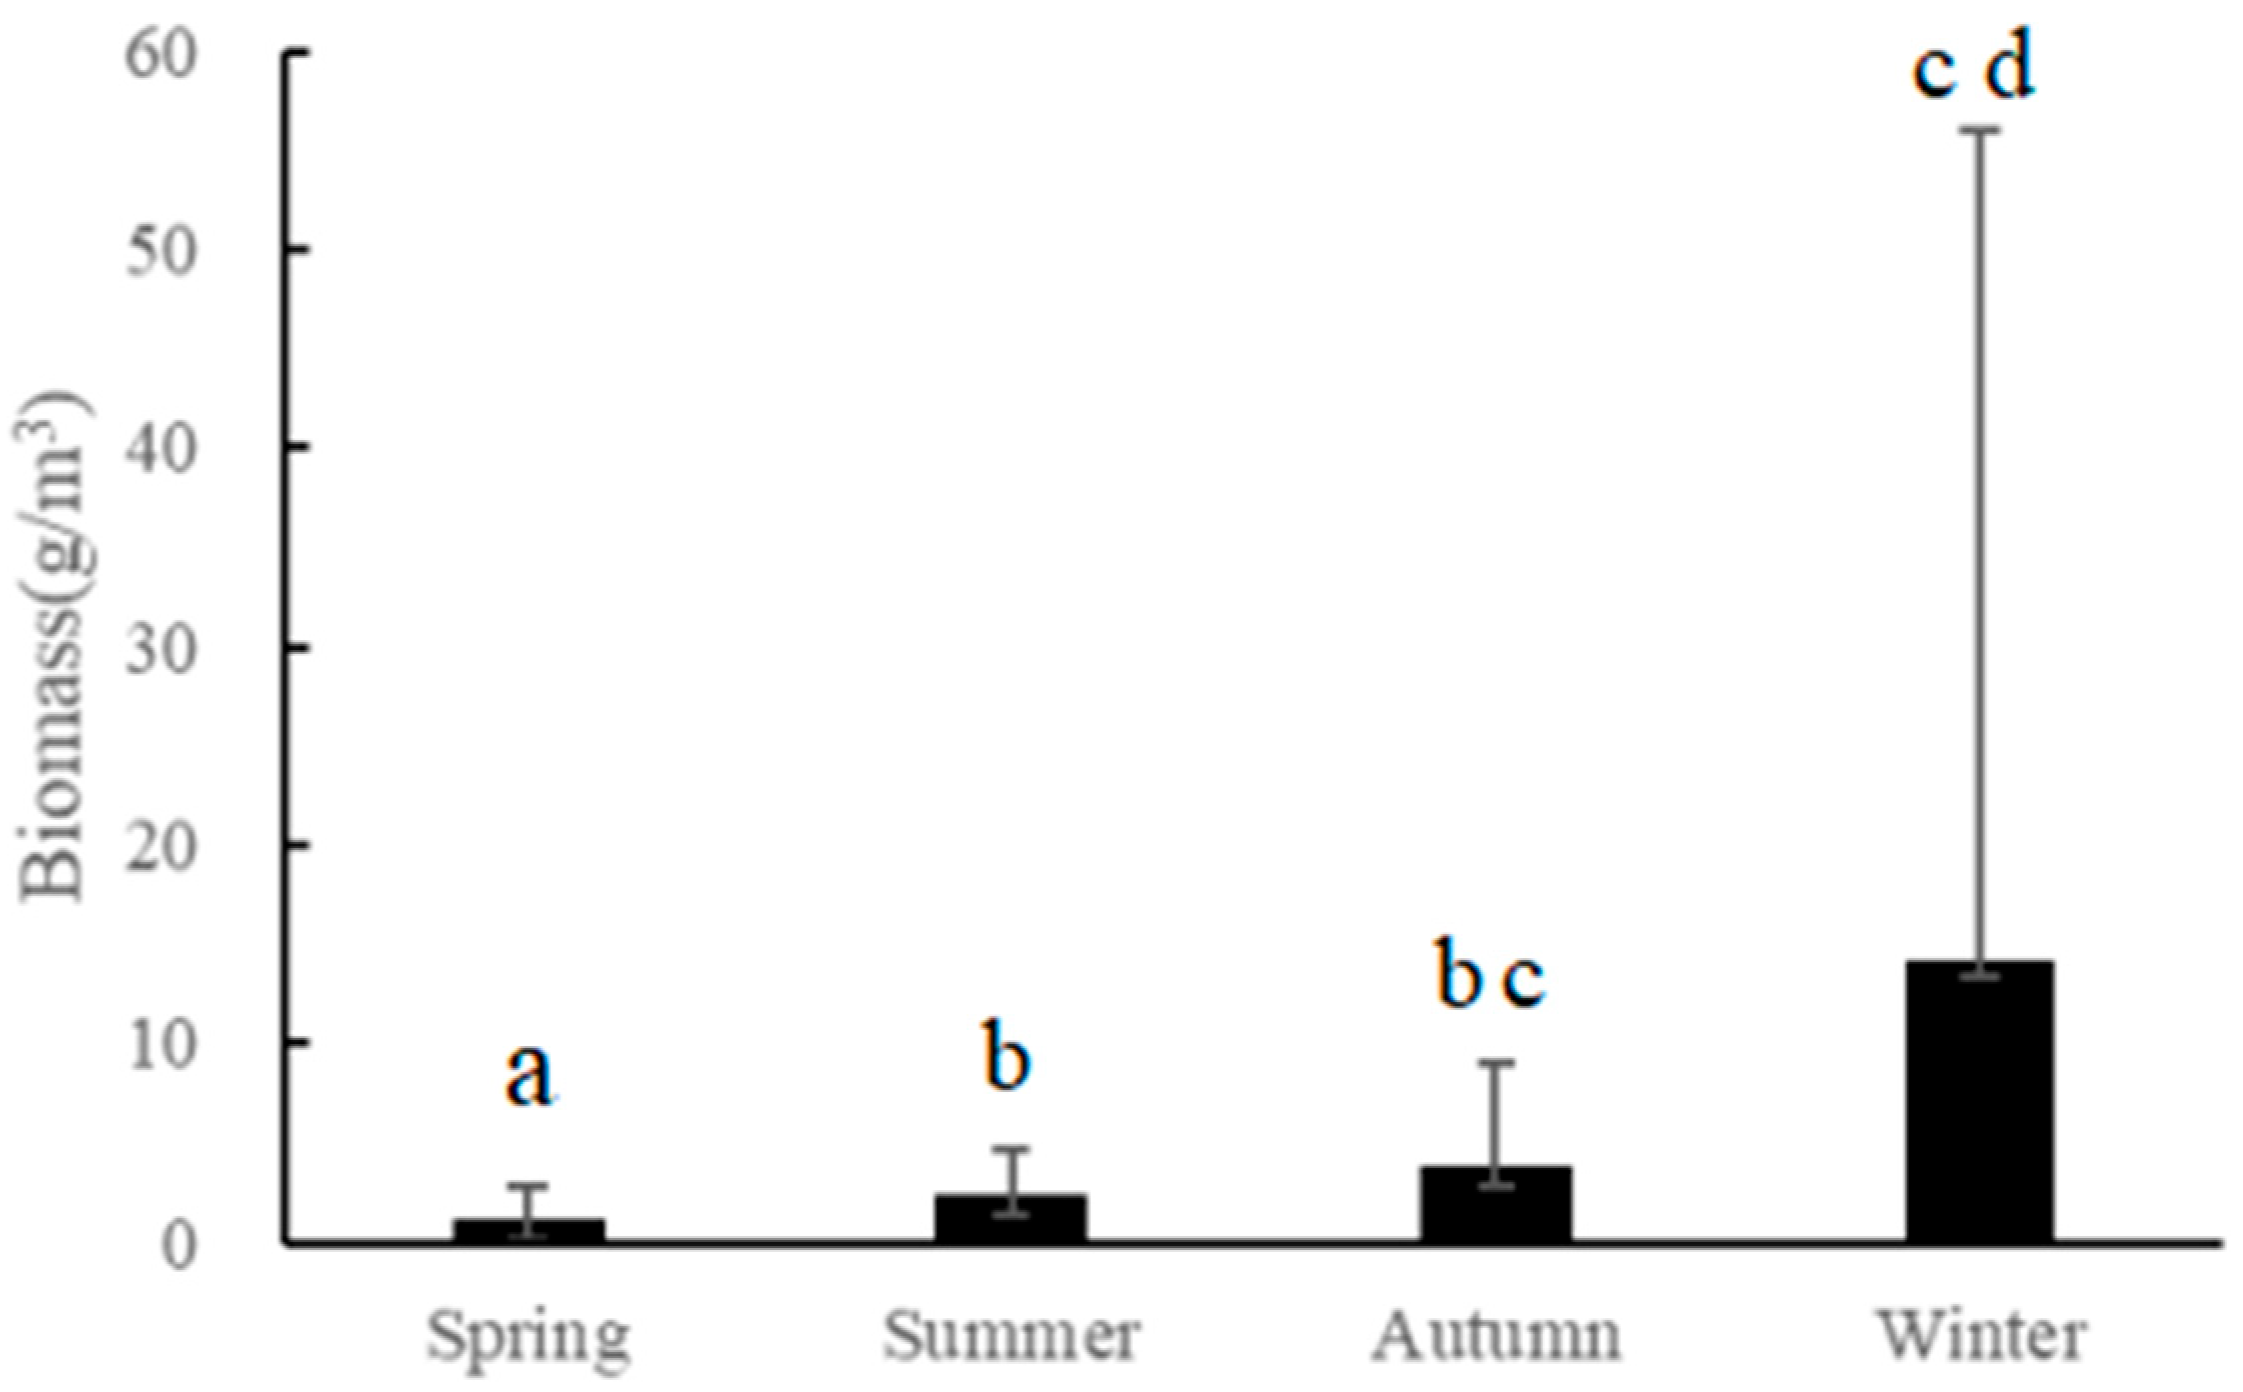
3.3. Acoustic Biomass

The seasonal variation in fish biomass in Duihekou Reservoir is depicted in Figure 5. Mean fish biomass varied significantly between seasons (H = 29.390, p < 0.01). The fish biomass in winter (14.3 g/m3) was 13.1 times that in spring (1.1 g/m3) (p < 0.01), 6.2 times that in summer (2.3 g/m3) (p < 0.05), and 3.8 times that in autumn (3.7 g/m3).

3.4. Catch Composition

A total of 46 individuals and 23.36 kg of fish, representing nine species, three orders, and four families were collected from Duihekou Reservoir (Table 4), and we found that silver and bighead carp were the dominant species. The silver carp catches were composed of two age groups, and among them, one-year-old fish accounted for 96.6%. The catches of big head carp were also composed of two age groups, one- and six-year-old fish, with the one-year-olds accounting for 83.3% (Table 5).

4. Discussion

4.1. Comparison of Fish Density

The hydroacoustic assessment revealed distinct seasonal and spatial variations in fish density within Duihekou Reservoir following intensive fry stocking. Our quantitative analysis demonstrated a characteristic seasonal pattern: spring exhibited the lowest density (3.33 ind./1000 m3), followed by winter (20.37 ind./1000 m3), with substantial increases being observed in autumn (56.22 ind./1000 m3) and summer (75.24 ind./1000 m3). This observed variability could be attributed to multiple interacting factors. Notably, the density peak in summer coincided with the July stocking of 14,800 kg of silver and bighead carp (mean individual weight: 100 g), suggesting direct biomass supplementation effects. Furthermore, the protracted spawning season from April to July [34], characteristic of reservoir cyprinid populations, likely contributed to subsequent recruitment-driven density increases. The apparent winter density reduction (relative to the summer and autumn levels) presents an intriguing ecological paradox, given the absence of substantial fishing pressure during this period. When the temperature decreased in winter, some fish could enter refuges close to the bottom, where they could not be detected by the echosounder [35]. In addition, silver and bighead carp may have migrated into deeper waters to form a school during winter when the water temperatures were cooler [36], leading to a hydroacoustic underestimation of their density.
Our spatial and temporal analyses further revealed a pronounced distributional heterogeneity, with summer exhibiting greater areal coverage of high-density zones (>0.05 ind./m2) compared with winter. Similar results were reported at the Three Gorges Reservoir [35] and Laohutan Reservoir [14]. Bartolini et al. [37] suggested that lower temperatures lead to more cohesive shoals with reduced fish activity. This means that the fish activity (e.g., feeding, breeding, swimming) is greater in summer and autumn than in winter, especially for silver and bighead carp. At the same time, the hotspots of fish density were evidently higher in the tributary and bay than in the mainstream [38,39], possibly because of environmental differences between the dam and upstream water areas of the reservoir. The flow velocities in upstream water are greater than in dam areas, and many fish breeding during late spring and summer need water flow to stimulate reproduction [40]. In addition, upstream water areas may also have higher dissolved oxygen and total nitrogen levels than reservoirs [41], and abundant food resources may attract fish, as has been reported for Rimov Reservoir [39] and Yuwanghe Reservoir [41].
Numerous studies [42,43] have estimated that a stocking density of filter-feeding carp exceeding 50 g m−3 would most effectively control rapid algal growth. We report the fish density in Duihekou Reservoir to be significantly lower than this. Therefore, it is imperative to continue monitoring these fishery resources in reservoirs, because these data could provide valuable insights into fish catch, stock management, and water quality maintenance. For instance, it can help determine the stock number of filter-feeding carp, as well as the biomass and size of the fish that are caught, all of which are crucial for ensuring water quality and effective reservoir management.

4.2. Comparison of Fish Sizes

In hydroacoustic analyses, the TS can be used to estimate both the length–frequency relationships of fish and the relative fish density [44]. Simmonds and MacLennan [18] suggested that the TS is an acoustic measure of fish length that can be converted from decibels into length measurements (cm) using empirical TS–length relationships [44]. Because the TS is influenced by species, which have different ratios of body size to bladder size [18] and different swimming behaviors (e.g., tilt angle) of the species or individual [45], empirical formulas for the TS–length relationships have been studied for specific groups or species, as well as multiple species [46]. We applied a multi-species equation to convert the TS to length. Although Frouzova’s equation may not be entirely accurate for all fishes, it does provide a consistent, relative basis from which to scale the acoustic TS to biological sizes in a surveyed fish community [35]. Using this equation, we report the fish length distributions, represented by their TS values, to differ markedly based on the season. The mean TS values in summer and autumn were lower than those in other seasons; that is, the proportion of small individual fish (<−47 dB) was higher, and it is suggested that this increase in the number and proportion of juvenile fish in the reservoir occurred following fish reproduction. The mean TS was greatest in winter, and the proportion of fish sizes >−38 dB also increased, indicating that the fish size and biomass in the reservoir had accumulated after one year’s growth. These results also reveal that the stocked silver and bighead carp in the reservoir played important roles in the increase in fish biomass.

4.3. Comparison of Acoustic Biomass

The present study demonstrates significant growth in fish biomass following one year of ecological restoration in the reservoir, with the winter biomass reaching 13 times the baseline spring level. These findings confirm the positive effect of stock enhancement measures on fishery resource recovery and indicate that the released fish have successfully established adaptive growth mechanisms. However, there are still certain limitations to estimating the biomass of fish based on hydroacoustic surveys. First, the currently applied Frouzova target strength–total length (TS–TL) regression model [30] assumes a random fish orientation, whereas field observations suggest non-random body axis alignment. More importantly, the lack of a dedicated TS–TL regression database for endemic freshwater fish species in China raises fundamental concerns regarding the model applicability [47]. Second, the spatial distribution patterns of fish during winter differ markedly from those in other seasons. Hydroacoustic surveys have revealed depth-stratified aggregation behavior, where fish form high-density clustered aggregations (aggregated clusters) in deeper zones under low-temperature conditions. This spatial heterogeneity challenges conventional acoustic assessment methods based on mean density extrapolation. Therefore, the development of a TS–TL characteristic database for China’s major commercial fish species should be accelerated and acoustic data correction algorithms integrating three-dimensional behavioral features should be designed. These improvements would substantially enhance the accuracy of freshwater fish stock assessments in inland waters.

4.4. Age Composition of Silver and Bighead Carp

Accurate aging is essential to understand the dynamics of fish populations and their responses to various management measures. The catch age composition has often been used to predict future available stocks [48]. We report silver carp to comprise 1- (96.6% of fish) and 2-year-old individuals and bighead carp to comprise 1- (83.3%) and 6-year-old individuals. We concluded that the silver and bighead carp in this reservoir are young and small, mainly because they do not reproduce naturally, and large numbers of fry were stocked in the reservoir in 2019 and 2020. Secondly, the low number of fish samples that we collected in nets may have affected our estimates of the population age composition. According to the fish surveys in 2021 and 2022, the age compositions of silver and bighead carp in this reservoir were similar to what we report. Additionally, the fact that fishery management was contracted out prior to 2020 and larger fish were removed annually for maximum economic benefit may explain why the population structure of silver and bighead carp includes young and small fish and that the fish biomass is low.
To optimize the ecological and economic benefits of silver and bighead carp in the reservoir, the following measures are proposed: Strategic Stocking: larger individuals should be introduced to establish a balanced population structure comprising small, medium, and large fish, facilitating a “rotational stocking and harvesting” management regime. Enhanced Monitoring: the long-term monitoring of growth rates and biomass dynamics should be strengthened to determine (1) optimal stocking densities, (2) size-selective harvest criteria, and (3) sustainable annual yields. Such data will provide critical support for implementing non-classical biomanipulation approaches in reservoir fishery management.

5. Conclusions

Through hydroacoustic monitoring of fish resources in Duihekou Reservoir after implementing non-classical biomanipulation (stocking silver and bighead carp), we observed that the density, average size, and biomass of the fish (one year post-stocking) increased significantly in winter compared with spring (the initial stocking period). The catch composition revealed that silver and bighead carp dominated the fish community, primarily comprising young individuals. These results indicate that fish that are introduced through large-scale stocking can effectively adapt to reservoir habitats to grow and play a critical role in reshaping the fishery population structure. This study provides essential data for optimizing biomanipulation strategies, guiding sustainable fishery management, and supporting aquatic ecosystem conservation.

Author Contributions

A.G. and J.Y. conceptualized and designed the work; A.G., Q.L. and P.S. collected the data; A.G. and A.Z. analyzed the data; A.G. and K.I. interpreted the data; A.G. drafted the article; A.G., J.Y. and K.I. substantially revised the article. All authors have read and agreed to the published version of the manuscript.

Funding

This study was financed by the Zhejiang Science and Technology Project (2022C02071).

Institutional Review Board Statement

The animal study protocol was approved by the Ethics Committee of the 2nd Experimental Animal Welfare and Ethics Committee of Zhejiang Provincial Freshwater Fisheries Research Institute Approval Code: Zhedanyan [2020] 3—Approval Date: 21 January 2020.

Data Availability Statement

All data, models, or codes generated or used during the study are available from the corresponding author by request.

Acknowledgments

We would like to thank the management staff at Duihekou Reservoir for their help during the field investigation.

Conflicts of Interest

The authors declare no conflicts of interest. The sponsors had no role in the design, execution, interpretation, or writing of the study.

References

  1. Bonilla, S.; Aguilera, A.; Aubriot, L.; Huszar, V.; Almanza, V.; Haakonsson, S.; Izaguirre, I.; Inés O’Farrell; Salazar, A.; Becker, V.; et al. Nutrients and not temperature are the key drivers for cyanobacterial biomass in the Americas. Harmful Algae 2023, 121, 102367. [Google Scholar] [CrossRef] [PubMed]
  2. Wang, Z.; Wang, Q.; Wang, J.; Wei, H.; Qian, J.; Zhang, Y.; Feng, K.; Chen, Q.; Yuan, J.; Liu, J.; et al. Evaluation of the control effect of bighead carp and silver carp on cyanobacterial blooms based on the analysis of differences in algal digestion processes. J. Clean. Prod. 2022, 375, 134106. [Google Scholar] [CrossRef]
  3. Yu, J.; Li, Y.; Liu, X.; Li, K.; Chen, F.; Gulati, R. The fate of cyanobacterial detritus in the food web of Lake Taihu: A mesocosm study using 13 C and 15 N labeling. Hydrobiologia 2013, 710, 39–46. [Google Scholar] [CrossRef]
  4. Xie, P.; Liu, J. Practical success of biomanipulation using filter-feeding fish to control cyanobacteria blooms: A synthesis of decades of research and application in a subtropical hypereutrophic lake. Sci. World. J. 2001, 1, 337–356. [Google Scholar] [CrossRef]
  5. Liu, J.; Xie, P. Unraveling the enigma of the disappearance of water bloom from the East lake (Lake Donghu) of Wuhan. Resour. Environ. Yangtze Basin. 1999, 8, 312–319. (In Chinese) [Google Scholar]
  6. Guo, L.G.; Wang, Q.; Xie, P.; Tao, M.; Zhang, J.; Niu, Y.; Ma, Z. A non-classical biomanipulation experiment in Gonghu Bay of Lake Taihu: Control of Microcystis blooms using silver and bighead carp. Aquac. Res. 2015, 46, 2211–2224. [Google Scholar] [CrossRef]
  7. Liu, Q.G.; Chen, Y.; Li, J.L.; Chen, L.Q. The food web structure and ecosystem properties of a filter-feeding carps dominated deep reservoir ecosystem. Ecol. Model. 2007, 203, 279–289. [Google Scholar] [CrossRef]
  8. Lin, Q.; Jiang, X.; Han, B.P.; Jeppesen, E. Does stocking of filter-feeding fish for production have a cascading effect on zooplankton and ecological state? A study of fourteen (sub) tropical Chinese reservoirs with contrasting nutrient concentrations. Hydrobiologia 2014, 736, 115–125. [Google Scholar] [CrossRef]
  9. Mao, Z.; Gu, X.; Cao, Y.; Zhang, M.; Zeng, Q.; Chen, H.; Shen, R.; Jeppesen, E. The role of top-down and bottom-up control for phytoplankton in a subtropical shallow eutrophic lake: Evidence based on long-term monitoring and modeling. Ecosystems 2020, 23, 1449–1463. [Google Scholar] [CrossRef]
  10. Yin, C.; He, W.; Guo, L.; Gong, L.; Yang, Y.; Yang, J.; Ni, L.; Chen, Y.; Jeppesen, E. Can top-down effects of planktivorous fish removal be used to mitigate cyanobacterial blooms in large subtropical highland lakes? Water Res. 2022, 218, 118483. [Google Scholar] [CrossRef]
  11. Koslow, J.A. The role of acoustics in ecosystem-based fishery management. ICES J. Mar. Sci. 2009, 66, 966–973. [Google Scholar] [CrossRef]
  12. Burwen, D.L.; Fleischman, S.J. Evaluation of side-aspect target strength and pulse width as potential hydroacoustic discriminators of fish species in rivers. Can. J. Fish. Aquat. Sci. 1998, 55, 2492–2502. [Google Scholar] [CrossRef]
  13. Lilja, J.; Keskinen, T.; Marjomäki, T.J.; Valkeajärvi, P.; Karjalainen, J. Upstream migration activity of cyprinids and percids in a channel, monitored by a horizontal split-beam echosounder. Aquat. Living. Resour. 2003, 16, 185–190. [Google Scholar] [CrossRef]
  14. Guo, A.; Yuan, J.; Chu, T.; Lian, Q. Hydroacoustic assessment of fish resources in three reservoirs: The effects of different management strategies on fish density, biomass and size. Fish. Res. 2019, 215, 90–96. [Google Scholar] [CrossRef]
  15. Rudstam, L.G.; Hansson, S.; Lindem, T.; Einhouse, D.W. Comparison of target strength distributions and fish densities obtained with split and single beam echo sounders. Fish. Res. 1999, 42, 207–214. [Google Scholar] [CrossRef]
  16. Lima, I.D.; Csatello, J.P. Distribution and abundance of South-west Atlantic anchovy spawners (Engraulis anchoita) in relation to oceanographic processes in the southern Brazilian shelf. Fish. Oceanogr. 1995, 4, 1–16. [Google Scholar] [CrossRef]
  17. Argent, D.G.; Kimmel, W.G. Efficiency and selectivity of gill nets for assessing fish community composition of large rivers. N. Am. J. Fish. Manag. 2005, 25, 1315–1320. [Google Scholar] [CrossRef]
  18. Simmonds, J.E.; Maclennan, D.N. Fisheries Acoustics: Theory and Practice, 2nd ed.; John Wiley & Sons: Hoboken, NJ, USA, 2005. [Google Scholar]
  19. Egerton, J.P.; Johnson, A.F.; Turner, J.; LeVay, L.; Mascareñas-Osorio, I.; Aburto-Oropeza, O. Hydroacoustics as a tool to examine the effects of Marine Protected Areas and habitat type on marine fish communities. Sci. Rep. 2018, 8, 47. [Google Scholar] [CrossRef]
  20. Wheeland, L.J.; Rose, G.A.; Shuter, B. Acoustic measures of lake community size spectra. Can. J. Fish. Aquat. Sci. 2016, 73, 557–564. [Google Scholar] [CrossRef]
  21. Godlewska, M.; Swierzowski, A. Hydroacoustical parameters of fish in reservoirs with contrasting levels of eutrophication. Aquat. Living. Resour. 2003, 16, 167–173. [Google Scholar] [CrossRef]
  22. Ona, E.; Mitson, R.B. Acoustic sampling and signal processing near the seabed: The deadzone revisited. ICES J. Mar. Sci. 1996, 4, 677–690. [Google Scholar] [CrossRef]
  23. Djemali, I.; Guillard, J.; Yule, D.L. Seasonal and diel effects on acoustic fish biomass estimates: Application to a shallow reservoir with untargeted common carp (Cyprinus carpio). Mar. Freshwater. Res. 2016, 68, 528–537. [Google Scholar] [CrossRef]
  24. Foote, K.G.; Knudsen, H.P.; Vestnes, G.; Maclennan, D.N.; Simmonds, E.J.N. Calibration of Acoustic Instruments for Fish Density Estimation: A Practical Guide. J. Acoust. Soc. Am. 1988, 83, 831–832. [Google Scholar]
  25. Aglen, A.J. Random errors of acoustic fish abundance estimates in relation to the survey grid density applied. Fao Fish. Rep. 1983, 300, 293–298. [Google Scholar]
  26. Godlewska, M.G.; Dlugoszewski, B.A.; Doroszczyk, L.; Jóźwik, A. The relationship between sampling intensity and sampling error—Empirical results from acoustic surveys in Polish vendace lakes. Fish. Res. 2009, 96, 17–22. [Google Scholar] [CrossRef]
  27. Higginbottom, I.; Woon, S.; Schneider, P. Hydroacoustic Data Processing for Standard Stock Assessment Using Echoview: Technical Manual; Myriax Software Pty Ltd. Publication: Hobart, Australia, 2008; p. 7085. [Google Scholar]
  28. Zhou, L.; Zeng, L.; Fu, D.; Xu, P.; Zeng, S.; Tang, Q.; Chen, Q.; Chen, L.; Li, G. Fish density increases from the upper to lower parts of the Pearl River Delta, China, and is influenced by tide, chlorophyll-a, water transparency, and water depth. Aquat. Ecol. 2016, 50, 59–74. [Google Scholar] [CrossRef]
  29. Mann, R.H.K. Observations on the age, growth, reproduction and food of the dace, Leuciscus leuciscus (L.), in two rivers in southern England. J. Fish. Biol. 1973, 5, 707–736. [Google Scholar] [CrossRef]
  30. Frouzova, J.; Kubecka, J.; Balk, H.; Frouz, J. Target strength of some European fish species and its dependence on fish body parameters. Fish. Res. 2005, 75, 86–96. [Google Scholar] [CrossRef]
  31. Ye, S.; Li, Z.; Feng, G.; Cao, W. Length-Weight Relationships for Thirty Fish Species in Lake Niushan, a Shallow Macrophytic Yangtze Lake in China. Asian. Fish. Sci. 2007, 20, 217–226. [Google Scholar]
  32. Zhang, H.; Wang, C.Y.; Du, H.; Wu, J.M.; Shen, L.; Wei, Q.W. Integrating Hydroacoustic and Optical Video Technologies to Identify the Riverbed Substrate at the Spawning Reach of Chinese Sturgeon. Adv. Mater. Res. 2014, 955–959, 1235–1240. [Google Scholar] [CrossRef]
  33. Pinkas, L.; Oliphant, M.S.; Iverson, I.L.K. Fish bulletion 152. Food habits of albacore, bluefin tuna, and bonito in California waters. Calif. Fish. Game 1971, 152, 1–105. [Google Scholar]
  34. Wang, Y.; Rhoads, B.L.; Wang, D. Assessment of the flow regime alterations in the middle reach of the Yangtze River associated with dam construction: Potential ecological implications. Hydrol. Process. 2016, 30, 3949–3966. [Google Scholar] [CrossRef]
  35. Lian, Y.; Ye, S.; Godlewska, M.; Huang, G.; Wang, J.; Chen, S.; Zhao, X.; Du, X.; Liu, J.; Li, Z. Diurnal, seasonal and inter-annual variability of fish density and distribution in the Three Gorges Reservoir (China) assessed with hydroacoustics. Limnol.—Ecol. Manag. Inland Waters 2017, 63, 97–106. [Google Scholar] [CrossRef]
  36. Hessler, T.M.; Chapman, D.C.; Paukert, C.P.; Jolley, J.C.; Byrne, M.E. Winter habitat selection and efficacy of telemetry to aid grass carp removal efforts in a large reservoir. N. Am. J. Fish. Manag. 2023, 43, 189–202. [Google Scholar] [CrossRef]
  37. Bartolini, T.; Butail, S.; Porfiri, M. Temperature influences sociality and activity of freshwater fish. Environ. Biol. Fish. 2015, 98, 825–832. [Google Scholar] [CrossRef]
  38. Fernando, C.H.; Holík, J. Fish in Reservoirs. Int. Rev. Der Gesamten Hydrobiol. Hydrogr. 1991, 76, 149–167. [Google Scholar] [CrossRef]
  39. Prchalová, M.; Kubečka, J.; Čech, M.; Frouzová, J.; Draštík, V.; Hohausová, E.; Jůza, T.; Kratochvíl, M.; Matěna, J.; Peterka, J.; et al. The effect of depth, distance from dam and habitat on spatial distribution of fish in an artificial reservoir. Ecol. Freshw. Fish. 2009, 18, 247–260. [Google Scholar] [CrossRef]
  40. Jonsson, N. Influence of water flow, water temperature and light on fish migration in rivers. Nordic. J. Freshw. Res. 1991, 66, 20–35. [Google Scholar]
  41. Luo, B.; Zhou, X.; Zhang, C.; Bao, J.; Mei, F.; Lian, Y.; Zhang, D.; Hu, S.; Guo, L.; Duan, M. Hydroacoustic survey on fish spatial distribution in the early impoundment stage of Yuwanghe Reservoir in southwest China. Front. Mar. Sci. 2023, 10, 1119411. [Google Scholar] [CrossRef]
  42. Yi, C.L.; Guo, L.; Ni, L.; Luo, C. Silver carp exhibited an enhanced ability of biomanipulation to control cyanobacteria bloom compared to bighead carp in hypereutrophic Lake Taihu mesocosms. Eco. Eng. 2016, 89, 7–13. [Google Scholar] [CrossRef]
  43. Zhang, X.; Xie, P.; Huang, X. A review of nontraditional biomanipulation. Sci. World J. 2008, 8, 1184–1196. [Google Scholar] [CrossRef] [PubMed]
  44. Boswell, K.M.; Wilson, M.P.; Wilson, C.A. Hydroacoustics as a tool for assessing fish biomass and size distribution associated with discrete shallow water estuarine habitats in Louisiana. Estuar. Coast. 2007, 30, 607–617. [Google Scholar] [CrossRef]
  45. Rasmus, N.J.; Bo, L. Hydroacoustic ex situ target strength measurements on juvenile cod (Gadus morhua L.). ICES J. Mar. Sci. 1999, 56, 627–639. [Google Scholar]
  46. Kracker, L. Hydroacoustic Surveys: A Non-Destructive Approach to Monitoring Fish Distributions at National Marine Sanctuaries; Noaa Technical Memorandum Nos Nccos; National Ocean Service of the National Oceanic and Atmospheric Administration (NOAA): Washington, DC, USA, 2007. [Google Scholar]
  47. Lian, Y.; Huang, G.; Godlewska, M.; Cai, X.; Li, C.; Ye, S.; Liu, J.; Li, Z. Hydroacoustic estimates of fish biomass and spatial distributions in shallow lakes. J. Ocean. Limnol. 2018, 36, 587–597. [Google Scholar] [CrossRef]
  48. Punt, A.E.; Smith, D.C. Assessments of species in the Australian South East Fishery can be sensitive to the method used to convert from size-to age-composition data. Mar. Freshwater. Res. 2001, 52, 683–690. [Google Scholar] [CrossRef]
Figure 2. Echograms showing the echoes from targets between the surface and bottom of the detected area. The red lines are echoes from the reservoir bottom. The letters (ad) represent spring, summer, autumn, and winter, respectively.
Fishes 10 00274 g002
Figure 3. Spatial distribution of fish density during different seasons in Duihekou Reservoir. This figure was created using ArcGIS software version 10.7 (http://www.esri.com (accessed on 13 March 2024)).
Fishes 10 00274 g003
Figure 4. Seasonal variation in the proportional composition of the frequency distribution of fish target strengths (TSs) in Duihekou Reservoir. (a): TS distribution with 1 dB interval; (b): categorical TS distribution, grouped into four size classes: small (<−47 dB), medium–small (−46 to −41 dB), medium–large (−40 to −39 dB), and large (≥−38 dB) fish. According to the Frouzova (2005) [30] relationship, the fish body length corresponding to −38 dB is 50 cm; in the actual fishery production process, 50 cm fish are considered to be large in size and can be considered for fishing; −47 dB corresponds to 18 cm, and fish of this size are considered to be small in size; −46–41 dB corresponds to 20–35 cm, while 40–39 dB corresponds to 39–44 cm, and fish of this size are considered to be of a medium size.
Fishes 10 00274 g004
Figure 5. Seasonal variation in fish mean biomass in Duihekou Reservoir. Different superscript letters indicate significant differences between seasons (p < 0.05).
Fishes 10 00274 g005
Table 1. Fish released and caught in Duihekou Reservoir in 2017–2020.
YearReleased SpeciesRelease Size (g/ind.)Release Weight (×104 kg)Released Number (×104 ind.)Fish Catch (×104 kg)
2017Bighead carp500–15001.752.34
Bighead carp250–3000.993.7
Silver carp250–3000.592.2
2018Bighead carp500–10001.762.34
Silver carp500–10000.761.0
2019Bighead carp500–10001.962.69
Bighead carp150–2500.562.8
Silver carp500–7501.843.1
Silver carp150–2500.4052.0
2017–2019Total -10.6152217
2020Silver carp250–5006.1516.380
Bighead carp250–5001.223.25
Silver carp1002.4424.4
Total-9.8144.03
Table 2. Fish densities during different seasons in Duihekou Reservoir.
SeasonFish Density (ind./1000 m3)
Mean (Mean ± S.E.)MinMax
Spring3.33 ± 4.46 a027.2
Summer75.24 ± 72.45 b6285.4
Autumn56.22 ± 63.26 bc7264.3
Winter20.37 ± 68.42 c0331.4
Note: Different superscript letters indicate significant differences between seasons (p < 0.01).
Table 3. Seasonal variation in the mean TS of fish in Duihekou Reservoir. Significant differences between the different seasons are indicated using different superscript letters (p < 0.01). N represents the recorded target strengths in the survey.
Survey SeasonTarget Strength (dB)
MinimumMaximumMeanN
Spring−59.92−29.92−41.05 a262
Summer−59.93−31.04−44.66 b359
Autumn−59.98−29.58−45.55 b607
Winter−59.66−20.19−38.12 c277
Table 4. Composition and dominant species of fish communities in Duihekou Reservoir.
OrderFamilySpeciesNumber of SamplesIRI
CypriniformesCyprinidaeHypophthalmichthys molitrix2910,396
Aristichthys nobilis66219
Xenocypris davidi2487
Culter dabryi dabryi1145
Megalobrama amblycephala2292
Acheilognathus macropterus1113
SiluriformesEleotridaeOdontobutis potamophilus1119
SerranidaeSiniperca chuatsi2318
DecapodaPalaemonidaeMacrobrachium nipponense2218
Table 5. Age, mean body length, and mass of silver and bighead carp in Duihekou Reservoir.
AgeNumberMean Body Length/cmMean Body Mass/g
Silver carp12825.89 ± 2.41306.74 ± 80.18
2141.50974.20
Bighead carp1522.10 ± 2.74204.26 ± 89.10
6169.0010,400.00
Disclaimer/Publisher’s Note: The statements, opinions and data contained in all publications are solely those of the individual author(s) and contributor(s) and not of MDPI and/or the editor(s). MDPI and/or the editor(s) disclaim responsibility for any injury to people or property resulting from any ideas, methods, instructions or products referred to in the content.

